Article

Effects of Different Operation Years of Photovoltaic Power Stations on Vegetation and Soil Characteristics in Temperate Deserts

1
Key Laboratory of Grassland Ecosystem, Ministry of Education, Lanzhou 730070, China
2
College of Pratacultural Science, Gansu Agricultural University, Lanzhou 730070, China
3
Huadian Gansu Energy Corporation Limited, Lanzhou 730000, China
4
Powerchina Beijing Engineering Corporation Limited, Beijing 100024, China
5
State Key Laboratory of Arid Region Ecological Security and Sustainable Development, Northwest Institute of Eco-Environment and Resources, Chinese Academy of Sciences, Lanzhou 730070, China
*
Author to whom correspondence should be addressed.
Agriculture 2025, 15(19), 2097; https://doi.org/10.3390/agriculture15192097 (registering DOI)
Submission received: 26 August 2025 / Revised: 5 October 2025 / Accepted: 7 October 2025 / Published: 9 October 2025
(This article belongs to the Section Agricultural Systems and Management)

Abstract

The rapid expansion of photovoltaic installations in arid and semi-arid regions has altered regional water–heat regimes, triggering complex responses in vegetation recovery and soil processes. However, systematic assessments of ecological restoration under varying operational durations and microenvironmental interactions remain insufficient. Therefore, this study examines photovoltaic power stations operating for 1, 7, and 13 years within China’s temperate desert regions, alongside undeveloped control areas, to compare differences across four microenvironments: the front eave of photovoltaic panels (FP), underneath photovoltaic panels (UP), back eave of photovoltaic panels (BP), and interval between photovoltaic panels (IP). Combining analysis of variance, correlation analysis, variance partitioning analysis (VPA), and generalised additive models (GAMs), the study evaluates the coupling mechanisms between vegetation and soil. The results indicate that operational duration significantly enhances vegetation cover, biomass, and species diversity, with the 13 year operational zone demonstrating optimal restoration outcomes. Microenvironmental variations were pronounced, with vegetation and soil quality in the front eave zone surpassing other areas, while the inter-panel zone exhibited the weakest recovery. Key soil factors shifted with recovery stages: early-stage vegetation showed heightened sensitivity to soil water content (SWC), whereas later stages relied more heavily on soil organic matter (SOM) and nutrient supply. Variation Partial Analysis (VPA) revealed that soil factors in the 13 year operational zone accounted for 71.9% of the variation in vegetation cover. The operational lifespan of photovoltaic power stations, microenvironmental variations, and key soil factors collectively drive the restoration of thermophilic desert vegetation. This research reveals phased regulatory mechanisms during the restoration process, providing scientific grounds for optimising photovoltaic layouts and enhancing desert ecosystem stability.

1. Introduction

Desert ecosystems cover approximately one-third of the Earth’s land surface, representing a quintessential ecologically fragile zone characterised by water scarcity, sparse vegetation, and infertile soils [1,2]. Within such ecosystems, vegetation and soil exhibit a high degree of coupling. Soil water content (SWC) and nutrients determine plant establishment and succession, while vegetation exerts a positive feedback effect by improving soil structure and material cycling [3,4,5]. However, these systems are highly sensitive to external disturbances. Once disrupted, recovery processes are slow and depend on long-term collaborative restoration between vegetation and soil [6].
With the expansion of renewable energy, large-scale ground-mounted photovoltaic power stations have been rapidly deployed across arid and semi-arid regions, particularly in China’s northwestern desert areas, where their ecological impacts have drawn considerable attention [7,8]. Initial construction disturbances often severely damage vegetation and soil [9,10]. However, existing research indicates that operational photovoltaic facilities may also promote local ecological recovery, with operational duration considered a key factor regulating this process [11,12,13,14,15]. Concurrently, the shading and radiative differences created by photovoltaic panel arrays generate significant microenvironmental heterogeneity. Areas beneath panels exhibit increased humidity and improved vegetation recovery, whereas inter-panel zones experience delayed recovery due to heightened solar radiation and wind erosion [16,17,18]. These findings indicate that photovoltaic power stations may offer restoration potential while simultaneously introducing complex spatial variations.
Despite the increasing volume of relevant research, two shortcomings persist: firstly, most studies treat operational duration as a singular temporal variable, overlooking how microenvironmental variations within power stations—such as the front eave of photo-voltaic panels (FP; the area where photovoltaic panels face the sun); back eave of photovoltaic panels (BP; the shaded area on the later side of photovoltaic panels); underneath photovoltaic panels (UP; the area beneath the photovoltaic panels); and interval between photovoltaic panels (IP; the gap between adjacent photovoltaic panels)—modulate recovery trends [19]. Secondly, much research has centred on ‘static observations’ at a single time point, lacking insight into the dynamic mechanisms of interaction between operational duration and microenvironments [20]. Consequently, how operational duration and microenvironments jointly drive the recovery pathways of vegetation–soil systems remains a critical scientific question requiring urgent resolution. Consequently, this study examines photovoltaic power stations and control areas in China’s temperate desert region, operating for 1, 7, and 13 years, respectively. By establishing four typical microenvironmental units, it systematically assesses the dual impacts of operational duration and microenvironment on vegetation and soil, identifies key drivers, and reveals the phased mechanisms governing vegetation–soil relationships during recovery. The findings will provide scientific basis for understanding the long-term ecological effects of photovoltaic facilities and informing land-use planning in arid regions.

2. Materials and Methods

2.1. Overview of Study Area

The study area is located in the Hongshagang region of Minqin County, Wuwei City, Gansu Province (Figure 1). Situated at the junction of the Tengger Desert and the Badain Jaran Desert (101°49′41″ E, 38°03′45″ N), it is a typical temperate desert ecosystem. The terrain of the region is connected, with a mixture of desert and desert-like areas. The surface vegetation is sparse, with an average area of approximately 1300 m. The region has a typical temperate continental arid climate. The average annual temperature is 1–14 °C, with extreme highs and lows of 37 °C and −23 °C, respectively. The annual average precipitation is 113.2 mm, with the rainy season (June to August) accounting for 75% of the annual precipitation. The frost-free period is 152 days. The average annual sunshine hours in the region exceed 3000 h. The region is rich in solar energy resources, and the photovoltaic power generation industry enjoys significant advantages. The soil types are mainly sandy loam and grey-brown desert soil, and the vegetation types are mainly sandy arid desert plants. Representative plant communities include Zygophyllum mucronatum, Puccinellia distans, Kalidium foliatum, Salsola collina, Tribulus terrestris, Nitraria tangutorum, Tamarix ramosissima, Echinops gmelinii Turcz, Allium mongolicum, among others [21]. The ground cover conditions in different power station areas are shown in Figure 2.

2.2. Site Selection and Experimental Design

2.2.1. Site Selection

Three photovoltaic power stations with different operating years were selected (Table 1), which are located in the same ecological region and have basically the same vegetation type, soil texture, and terrain slope. These include Wuwei Tianhe Power Station (in operation for 13 years), Yineng Power Station (in operation for 7 years), and Longyu Power Station (in operation for 1 year). It should be noted that although the plots were all situated within the same ecological region and maintained consistency in vegetation type and soil texture, individual regions may still be influenced by historical land-use patterns and inherent soil heterogeneity. This may to some extent affect the comparability of the results between plots.
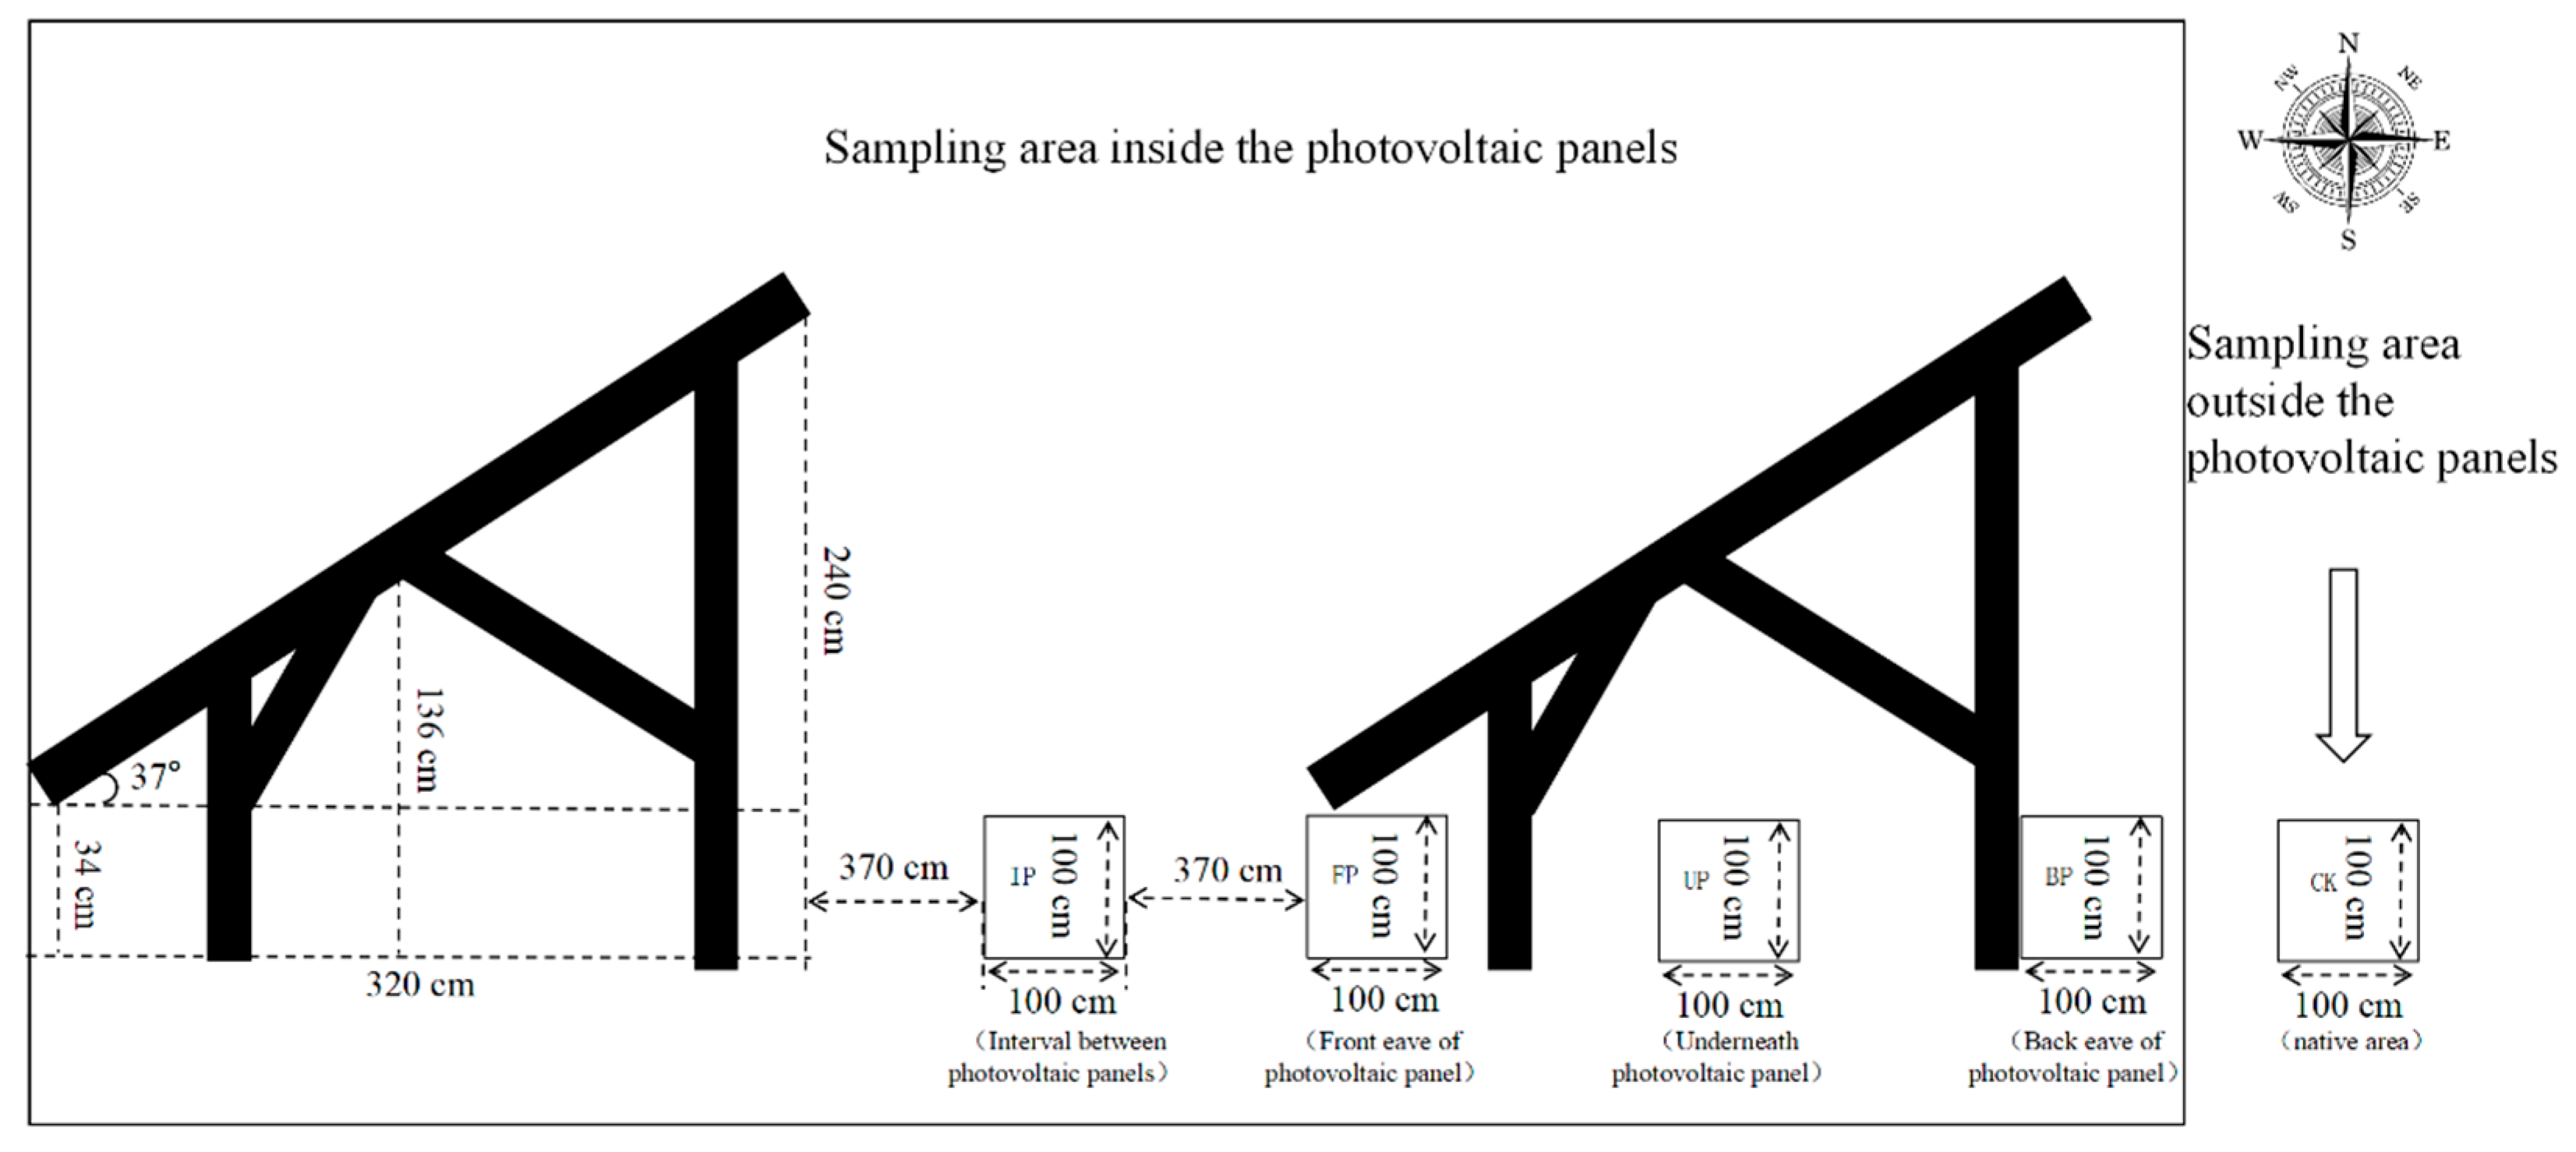
The photovoltaic array in the power station consists of monocrystalline silicon solar panels with an optimal tilt angle of 37°. The solar panels face south and run east–west. The distance between two adjacent rows of photovoltaic arrays is 850 cm. The vertical height of the upper edge of the panel is 240 cm, the vertical height of the middle edge of the panel is 136 cm, and the vertical height of the lower edge is 34 cm. The vertical distance from the lower edge to the upper edge of the panels is 320 cm. Each panel consists of 2 rows and 32 columns of basic photovoltaic panels measuring 90 cm × 195 cm, with overall dimensions of 400 cm × 2900 cm.

2.2.2. Experimental Design

To compare the effects of the microenvironment of photovoltaic power stations with different operating years on the physical and chemical properties of soil, four microenvironments were selected for sampling: interval between photovoltaic panels (IP), front eave of photovoltaic panels (FP), underneath photovoltaic panels (UP), and back eaves of photovoltaic panels (BP). The adjacent undisturbed natural area was used as the native control (CK) area (Figure 3).
In each power station sampling area, based on the photovoltaic panel array structure and microenvironment characteristics, each power station area was divided into several equidistant sub-areas along the reference centre line and its surrounding area. A random number generator was used to randomly arrange one 1 m × 1 m sample square in each sub-area, for a total of five sample squares. This ensured that the sample squares were evenly distributed in space and appropriately spaced, avoiding overlap or excessive concentration of sample squares and ensuring the randomness and spatial independence of the sample squares. Each location is sampled five times, resulting in a total of 65 sampling points across the three power plants.

2.2.3. Sample Collection and Measurement

Sampling was conducted during the peak vegetation growth period in July 2024. Vegetation surveys were carried out in pre-established 1 m × 1 m plots [22], recording the names, height, density, cover, frequency, and aboveground biomass of shrubs and herbaceous plants in each plot. Height is natural height (average of 20 plants). Density is calculated using the count method. Total cover and species-specific cover are measured using the needle prick method. Frequency is measured using the sample circle method (average of 30 times). The plants were harvested at the same time and the cut plants were placed in paper bags and dried at 65 °C until constant weight to obtain the aboveground biomass [23]. In the area where the aboveground parts of plants were cut, use a shovel to dig a profile and collect soil samples from the 0–20 cm soil layer with a ring knife. Bring the samples back to the laboratory, dry them in the wind, and use them to determine the physical and chemical properties of the soil [24].
Soil samples were processed and analysed using conventional analytical methods. The bulk density (BD) was measured using the ring knife method. The soil water content (SWC) was measured using the drying method. The pH value was measured using a 2.5:1 soil-to-water ratio and a pH metre, using a Hanna HI981030 GroLine soil-specific pH tester (Hanna Instruments, Cluj-Napoca, Romania) (accuracy ± 0.05) [24]. Soil organic matter (SOM) was determined using the potassium dichromate (K2Cr2O7, Sinopharm Chemical Reagent Co., Ltd., Shanghai, China) heating method [25]. Total nitrogen (TN) was determined using the Kjeldahl nitrogen determination method [25]. Total potassium (TK) was determined using the alkali dissolution–atomic absorption spectrophotometry method (Sherwood Model 410 atomic absorption flame photometer, Sherwood Scientific Ltd., Cambridge, UK) [25]. Total phosphorus (TP) was determined using the perchloric acid (HClO4, Sinopharm Chemical Reagent Co., Ltd., Shanghai, China)–H2SO4 method (H2SO4, Sinopharm Chemical Reagent Co., Ltd., Shanghai, China) [25]. Alkaline−hydrolysed nitrogen (AN) was determined using the alkaline−hydrolysed diffusion method [25]. Available potassium (AK) was determined using the ammonium acetate (NH4C2H3O2, Sinopharm Chemical Reagent Co., Ltd., Shanghai, China)–flame photometer method (Sherwood Model 410) [25]. Available phosphorus (AP) was determined using the sodium bicarbonate extraction (NaHCO3, Sinopharm Chemical Reagent Co., Ltd., Shanghai, China)–molybdenum antimony colorimetric method [25].

2.3. Data Processing and Analysis

2.3.1. Species Importance Value

Given that the study area is dominated by shrubs and herbaceous plants, the species importance value was calculated using the formula proposed by Li et al. [26]:
IVi = (Di + Fi + Pi)/3
In the formula, IVi, Di, Fi, and Pi represent the importance value, relative frequency, relative density, and relative cover of the i-th species, respectively. The relative frequency Di is equal to the number of times the i-th species appears in the statistical plot divided by the total frequency of all species. The relative density Fi is equal to the density of the i-th species in the statistical plot divided by the total density of all plant species. The relative cover Pi is equal to the cover of the i-th species in the statistical plot divided by the total cover of all plant species.

2.3.2. Biodiversity

The alpha diversity of a plant community reflects the richness of species in the community and the uniformity of their distribution throughout the community [27]. Calculate the Patrick richness index R, Shannon diversity index H, Pielou evenness index E, and Simpson dominance index D [28].
Patrick Richness Index: R = S
Shannon−Wiener Diversity Index: H = −∑Pi ln Pi
Pielou Evenness Index: E = H/ln S
Simpson Dominance Index: D = 1 − ∑Pi × Pi
In the formula, S is the total number of species in each sample plot, and Pi is the ratio of the importance value of the i-th species to the sum of the importance values of all species in the sample plot.

2.3.3. Data Analysis

All data underwent preliminary collation in Microsoft Excel 2017 (Microsoft Corp., Redmond, WA, USA), with statistical analysis conducted using the R programming language (v4.3.2, R Core Team, 2023). Significance tests for vegetation cover, aboveground biomass, diversity indices, and soil physicochemical properties were conducted using two-way analysis of variance (ANOVA), implemented via the base package’s aov() function. Inter-group differences were assessed through TukeyHSD() for multiple comparisons. Correlations between variables were calculated using the cor() function and visualised with the corrplot package (v0.92). Variance partitioning analysis (VPA) employed the varpart() function from the vegan package (v2.6-4) to quantify the independent and interactive contributions of operational years and microhabitat types to vegetation–soil characteristics. Generalised additive models (GAMs) were constructed using the gam() function from the mgcv package (v1.9-1) to characterise the nonlinear relationships between vegetation indices and environmental factors. Variable selection for the GAM was based on soil factors exhibiting significant correlations in preliminary analyses, supplemented by the inclusion of commonly limiting factors in desert ecosystem studies to ensure ecological plausibility. Graphs were produced using the ggplot2 package (v3.5.0).

3. Results

3.1. Community Characteristics

A total of 7 families, 14 genera, and 17 plant species were recorded (Table 2). The dominant families include Chenopodiaceae and Zygophyllaceae. In the native area, the dominant species are Reaumuria soongorica and N. tangutorum, reflecting the typical composition of desert grassland plant communities. In the photovoltaic power station area, R. soongorica and Suaeda salsa were the dominant species in all four microenvironments in the power station that had been in operation for 13 years. In the power station that had been in operation for 7 years, R. soongorica had a high importance value in all microenvironments, followed by N. tangutorum, which was mainly distributed in the FP and BP areas. In the power plant that has been in operation for 1 year, R. soongorica is also the dominant species in all microenvironments, with particularly high importance values in the UP and BP regions. R. soongorica is the dominant species in all regions.
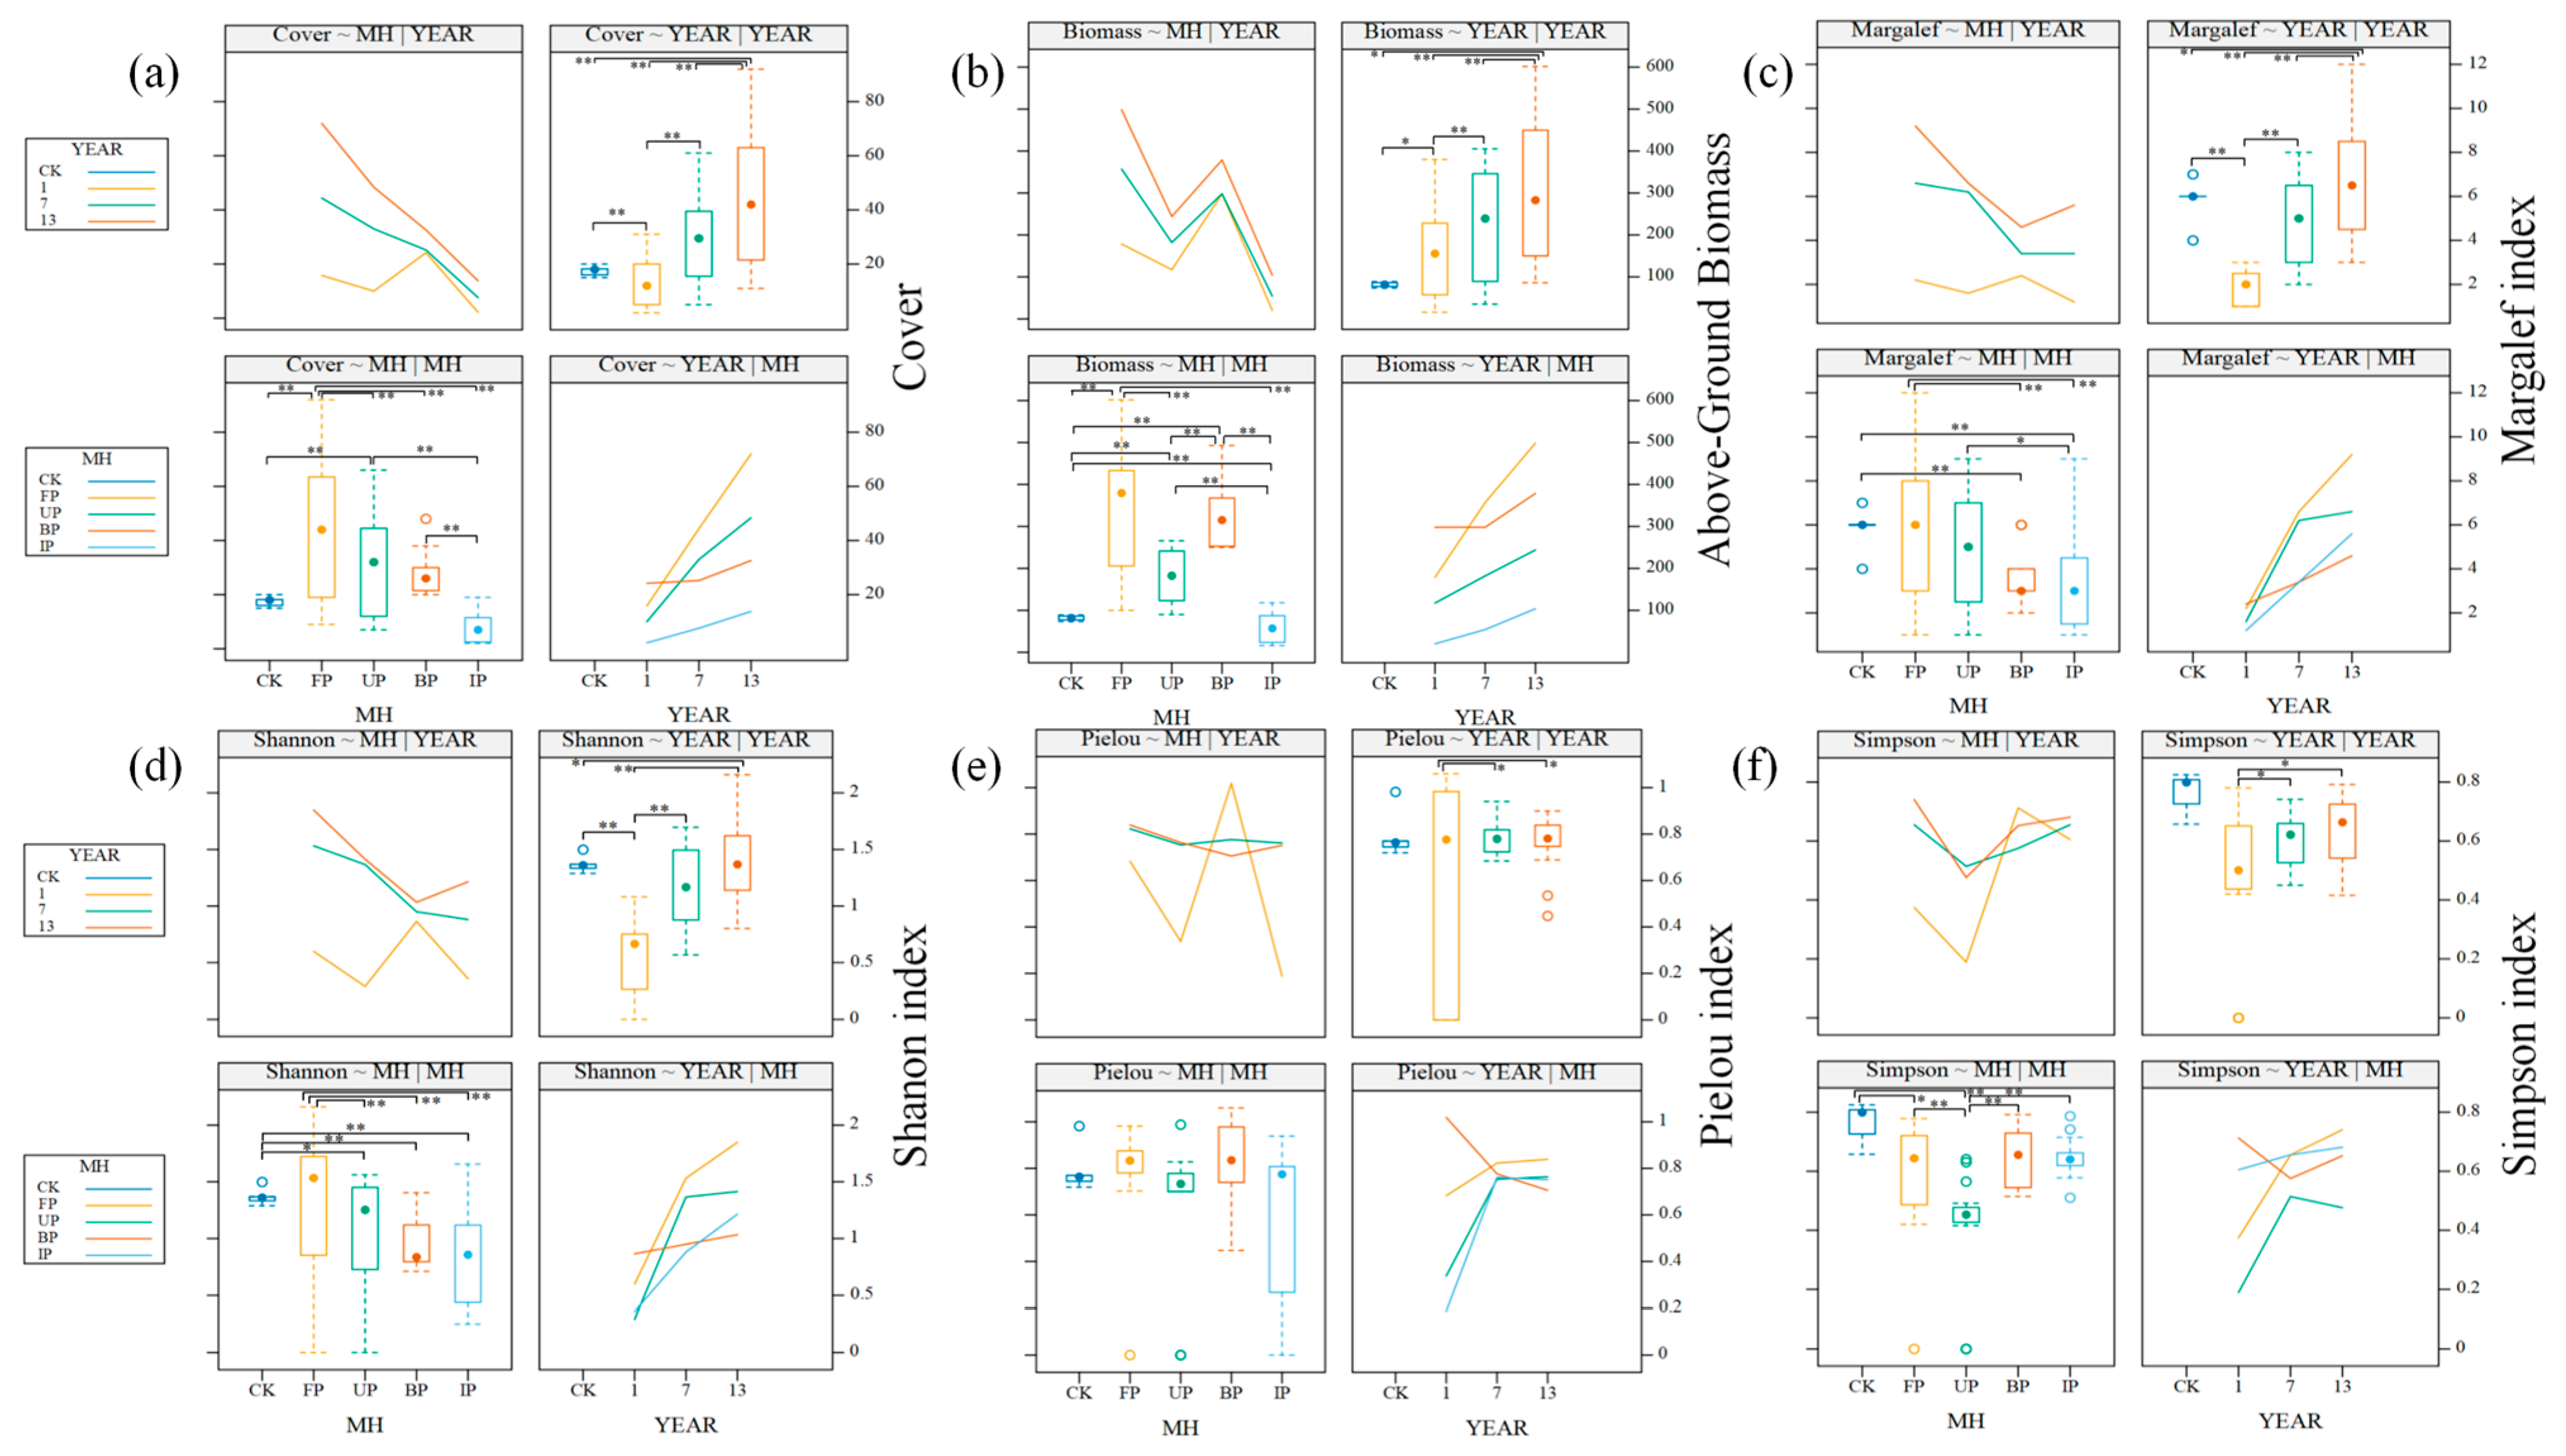
As shown in Figure 4a,b, both vegetation cover and aboveground biomass exhibit an upward trend with increasing operational year. The 13 year zone exhibited the highest values, significantly higher than the 1-year plot (p < 0.01), but showed no significant difference compared to the 7 year zone. The 1 year zone recorded the lowest values, markedly lower than CK (p < 0.05), while the 13 year zone was significantly higher than CK (p < 0.05). The 7 year zone showed no significant difference compared to CK.
Within the microenvironment, both indicators in the FP zone ranked highest, significantly exceeding those in other zones (p < 0.05). Biomass was markedly higher than in the UP and IP zones (p < 0.01), while showing no significant difference from the BP zone. The IP zone exhibited the lowest values (p < 0.01).
As shown in Figure 4c,d, both the Margalef richness index and Shannon–Wiener diversity indices reached their highest values in the 13 year zone. These values were extremely significantly higher than those in the 1 year zone (p < 0.01) and also significantly higher than those in the CK plots (p < 0.05). The 1 year zone showed the lowest values, significantly lower than the CK (p < 0.01). The 7 year zone exhibited no significant differences from the CK in either index. Within the microenvironment, both the Margalef index and Shannon−Wiener index were highest in the FP zone. These were significantly higher than in the IP and BP zones (p < 0.01), with the IP zone exhibiting the weakest performance.
As shown in Figure 4e,f, the Pielou index and Simpson index exhibited minimal variation with age. Both the 13 year and 7 year zones demonstrated significantly higher values than the 1 year plot (p < 0.05), with no significant difference observed compared to the CK control. Within the microenvironment, the FP region exhibits relatively high uniformity, with the IP region the lowest and the other regions falling at intermediate levels.

3.2. Soil Physical and Chemical Properties

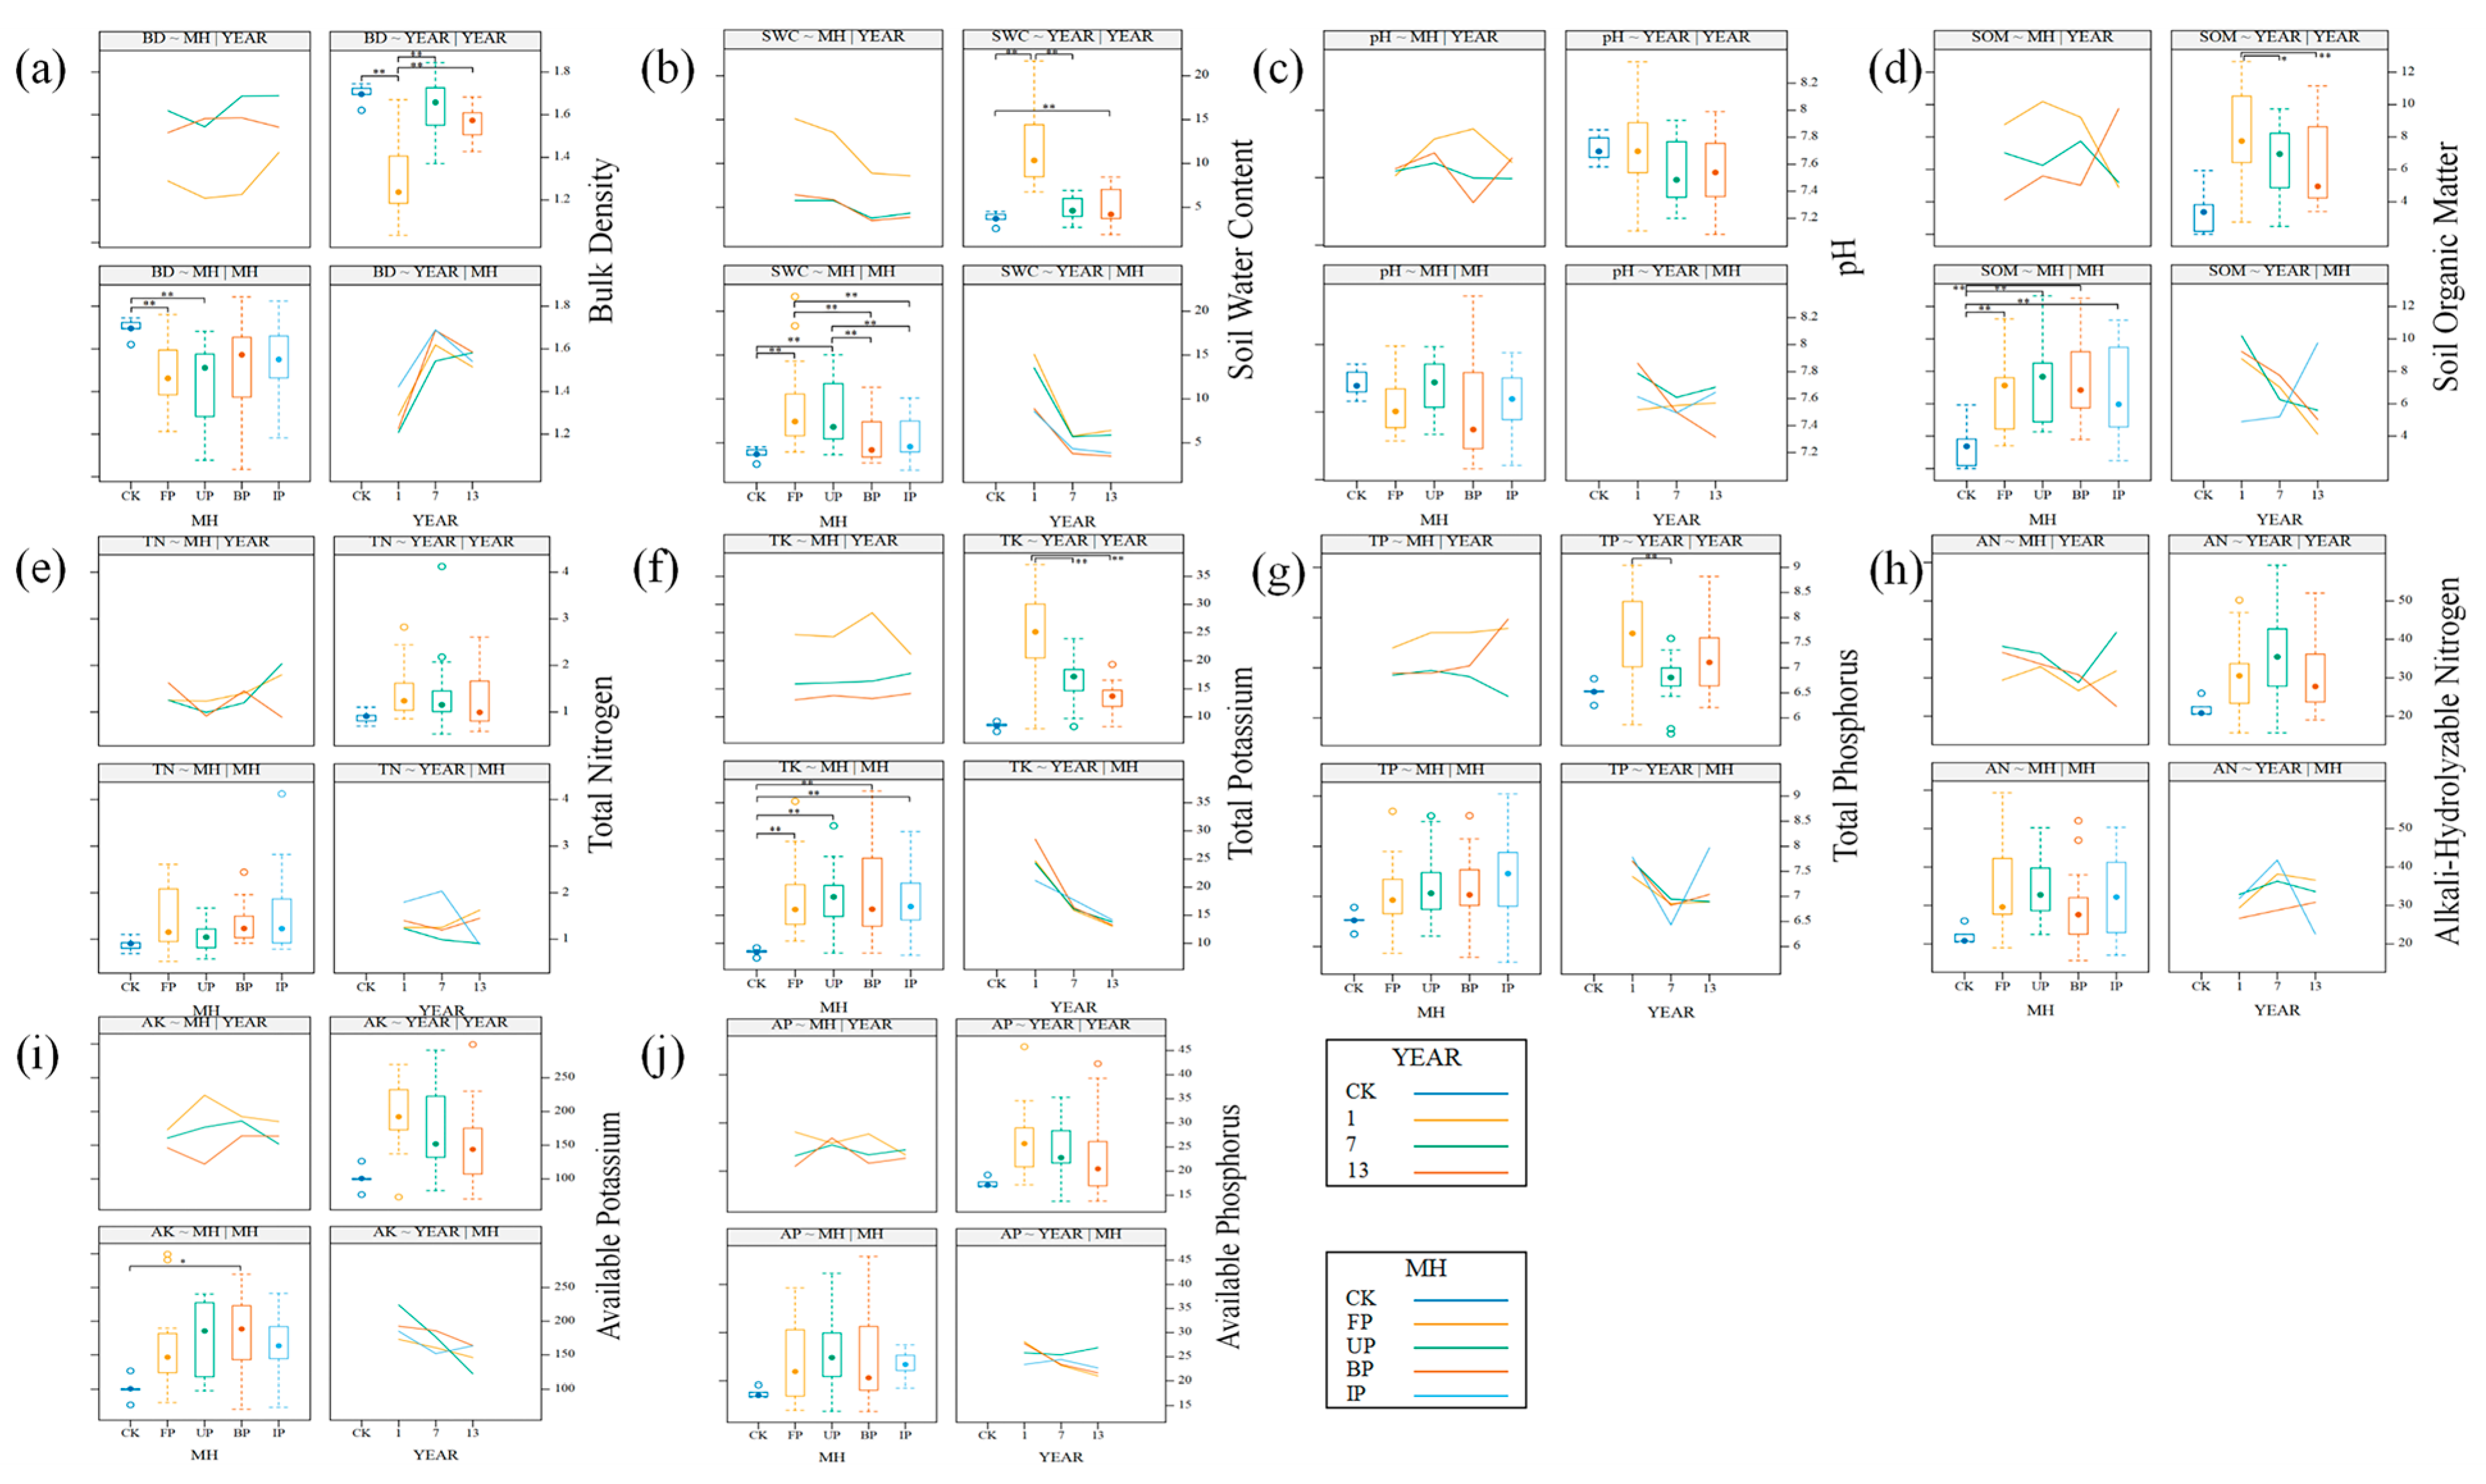
As shown in Figure 5a–j, analysis from the age dimension indicates that the 1 year zone exhibited the highest SWC and lowest BD, both of which differed extremely significantly from the CK (p < 0.01). The 13 year zone exhibited the lowest SWC, which was significantly lower than that of the control and 1 year zone (p < 0.01). The BD of the 13 year and 7 year zones was significantly higher than that of the 1 year zone (p < 0.01). SOM and TK exhibited a declining trend with increasing operational year, with the 7 year and 13 year zones showing significantly lower values than the 1 year zone (p < 0.05). TP exhibited extremely significant differences between the 1 year and 7 year zones (p < 0.01), whilst the 13 year zone showed no significant differences compared to other age classes.
In the microenvironment, BD in the FP, UP, and BP zones was significantly lower than in the CK (p < 0.05), whilst the IP zone showed no significant difference from the CK. The FP and UP zones exhibited significantly higher SWC than the CK and other microenvironments (p < 0.01), while the BP and IP zones showed lower values. SOM and TK were significantly higher than the control in all microenvironments (p < 0.01), with UP and BP exhibiting relatively higher concentrations. AK was significantly higher than CK only in the BP zone (p < 0.05).

3.3. Relationship Between Community Characteristics and Soil Physical and Chemical Factors

3.3.1. Relevance Analysis

As the operating years of photovoltaic power stations increased, the correlation between vegetation indicators and soil factors showed significant time series changes (Figure 6a–c). During the one-year operating period, the vegetation uniformity index was significantly negatively correlated with BD (p < 0.05), while the dominance index was extremely significantly negatively correlated with SWC (p < 0.01). During the seven years of operation, the richness index and diversity index were both significantly positively correlated with SWC (p < 0.01), and the dominance index was significantly positively correlated with readily AP (p < 0.05). During the 13 years of operation, vegetation cover was significantly positively correlated with SWC and AN (p < 0.05) and significantly negatively correlated with SOM and TP (p < 0.05). Aboveground biomass was highly significantly positively correlated with TN (p < 0.01) and significantly negatively correlated with SOM and TP (p < 0.05). In addition, the diversity index was still significantly positively correlated with SWC (p < 0.05) in the 13 years of operation of the power station.

3.3.2. Variance Decomposition Analysis

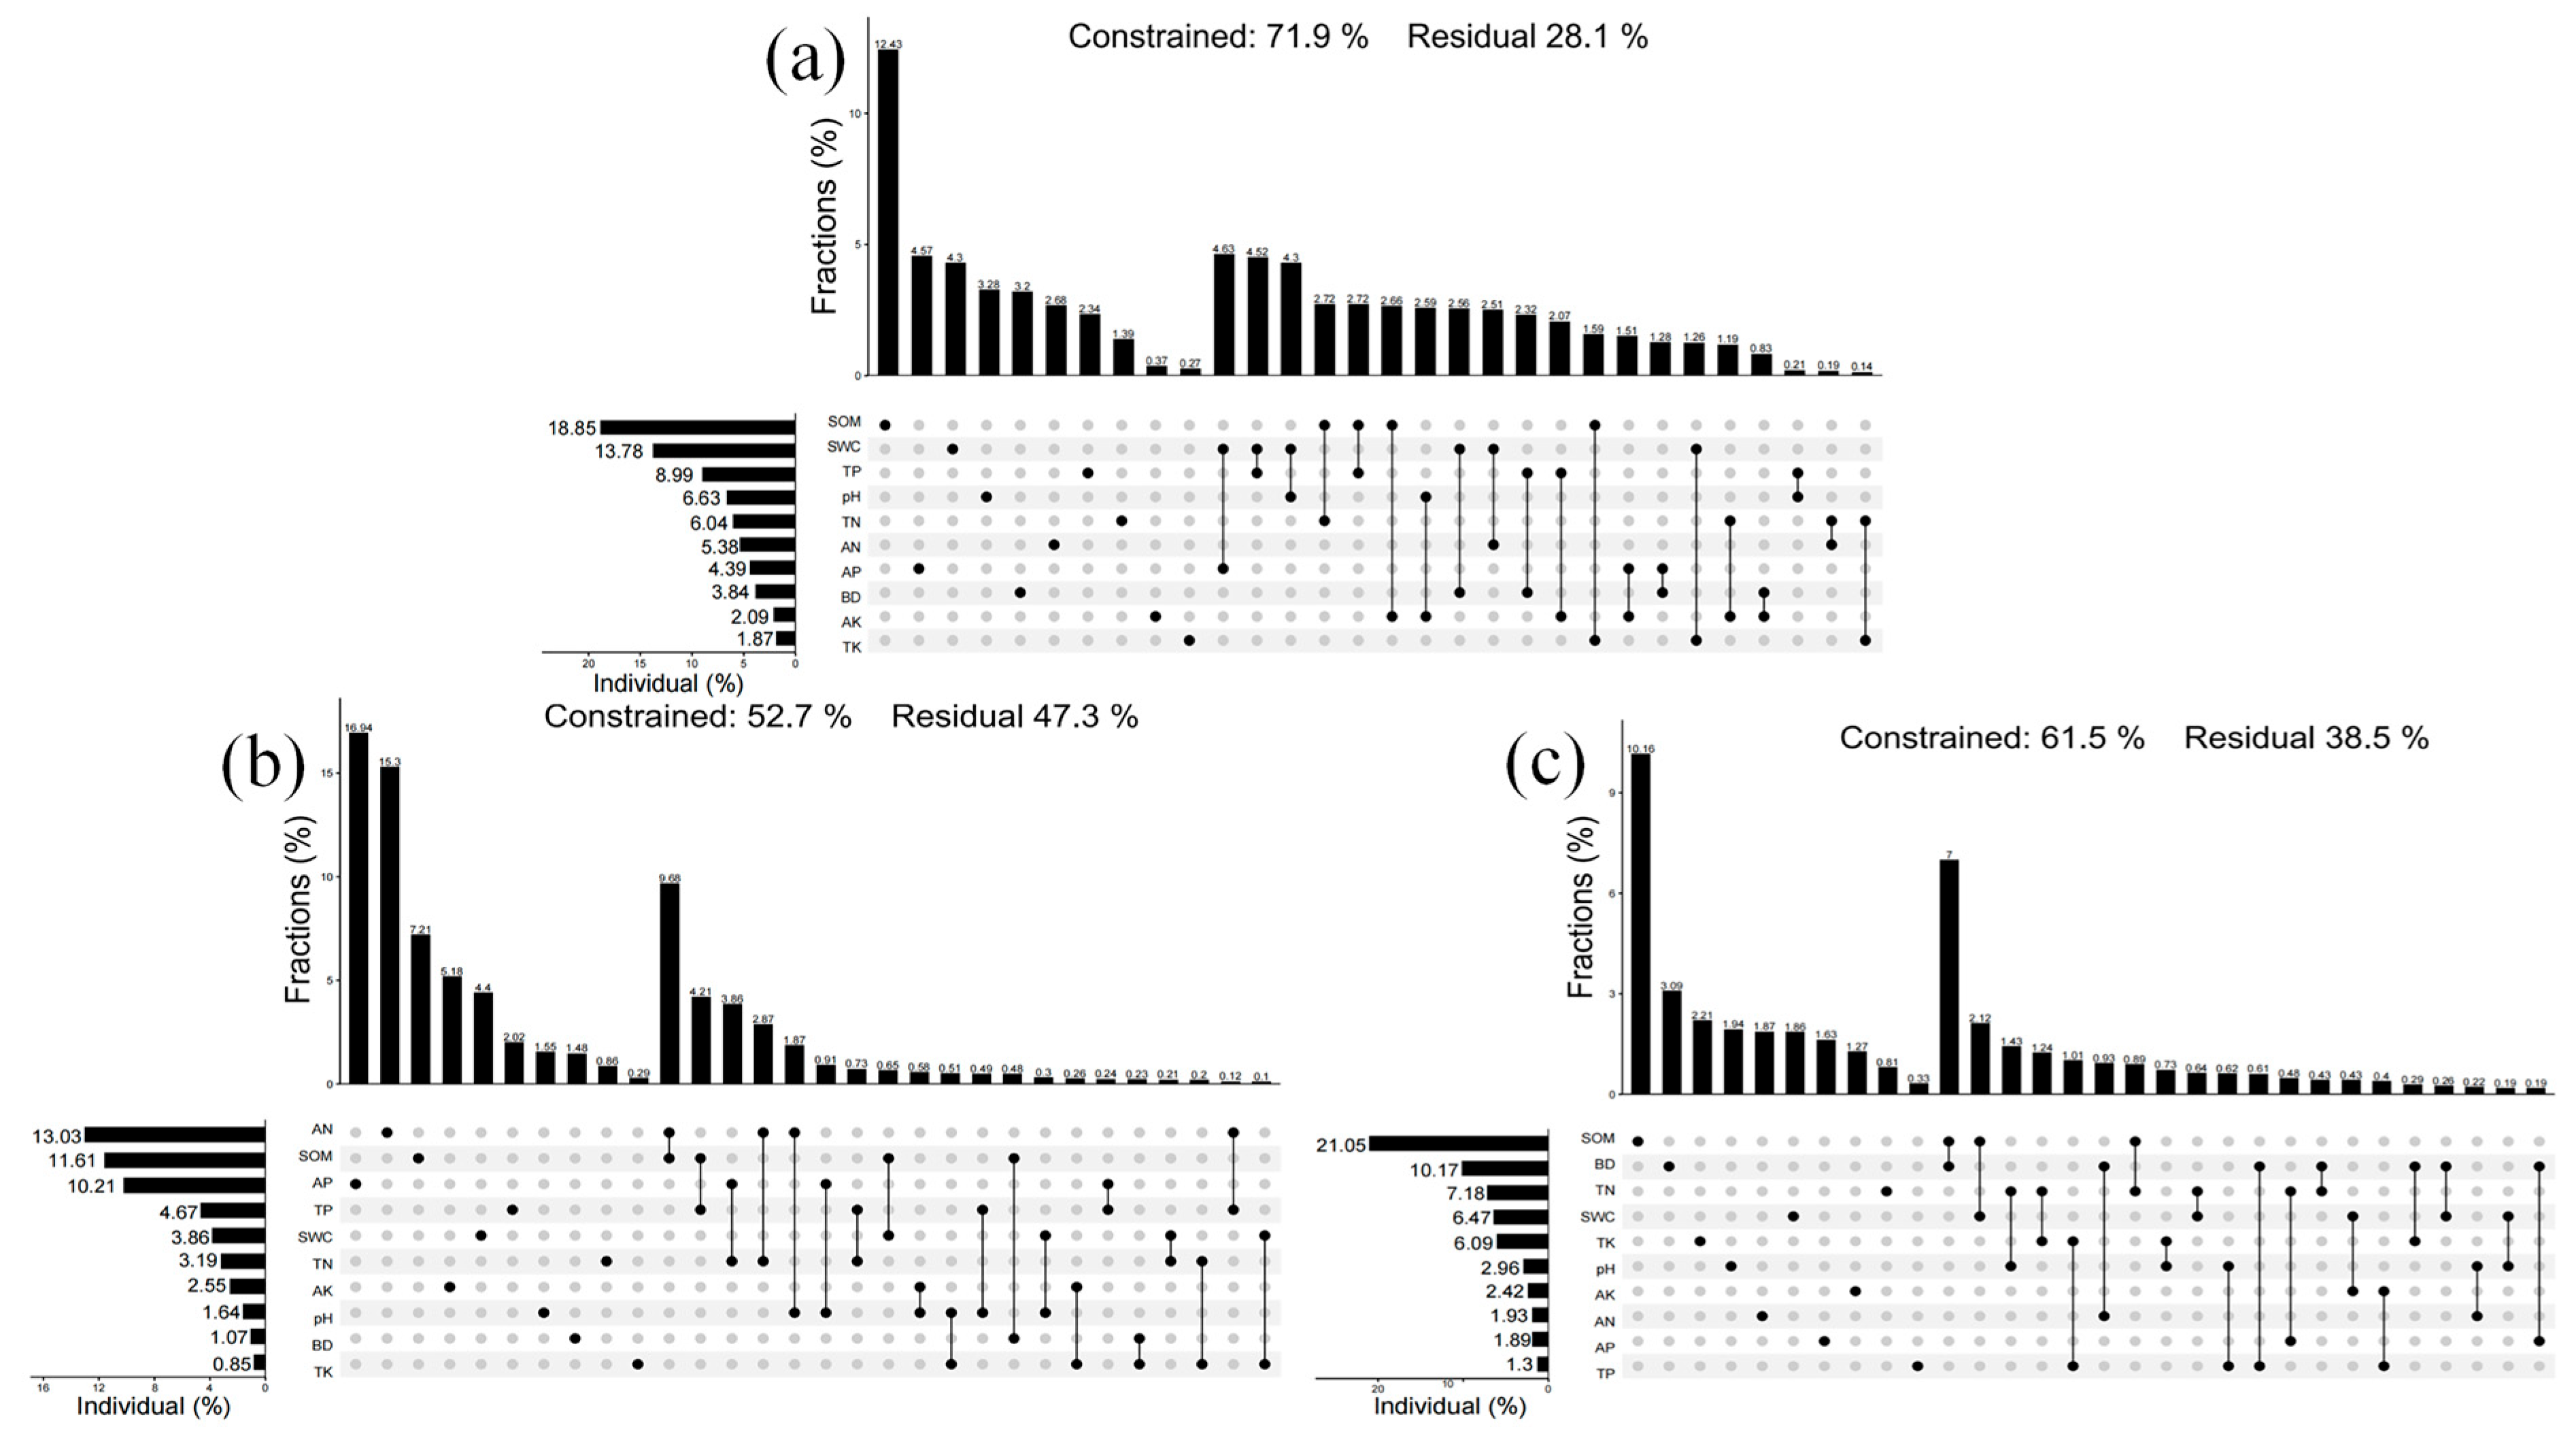
The VPA results showed (Figure 7a–c) that in photovoltaic power station areas with different operating years, the explanatory power of soil factors for vegetation cover varies significantly with the restoration process. In power stations that have been in operation for 13 years, the total explanatory rate is 71.9%, and the explanatory rates of SOM, SWC, and TP are 18.85%, 13.78%, and 8.98%, respectively, which are the main controlling factors. In contrast, the explanatory rate for power plants with 7 years of operation was only 52.7%, with AN (13.03%), SOM (11.61%), and AP (10.21%) being the primary factors. The power plant with a 1 year operational history had an explanatory power of 61.6%, with SOM (21.05%) and BD (16.17%) playing the most significant roles. Overall, SOM emerged as the dominant factor across all operational histories. Additionally, the differing primary explanatory variables across operational histories reflect changes in resource-limiting factors during the restoration phase, providing insights into the mechanisms underlying desert vegetation restoration.

3.3.3. Generalised Additive Modelling

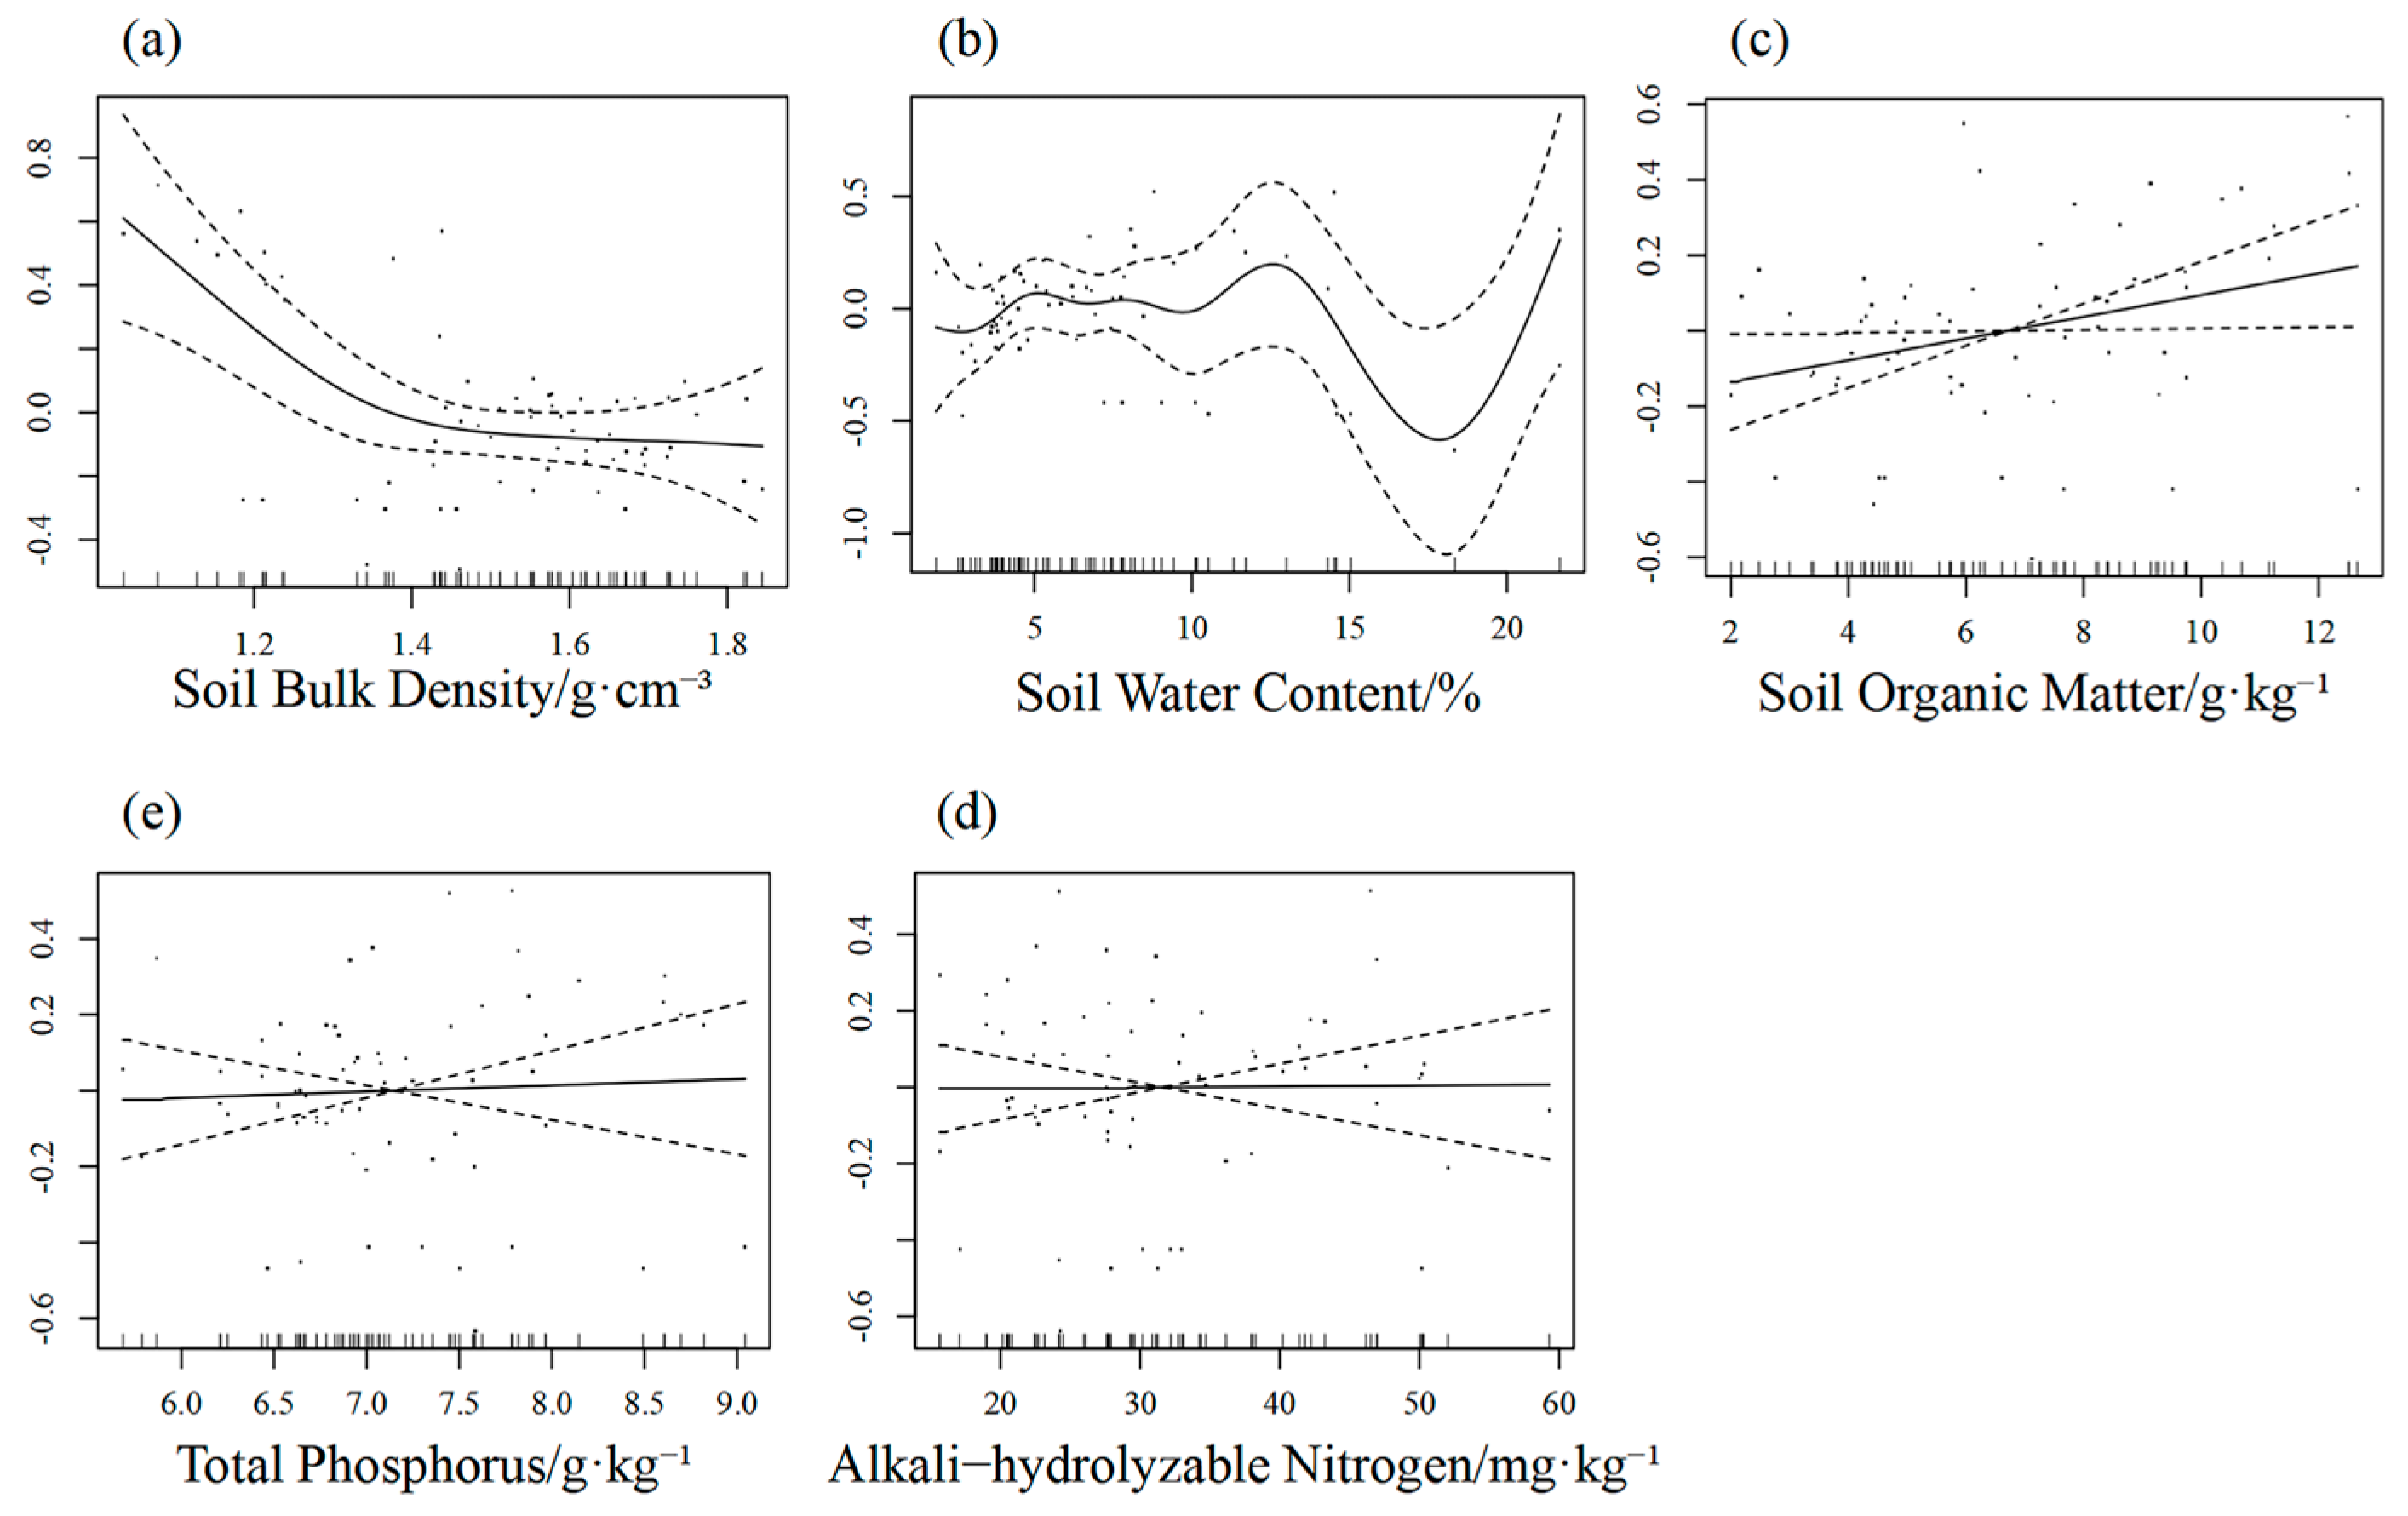
Combining results from two-way ANOVA, correlation analysis, and VPA, SOM, SWC, BD, TP, and AN emerged as critical soil factors across all operational phases. They are significantly different across years and spatial locations and provide a stable explanation for vegetation characteristics. Therefore, this study selected these five indicators as environmental variables for the GAM to investigate the nonlinear response relationship between vegetation characteristics and key soil factors.
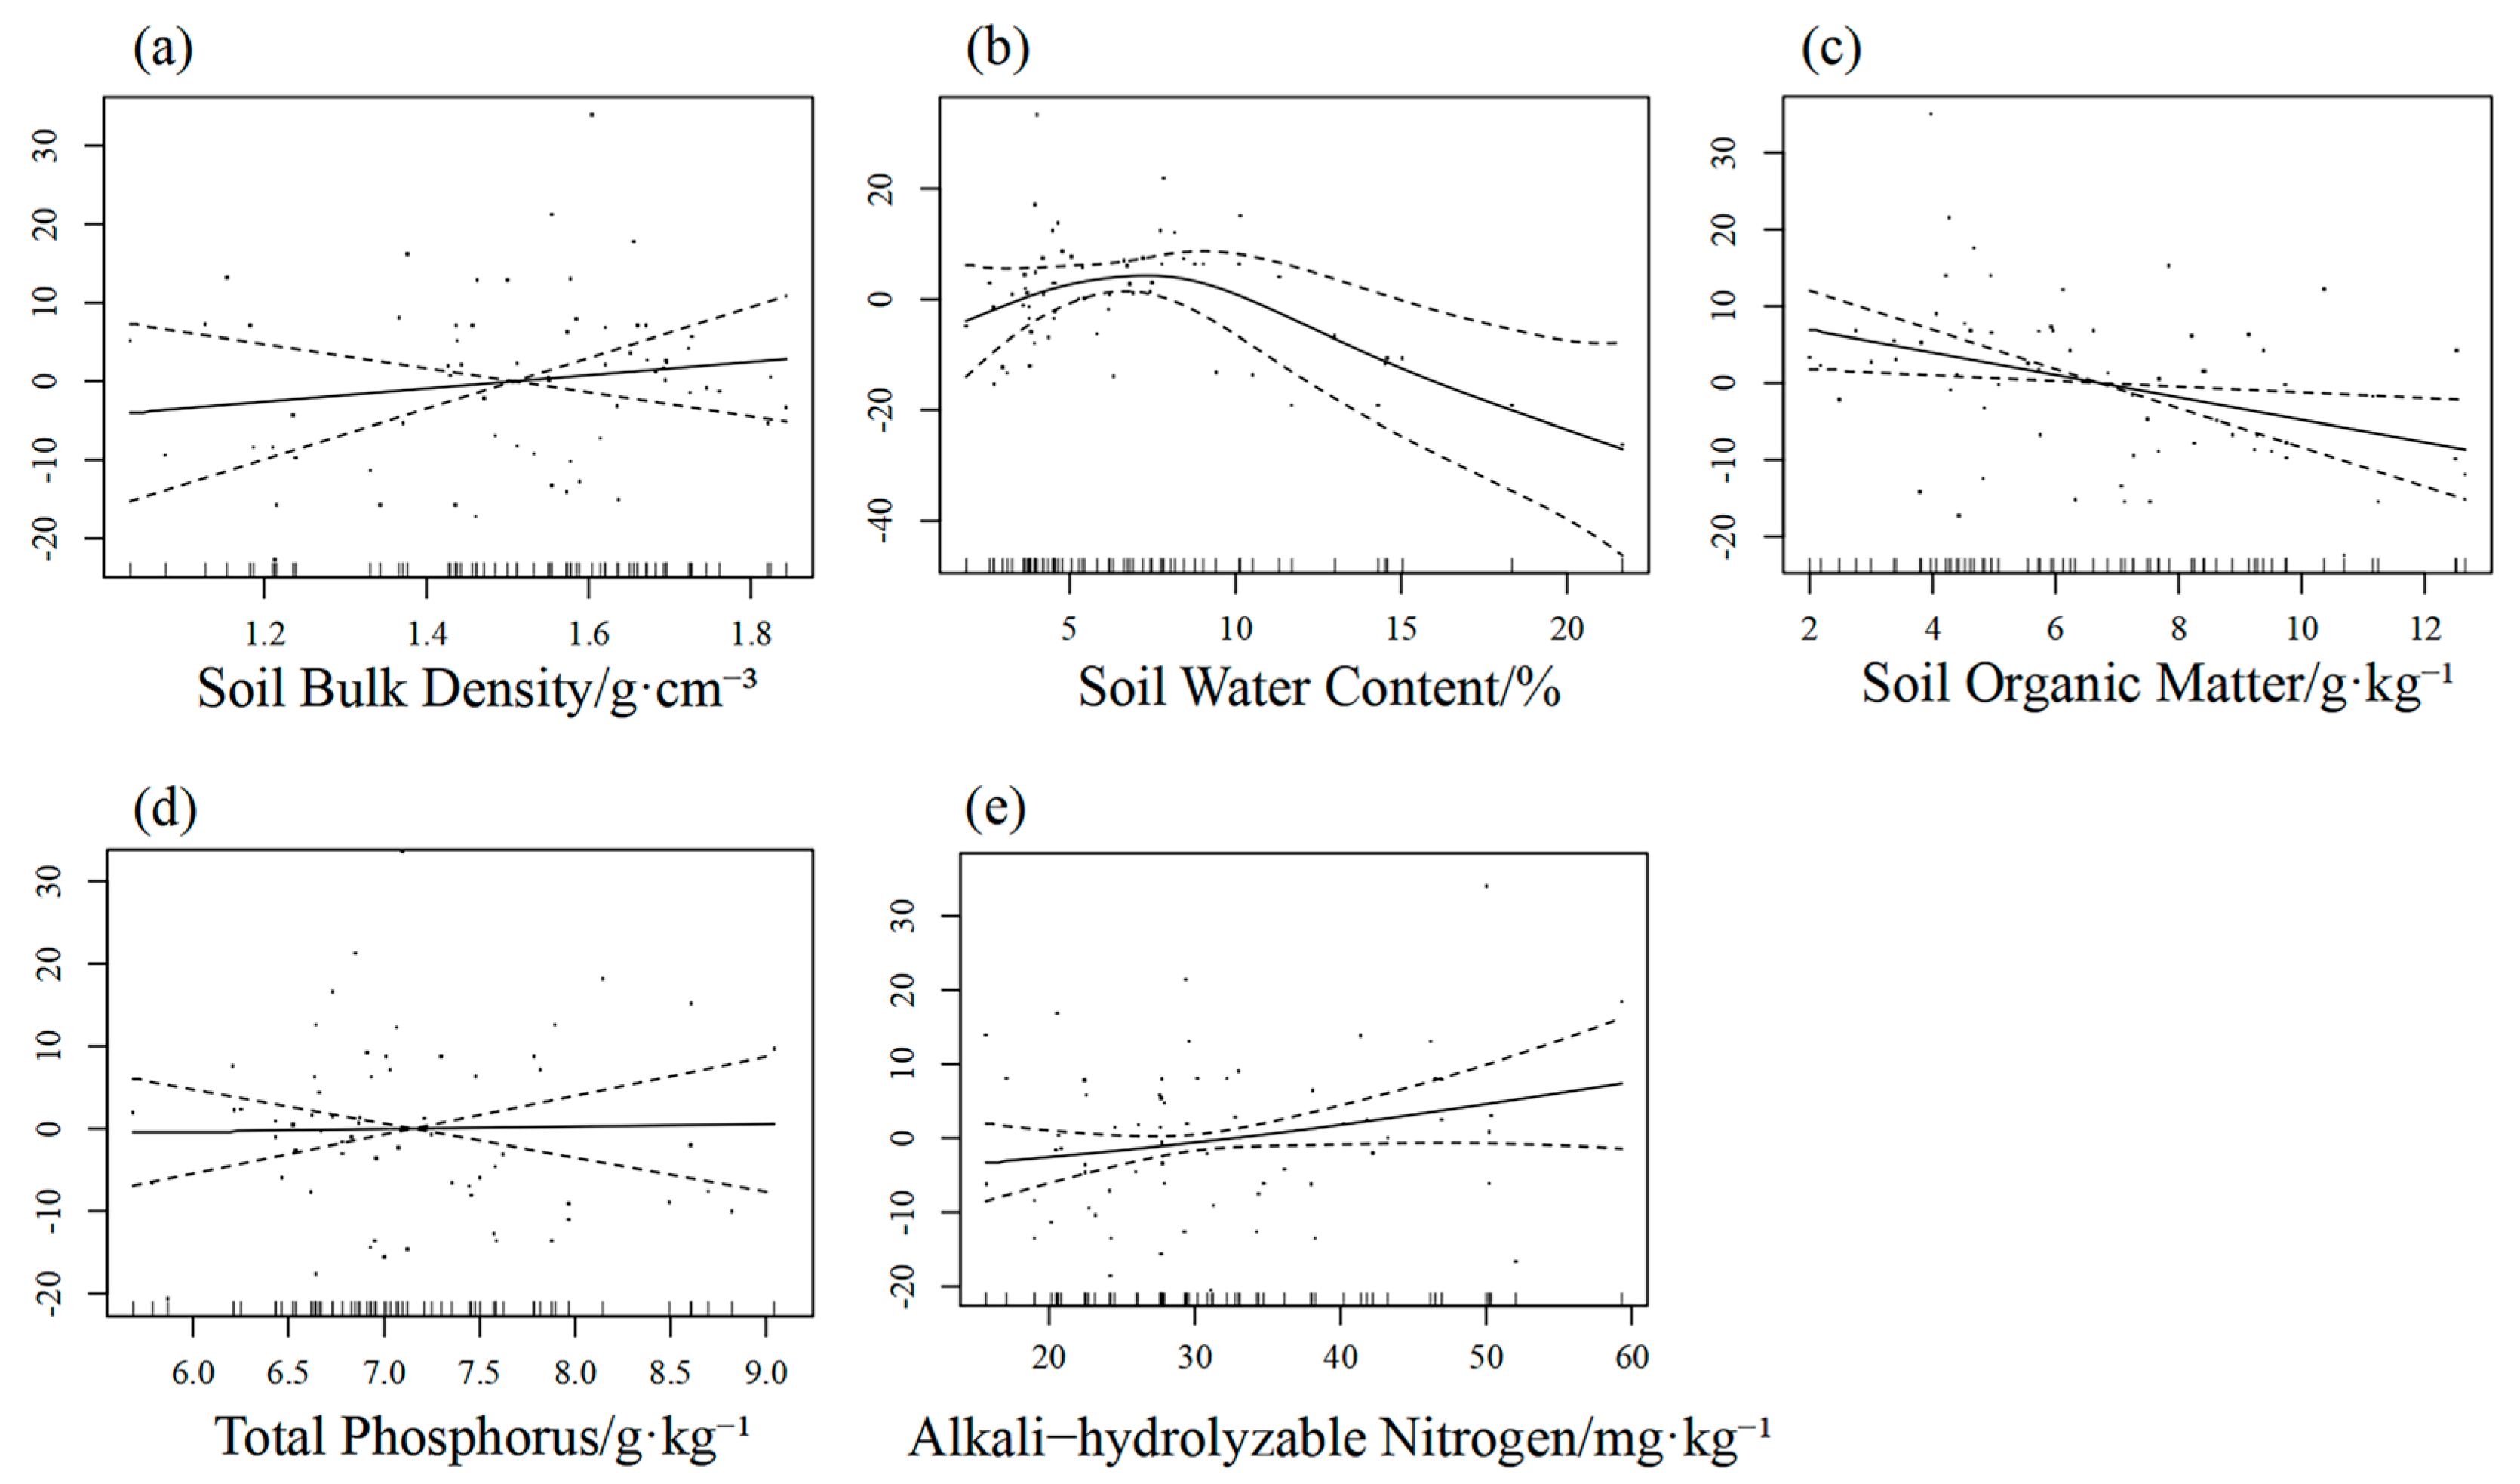
The GAM results indicate (Table S1, Figure 8a–e) that significant nonlinear relationships exist between TC and both SWC and SOM (p < 0.01), with corresponding bias explanation rates of 82% and 77%. TC exhibits a nonlinear upward trend with increasing SWC and SOM. The BD, TP, and AN smoothing terms did not reach statistical significance, yet the deviance values for the corresponding models remained above 70%.
Within the fixed effects model, the 13 year operational year exhibited a positive effect in all three models: SWC, SOM, and AN. In terms of the microenvironment, FP and UP exhibit positive effects in most models, while IP demonstrates negative effects across all models.
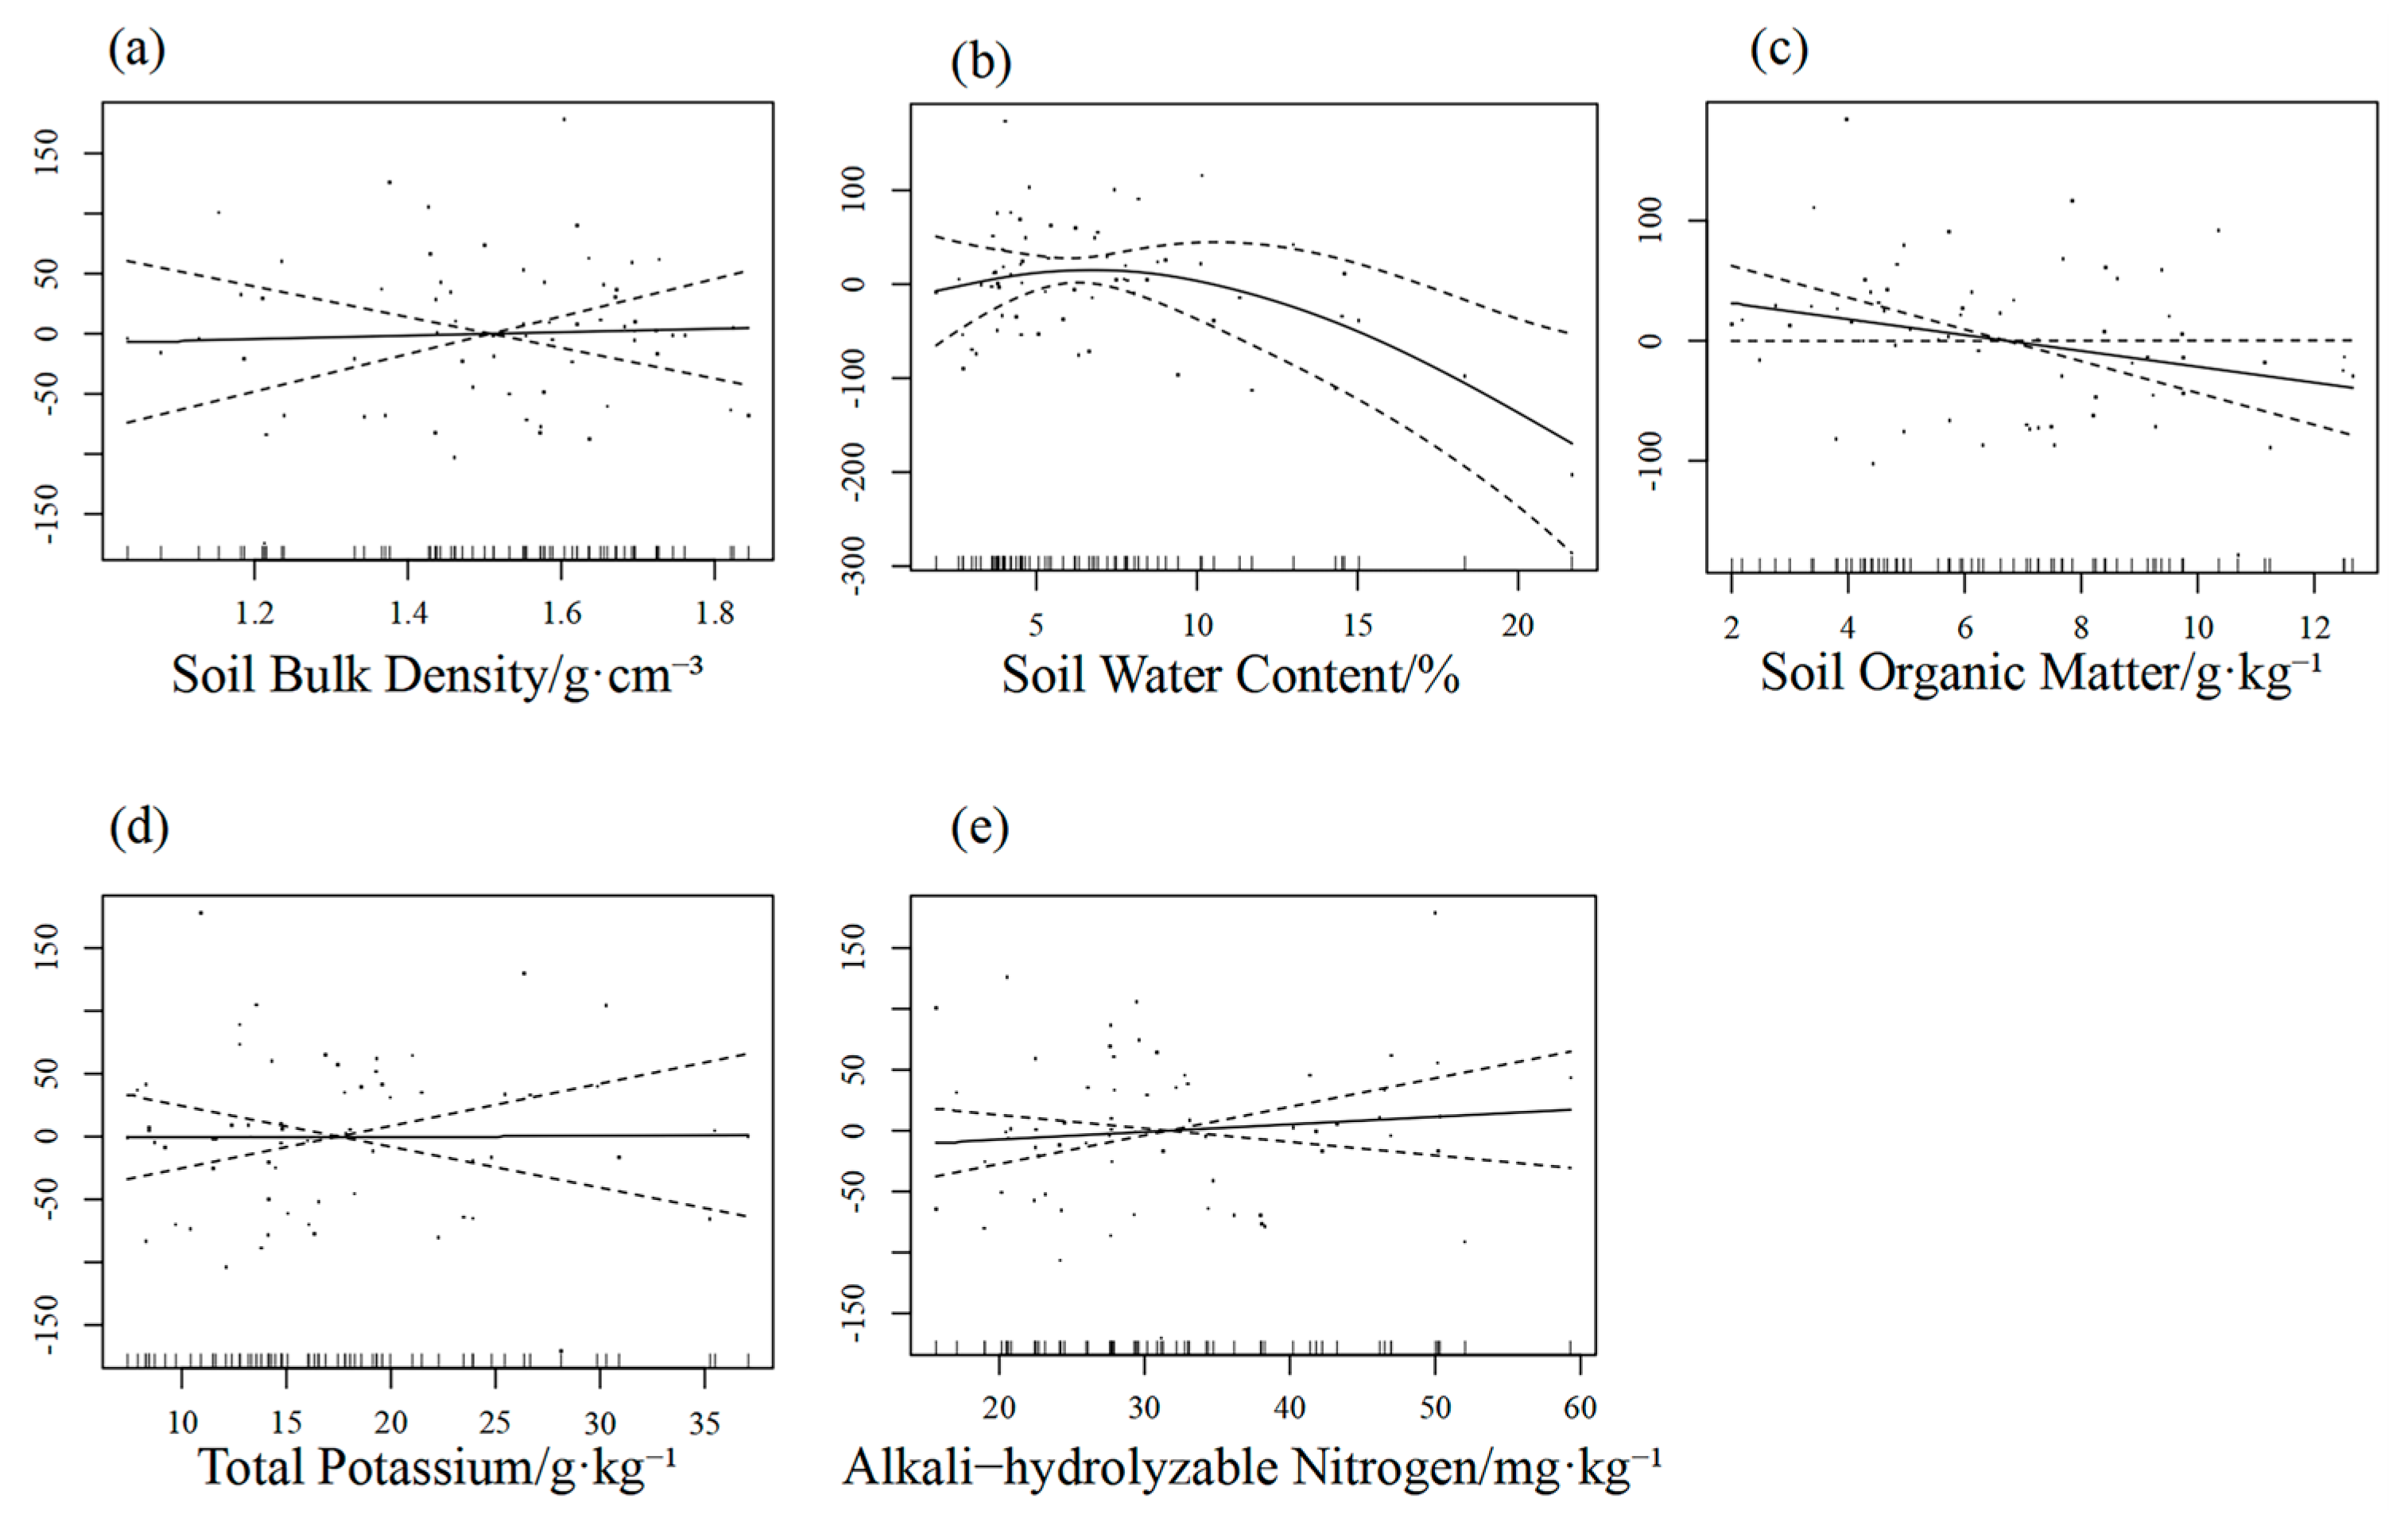
The GAM results indicate (Table S1; Figure 9a–e) a significant nonlinear relationship between AGB and SWC (p < 0.01, edf = 2.31), with deviance at 87% and a nonlinear decreasing trend as SWC increases. The smoothing terms for BD, SOM, TP, and AN were not significant, yet the corresponding models exhibited R2 values of 0.81–0.82, with deviance values all above 83%.
In terms of fixed effects, both 7 year and 13 year operational years exerted positive effects across the SWC, SOM, TP, and AN models. Regarding microenvironmental factors, FP and BP demonstrated positive effects in most models, while IP exhibited negative effects in all models.
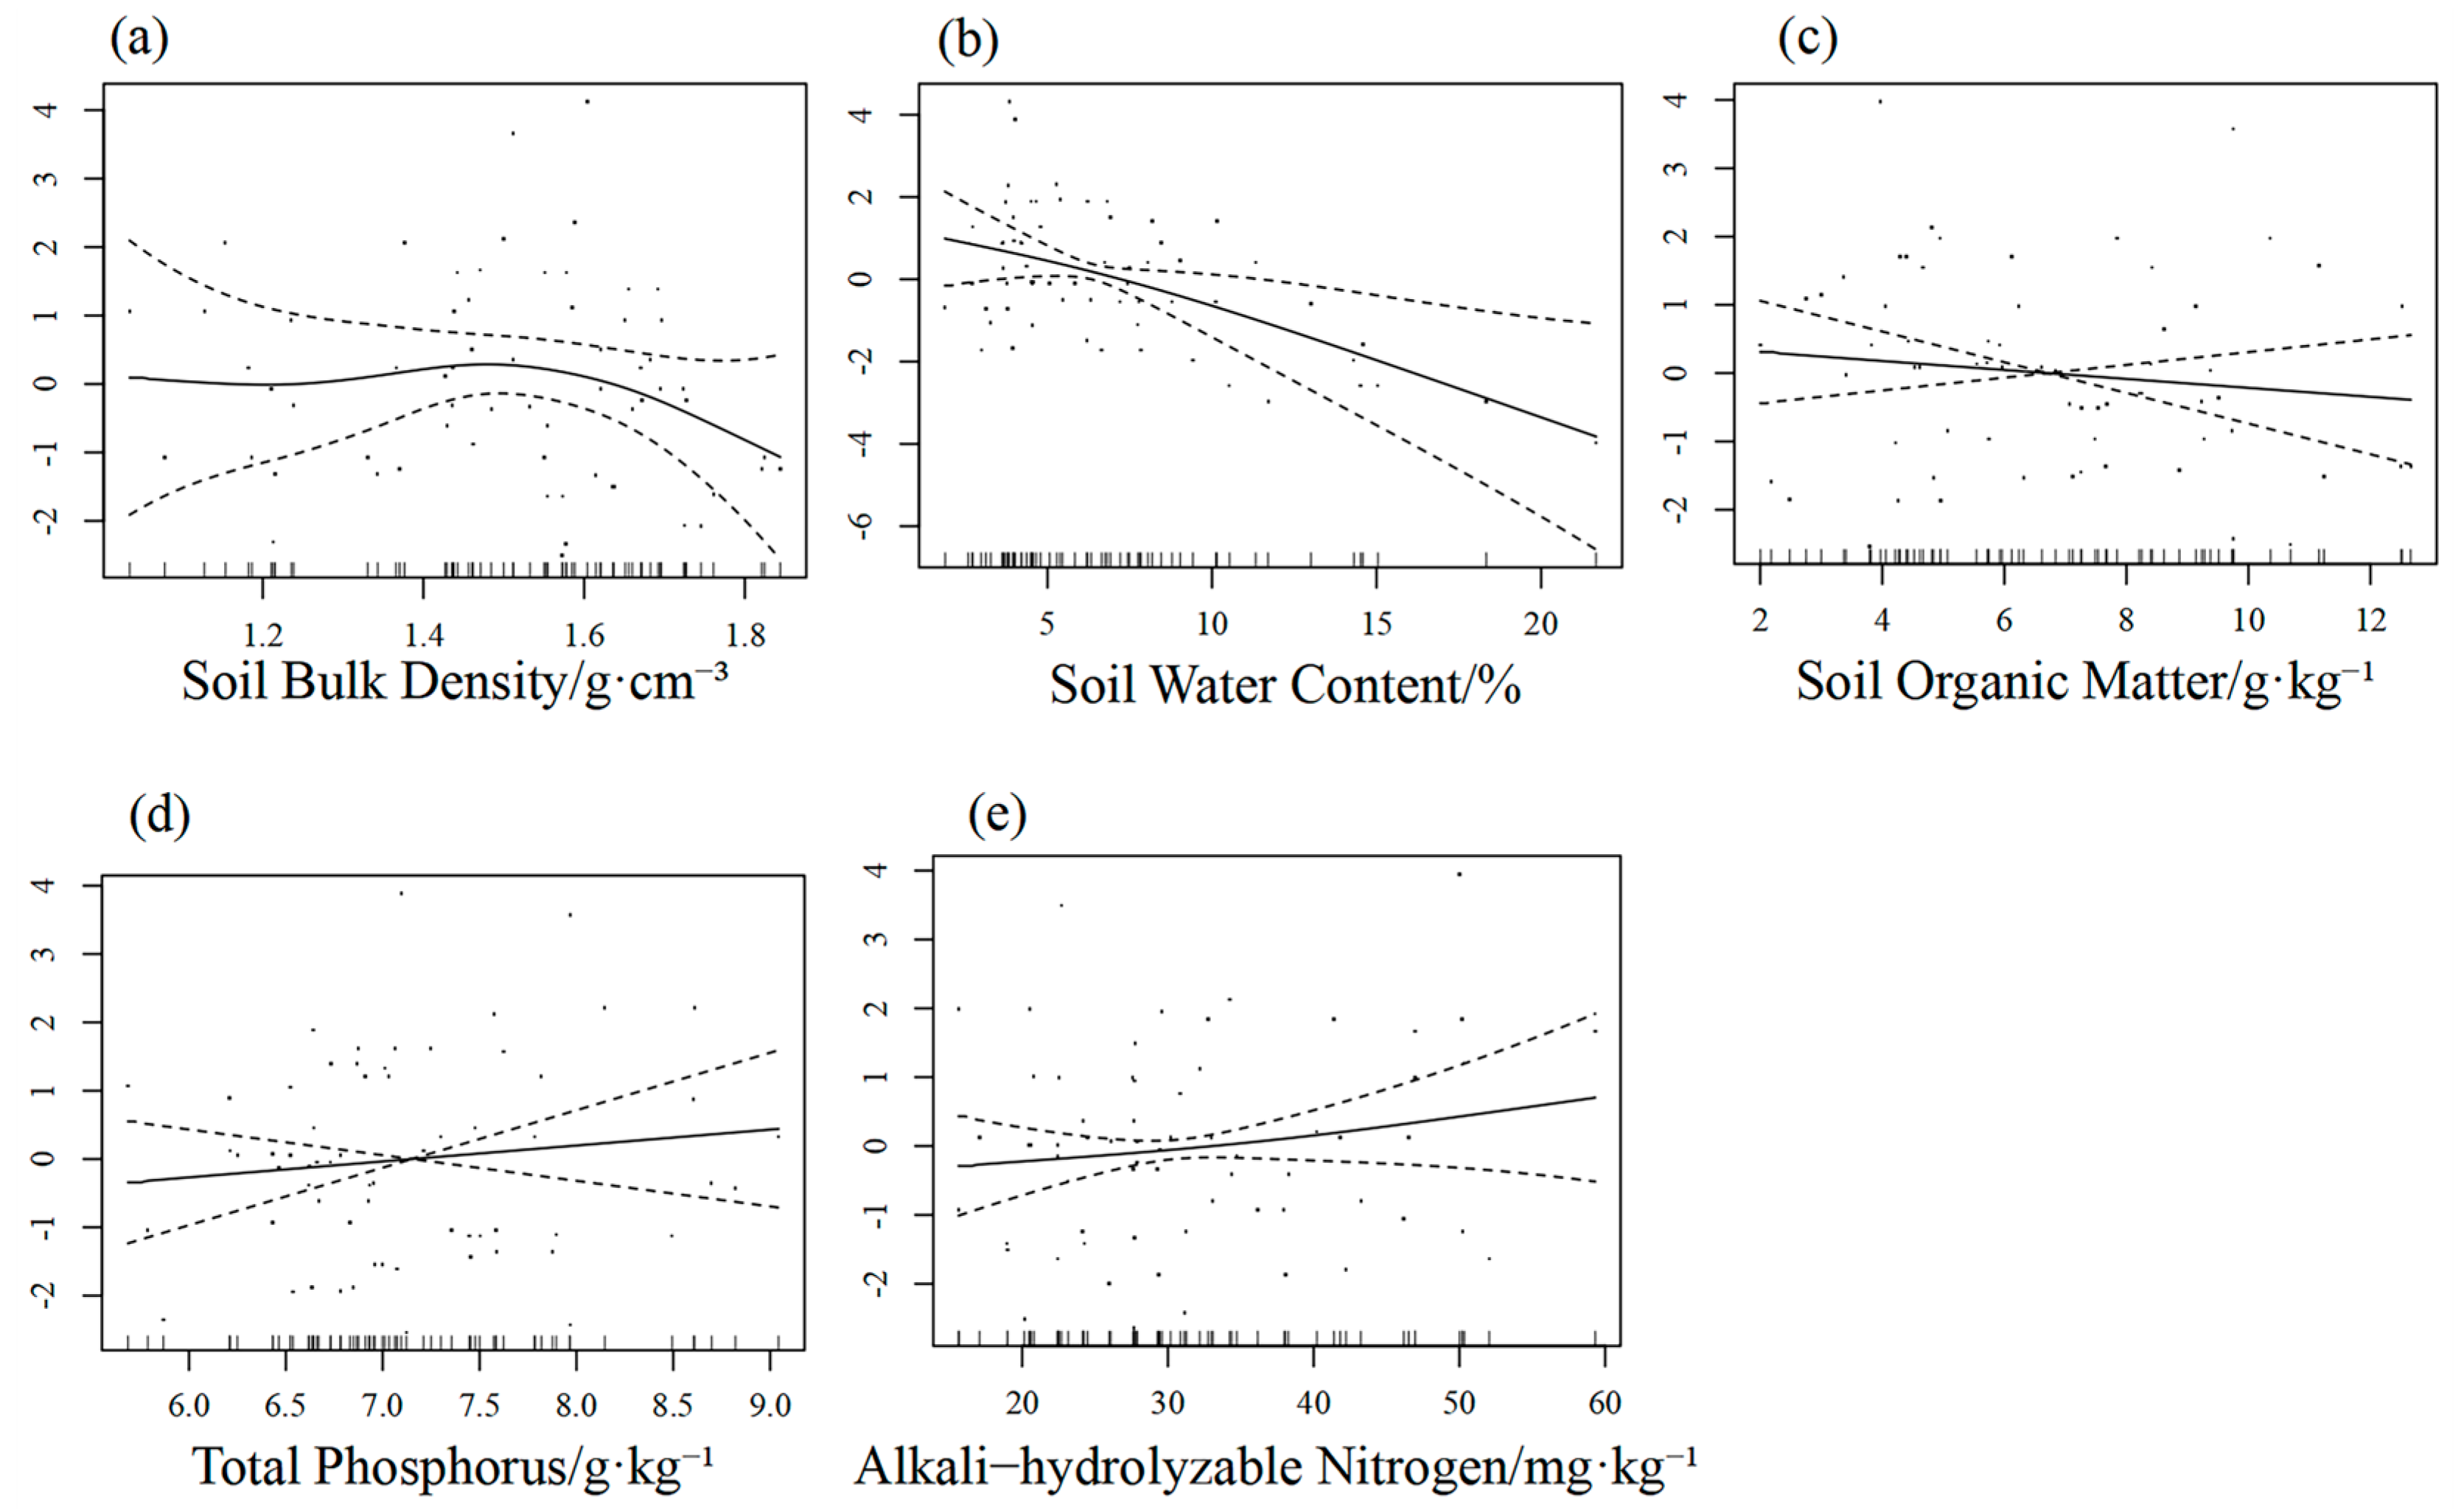
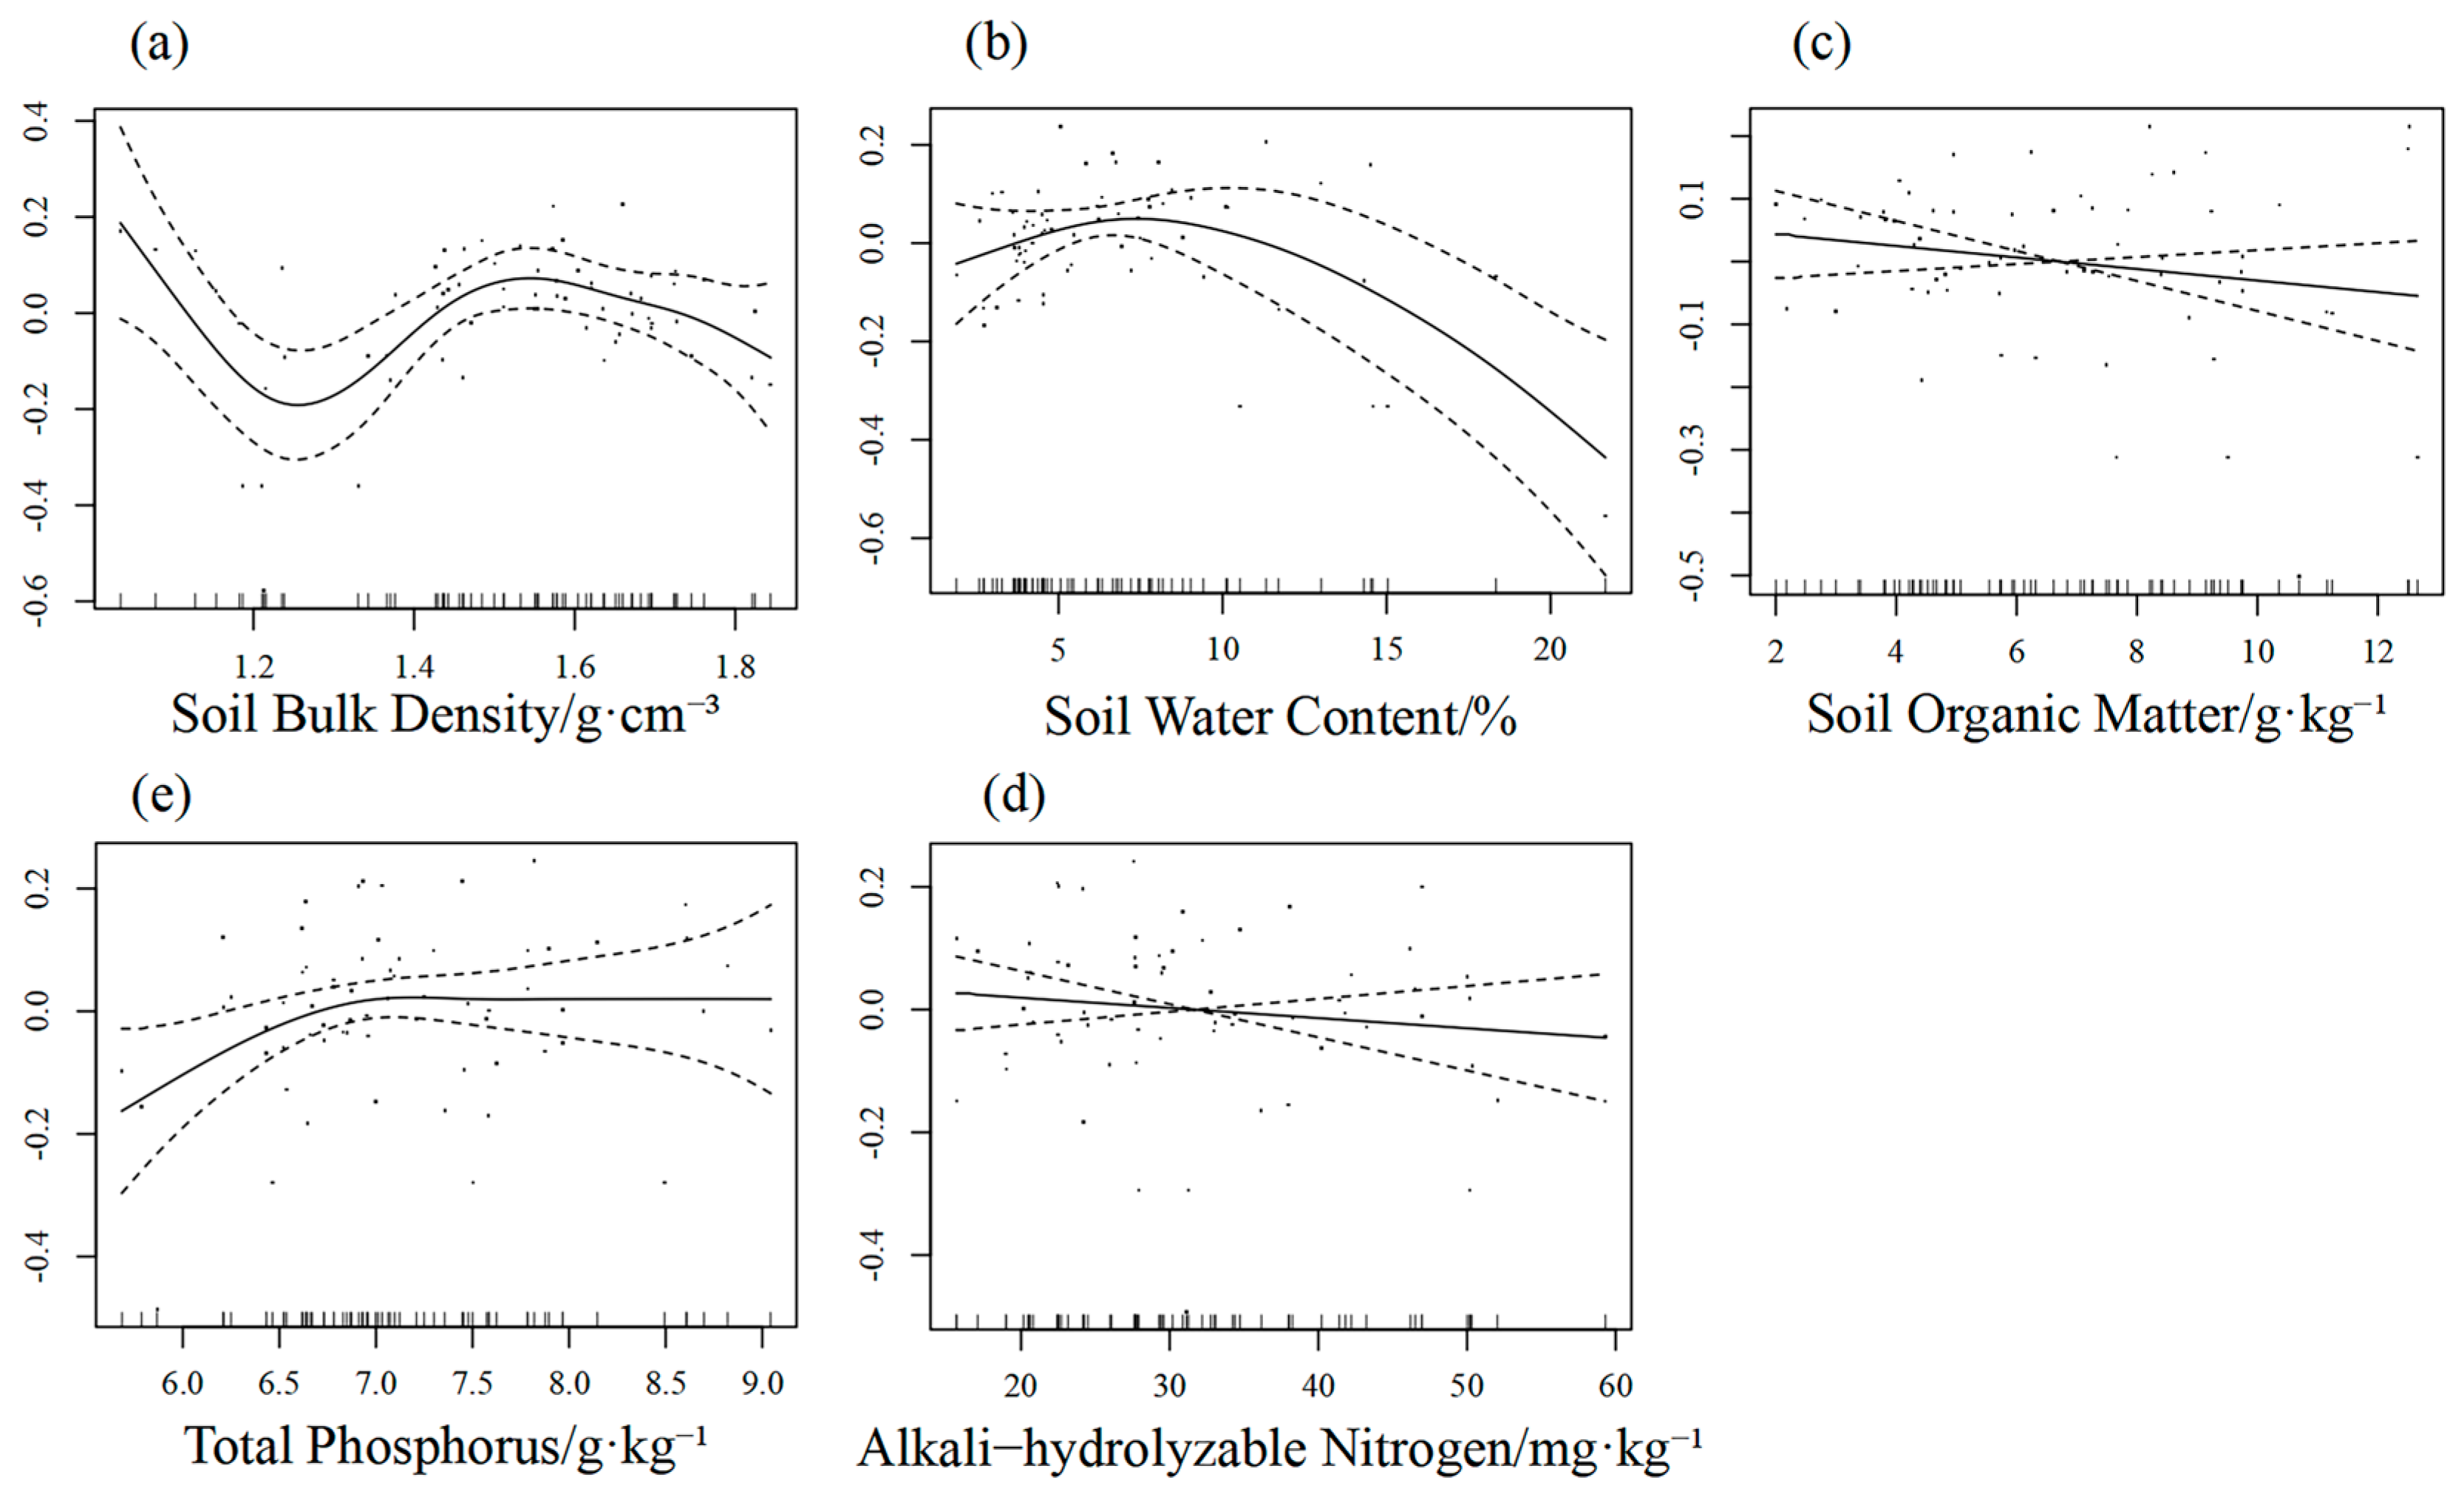
The GAM results indicate (Table S1, Figure 10a–e) a significant nonlinear relationship between the Margalef richness index and SWC (p < 0.05, edf = 1.45), with deviance at 74% and a nonlinear decreasing trend as SWC increases. Smoothing terms for the remaining factors were non-significant, though the models’ R2 values ranged from 0.67 to 0.71, with deviance between 71% and 72%.
In terms of fixed effects, the 13 year operational year exhibited a positive effect across all models, whilst the 1 year operational year showed a negative effect in the SWC, SOM, TP, and AN models. Regarding microenvironmental factors, FP demonstrated a positive effect in some models, whereas BP and IP exhibited negative effects in the majority of models.
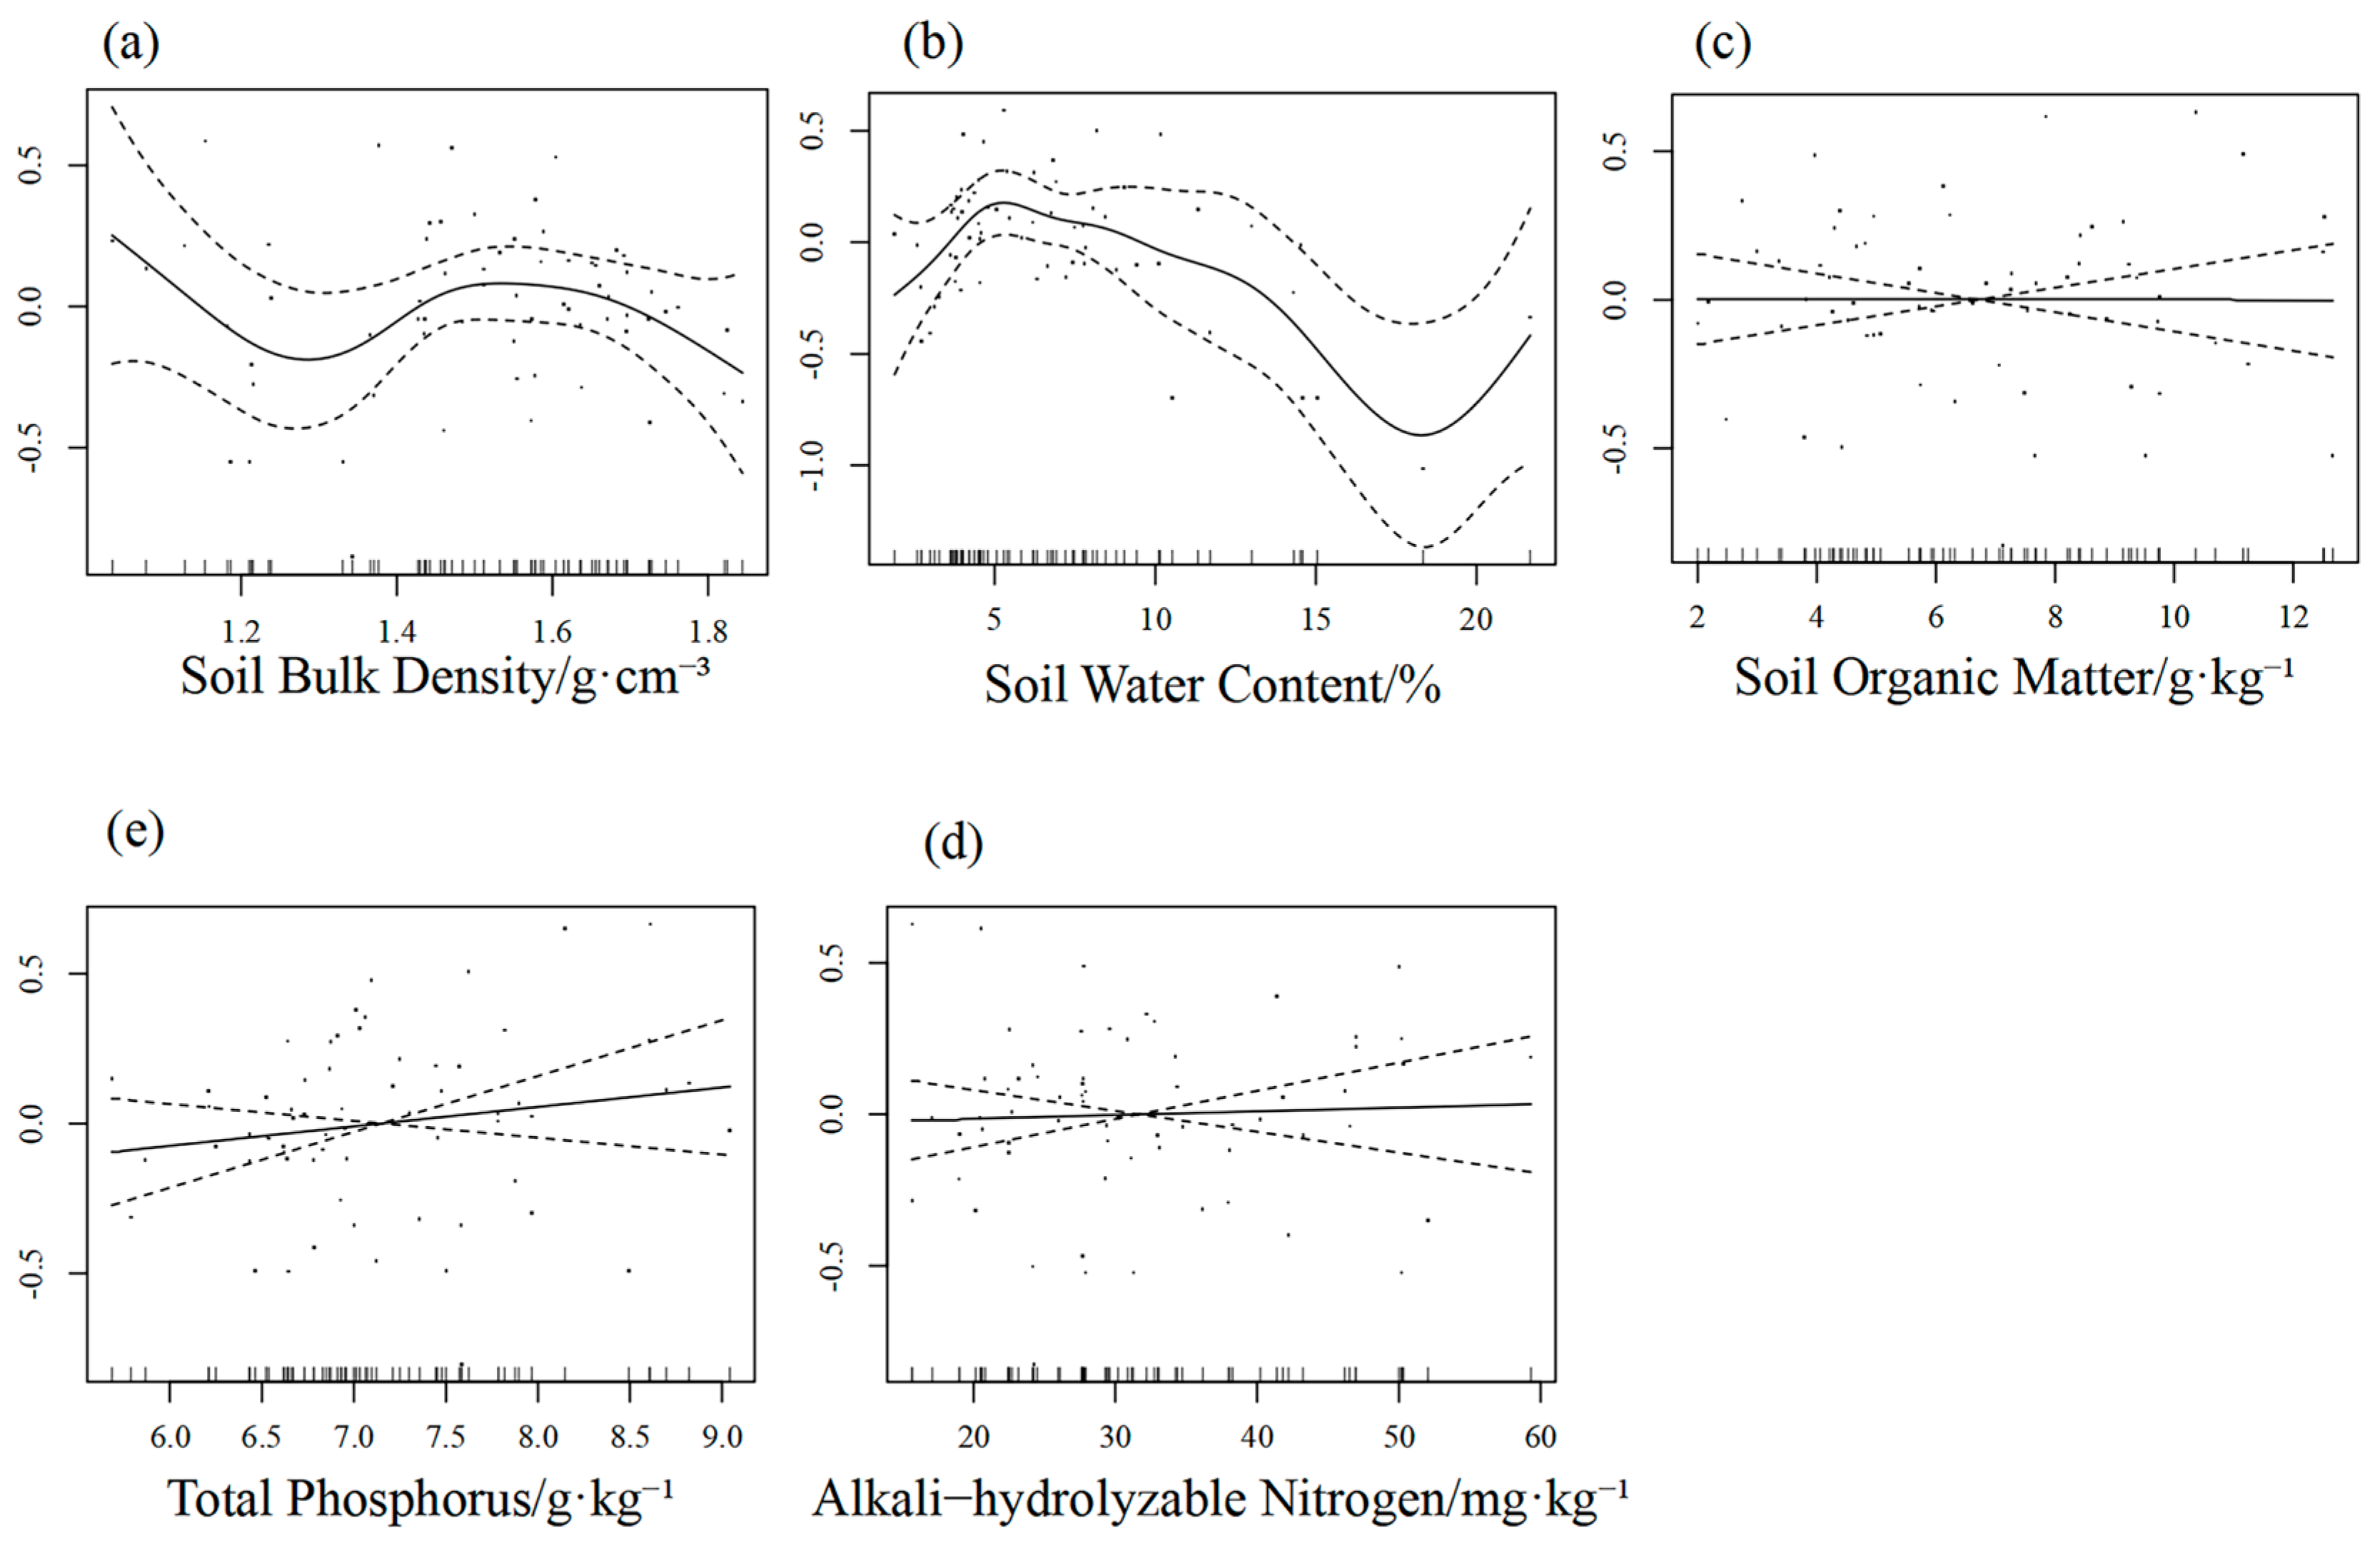
The GAM results (Table S1, Figure 11a–e) indicate a significant nonlinear relationship between Shannon−Wiener diversity indices and SWC (p < 0.01, edf = 5.98), with 80% deviance. This relationship exhibits complex nonlinear fluctuations as SWC increases. Smoothing terms for the remaining soil factors were non-significant, though model R2 ranged from 0.63 to 0.75 with deviance values between 67% and 73%.
In the fixed effects model, the 1 year operational year exhibited a negative effect across all models. Regarding microenvironmental factors, FP demonstrated a positive effect in some models, while BP and IP showed negative effects in the majority of models. UP also exhibited a negative effect in certain models.
The GAM results indicate (Table S1, Figure 12a–e) that the Pielou uniformity index exhibits significant relationships with BD (edf = 2.54) and SOM (p < 0.05, edf = 1), accounting for 44% and 32% of deviance, respectively. The Pielou uniformity index exhibited nonlinear fluctuations as BD and SOM increased. The smoothing terms for the remaining soil factors were insignificant, with relatively low R2 values ranging from 0.17 to 0.35.
In the fixed effects model, the 1 year operational year exhibited negative effects across all BD, SOM, TP, and AN models. Regarding microenvironmental factors, IP demonstrated negative effects in all models, while UP also showed negative effects in certain models.
The GAM results indicate (Table S1, Figure 13a–e) that a significant nonlinear relationship exists between the Simpson dominance index and BD (edf = 4.87) and SWC (p < 0.01, edf = 2.61), with deviances of 67% and 67%, respectively. The smoothing terms for the remaining soil factors were non-significant, with R2 values ranging between 0.45 and 0.50.
In the fixed effects model, the 1 year operational year exhibited a negative effect across all BD, SWC, SOM, TP, and AN models, while the 7 year operational year also demonstrated a negative effect in the BD and SWC models. Regarding microenvironment, UP yielded a negative effect in all models.

4. Discussion

4.1. The Impact of Different Operating Years and Microenvironments on Plant Community Characteristics

The findings of this study indicate that the extended operational lifespan of photovoltaic power stations and varying microenvironmental conditions jointly shape vegetation community characteristics. Operational duration primarily influences overall levels of canopy cover, aboveground biomass, and species diversity, whilst microenvironmental variations further modulate the spatial distribution patterns of these communities. The bulk density at one year of operation was significantly lower than that at seven and thirteen years, while soil water content peaked at one year and subsequently declined annually. This pattern not only reflects the relatively loose soil structure and strong water retention capacity during the early stages of restoration, but may also be associated with the incomplete development of vegetation root systems, limited surface water interception capacity, and higher early microbial activity and soil organic matter decomposition rates, resulting in an uneven distribution of resources [29]. This finding is consistent with the dynamic changes in community cover during succession in fenced desert areas of Gansu reported by Shang et al. [30] Microenvironmental variations indicate that SWC in the FP and UP zones consistently exceeds that in the BP and IP regions. The FP zone persistently maintains the lowest bulk density coupled with the highest SWC. This outcome may stem from the foreland topography’s convergence effect on runoff and precipitation, while the shading effect reduces soil evaporation and enhances water retention capacity, thereby establishing more favourable microenvironmental conditions [31]. This microtopographical effect has also been validated in studies by Vervloesem et al. [32] concerning the influence of microenvironmental gradients in photovoltaic array areas upon vegetation patterns.
Community diversity increases with operational duration, potentially reflecting the gradual stabilisation and maturation of community structure as vegetation recovers. This process is characterised by the balancing of interspecific competition, enhanced resource utilisation efficiency, and the progressive unfolding of functional group replacement [33]. Diversity in the FP zone has consistently remained high, whereas the IP zone exhibits the lowest levels. This may be attributed to microtopography and shading from photovoltaic panels, which locally influence light exposure, water accumulation, and soil nutrient distribution, thereby exerting spatial regulation on community diversity formation [34,35]. During 1 year of operation, community evenness exhibited considerable fluctuations, particularly in the UP and IP zones, reflecting uneven resource allocation and unstable species competitive relationships within the early-stage vegetation community. As vegetation cover increased and root systems developed, microenvironmental resources were progressively utilised more equitably, thereby promoting the stabilisation of interspecific competitive relationships [36]. In the FP and BP zones with 13 years of operation, the degree of dominance markedly increased. This may be attributable to certain more adaptable species gradually occupying ecological niches within microhabitats characterised by superior light, moisture, and nutrient conditions [37]. This phenomenon reflects the mechanistic processes of interspecific competition and functional group replacement during long-term recovery [38].

4.2. The Impact of Different Operating Years and Microenvironment Types on Soil Physical and Chemical Properties

Research findings indicate that as photovoltaic power stations operate over extended periods, the physicochemical properties of the soil gradually exhibit a stabilising trend, with discernible variations emerging between different microenvironmental types. The bulk density at 1 year of operation was significantly lower than that at 7 and 13 years. SWC peaked at 1 year of operation before declining progressively later. This pattern not only reflects the relatively loose soil structure and strong water retention capacity during the early stages of restoration [39], but may also be related to the insufficient development of vegetation root systems, limited surface water interception capacity, and higher early microbial activity and soil organic matter decomposition rates, leading to an imbalance in resource allocation [40]. As vegetation cover increases and root systems expand, soil gradually becomes compacted, leading to enhanced water seepage and transpiration, thereby diminishing its water-holding capacity. This process is consistent with the research by Hua et al. [41] on the evolution of soil compaction and water dynamics within the context of vegetation succession in semi-arid regions. Microenvironmental variations indicate that SWC in the FP and UP zones consistently exceeds that in the BP and IP zones. The FP zone persistently maintains the combination of lowest BD and highest SWC. This outcome may stem from the convergence effect of runoff and precipitation on the foreslope terrain, coupled with the shading effect which reduces soil evaporation and enhances water retention capacity, thereby establishing more favourable microenvironmental conditions [42]. In comparison, the IP zone exhibited the weakest recovery of SWC conditions and structure, which may be attributed to higher soil exposure, difficulties in effectively pooling runoff, and intensified wind erosion [43]. It is demonstrated that under photovoltaic arrays, localised microtopography and moisture redistribution processes can significantly influence soil recovery, reflecting the potential for photovoltaic panel layouts to regulate the soil’s physical environment [44]. This mechanism has been validated in studies by Mulla et al. [45].
Regarding SOM and TK contents, the 1 year operational period generally exhibited higher values, whereas the 7 year and 13 year periods showed declines, indicating rapid initial SOM accumulation that later stabilised. This stabilisation may stem not only from the equilibrium between vegetation cover and biomass input but may also be modulated by microbial mineralisation and minor erosion processes, thereby influencing nutrient dynamics and soil structural stability [46,47]. This is consistent with the findings of Zhao et al. [48] on soil nutrient succession in arid regions. At the microenvironmental level, organic matter and total potassium content in the UP and BP zones have consistently been higher than in other microenvironments over the long term. This may be related to the topographical location and light conditions being conducive to organic matter deposition and nutrient accumulation [49]. This may also reflect the role of microtopography in regulating soil microclimate and microbial activity, thereby enhancing soil nutrient stability in these areas and providing sustained support for community recovery [50]. There were no significant differences in the availability of readily assimilable nutrients such as AN, AK, and AP across different operational years and microenvironments. This may not only relate to short-term soil microclimate and root uptake, but also reflect that during the early recovery phase, such nutrient cycling is regulated by microbial mineralisation and rapid leaching processes. Its dynamic characteristics may exert potential influences on the initial growth of vegetation communities and species’ competitive patterns [51,52].

4.3. Relationship Between Plant Community Characteristics and Soil Physical and Chemical Properties

In desert photovoltaic zones, the coupled relationship between vegetation community characteristics and soil physicochemical properties not only reflects the spatial patterns of community succession but also reveals the potential regulatory effects of water, nutrients, and microtopography on community structure. Correlation analysis indicates that community indicators at different restoration stages exhibit significant differences in sensitivity to soil variables. In power stations with 1 year of operation, the Pielou uniformity index showed a negative correlation with BD, while the Simpson dominance index exhibited a significant negative correlation with SWC. This indicates that the establishment of initial vegetation may be constrained by soil physical structure and water availability [53]. By 7 years of operation, Margalef richness indices and Shannon–Wiener diversity indices exhibited greater sensitivity to SWC, whilst the Simpson dominance index showed a positive correlation with AP. This indicates that plants respond to variations in water and nutrients by adjusting interspecific competition and root absorption strategies [54]. After 13 years of operation, both canopy cover and aboveground biomass exhibited significant positive responses to SWC, TN, and AN, whilst their relationship with SOM and TP shifted to negative correlations. This indicates that community regulatory mechanisms transitioned from an early phase dominated by physical stress towards complex interactions driven by both water and nutrients [55].
VPA further supports the dynamic coupling relationship between the community and soil factors. Over the 13-year study period, soil factors explained 71.9% of the variation in vegetation characteristics. This indicates that soil conditions increasingly influence community structure during long-term recovery processes [56]. Among these, SOM serves as a core variable throughout all recovery stages. This indicates its sustained role in maintaining community structural stability and functional support [57]. This indicates that soil conditions play a significant role in the succession of vegetation communities, while changes in community characteristics can in turn influence soil moisture and nutrient status, forming a self-reinforcing feedback mechanism [58]. GAM results indicate that community characteristics exhibit nonlinear responses to soil variables, with SWC showing an upward trend across all community characteristics. This further underscores the pivotal role of water as a key limiting factor in arid ecosystems, demonstrating that water can exert significant regulatory effects on soil feedback by influencing community structure and function [59]. The explanatory power of SOM peaks after one year of operation and gradually diminishes as the restoration period extends. This may be attributed to the rapid accumulation of SOM in the early stages and the pronounced influence of root expansion on initial community growth [60].

5. Conclusions

  • The long-term operation of photovoltaic power stations in temperate deserts promotes vegetation restoration, notably enhancing ground cover, aboveground biomass, and species diversity. In photovoltaic planning and management, full consideration should be given to ecological restoration potential, prioritising the protection and enhancement of vegetation structures in areas demonstrating long-term stability.
  • Microenvironmental variations exert a pronounced regulatory effect on vegetation recovery, with the FP zone exhibiting superior restoration outcomes while vegetation in the IP zone remains constrained. Optimising inter-panel spacing, slope orientation, and drainage conditions within photovoltaic layout designs mitigates growth limitations in the inter-panel areas.
  • Soil water content (SWC) and soil organic matter (SOM) are key factors in vegetation restoration. Combining water management strategies (such as interception, catchment, or recharge measures) with SOM accumulation approaches (such as mulching or localised fertilisation) can enhance the stability and sustainability of desert ecosystems.

Supplementary Materials

The following supporting information can be downloaded at: https://www.mdpi.com/article/10.3390/agriculture15192097/s1. Table S1: GAM results for soil factors and vegetation attributes.

Author Contributions

Conceptualisation, X.L. and T.C.; Methodology, Y.Y.; Software, Y.Y.; Validation, Y.Y., X.L. and S.M.; Formal Analysis, Y.Y.; Investigation, Y.Y., Y.T. and Q.L.; Resources and Data Curation, Y.Y., Z.C. and L.Z.; Writing—Original Draft Preparation, Y.Y.; Writing—Review and Editing, X.L., J.X. and Y.S.; Visualisation, Y.Y.; Supervision, X.L.; Project Administration, X.L., J.X. and Y.S.; Funding Acquisition, X.L., J.X. and Y.S. All authors have read and agreed to the published version of the manuscript.

Funding

This study was supported by Scope of the Shagehuang New Energy Base’s desertification prevention, control, and ecological restoration area, including wind and sand transport, new materials and technologies, and integrated technology demonstration research (GSAU-JSFW-2024-116), Grassland Monitoring and Evaluation in Gansu Province (GSZYTC-ZCJC-21010), Key Laboratory of Grassland Ecosystem at the Ministry of Education and Gansu Agricultural University: Project Announcement and Leadership Selection (KLGE-2024-01). National Natural Science Foundation of China (32301326).

Institutional Review Board Statement

Not applicable.

Data Availability Statement

The raw data supporting the conclusions of this article will be made available by the authors without undue reservation.

Acknowledgments

The authors would like to thank the editors and reviewers for providing valuable comments for improving the manuscript.

Conflicts of Interest

Authors Tao Chen, Ya Tian and Zhaoshan Cai were employed by the company Huadian Gansu Energy Corporation Limited, Authors Shijun Ma, Qing Li and Lijun Zhao were employed by the company Powerchina Beijing Engineering Corporation Limited. The remaining authors declare that the research was conducted in the absence of any commercial or financial relationships that could be construed as a potential conflict of interest.

References

  1. Prăvălie, R. Drylands Extent and Environmental Issues: A Global Approach. Earth-Sci. Rev. 2016, 161, 259–278. [Google Scholar] [CrossRef]
  2. Huang, J.; Zhang, G.; Zhang, Y.; Guan, X.; Wei, Y.; Guo, R. Global Desertification Vulnerability to Climate Change and Human Activities. Land Degrad. Dev. 2020, 31, 1380–1391. [Google Scholar] [CrossRef]
  3. Li, Y.F.; Chen, L.; Li, X.B.; Zhang, Y.F.; Yang, X.G. Structural characteristics and ecological effects of shrub islands in desert grasslands. Grassl. Sci. 2018, 35, 2327–2335. [Google Scholar]
  4. Su, Y.Z.; Zhao, H.L.; Zhang, T.H.; Zhao, X.Y. Soil Properties Following Cultivation and Non-Grazing of Desertified Sandy Grassland in Horqin Sandy Land, Northern China. Soil Tillage Res. 2005, 82, 121–129. [Google Scholar]
  5. Li, X.R.; Jia, X.H.; Long, L.Q.; Zerbe, S. Effects of Biological Soil Crusts on Seed Bank, Germination and Establishment of Two Annual Plant Species in the Tengger Desert (N China). Plant Soil 2005, 277, 375–385. [Google Scholar] [CrossRef]
  6. Zhang, R.; Zhao, X.Y.; Li, G.; Wu, Y.; Liu, X. Review on Responses of Grassland Plant–Soil to Precipitation and Management Measures in Arid and Semi-Arid Areas of China. J. Desert Res. 2025, 45, 131–140. [Google Scholar]
  7. Liu, D.; Shiroyama, H. Development of Photovoltaic Power Generation in China: A Transition Perspective. Renew. Sustain. Energy Rev. 2013, 25, 782–792. [Google Scholar] [CrossRef]
  8. Wang, Y.; Liu, B.; Peng, H.; Jiang, Y. Locating the Suitable Large-Scale Solar Farms in China’s Deserts with Environmental Considerations. Sci. Total Environ. 2024, 955, 176911. [Google Scholar] [CrossRef]
  9. Turney, D.; Fthenakis, V. Environmental Impacts from the Installation and Operation of Large-Scale Solar Power Plants. Renew. Sustain. Energy Rev. 2011, 15, 3261–3270. [Google Scholar] [CrossRef]
  10. Choi, C.S.; Cagle, A.E.; Macknick, J.; Bloom, D.E.; Caplan, J.S.; Ravi, S. Effects of Revegetation on Soil Physical and Chemical Properties in Solar Photovoltaic Infrastructure. Front. Environ. Sci. 2020, 8, 140. [Google Scholar] [CrossRef]
  11. Liu, Y.; Ma, S.; Miao, Y.; Liu, Y.; Wei, S.; Su, J.; Hu, Y. Comparison of Tracking and Fixed Photovoltaic Systems for Soil Quality Improvement in Desert: A 5-Year Field Study. Sci. Total Environ. 2025, 997, 180221. [Google Scholar] [CrossRef] [PubMed]
  12. Liu, K.; Wang, B.; Zhang, F.G.; Wu, X.; Wang, R.; Zhang, F.; Jia, R.; Zhang, H.X.; Wei, L.; Dong, L.; et al. Ecological Effects of Photovoltaic Power Plant Construction: Progress and Prospects of Desert Photovoltaic Sand Control. China Deserts 2025, 45, 277–291. [Google Scholar]
  13. Tanner, K.E.; Moore-O’Leary, K.A.; Parker, I.M.; Pavlik, B.M.; Hernandez, R.R. Simulated Solar Panels Create Altered Microhabitats in Desert Landforms. Ecosphere 2020, 11, e03089. [Google Scholar] [CrossRef]
  14. Walston, L.J.; Li, Y.; Hartmann, H.M.; Macknick, J.; Hanson, A.; Nootenboom, C.; Lonsdorf, E.; Hellmann, J. Modeling the Ecosystem Services of Native Vegetation Management Practices at Solar Energy Facilities in the Midwestern United States. Ecosyst. Serv. 2021, 47, 101227. [Google Scholar] [CrossRef]
  15. Armstrong, A.; Ostle, N.J.; Whitaker, J. Solar Park Microclimate and Vegetation Management Effects on Grassland Carbon Cycling. Environ. Res. Lett. 2016, 11, 074016. [Google Scholar] [CrossRef]
  16. Fagnano, M.; Fiorentino, N.; Visconti, D.; Baldi, G.M.; Falce, M.; Acutis, M.; Genovese, M.; Di Blasi, M. Effects of a Photovoltaic Plant on Microclimate and Crops’ Growth in a Mediterranean Area. Agronomy 2024, 14, 466. [Google Scholar] [CrossRef]
  17. Qi, D.; Zhao, X.; Zhang, N.; Yang, Z.; Chen, Y.; Chen, K. Mechanistic Insights into the Influences of Photovoltaic Panel Construction on Algal Crust Microbial Communities in Alpine Desert Grasslands. Front. Environ. Sci. 2025, 13, 1552071. [Google Scholar] [CrossRef]
  18. Li, S.; Zhao, J.D.; Li, Z.D.; Zhang, F.; Bai, J.H.; Yang, X.H. Research Progress on Ecological Impacts of Photovoltaic Systems in Desert, Gobi, and Arid Regions. J. Environ. Eng. Technol. 2025, 15, 709–716. [Google Scholar]
  19. Xia, Z.; Li, Y.; Guo, S.; Chen, R.; Zhang, W.; Guo, X.; Zhang, X.; Du, P. Satellites Reveal Spatial Heterogeneity in Dryland Photovoltaic Plants’ Effects on Vegetation Dynamics. Earth’s Future 2024, 12, e2024EF004427. [Google Scholar] [CrossRef]
  20. Wu, W.; Chen, H.; Li, C.; Lu, G.; Ye, D.; Ma, C.; Ren, L.; Li, G. Assessment of the Ecological and Environmental Effects of Large-Scale Photovoltaic Development in Desert Areas. Sci. Rep. 2024, 14, 22456. [Google Scholar] [CrossRef] [PubMed]
  21. Ma, Q.; Dong, B.; Xu, W.; Cai, L.; Wu, J. Evaluation of Farmland Quality Grades and Analysis of Soil Nutrients and Salinization in Arid Areas: A Case Study of Minqin Oasis. Arid. Zone Geogr. 2021, 44, 514–524. [Google Scholar]
  22. Curtis, J.T.; McIntosh, R.P. The Interrelations of Certain Analytic and Synthetic Phytosociological Characters. Ecology 1950, 31, 434–455. [Google Scholar] [CrossRef]
  23. Bao, P.A.; Qiu, K.Y.; Huang, Y.Y.; Wang, S.Y.; Cui, L.Y.; Luo, X.Y.; Yang, Y.T.; Xie, Y.Z. Leaf Functional Traits and Their Plasticity of Desert Grassland Plants under Nitrogen and Phosphorus Addition. Acta Prataculturae Sin. 2024, 33, 97–106. [Google Scholar]
  24. Chinese Academy of Sciences Nanjing Institute of Soil Science. Physicochemical Analysis of Soil; Shanghai Scientific and Technical Publishers: Shanghai, China, 1978; pp. 380–511. [Google Scholar]
  25. Bao, S.D. Soil and Agricultural Chemistry Analysis, 3rd ed.; China Agriculture Press: Beijing, China, 2000; pp. 25–106. [Google Scholar]
  26. Ma, Q.L.; Chen, F.; Yang, H.T.; Zhang, Z.; Li, D.L.; Zhang, J.C.; Li, X.R.; Yuan, H.B. Vegetation Characteristics of the Tengger Desert. China Deserts 2020, 40, 223–233. [Google Scholar]
  27. Wang, H.; He, K.N.; Hu, X.B.; Wang, W.W.; Wang, X.; Li, Y. Effects of Different Tree Species Configurations on Understory Vegetation Diversity in Alpine Areas. Res. Soil Water Conserv. 2012, 19, 147–150. [Google Scholar]
  28. Ma, K.P. Methods for Measuring Biodiversity of Biological Communities. I. Methods for Measuring α-Diversity (Part I). Biodiversity 1994, 2, 162–168. [Google Scholar]
  29. Catano, C.P.; Bassett, T.J.; Bauer, J.T.; Grman, E.; Groves, A.M.; Zirbel, C.R.; Brudvig, L.A. Soil resources mediate the strength of species but not trait convergence across grassland restorations. J. Appl. Ecol. 2022, 59, 384–393. [Google Scholar] [CrossRef]
  30. Shang, X.; Wang, Y.; Huo, Y.; Shi, Z.; Li, H.; Zhang, H.; Guo, H.; Zhang, X. Climatic and Ecological Impact Mechanisms and Vegetation Restoration Patterns of Cen-tralized Desert Photovoltaic Power Stations. Soil Water Conserv. 2025, 23, 10–20. [Google Scholar]
  31. Li, C.; Liu, J.; Bao, J.; Wu, T.; Chai, B. Effect of light heterogeneity caused by photovoltaic panels on the plant–soil–microbial system in solar park. Land 2023, 12, 367. [Google Scholar] [CrossRef]
  32. Vervloesem, J.; Marcheggiani, E.; Choudhury, M.A.M.; Muys, B. Effects of Photovoltaic Solar Farms on Microclimate and Vegetation Diversity. Sustainability 2022, 14, 7493. [Google Scholar] [CrossRef]
  33. Luo, X.; Xie, Y.; Yue, S.; Yang, M.; Han, C.; Zhao, Y.; Zhao, Y.; Li, J. Plant species richness enhances aboveground primary productivity via net biodiversity effects and bacterial community interactions. Appl. Soil Ecol. 2025, 209, 106052. [Google Scholar] [CrossRef]
  34. Bai, Z.; Jia, A.; Bai, Z.; Qu, S.; Zhang, M.; Kong, L.; Sun, R.; Wang, M. Photovoltaic Panels Have Altered Grassland Plant Biodiversity and Soil Microbial Diversity. Front. Microbiol. 2022, 13, 1065899. [Google Scholar] [CrossRef]
  35. Lafitte, A.; Sordello, R.; Ouédraogo, D.Y.; Thierry, C.; Marx, G.; Froidevaux, J.; Schatz, B.; Kerbiriou, C.; Gourdain, P.; Reyjol, Y. Existing Evidence on the Effects of Photovoltaic Panels on Biodiversity: A Systematic Map with Critical Appraisal of Study Validity. Environ. Evid. 2023, 12, 25. [Google Scholar] [CrossRef] [PubMed]
  36. Escobedo, V.M.; Rios, R.S.; Gianoli, E. Interactive effects of shading and disturbance on plant invasion in an arid shrubland: Assembly processes and CSR-strategies. J. Ecol. 2021, 109, 2405–2420. [Google Scholar] [CrossRef]
  37. Ma, Y.; Xu, F.; Wei, J.; Wang, W.; Wu, Z.; Xu, D.; Haider, F.U.; Li, X.; Dong, Y. Ecological Restoration Increases the Diversity of Understory Vegetation in Secondary Forests: Evidence from 90 Years of Forest Closures. Forests 2024, 15, 1642. [Google Scholar] [CrossRef]
  38. Barber, N.A.; Jones, H.P.; Duvall, M.R.; Wysocki, W.P.; Hansen, M.J.; Gibson, D.J. Phylogenetic Diversity Is Maintained Despite Richness Losses over Time in Restored Tallgrass Prairie Plant Communities. J. Appl. Ecol. 2017, 54, 137–144. [Google Scholar] [CrossRef]
  39. Moscatelli, M.C.; Marabottini, R.; Massaccesi, L.; Marinari, S. Soil Properties Changes after Seven Years of Ground Mounted Photovoltaic Panels in Central Italy Coastal Area. Geoderma Reg. 2022, 29, e00500. [Google Scholar] [CrossRef]
  40. Tariq, A.; Graciano, C.; Sardans, J.; Zeng, F.; Hughes, A.C.; Ahmed, Z.; Ullah, A.; Ali, S.; Gao, Y.; Peñuelas, J. Plant root mechanisms and their effects on carbon and nutrient accumulation in desert ecosystems under changes in land use and climate. New Phytol. 2024, 242, 916–934. [Google Scholar] [CrossRef]
  41. Hua, Y.; Chai, J.; Chen, L.; Liu, P. The Influences of the Desert Photovoltaic Power Station on Local Climate and Environment: A Case Study in Dunhuang Photovoltaic Industrial Park, Dunhuang City, China in 2019. Atmosphere 2022, 13, 1235. [Google Scholar] [CrossRef]
  42. Yue, S.; Guo, M.; Zou, P.; Wu, W.; Zhou, X. Effects of photovoltaic panels on soil temperature and moisture in desert areas. Environ. Sci. Pollut. Res. 2021, 28, 17506–17518. [Google Scholar] [CrossRef]
  43. Meng, R.; Meng, Z.; Jia, R.; Li, H.; Cai, J.; Gao, Y. Positive soil responses to different vegetation restoration measures in desert photovoltaic power stations. Front. Plant Sci. 2025, 16, 1607404. [Google Scholar] [CrossRef] [PubMed]
  44. Wu, C.; Liu, H.; Yu, Y.; Zhao, W.; Liu, J.; Yu, H.; Yetemen, O. Ecohydrological effects of photovoltaic solar farms on soil microclimates and moisture regimes in arid Northwest China: A modeling study. Sci. Total Environ. 2022, 802, 149946. [Google Scholar] [CrossRef] [PubMed]
  45. Mulla, D.; Galzki, J.; Hanson, A.; Šimůnek, J. Measuring and Modeling Soil Moisture and Runoff at Solar Farms Using a Disconnected Impervious Surface Approach. Vadose Zone J. 2024, 23, e20335. [Google Scholar] [CrossRef]
  46. Liang, Y.; Leifheit, E.F.; Lehmann, A.; Rillig, M.C. Soil organic carbon stabilization is influenced by microbial diversity and temperature. Sci. Rep. 2025, 15, 13990. [Google Scholar] [CrossRef] [PubMed]
  47. Wang, X.; Wang, C.; Fan, X.; Sun, L.; Sang, C.; Wang, X.; Jiang, P.; Fang, Y.; Bai, E. Mineral composition controls the stabilization of microbially derived carbon and nitrogen in soils: Insights from an isotope tracing model. Glob. Change Biol. 2024, 30, e17156. [Google Scholar] [CrossRef]
  48. Zhao, L.; Xu, S.; Zhao, J.; Chen, S.; Liu, X.; Zheng, X.; Wang, X.; Zhu, Z.; Gao, F.; Fu, B.; et al. Soil Microbial Networks’ Complexity as a Primary Driver of Multifunctionality in Photovoltaic Power Plants in the Northwest Region of China. Front. Microbiol. 2025, 16, 1579497. [Google Scholar] [CrossRef]
  49. Zhang, Z.; Ai, N.; Liu, G.; Liu, C.; Qiang, F. Soil quality evaluation of various microtopography types at different restoration modes in the loess area of Northern Shaanxi. Catena 2021, 207, 105633. [Google Scholar] [CrossRef]
  50. Zhang, M.; Fu, L.; Ma, D.; Wang, X.; Liu, A. Effects of Microtopography on Soil Microbial Community Structure and Abundance in Permafrost Peatlands. Microorganisms 2024, 12, 867. [Google Scholar] [CrossRef]
  51. Lv, Y.; Fan, R.; Zhao, Y.; Chen, H.; Wu, H.; Huang, H.; Cheng, Y.; Liu, X.; Guo, M. Field study of compound microbial agents for soil improvement and microbial community dynamics on rocky slopes in Southwest China. Sci. Rep. 2025, 15, 33086. [Google Scholar] [CrossRef]
  52. Yue, S.; Wu, W.; Yuan, B.; Ye, D.; Bai, W. Large-Scale Photovoltaic Farms Significantly Change the Vegetation Diversity and Biomass through Influencing Soil Moisture and Physiochemical Properties. Vadose Zone J. 2025, 24, e70002. [Google Scholar] [CrossRef]
  53. Zhou, M.R.; Wang, X.J. Effects of Photovoltaic Power Station Construction on Soil and Vegetation: A Case Study in the Desert and Gobi Area of Hexi Corridor, Gansu. Sci. Soil Water Conserv. 2019, 17, 132–138. [Google Scholar]
  54. Bao, P.A.; Ji, B.; Sun, G.; Zhang, N.; Wu, X.D.; He, J.L.; Wang, Z.J.; Tian, Y. Effects of Photovoltaic Power Station Construction on Plant Communities and Soil Properties. Acta Prataculturae Sin. 2024, 33, 23–33. [Google Scholar]
  55. Zhang, S.; Gong, J.; Zhang, W.; Dong, X.; Hu, Y.; Yang, G.; Wang, T. Photovoltaic Systems Promote Grassland Restoration by Coordinating Water and Nutrient Uptake, Transport and Utilization. J. Clean. Prod. 2024, 447, 141437. [Google Scholar] [CrossRef]
  56. Zhao, W.; Zhao, J.; Liu, M.; Gao, Y.; Li, W.; Duan, H. Vegetation restoration increases soil carbon storage in land disturbed by a photovoltaic power station in semi-arid regions of Northern China. Agronomy 2023, 14, 9. [Google Scholar] [CrossRef]
  57. Butterfield, B.J.; Briggs, J.M. Patch Dynamics of Soil Biotic Feedbacks in the Sonoran Desert. J. Arid Environ. 2009, 73, 96–102. [Google Scholar] [CrossRef]
  58. Van der Putten, W.H.; Bardgett, R.D.; Bever, J.D.; Bezemer, T.M.; Casper, B.B.; Fukami, T.; Kardol, P.; Klironomos, J.N.; Kulmatiski, A.; Schweitzer, J.A.; et al. Plant–soil feedbacks: The past, the present and future challenges. J. Ecol. 2013, 101, 265–276. [Google Scholar] [CrossRef]
  59. Schlesinger, W.H.; Reynolds, J.F.; Cunningham, G.L.; Huenneke, L.F.; Jarrell, W.M.; Virginia, R.A.; Whitford, W.G. Biological Feedbacks in Global Desertification. Science 1990, 247, 1043–1048. [Google Scholar] [CrossRef]
  60. Chen, X.; Chen, B.; Wang, Y.; Zhou, N.; Zhou, Z. Response of vegetation and soil property changes by photovoltaic established stations based on a comprehensive meta-analysis. Land 2024, 13, 478. [Google Scholar] [CrossRef]
Figure 1. Overview of study area.
Agriculture 15 02097 g001
Figure 2. Ground cover conditions in photovoltaic power station study area. Note: (a) Vegetation restoration at 13 year power station; (b) vegetation restoration at 7 year power station; (c) vegetation restoration at 1 year power station.
Agriculture 15 02097 g002
Figure 3. Sample point layout diagram. Note: The native area (CK) serves as a common control, with environmental conditions similar to those of the power station area and no human interference. The photovoltaic power station area is subdivided into micro-environments: front eave of photovoltaic panels (FP; the area where photovoltaic panels face the sun); back eave of photovoltaic panels (BP; the shaded area on the later side of photovoltaic panels); underneath photovoltaic panels (UP; the area beneath the photovoltaic panels); and interval between photovoltaic panels (IP; the gap between adjacent photovoltaic panels).
Agriculture 15 02097 g003
Figure 4. Effects of different operational years and microenvironment types on vegetation community characteristics. Note: ** indicates p < 0.01, * indicates p < 0.05. (a) Vegetation cover two-factor analysis; (b) Aboveground biomass two-factor analysis; (c) Margalef richness index two-factor analysis; (d) Shannon–Wiener diversity index two-factor analysis; (e) Pielou index two-factor analysis; (f) Simpson index two-factor analysis.
Agriculture 15 02097 g004
Figure 5. Influence of different operational years and microenvironment types on soil properties. Note: ** indicates p < 0.01, * indicates p < 0.05. (a) Soil bulk density two-factor analysis; (b) soil water content two-factor analysis; (c) Soil pH two-factor analysis; (d) Soil organic matter two-factor analysis; (e) Total nitrogen two-factor analysis; (f) Total potassium two-factor analysis; (g) Total phosphorus two-factor analysis; (h) Alkali−hydrolysable nitrogen two-factor analysis; (i) Available potassium two-factor analysis; (j) Available phosphorus two-factor analysis.
Agriculture 15 02097 g005
Figure 6. Correlation analysis between plant community characteristics and soil factors. Note: TC, total coverage; AGB, aboveground biomass; BD, bulk density; SWC, soil water content; pH value, pH; SOM, soil organic matter; TN, total nitrogen; TP, total phosphorus; TK, total potassium; AN, alkali−hydrolysable nitrogen; AP, available phosphorus; AK, available potassium. *: p ≤ 0.05; **: p ≤ 0.01. (a) Analysis of Vegetation–Soil Correlations over 13 Years Power Station; (b) Analysis of Vegetation–Soil Correlations over 7 Years Power Station; (c) Analysis of Vegetation–Soil Correlations over 1 Years Power Station.
Agriculture 15 02097 g006
Figure 7. Principal component analysis of plant community characteristics and soil factors. Note: (a) Vegetation restoration at 13 year power station; (b) vegetation restoration at 7 year power station; (c) vegetation restoration at 1 year power station; TC, total coverage; AGB, aboveground biomass; BD, bulk density; SWC, soil water content; pH value, pH; SOM, soil organic matter; TN, total nitrogen; TP, total phosphorus; TK, total potassium; AN, alkali-hydrolysable nitrogen; AP, available phosphorus; AK, available potassium. The bar chart above indicates the percentage contribution of each factor combination to the total variance; The horizontal bar chart on the left indicates the independent contribution percentage of each individual factor; The central matrix represents factor combinations, with black dots indicating factors contained within each column. Connecting lines denote combinations where factors act simultaneously.
Agriculture 15 02097 g007
Figure 8. GAM response curves of soil factors on plant cover. (a) Soil bulk density; (b) Soil water content; (c) Soil organic matter; (d) Total phosphorus; (e) Alkali−hydrolyzable nitrogen. Solid lines represent fitted smooth functions, and dashed lines indicate 95% confidence intervals. Points show observed values.
Agriculture 15 02097 g008
Figure 9. GAM response curves of aboveground biomass to soil factors. (a) Soil bulk density; (b) Soil water content; (c) Soil organic matter; (d) Total phosphorus; (e) Alkali−hydrolyzable nitrogen. Solid lines represent fitted smooth functions, and dashed lines indicate 95% confidence intervals. Points show observed values.
Agriculture 15 02097 g009
Figure 10. GAM response curves of Margalef richness indices to soil factors. (a) Soil bulk density; (b) Soil water content; (c) Soil organic matter; (d) Total phosphorus; (e) Alkali−hydrolyzable nitrogen. Solid lines represent fitted smooth functions, and dashed lines indicate 95% confidence intervals. Points show observed values.
Agriculture 15 02097 g010
Figure 11. GAM response curves for Shannon−Wiener diversity indices in relation to soil factors. (a) Soil bulk density; (b) Soil water content; (c) Soil organic matter; (d) Total phosphorus; (e) Alkali−hydrolyzable nitrogen. Solid lines represent fitted smooth functions, and dashed lines indicate 95% confidence intervals. Points show observed values.
Agriculture 15 02097 g011
Figure 12. GAM response curves for Pielou uniformity indices in relation to soil factors. (a) Soil bulk density; (b) Soil water content; (c) Soil organic matter; (d) Total phosphorus; (e) Alkali−hydrolyzable nitrogen. Solid lines represent fitted smooth functions, and dashed lines indicate 95% confidence intervals. Points show observed values.
Agriculture 15 02097 g012
Figure 13. GAM response curves of Simpson dominance index to soil factors. (a) Soil bulk density; (b) Soil water content; (c) Soil organic matter; (d) Total phosphorus; (e) Alkali−hydrolyzable nitrogen. Solid lines represent fitted smooth functions, and dashed lines indicate 95% confidence intervals. Points show observed values.
Agriculture 15 02097 g013
Table 1. Site overview.
Sample TypeOperation Duration
/Year
AltitudeElevation
/m
Photovoltaic Power Plant Scale
/MWP
Panel Tilt Angle
Panel Spacing
/m
Tianhe Power Station1338°57′10″ N, 102°28′06″ E140050378
Yineng Power Station738°55′25″ N, 102°34′05″ E1398100378
Longyu Power Station138°53′12″ N, 102°32′53″ E1370200378
Table 2. Importance value of common species in photovoltaic arrays.
FamilySpeciesImportance Value
1371CK
FPUPBPIPFPUPBPIPFPUPBPIPCK
AsteraceaEchinops gmelinii0.030.04000.0100000000
Artemisia scoparia0.01000000000000
Heteropappus altaicus0.080.0700000000000
ChenopodiaceaeSalsola collina0.010.0100.030.01000.040.010000.02
Suaeda salsa0.180.160.240.290.10.220.130.160.120.160.10.160.18
Halogeton glomeratus0.0100000000.020.01000.02
ZygophyllaceaeTribulus terrestris0000000000000.02
Zygophyllum mucronatum0.010.030.030.020.010.030.020.0400000.09
Zygophyllum xanthoxylon0.190.090.050.10.0400.080000.0600.03
Nitraria tangutorum0.160.110.120.140.30.120.290.060.320.120.2300.15
Nitraria sphaerocarpa0.050.070.0600.160.080.05000.090.1200
PoaceaePuccinellia distans0.030.010.010.010.090.1400.0100000
Stipa glareosa0.040.13000.040.110000000
Cleistogenes songorica0.030.0500000000000
AmaryllidaceaeAllium mongolicum0.010.010.0100.010.010.01000000.02
PlantaginaceaePlantago minuta0.010.01000.010.030000000
TamaricaceaeReaumuria soongorica0.290.480.40.380.360.460.420.530.260.350.40.310.39
Disclaimer/Publisher’s Note: The statements, opinions and data contained in all publications are solely those of the individual author(s) and contributor(s) and not of MDPI and/or the editor(s). MDPI and/or the editor(s) disclaim responsibility for any injury to people or property resulting from any ideas, methods, instructions or products referred to in the content.