Article

Influence of Air Layer Characteristics on the Heat Transfer Performance of Photovoltaic Dairy Barn Roofs

1
College of Water Resources and Civil Engineering, China Agricultural University, Beijing 100083, China
2
Key Laboratory of Agricultural Engineering in Structure and Environment of Ministry of Agriculture and Rural Affairs, Beijing 100083, China
3
Institute of Animal Husbandry and Veterinary Medicine, Anhui Academy of Agricultural Sciences, Hefei 230031, China
4
Anhui Provincial Key Laboratory of Livestock and Poultry Product Safety, Hefei 230031, China
5
College of Animal Science and Technology, Shandong Agricultural University, Taian 271018, China
6
Beijing Engineering Research Center on Animal Healthy Environment, Beijing 100083, China
*
Author to whom correspondence should be addressed.
Agriculture 2025, 15(18), 1938; https://doi.org/10.3390/agriculture15181938
Submission received: 15 August 2025 / Revised: 8 September 2025 / Accepted: 11 September 2025 / Published: 12 September 2025

Abstract

To enhance energy utilization efficiency, dairy farmers have increasingly adopted photovoltaic (PV) panels on barn roofs. However, there is currently a general separation between the barn construction and the additional aspects of the PV system. It is unclear to dairy farmers whether rooftop PV panels will have an impact on the dairy barn, particularly on the thermal environment. This study investigated the influence of air layer properties, specifically thickness and ventilation conditions, on the thermal performance of PV dairy barn roofs. Utilizing the harmonic analysis method, the study quantified its dynamic thermal properties. The results demonstrated that increasing the air layer thickness in ventilated roofs decreases heat flux and improves thermal resistance (1.67–2.15 times higher than non-PV roofs). In contrast, sealed air layers exhibit consistently high thermal resistance (up to 3.33 times higher). Optimizing ventilated air layer thickness (0.20–0.30 m) effectively minimizes heat ingress and prevents PV efficiency degradation. These results provide valuable insights for optimizing the design of energy-efficient PV dairy barns, enhancing thermal comfort, and contributing to low-carbon energy solutions in livestock facilities.

Graphical Abstract

1. Introduction

Livestock systems contribute to 6.2 Gt CO2 equivalent emissions, constituting approximately 12 percent of all anthropogenic greenhouse gas (GHG) emissions [1]. Given this substantial contribution, integrating photovoltaic (PV) systems into dairy barns offers a promising approach to mitigate emissions while enhancing energy efficiency and thermal comfort for livestock. PV technology offers a sustainable solution to the growing global demand for clean energy. China is actively promoting a development model that integrates distributed PV systems into dairy operations [2]. As PV technology becomes more prevalent in agriculture, research has increasingly focused on PV barns. It is not clear to dairy farmers whether rooftop PV panels will have an impact on the dairy barn, particularly how roof configurations affect their internal thermal environments [3]. Building-attached photovoltaic (BAPV) systems create an insulating air layer between the panels and the roof, which primarily affects heat transfer through conduction, convection, and radiation, thereby influencing the overall thermal performance of the roof.
Studies on heat transfer through air layers in indoor environments have extensively examined the thermal behavior of these systems. Installing PV systems on existing building roofs can limit energy infiltration into interiors, thereby reducing heat gain and improving the thermal insulation performance of building envelopes [4]. The study of air layer characteristics in building envelopes holds significant theoretical and practical value. Research shows that air layers effectively regulate thermal environments: airflow removes heat and reduces roof surface temperature [5], with tilt angle and ventilation design critically affecting convective heat transfer efficiency [6]. Numerical simulations demonstrate that optimized air layer structures can reduce roof heat transfer by up to 30% [7] while providing dual functions of thermal insulation and heat dissipation [8]. These characteristics not only enhance building energy efficiency (reducing cooling loads by 15–40%) but also synergize with photovoltaic systems, proving crucial for achieving carbon-neutral buildings. Within agricultural applications, Tikul et al. optimized roof geometries and materials for tropical beef cattle barns [9]. Pan et al. performed comparative numerical simulations of thermal environments in farm buildings with diverse roof designs [10]. These studies collectively emphasize the need for further research on the thermal performance of PV dairy barn roofs.
Existing research primarily focuses on civil buildings, and studies on livestock housing are relatively scarce. Analysis of existing models indicates that livestock housing roofs often feature greater length and material diversity compared to conventional structures [11]. These characteristics significantly impact both fluid dynamics within air layers and roof heat transfer mechanisms. The elongated roof profile directly impacts boundary layer development, airflow velocity distribution, and thermal uniformity along the air channel. Current methodologies predominantly rely on computational fluid dynamics (CFD) simulations [12]. However, some studies use oversimplified approaches to calculate convective heat transfer coefficients [13,14]. Moreover, certain methodologies fail to adequately address the unique environmental and operational conditions of air layers in dairy barn roofs [15]. In parallel, China has prioritized the development of PV dairy farming systems in recent years. This initiative has sparked practical inquiries from agricultural stakeholders regarding the potential of PV systems to enhance thermal insulation performance in barn roof design. However, the specific impact of air layer characteristics on the thermal performance of PV dairy barn roofs remains underexplored, particularly in the context of varying air layer thickness. While prior studies have examined PV roofs in civil structures, critical knowledge gaps persist for livestock-specific applications—particularly regarding how extreme roof lengths impact air layer dynamics, and how material limitations constrain thermal regulation. Addressing these gaps is crucial for optimizing barn design, enhancing energy efficiency, and reducing carbon emissions in dairy farming operations.
For periodic temperature fluctuations in multilayer structures with complex boundary conditions, the harmonic analysis method is particularly suitable due to its ability to efficiently evaluate dynamic thermal performance while maintaining computational efficiency [16]. Compared to traditional steady-state analysis methods, harmonic analysis effectively captures transient heat transfer characteristics, making it especially applicable to non-steady-state thermal environment studies in agricultural buildings influenced by diurnal and seasonal cycles. Building on this, the study progresses through a structured framework: (1) Integrate summer field test data with harmonic analysis to systematically investigate the thermodynamic characteristics of air layers in PV dairy barn roofs. (2) Develop a mathematical model to quantify the impact of key parameters (e.g., air layer thickness and ventilation conditions) on roof heat transfer performance. (3) Validate equivalent thermal resistance properties under different air layer configurations (ventilated vs. sealed) to clarify heat flux attenuation and time lag effects. (4) Propose optimization criteria based on dynamic thermal performance to guide the selection of air layer thickness in PV barn roof design. The findings aim to enhance energy efficiency and support carbon neutrality goals in livestock facilities through technical innovation and theoretical advancements.

2. Materials and Methods

2.1. Overview of the Test Barn

The experimental site was an open dairy barn located on a cattle farm in Dongying City, Shandong Province, China (37°29′29″ N, 118°17′56″ E), as shown in Figure 1. Dongying has a temperate monsoon continental climate with hot and rainy summers and high humidity. The barn housed 920 cows and utilized mixed ventilation. The barn measured 32 m in span, 372 m in length, and 4.5 m in eave height. The roof had a slope angle θ of 17.17°, oriented 46.24° northwest in a gable direction, and was constructed with a single-layer color steel plate without insulation. The building structure employed the portal frame structure, with color steel panels made of hot-dip galvanized steel sheets—both representing the standard structural form and materials for modern dairy barns. A total of 1152 PV modules (total capacity: 299.52 kW) were installed on the south-facing roof of the western section, while the eastern section’s south-facing roof and both sections’ north-facing roofs remained unmodified. The PV panels covered the roof area of 1886 m2. For clarity, all subsequent references to “roof” in this study specifically refer to the south-facing roof. A ventilated air layer was established between the PV panels and the roof, with a length l of 12.12 m, an inlet-outlet height differential h of 3.75 m, and a thickness δa of 0.12 m. The PV mounting structure was universal.

2.2. Thermal Environment Testing of the Test Barn

This study monitored indoor and outdoor barn environments for dry-bulb temperature, relative humidity, wind speed, and solar radiation intensity. Data were collected from 5 June to 17 September 2023. The east area of the barn (unmodified roof configuration) was the control group, while the west area (PV-equipped roof configuration) was the test group. To confirm independence between roof sections, the same parameters were measured in another identical barn. The Scheirer-Ray-Hare test for nonparametric two-way ANOVA analysis. The data was used for subsequent calculations.
Dry-bulb temperature and relative humidity were continuously monitored using a UT330-USB datalogger (Uni-Trend Technology (China) Co., Ltd., Dongguan, China; accuracy: ±0.5 °C for dry-bulb temperature and ±3% for relative humidity; interval: 1 h), positioned 2.0 m above ground level. Wind speed was measured with a Kestrel 5500 weather meter (Nielsen-Kellerman Co., Ltd., Boothwyn, US; accuracy: ±0.1 m·s−1; interval: 1 h), installed at 1.5 m height. Solar radiation intensity was recorded using a TES-1333R solar power meter (TES Electrical Electronic Co., Ltd., Taibei, China; accuracy: ±10 W·m−2; interval: 1 min), mounted at 1.5 m elevation.

2.3. PV Roof Design

Three conditions were established to evaluate the thermal performance of the roof under distinct design scenarios:
Condition A: A monolithic single-layer color steel plate roof (no additional modifications), as depicted in Figure 2a.
Condition B: A composite roof combining a single-layer color steel plate with PV panels, creating a ventilated air layer (open) at varying air layer thicknesses, as depicted in Figure 2b.
Condition C: A composite roof integrating a single-layer color steel plate with PV panels, forming a sealed air layer (enclosed) at varying air layer thicknesses, as depicted in Figure 2c.

2.4. Heat Transfer Modeling

2.4.1. Thermal Performance Indicators for Roofs

This study employed the harmonic analysis method to evaluate the thermal performance of the PV dairy barn roofs. The data on which the calculations were based is the aforementioned thermal environment test data. The outdoor air temperature te (°C) was modeled as a periodic harmonic fluctuation around its mean value te0 (°C) with an amplitude of Ate and a period of T (h). The temperature at time Z (h) is defined as:
t e = t e 0 + A t e cos 2 π Z / T .
Thermal performance indicators, including thermal resistance R (m2·K·W−1), heat storage coefficient S (W·m−2·K−1), thermal inertness index D (dimensionless), and outdoor sol-air temperature tse (°C), were derived from the Thermal Design Code for Civil Buildings (GB 50176-2016) [17]. The thermophysical properties of air were obtained from standard tables [16] using linear interpolation. The amplitude Atse (°C) and peak time Ztse (h) of the integrated outdoor temperature were calculated based on these parameters. The characteristic number correlation equation for the mean convective heat transfer coefficients of the inner and outer surfaces of the barn roof is expressed as [18]:
N u = 0.037 R e 0.8 23 , 500 P r 1 / 3   ( 0.6 < P r < 60 ) ,
where Nu is the Nusselt number (dimensionless). Re is the Reynolds number (dimensionless). Pr is the Prandtl number (dimensionless). The calculated he and hi represent the convective heat transfer coefficients for the outer and inner surfaces, respectively, in units of W·m−2·K−1.
For varying operational conditions, the surface heat storage coefficient Y (W·m−2·K−1) and the damping factor ν (dimensionless) were derived using the generalized equation for any layer n and its preceding layer n − 1:
Y n = S n i tanh R n S n i + Y n 1 1 + Y n 1 / S n i tanh R n S n i ,
ν n = e R n S n i S n i + Y n 1 S n i + Y n ,
where i is the imaginary unit. Rn (m2·K·W−1) and Sn (W·m−2·K−1) are thermal resistance and coefficient of heat accumulation of the nth layer, respectively, n = 1, 2, 3, …
The total delay time ∑ε (h) is determined by Equation (5):
ε = tan 1 1 1 + 2 h e / Y 1 tan 1 1 1 + 2 Y r / h i × T 360 + T 2 π 2 R n S n ,
where Yr is the heat storage coefficient of the inner surface of the envelope when the fluctuation is reversed, in units of W·m−2·K−1.

2.4.2. Calculations for Different Conditions

1.
Condition A:
The mean heat flux q0 (W·m−2) entering the barn through the roof was calculated using the fundamental law of thermal conductivity [16]. The amplitude Aq (W·m−2) and peak time Zq (h) of the heat flux were derived from Equations (6) and (7), respectively:
A q = A t se h i / ν ,
Z q = Z t se + ε .
2.
Condition B:
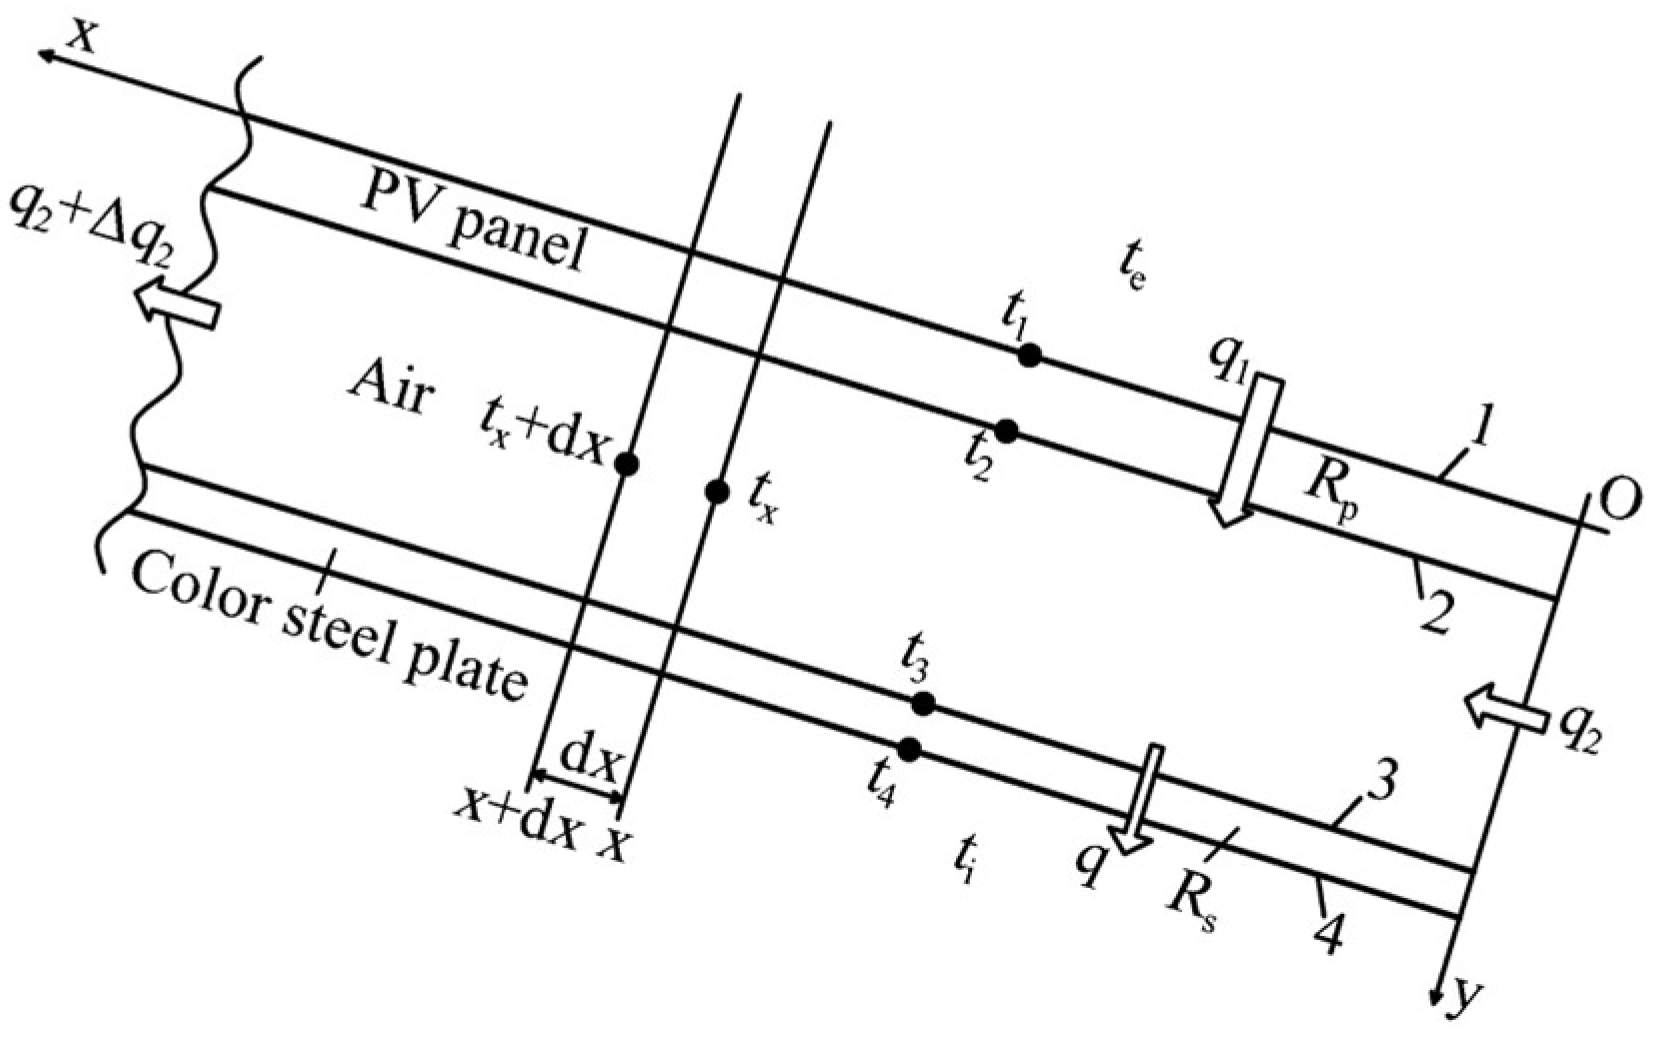
A ventilated air layer structure is established between the color steel plate and the PV panel, as depicted in Figure 3. The thermal resistances of the PV panel and the color steel plate are Rp and Rs, respectively, both in units of m2·K·W−1. A structural unit dx at position x is analyzed, where tx (°C) represents the air temperature of the air layer at x. The heat flux entering the air layer through the PV panels is q1, the heat flux of the air flowing into the air layer is q2, the heat flux of the air flowing out of the air layer is q2 + Δq2, and the heat flux entering the barn through the color steel plate is q, all in units of W·m−2. The temperatures t1, t2, t3, and t4 correspond to the temperatures of walls 1, 2, 3, and 4, respectively, all in units of °C. The thermal conditions were analyzed based on the study of Bagusowski [19].
The wind speed ua (m·s−1) in the ventilated air layer and the integrated temperature of the air layer at x, tsx (°C) were calculated using Equations (8)–(10):
u a = 0.08 h t s x t e / ξ ,
t s x = h r t 2 + h c t x h r + h c ,
h r = C 0 ε s b φ ,
where ξ is the total local resistance factor (dimensionless). hr is the radiative heat transfer coefficient of the air layer surfaces (W·m−2·K−1). hc is the convective heat transfer coefficient of the air layer surface (W·m−2·K−1). C0 is the blackbody radiative coefficient (5.67 W·m−2·K−4). εs is the relative radiation coefficient (dimensionless). b is the temperature difference correction factor (K3). φ is the view factor (dimensionless). For the characteristic number correlation equation of hc, the modified Gnilinski formula [20] was used:
N u = f / 8 R e 1000 P r 1 + 12.7 f / 8 P r 2 / 3 1 1 + 2 δ a / l 2 / 3 c t ε   ( 0.5 P r 2000 , 3000 R e 5 × 10 6 ) ,
where f = 1.82 lg R e 1.64 2 . f is the Darcy friction factor for turbulent flow in the tube (dimensionless). ct is the temperature correction factor (dimensionless). ε is the correction factor (dimensionless), which depends on the body size l/δa (dimensionless) of the ventilated air layer, as shown in Table 1, and is calculated by linear interpolation:
The heat balance equations for the roof structural unit dx have the following form, from which the mean air temperature ta0 in the air layer can be calculated. Subsequently, the mean heat flux q0 entering the barn through the roof can be determined:
h e t se t 1 + t 2 t 1 / R p = 0 t se t 1 / 1 / h e + R p + h c t x t 2 + h r t 3 t 2 = 0 h c t x t 2 d x + h c t x t 3 d x G c d t x = 0 h r t 2 t 3 + h c t x t 3 + t i t 3 / 1 / h i + R c = 0 t 3 t 4 / R s + h i t i t 4 = 0 ,
where G = v a δ a ρ a , G is the volume of air passing through the air layer when the width of the air layer is 1 m (kg·s−1). ρa is the air density (kg·m−3).
The air temperature differential equation for the air temperature wave in the air layer unit dx has the following form, from which the amplitude Ata of the air temperature in the air layer, the peak time Zta of the air temperature in the air layer, and the amplitude Aq of the heat flux entering the barn through the roof can be calculated:
h c t ˙ se / ν ˙ 1 d x + t ˙ 1 / ν ˙ 3 d x G c d t ˙ x B ˙ d x t ˙ x = 0 .
The boundary conditions have the following form: when x = 0 , t ˙ x = t ˙ o . Where ∑ B ˙ is the total heat absorption coefficient of both surfaces inside the air layer (W·m−2·K−1). The values of t ˙ , ν ˙ , B ˙ , and Y ˙ are quantities with corresponding amplitudes over time.
The peak time Zq of the heat flux entering the barn through the roof is calculated using Equation (14):
Z q = Z t a + ε .
3.
Condition C:
The roof was constructed with a single-layer color steel plate overlapped with PV panels, forming a sealed air layer. A sealed air layer structure was established between the color steel plate and the PV panel. For the characteristic correlation equation of hc for the sealed air layer, the correlation equation was corrected based on Hollands’s study [21]:
N u = 1 + 1.44 1 1708 / R a cos θ 1 1708 sin 1.8 θ 1.6 / R a cos θ + R a cos θ / 5830 1 / 3 1 ,
where Ra is the Rayleigh number (dimensionless).
The radiative heat transfer coefficient hr between the surfaces on both sides of the air layer was calculated using the same method as described in Equation (10). The mean air temperature ta0, its amplitude Ata, and peak time Zta of the sealed air layer were calculated using the same approach as in Condition B. These values were then used to determine the mean heat flux q0 entering the barn through the roof, its amplitude Aq, and peak time Zq.

2.5. Correlation Equation Validation Methodology

For the modified characteristic number correlation equation, the thermal boundary layer thickness of the air layer was used for validation. The equation for the thermal boundary layer thickness is referenced in [22]:
δ t = 0.376 x R e 1 / 5 ,
where δt is the thermal boundary layer thickness.
When δa exceeds a critical value, the correlation equation for the mean convective heat transfer coefficient of the ventilated air layer should be approximated as the correlation equation for the longitudinal flow over a flat plate, calculated according to the method described in [14]:
N u = 0.037 R e 4 / 5 P r 1 / 3 ( 0.6 < P r < 60 ) .

3. Results and Discussion

3.1. Corrections to Relevant Calculation Formulas for PV Dairy Barns

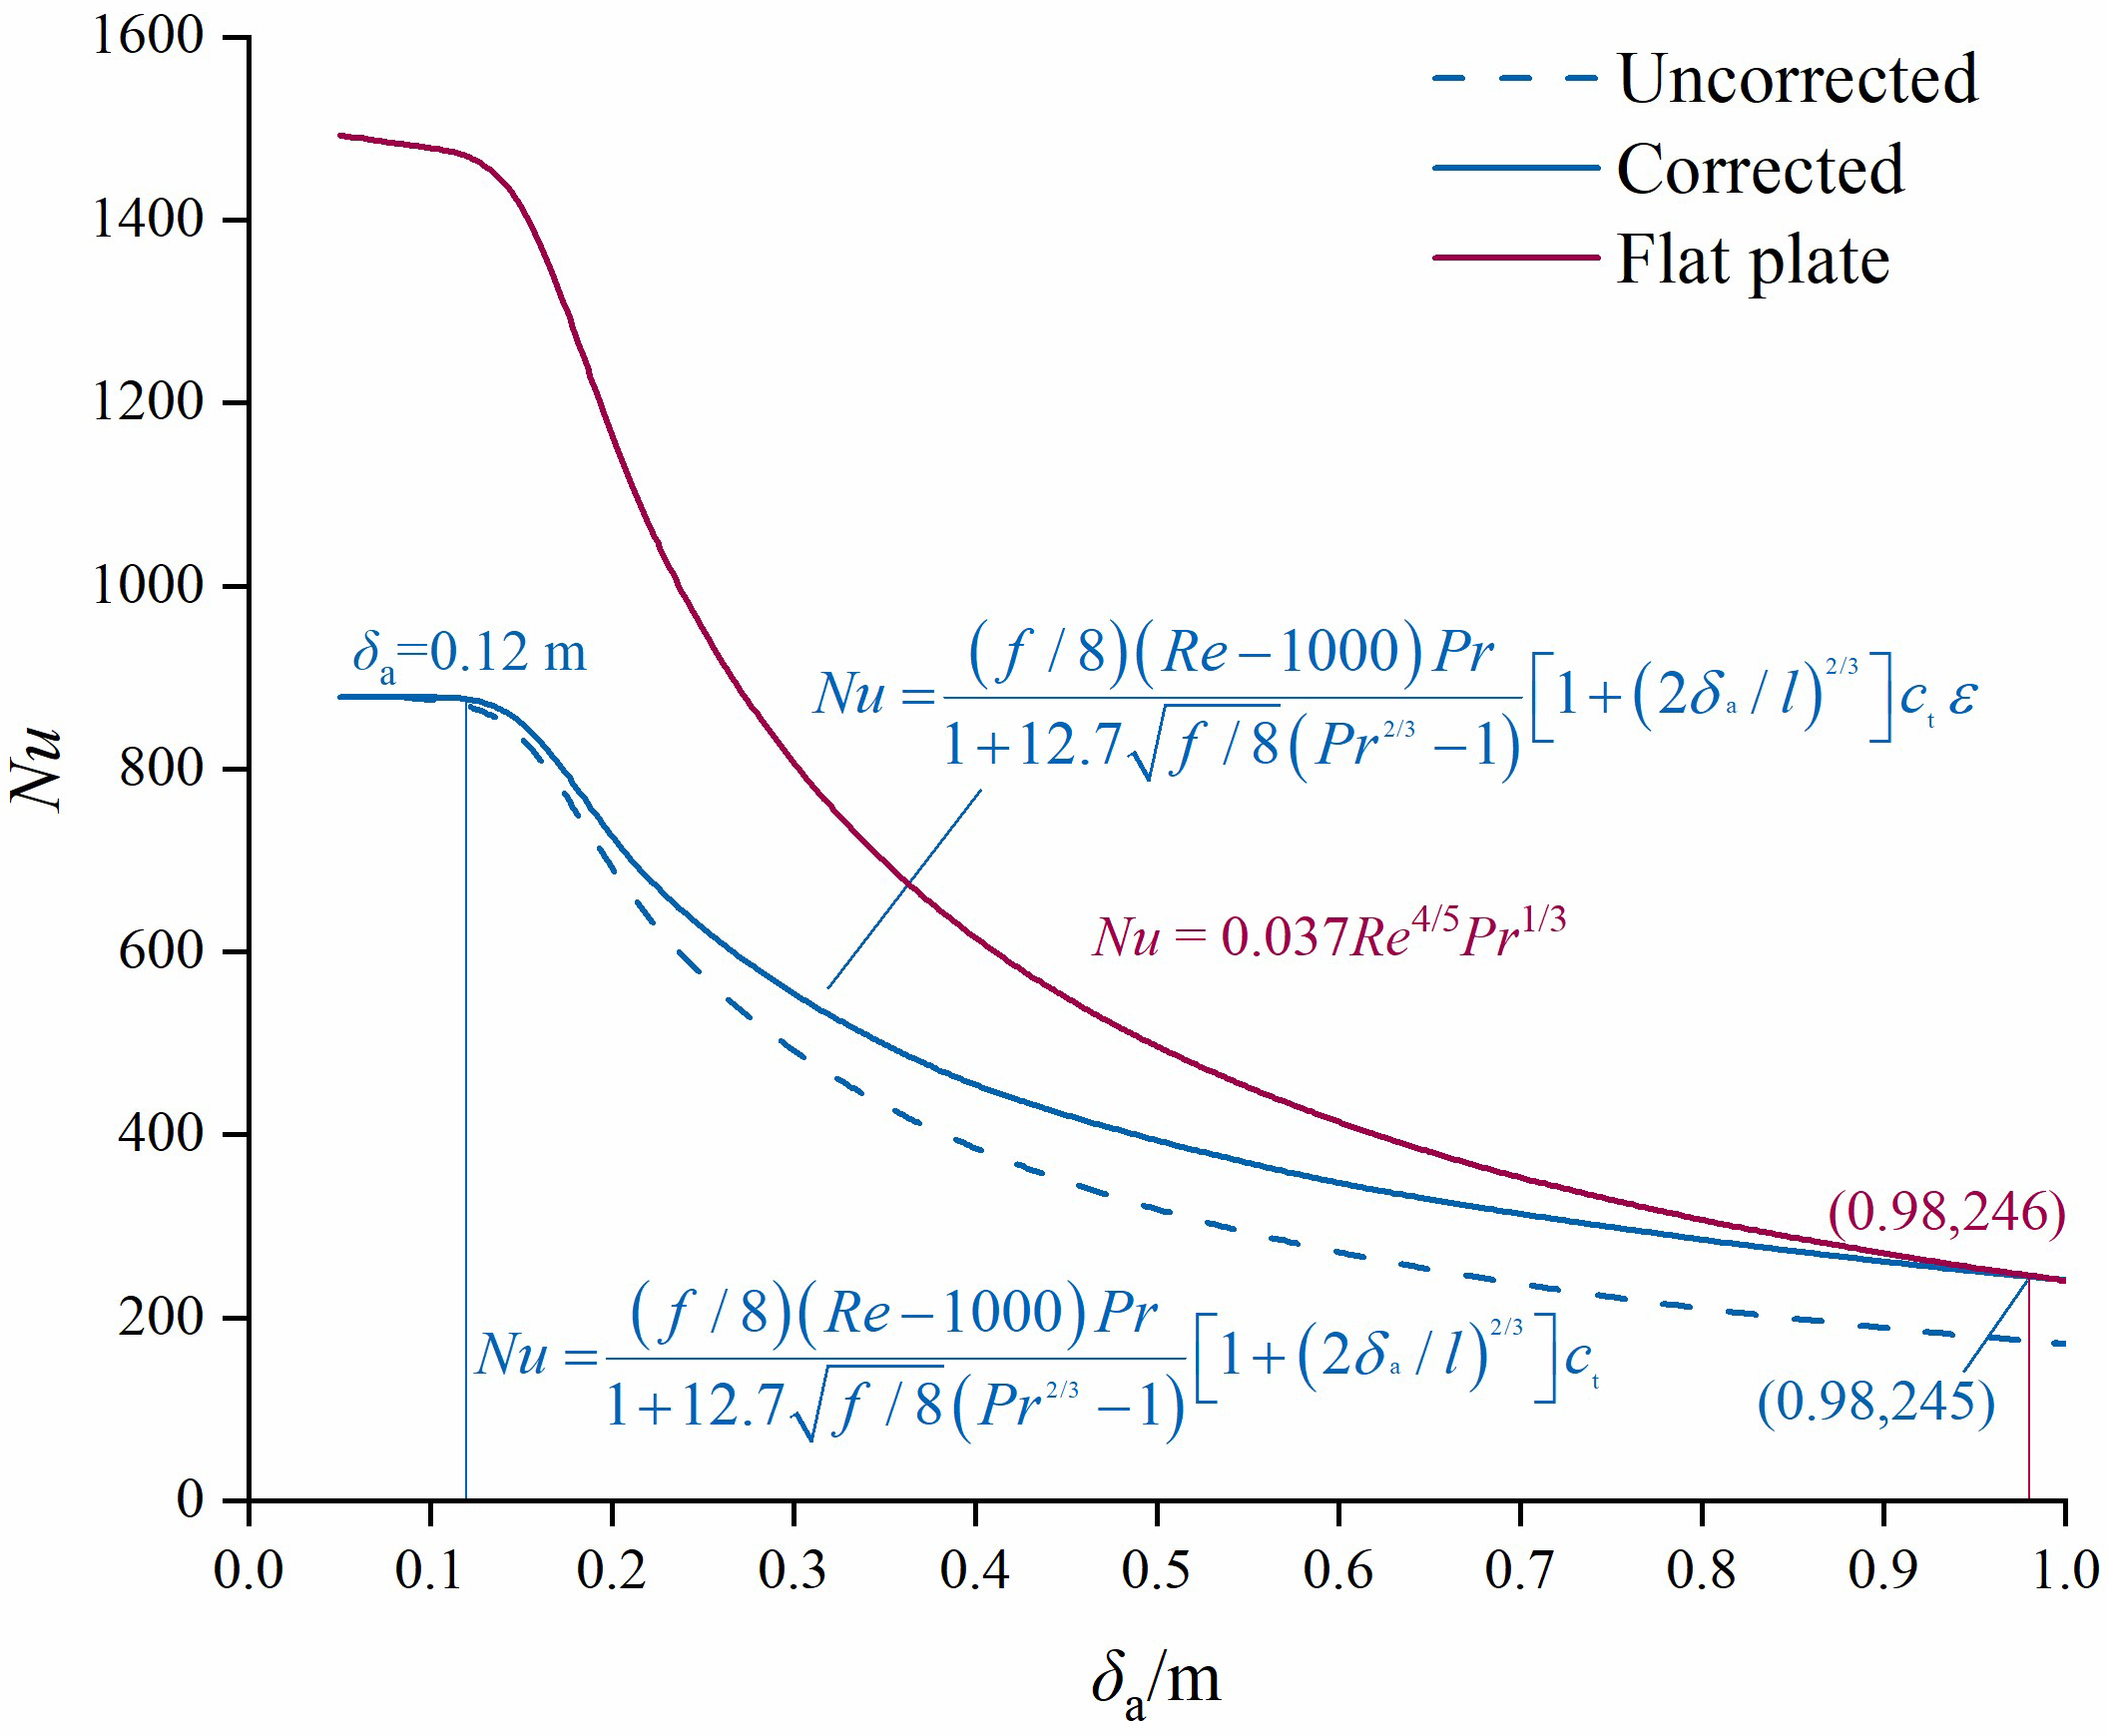
For the characteristic number correlation of the mean convective heat transfer coefficient in the ventilated air layer, the Gnielinski formula was referenced. The Gnielinski formula is currently the most accurate correlation available for turbulent forced convective heat transfer in pipes [16]. However, the model for turbulent convective heat transfer in pipes was not entirely identical to that in ventilated air layers. Therefore, the Gnielinski formula was not entirely applicable to the calculation of turbulent convective heat transfer in ventilated air layers, particularly when the body size of the ventilated air layer (l/δa) is less than 40, where significant errors occur. As shown in Figure 4, when l/δa was less than 40, the error exceeded 13%. Corrections were necessary. Bagusrovsky’s study on ventilated air layers proposed correction coefficients in Table 1 [19]. However, the characteristic number correlation equation he proposed was applied to steady-state convective heat transfer, while his proposed characteristic number correlation equation for unsteady-state turbulent heat transfer was relatively concise but rough, considering only the air layer thickness and airflow velocity. This did not apply to this study. Therefore, this study applied the correction coefficients to the Gnielinski formula. The boundary layer approximation method was widely used to solve natural convection in air layers under various boundary conditions [23]. The boundary layer developed along the airflow direction, with the maximum thickness occurring at the end [24]. The results are shown in Figure 4. When the air layer thickness reached the critical value equal to the air boundary layer thickness (δa = 0.98 m), the characteristic number correlation equation using the Gnielinski formula should be approximately equal to the characteristic number correlation equation for external flow over a flat plate. Contrary to intuitive expectations, Nu did not change linearly with δa. When δa > 0.3 m, the growth rate of Nu decreased by 63% due to boundary layer detachment. This non-linear relationship was critical for optimizing δa beyond empirical ranges.

3.2. Setting of Air Layer Thickness

The PV modules installed on the barn roof created an air layer between the PV panels and the roof. Currently, there are no mandatory regulations in China, nor any other country, regarding the setting of this gap. A larger gap required higher PV mounting, more steel materials, and higher costs. Therefore, engineering practices tend to favor lower PV mounting brackets. For the lower limit, China’s standard GB/T 51368 recommends a ventilation gap of more than 0.1 m [25]. The primary purpose of this recommendation is to reduce the temperature rise on the backside of the PV modules by enhancing roof ventilation and ensuring installation and maintenance space for the modules. For the upper limit, Michael et al. [24] set an air layer spacing of 0.01–0.5 m in their study, while Naghavi et al. [26] set a range of 0–0.3 m. Additionally, it has been reported that in France, solar panels mounted on roofs should not exceed 0.3 m above the roof height, and in Germany, they generally should not exceed 0.3–0.5 m above the roof height [27]. Therefore, in this study, the results for gradient thicknesses in the range of 0.05–0.50 m were calculated, and the range of 0.10–0.30 m was considered acceptable for engineering practice. Subsequent discussions are based on this range.

3.3. Thermal Environment Test Data

The harmonic analysis method demonstrates particular efficacy for PV roof thermal assessment in agricultural buildings due to its computational efficiency in resolving periodic heat transfer. Harmonic analysis captures transient dynamics critical for livestock thermal comfort. Despite methodological concerns regarding zonal interference, statistical verification confirmed negligible orientation bias (p = 0.29 for dry-bulb temperature; p = 0.44 for relative humidity). The key parameters derived from the experimental results are summarized in Table 2. Notably, solar radiation intensity and associated values were converted to represent the radiation projected onto the barn’s south-facing roof.

3.4. Variation in Air Layer Temperature with Air Layer Thickness

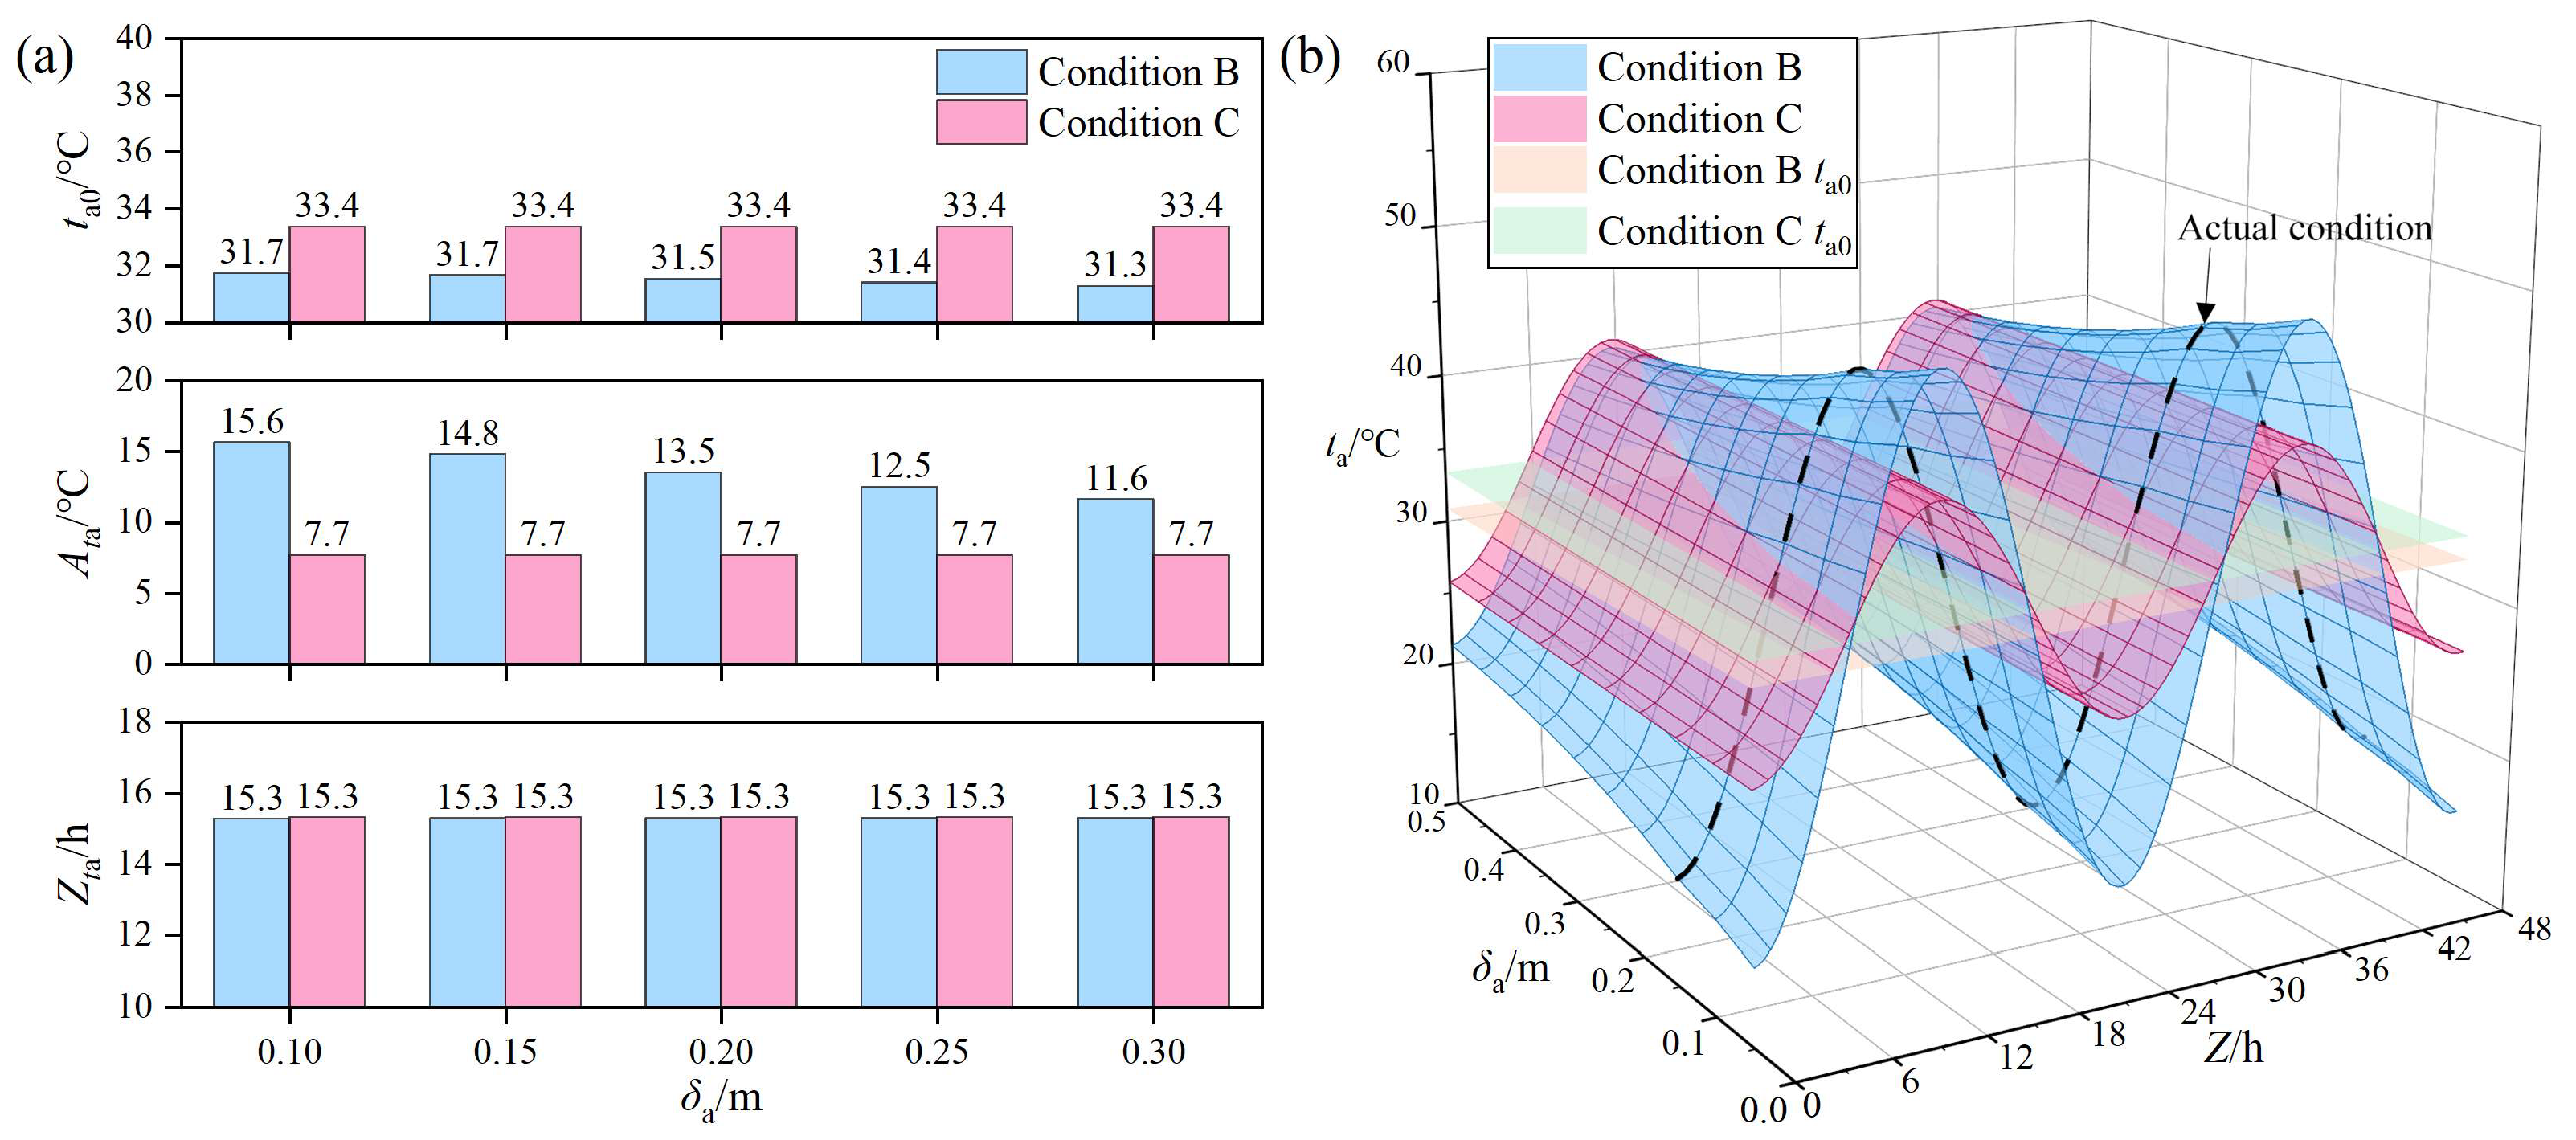
The results of the tests on the thermal environment inside and outside the barn were presented in the attached file. The results of calculating ta, q, and Req based on the calculation method in Section 2.4 were presented in Section 3.3, Section 3.4, and Section 3.5, respectively. The harmonic images of the air layer temperature ta as a function of air layer thickness δa are shown in Figure 5, based on the mean air temperature ta0, amplitude Ata, and peak time Zta of the air layer for Condition B and Condition C.
In ventilated air layers (Condition B), when δa = 0.12 m (the actual condition of the test barn), the mean air temperature of the air layer ta0 was 31.7 °C, the amplitude of the air temperature of the air layer Ata was 14.8 °C, and the peak time of the air temperature Zta was 15.3 h. As δa increased, ta0 and Ata decreased, while Zta remained almost unchanged. At δa = 0.05 m, ta0 and Ata reached their maximum values. At δa = 0.10 m, ta0 = 31.7 °C and Ata = 15.6 °C. At δa = 0.30 m, ta0 = 31.3 °C and Ata = 11.6 °C. At δa = 0.05 m, ta0 and Ata reached their minimum values. The rate of change of ta0 increased with the increasing δa from 0.05 m to 0.50 m, peaking at 2.7 °C·m−1 at δa = 0.20 m, and then decreased as δa continued to increase. For the ventilated air layer, the thermal characteristics of the air entering the layer were initially consistent with those of the outdoor air. As the air flows through the layer, it is heated by the heat passing through the PV panels, resulting in a higher outlet temperature compared to the inlet temperature. In this study, as the air layer thickness δa increases, the temperature difference between the outlet and inlet of the air layer decreases gradually. With increasing air inflow, the heat storage capacity of the air within the layer strengthens, the convective heat transfer effect diminishes, and the thermal characteristics of the air layer become more stable, exhibiting higher uniformity along the direction of the air layer.
For sealed air layers (Condition C), the rates of change of ta0, Ata, and Zta were very minimal and almost unaffected by increases in δa. Within the studied range, ta0 = 33.4 °C, Ata = 7.7 °C, and Zta = 15.3 h. The ta0 for Condition C was significantly higher than that for Condition B, while Ata was significantly lower. There was no significant difference in Zta between Conditions B and C. For the sealed air layer, heat transfer was primarily through radiation and remains nearly constant regardless of increases in δa. This results in minimal changes in the thermal state of the air layer within the studied range. Unlike the ventilated air layer, the air in the sealed air layer was enclosed and stable, rarely carrying heat away through convective heat transfer or outflowing air [28]. It was continuously heated by the heat passing through the PV panels, leading to a higher ta0 and lower Ata, as expected. Zta showed no significant difference between the sealed and ventilated air layers. This was because the effect on the overall system peak times was mainly due to the larger heat storage coefficient of the PV panels. The higher ta0 results in the PV panels being exposed to higher temperatures, which is detrimental to their power generation efficiency. Higher ambient temperature and solar irradiance caused increased cell temperatures [29]. An increase in temperature would directly lead to efficiency degradation [30].

3.5. Variation in Heat Entering the Barn Through the Roof with Air Layer Thickness

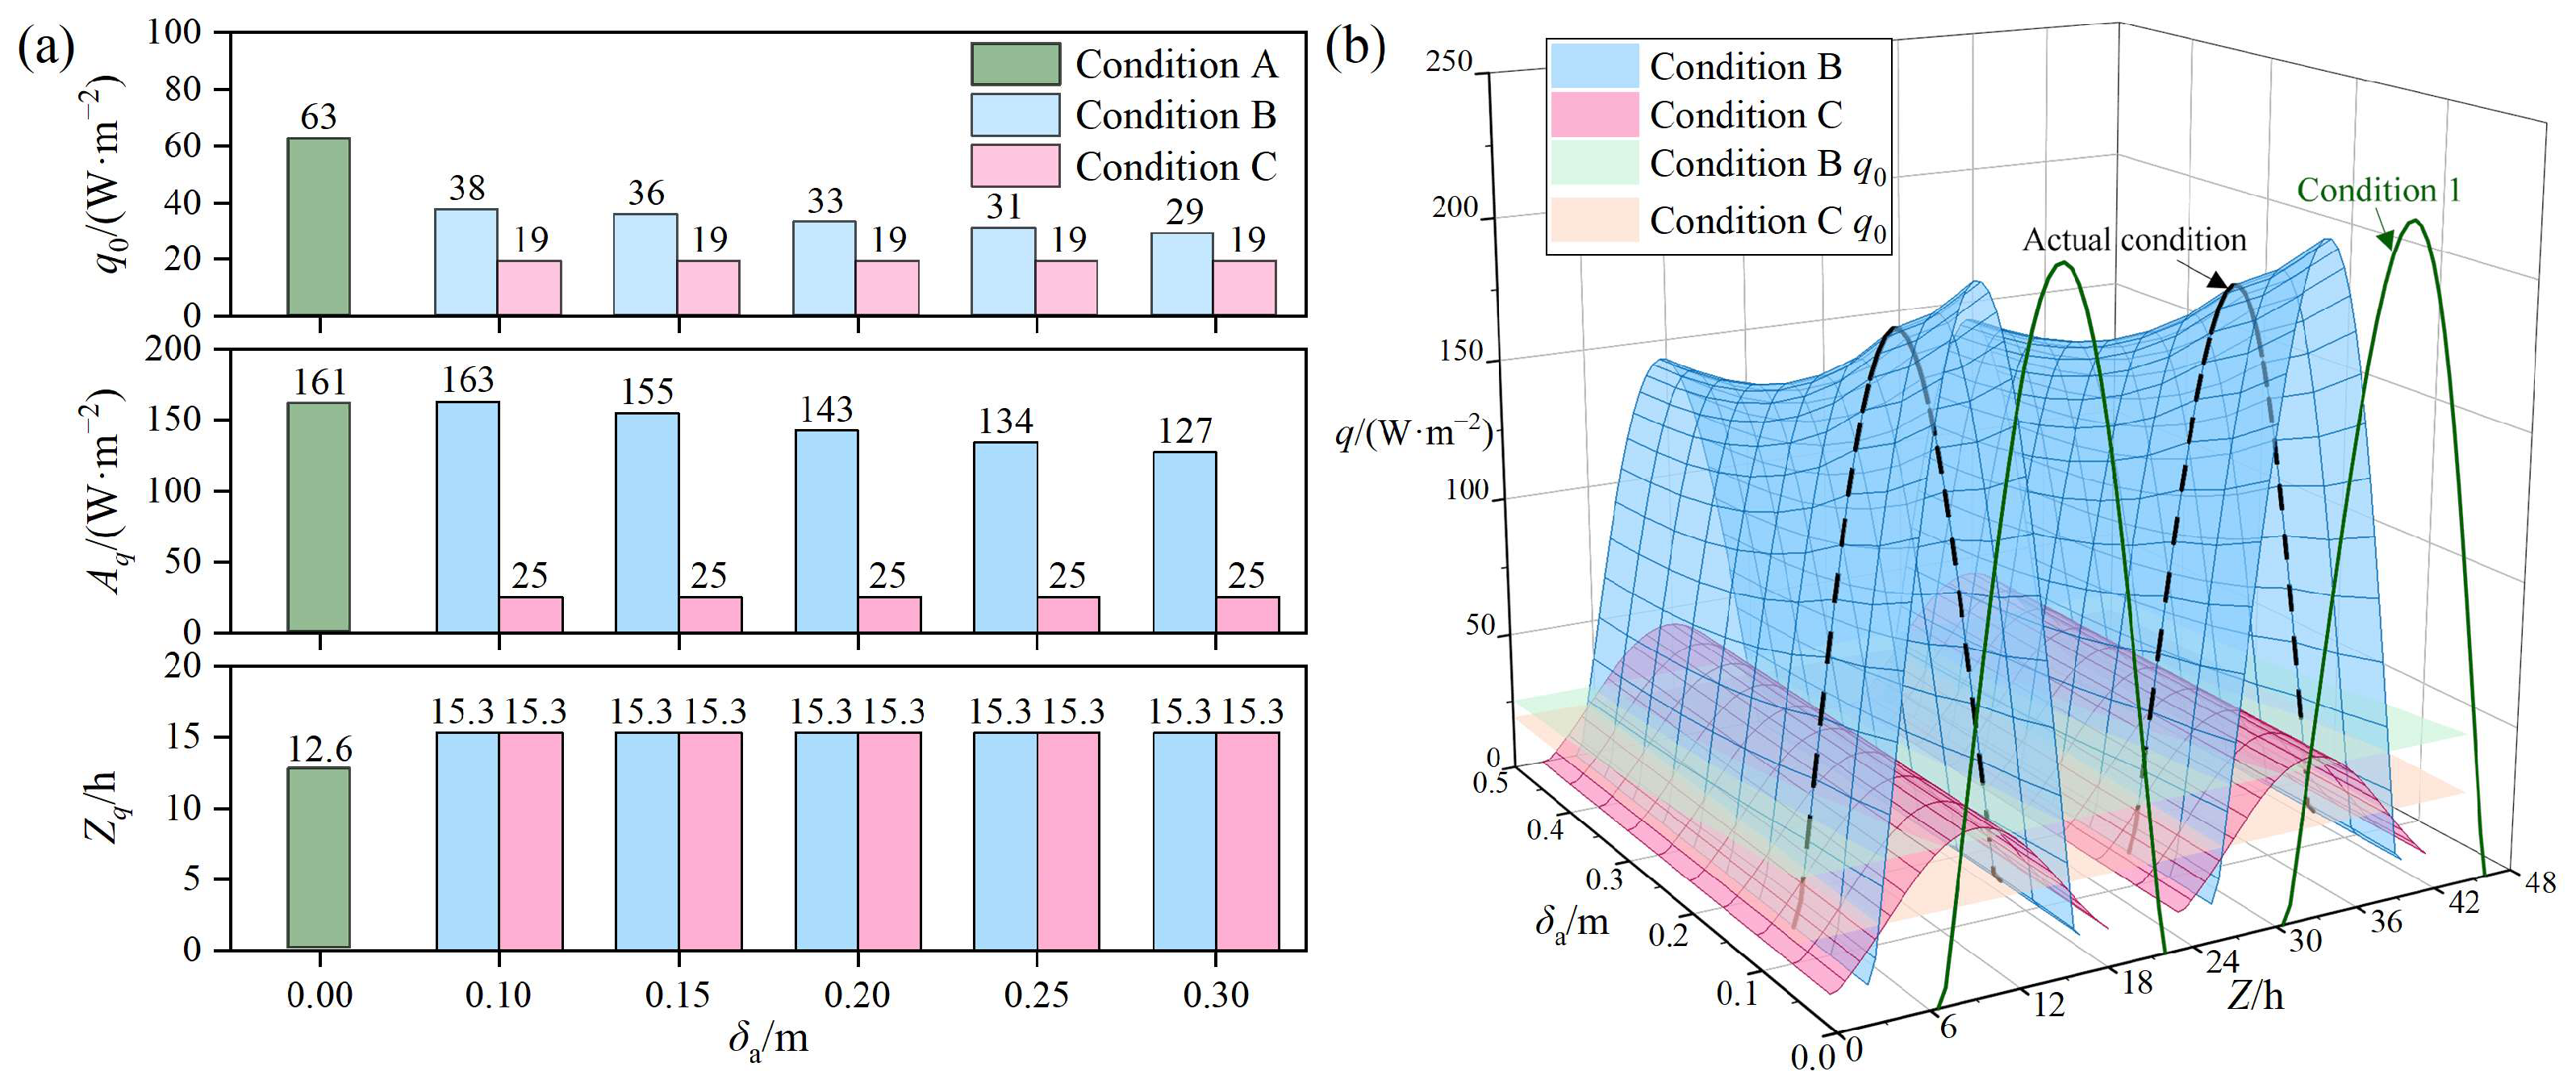
The harmonic image of the heat flux q entering the barn through the roof as a function of air layer thickness δa is shown in Figure 6, based on the mean heat flux q0, amplitude Aq, and peak time Zq under the three conditions.
Under the baseline configuration (Condition A), the mean heat flux q0 was 63 W·m−2, the amplitude Aq was 161 W·m−2, and the peak time Zq was 12.6 h.
In ventilated air layers (Condition B), when δa = 0.12 m (the actual condition of the test barn), the mean heat flux q0 was 36 W·m−2, the amplitude Aq was 155 W·m−2, and the peak time Zq was 15.3 h. As δa increased, q0 and Aq decreased, while Zq remained nearly constant. At δa = 0.10 m, q0 = 38 W·m−2 and Aq = 163 W·m−2. At δa = 0.30 m, q0 = 29 W·m−2 and Aq = 127 W·m−2. At δa = 0.50 m, q0 and Aq reached their minimum values. Compared to Condition A, the mean heat flux q0 entering the barn through the roof in Condition B was significantly lower. For example, at δa = 0.10 m, q0 in Condition B was only 60% of that in Condition A, and at δa = 0.30 m, it was only 47% of that in Condition A. The amplitude Aq of heat flux entering the barn through the roof in Condition B was slightly larger at the initial value of δa = 0.05 m. As δa increased to 0.10 m, Aq in Condition B reached the same level as in Condition A. At δa = 0.30 m, Aq was only 79% of that in Condition A, and at δa = 0.50 m, it reached its minimum value. The peak time Zq of the heat flux entering the barn through the roof in Condition B was delayed by 2.7 h overall compared to Condition A. For the ventilated air layer, within the studied range, as the air layer thickness δa increased, convective heat transfer weakened, and heat transfer efficiency decreased, leading to a reduction in both q0 and Aq. Compared to Condition A, q0 in Condition B was significantly lower. The significant effect of a portion of the heat originally passing through the PV panels, heating the air in the air layer, and flowing out with the airflow was notable. In contrast, the heat transfer resistance of the PV panels themselves was minimal and insufficient to significantly affect the amount of heat passing through them. The addition of the ventilated air layer increased the system’s volatility, resulting in Aq in Condition B being slightly larger than in Condition A when the air layer thickness was small. As the air layer thickness increases, the thermal characteristics of the air layer become more stable, and Aq became significantly lower than in Condition A. The results of this study were consistent with those of Wang et al. [31], Li et al. [14], and Ma et al. [32], and the conclusions obtained were in agreement.
In sealed air layers (Condition C), the rates of change of q0, Aq, and Zq were minimal and almost unaffected by increases in δa. Within the studied range, q0 = 19 W·m−2, Aq = 25 W·m−2, and Zq = 15.3 h. Compared to Conditions 1 and 2, the mean heat flux q0 and its amplitude Aq entering the barn through the roof in Condition C were significantly lower. For example, q0 in Condition C was only 30% of that in Condition A, 50% of that in Condition B at δa = 0.10 m, and 65% of that in Condition B at δa = 0.30 m. Similarly, Aq in Condition C was only 15% of that in Condition A, 15% of that in Condition B at δa = 0.10 m, and 19% of that in Condition B at δa = 0.30 m. At δa = 0.50 m, Aq in Condition B reached its minimum value, but Aq in Condition C remained significantly lower, at approximately 21% of that in Condition B. The peak time Zq of the heat flux entering the barn through the roof in Condition C was delayed by 2.7 h overall compared to Condition A, which was approximately equal to that in Condition B. For the sealed air layer, both convective and radiative heat transfer remained nearly constant with increasing δa within the studied range, resulting in the stability of q0 and Aq. Compared to Condition B, q0 and Aq in Condition C were significantly lower. This stability was attributed to the enclosed nature of the air layer in Condition C, where both convective and radiative heat transfer remained almost unchanged. In contrast, in Condition B, the air in the air layer could flow freely, allowing for more effective heat removal through thermal and wind pressure. In this study, convective heat transfer played a minor role, while radiative heat transfer dominated, consistent with the findings of Bruno et al. [29].

3.6. Variation in Roof Equivalent Thermal Resistance with Air Layer Thickness

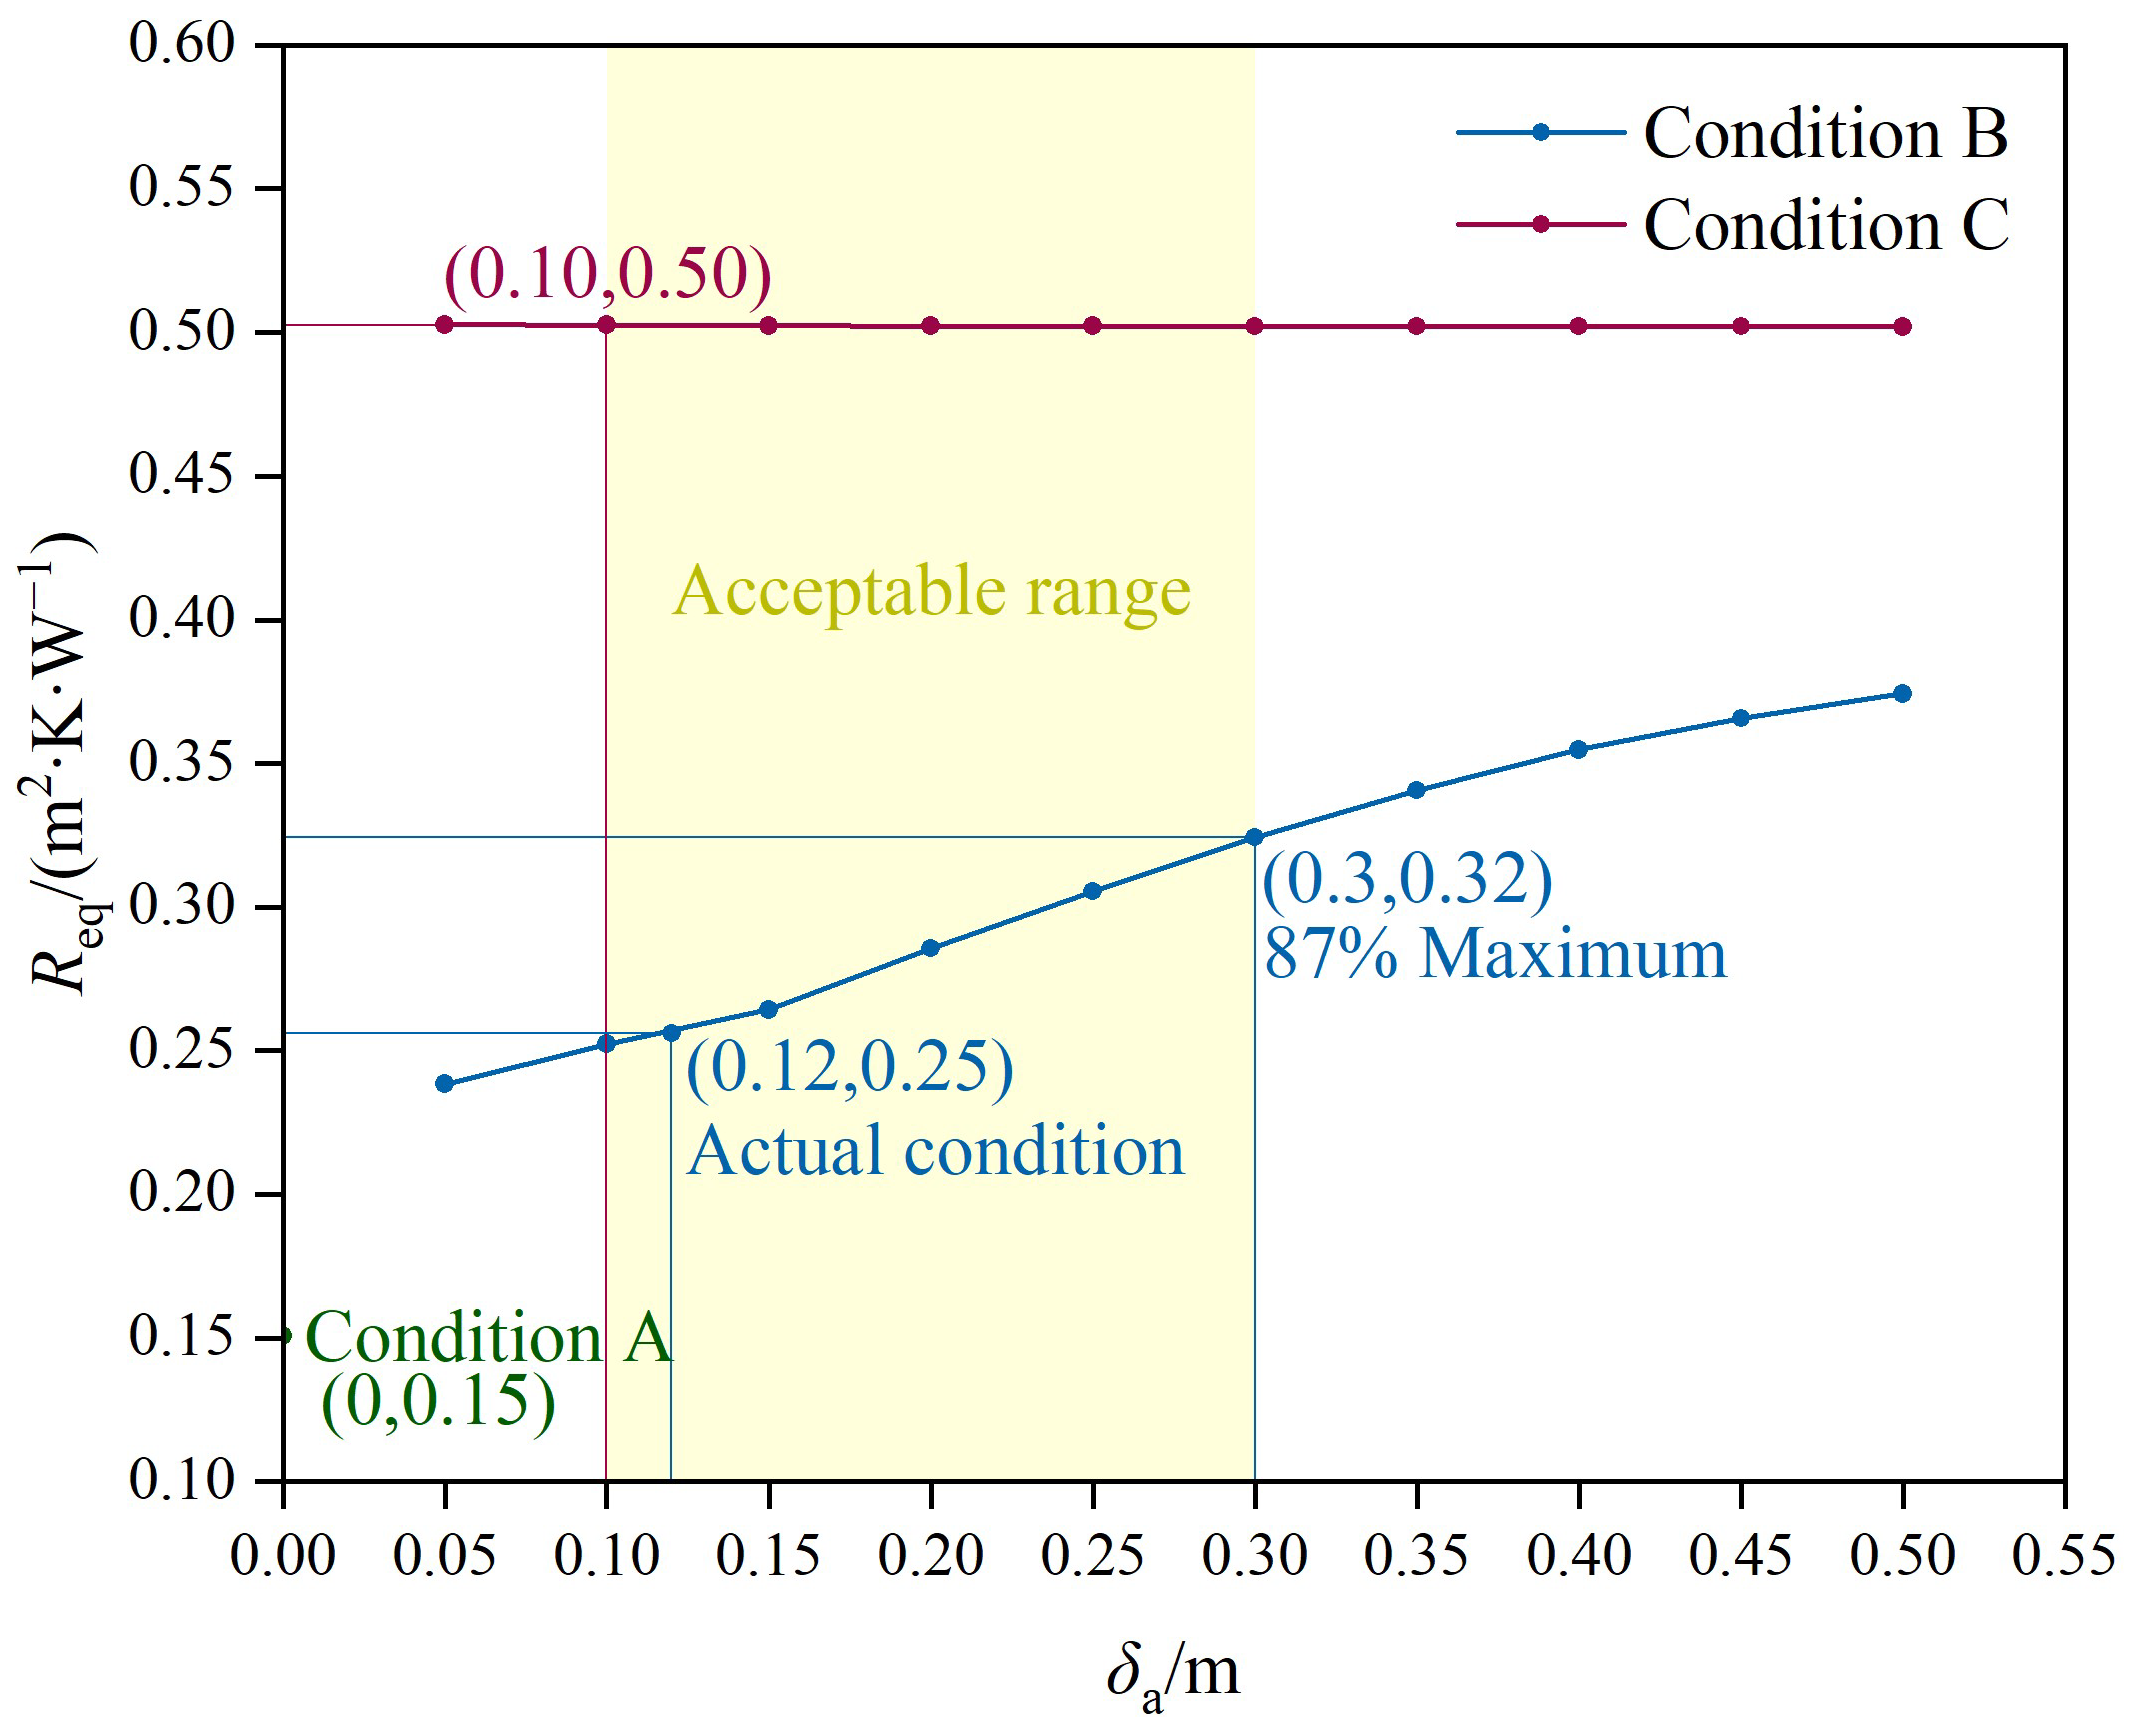
The variation in the equivalent thermal resistance of the roof Req with air layer thickness δa for the three conditions is shown in Figure 7, based on the mean heat flux q0 entering the barn through the roof.
The baseline roof (Condition A) showed that the equivalent thermal resistance Req was 0.15 m2·K·W−1.
With ventilated air layers (Condition B), when δa = 0.12 m (the actual condition of the test barn), the equivalent thermal resistance Req was 0.26 m2·K·W−1. In Condition B, Req increased with increasing δa. At δa = 0.10 m, Req = 0.25 m2·K·W−1. At δa = 0.30 m, Req reached 87% of its maximum value, with Req = 0.32 m2·K·W−1. The maximum was achieved at δa = 0.50 m. Compared to Condition A, the equivalent thermal resistance Req of the roof in Condition B was significantly higher. For example, at δa = 0.10 m, Req in Condition B was 1.67 times that of Condition A, and at δa = 0.30 m, it was 2.15 times that of Condition A. For the ventilated air layer, the equivalent thermal resistance Req increased with increasing air layer thickness δa. Although the heat transfer mechanism in ventilated air layers was complex and could not be easily calculated using a simple one-dimensional steady-state heat transfer model, the overall effect could still be understood through the concept of equivalent thermal resistance. Thermal resistance characterized the degree to which the structure obstructs heat transfer. Req increased significantly with increasing δa, reaching 87% of its maximum value at δa = 0.30 m. Compared to Condition A, Req in Condition B was significantly higher, as the air layer reduces heat transfer and removes part of the heat through airflow.
In sealed configurations (Condition C), the rate of change of Req was minimal and almost unaffected by increases in δa. The Building components and building elements—Thermal resistance and thermal transmittance—Calculation method (ISO 6946:2007) proposes that the thermal resistance of the air layer no longer changes when the thickness exceeds 0.025 m [33], while the value in the Thermal Design Code for Civil Buildings (GB 50176-2016) is 0.02 m [17]. Zhang and Yang showed that when the thickness exceeded 0.02 m, the heat transfer was slightly influenced by the thickness [34]. The range of this study started from 0.05 m, so it was reasonable that Req was almost constant. Within the studied range, Req remained approximately 0.50 m2·K·W−1 as δa varies. Compared to both Condition A and Condition B, the equivalent thermal resistance Req of the roof in Condition C was significantly higher. For example, Req in Condition C was 3.33 times that of Condition A, 1.99 times that of Condition B at δa = 0.10 m, and approximately 1.55 times that of Condition B at δa = 0.30 m. For the sealed air layer, Req remained nearly constant as δa increased. This was primarily due to the dominant role of radiative heat transfer, which depended more on the radiative properties of the air layer surfaces than on the air layer thickness itself. Compared to Condition B, Req in Condition C was significantly higher. While the ventilated air layer also provided some thermal insulation, the enhanced convective heat transfer due to airflow results in a less significant increase in thermal resistance compared to the sealed air layer. The heat transfer in the sealed air layer had been numerically investigated by Boukendil et al. [35] and Nath et al. [36], who determined the heat transfer coefficient and thermal resistance of the air layer. Zhang et al. [37] studied the effects of boundary conditions, thermophysical properties of materials, and wall configurations on the heat transfer conditions of cavity walls through numerical simulations. They then conducted a comprehensive analysis of the heat transfer of the insulating air layer in the building envelope [28]. These studies suggested that the optimal thickness of the air layer varies significantly across different studies, and the specific thermal resistance of the air layer thickness was strongly influenced by different working conditions. In this study, the suitable range of air layer thickness had reached a stable range compared to the results of previous studies, which was consistent with the trend observed in those studies.
The scenario described in this study, where δa = 0.12 m, was a common practical engineering application. It was easily achievable when attaching PV panels to the roof of a dairy barn, with existing regulations for PV panel mounting brackets. In this case, Req was 1.75 times that of the roof without PV panels. If the PV panel mounting bracket was raised to 0.30 m, Req could be increased to 2.15 times that of the roof without PV panels. If the gap between the PV panels and the color steel plate was fully sealed, Req could be increased to 3.33 times that of the roof without PV panels. Taking all factors into account, a ventilated air layer of 0.2–0.3 m thickness was considered preferable in this study. It minimized as much heat as possible entering the barn and avoided excessive air layer temperatures that would cause the efficiency of the PV panels to decrease. The optimized δa (0.2–0.3 m) corresponds to the transition zone of Nu variation (Figure 4), balancing heat dissipation and structural cost—a finding unobtainable without the modified model.
Parametric verification confirmed the robustness of optimal air layer configurations across common dairy barn structural parameters in China. For roof slopes ranging from 1:3 to 1:5, the Req variation remained within 4% compared to the baseline slope of 17.17° in this study. Similarly, for barn spans between 28 m and 32 m –representative of modern facilities—Req showed almost no fluctuation when maintaining identical δa and ventilation conditions. However, climatic adaptability remained critical. While the computational methodology (harmonic analysis in Section 2.4) maintained universal applicability, external environmental parameters necessitate region-specific validation. This demonstrated that while structural parameter variations yielded negligible impact, the proposed optimization framework required climatic calibration through localized input data rather than algorithmic changes.

3.7. Prospects

In practical applications, the long-term performance of PV dairy barn roofs, including durability and maintenance requirements, needs further validation to ensure the stability and reliability of their thermal performance. Further refining the model by constructing a two-dimensional framework. Combining engineering costs, a comprehensive cost–benefit analysis should be conducted to determine the optimal balance point of different air layer thicknesses in terms of economic benefits. Future work should also focus on estimating the energy consumption within the barn to further optimize the design of PV dairy barn roofs and improve energy efficiency, thereby enhancing the thermal comfort of livestock and contributing to the overall sustainability of dairy farming operations.

4. Conclusions

This study investigated the impact of air layer thickness on the thermal performance of PV dairy barn roofs through theoretical calculations. The key findings are summarized as follows:
  • Convective heat transfer correlation: A characteristic number correlation equation for convective heat transfer in ventilated air layers was developed. The correlation aligns closely with the characteristic number for external flow over a flat plate when the air layer thickness exceeds a critical value. The modified characteristic number equations are more applicable to PV roof structures of agricultural or industrial buildings.
  • Harmonic analysis of heat flux: Harmonic analysis revealed that for ventilated air layers, increasing the air layer thickness reduces the mean heat flux and its amplitude entering the barn through the roof, with minimal changes to the peak time. In contrast, for sealed air layers, the mean heat flux, amplitude, and peak time remain relatively stable regardless of changes in air layer thickness.
  • Thermal resistance evaluation: The thermal resistance of the roof with a PV system was evaluated. Compared to a roof without a PV system, the thermal resistance of the roof with a ventilated air layer structure increases by 1.67–2.15 times, with further increases observed as air layer thickness grows. For a roof with a sealed air layer structure, the thermal resistance is 3.33 times higher, with little variation observed with increasing air layer thickness.
These findings provide valuable insights for optimizing the design of energy-efficient PV dairy barn roofs, enhancing thermal comfort, and contributing to low-carbon energy solutions in livestock facilities.

Author Contributions

Conceptualization, Y.L.; methodology, Q.W.; validation, X.D.; formal analysis, F.Q.; investigation, Q.W.; data curation, G.Y.; writing—original draft preparation, Q.W.; writing—review and editing, Y.L.; visualization, Z.W. and H.L.; supervision, Z.S.; project administration, C.W.; funding acquisition, C.W. All authors have read and agreed to the published version of the manuscript.

Funding

This research was funded by the earmarked fund for China Agriculture Research System: CARS36.

Institutional Review Board Statement

This study did not require ethical approval.

Data Availability Statement

Data will be available on request.

Acknowledgments

The authors would like to express their sincere gratitude to all individuals who contributed to this work.

Conflicts of Interest

The authors declare no conflicts of interest.

References

  1. FAO; Global Dairy Platform. Climate Change and the Global Dairy Cattle Sector—The Role of the Dairy Sector in a Low-Carbon Future; FAO: Rome, Italy, 2019. [Google Scholar]
  2. National Development and Reform Commission. “14th Five-Year” Renewable Energy Development Plan; National Development and Reform Commission: Beijing, China, 2021.
  3. Lin, W.; Green, A.; Ledo Gomis, L.; Kokogiannakis, G.; Cooper, P. Thermal Effects of Dew on Cool Roofs and Conventional Roofs in Building Performance Simulations. Energy Build. 2023, 279, 112645. [Google Scholar] [CrossRef]
  4. Yang, T.; Athienitis, A.K. A Review of Research and Developments of Building-Integrated Photovoltaic/Thermal (BIPV/T) Systems. Renew. Sustain. Energy Rev. 2016, 66, 886–912. [Google Scholar] [CrossRef]
  5. Dominguez, A.; Kleissl, J.; Luvall, J.C. Effects of Solar Photovoltaic Panels on Roof Heat Transfer. Sol. Energy 2011, 85, 2244–2255. [Google Scholar] [CrossRef]
  6. Bianco, V.; Diana, A.; Manca, O.; Nardini, S. Numerical Investigation of an Inclined Rectangular Cavity for Ventilated Roofs Applications. Therm. Sci. Eng. Prog. 2018, 6, 426–435. [Google Scholar] [CrossRef]
  7. Calati, M.; Doretti, L.; Zilio, C.; Mancin, S. 3D Numerical Simulation of a Novel Ventilated Roof: Thermal Performance Analysis and Fluid Flow Behavior. Sci. Technol. Built Environ. 2021, 27, 819–831. [Google Scholar] [CrossRef]
  8. Zhang, T.; Tan, Y.; Yang, H.; Zhang, X. The Application of Air Layers in Building Envelopes: A Review. Appl. Energy 2016, 165, 707–734. [Google Scholar] [CrossRef]
  9. Tikul, N.; Prachum, S. Passive Cooling Strategies for Cattle Housing on Small Farms: A Case Study. Maejo Int. J. Sci. Technol. 2022, 16, 25–39. [Google Scholar]
  10. Pan, Z.; Zhao, W.; Wang, H. Comparative Study on Numerical Simulation of Temperature Field of Farm House with Different Roof Forms. Sci. Rep. 2024, 14, 7772. [Google Scholar] [CrossRef]
  11. Lee, S.; Park, S.H.; Yeo, M.S.; Kim, K.W. An Experimental Study on Airflow in the Cavity of a Ventilated Roof. Build. Environ. 2009, 44, 1431–1439. [Google Scholar] [CrossRef]
  12. Luo, Y.; Zhang, L.; Bozlar, M.; Liu, Z.; Guo, H.; Meggers, F. Active Building Envelope Systems toward Renewable and Sustainable Energy. Renew. Sustain. Energy Rev. 2019, 104, 470–491. [Google Scholar] [CrossRef]
  13. Villi, G.; Pasut, W.; Carli, M.D. CFD Modelling and Thermal Performance Analysis of a Wooden Ventilated Roof Structure. Build. Simul. 2009, 2, 215–228. [Google Scholar] [CrossRef]
  14. Li, D.; Zheng, Y.; Liu, C.; Qi, H.; Liu, X. Numerical Analysis on Thermal Performance of Naturally Ventilated Roofs with Different Influencing Parameters. Sustain. Cities Soc. 2016, 22, 86–93. [Google Scholar] [CrossRef]
  15. Phiraphat, S.; Prommas, R.; Puangsombut, W. Experimental Study of Natural Convection in PV Roof Solar Collector. Int. Commun. Heat Mass Transf. 2017, 89, 31–38. [Google Scholar] [CrossRef]
  16. Incropera, F.P.; DeWitt, D.P.; Bergman, T.L.; Lavine, A.S. Fundamentals of Heat Transfer and Mass Transfer, 6th ed.; John Wiley & Sons: Hoboken, NJ, USA, 2007. [Google Scholar]
  17. GB50176–2016; Thermal Design Code for Civil Building. Ministry of Housing and Urban-Rural Development: Beijing, China, 2016.
  18. Gupta, C.P. Engineering Heat Transfer, 4th ed.; Nem Chand and Brothers: Roorkee, India, 1976. [Google Scholar]
  19. Bagusrovsky, В.Н. Building Thermophysics: The Thermophysical Basis of Heating, Ventilation and Air Conditioning; China Building Industry Press: Beijing, China, 1988. [Google Scholar]
  20. Gnielinski, V. New Equations for Heat and Mass Transfer in the Turbulent Flow in Pipes and Channels. NASA STI/Recon Tech. Rep. A 1975, 41, 8–16. [Google Scholar]
  21. Hollands, K.G.T.; Unny, T.E.; Raithby, G.D.; Konicek, L. Free Convective Heat Transfer Across Inclined Air Layers. J. Heat Transf. 1976, 98, 189–193. [Google Scholar] [CrossRef]
  22. Schlichting, H.; Gersten, K. Boundary-Layer Theory, 9th ed.; Springer: Berlin/Heidelberg, Germany, 2016; ISBN 978-3-662-52917-1. [Google Scholar]
  23. Aung, W.; Fletcher, L.S.; Sernas, V. Developing Laminar Free Convection between Vertical Flat Plates with Asymmetric Heating. Int. J. Heat Mass Transf. 1972, 15, 2293–2308. [Google Scholar] [CrossRef]
  24. Wilson, M.J.; Paul, M.C. Effect of Mounting Geometry on Convection Occurring under a Photovoltaic Panel and the Corresponding Efficiency Using CFD. Sol. Energy 2011, 85, 2540–2550. [Google Scholar] [CrossRef]
  25. GB51368-2019; Technical Standard for Photovoltaic System on Building. Ministry of Housing and Urban-Rural Development: Beijing, China, 2019.
  26. Naghavi, M.S.; Esmaeilzadeh, A.; Singh, B.; Ang, B.C.; Yoon, T.M.; Ong, K.S. Experimental and Numerical Assessments of Underlying Natural Air Movement on PV Modules Temperature. Sol. Energy 2021, 216, 610–622. [Google Scholar] [CrossRef]
  27. Brian. How to Calculate the Minimum Distance between PV Panels? 2024. Available online: https://www.maysunsolar.com/blog-how-to-calculate-the-minimum-distance-between-pv-panels/ (accessed on 12 August 2025).
  28. Zhang, T.; Yang, H. Heat Transfer Pattern Judgment and Thermal Performance Enhancement of Insulation Air Layers in Building Envelopes. Appl. Energy 2019, 250, 834–845. [Google Scholar] [CrossRef]
  29. Bruno, R.; Bevilacqua, P.; Ferraro, V.; Arcuri, N. Reflective Thermal Insulation in Non-Ventilated Air-Gaps: Experimental and Theoretical Evaluations on the Global Heat Transfer Coefficient. Energy Build. 2021, 236, 110769. [Google Scholar] [CrossRef]
  30. Maleki, A.; Haghighi, A.; El Haj Assad, M.; Mahariq, I.; Alhuyi Nazari, M. A Review on the Approaches Employed for Cooling PV Cells. Sol. Energy 2020, 209, 170–185. [Google Scholar] [CrossRef]
  31. Wang, H.; Wei, J.; Guo, C.; Yang, L.; Wang, Z. Numerical Investigation of the Effects of Different Influencing Factors on Thermal Performance of Naturally Ventilated Roof. Energy 2024, 289, 130039. [Google Scholar] [CrossRef]
  32. Ma, Z.; Hu, L.; Mao, H.; Shao, Q.; Tian, Z.; Luo, Y.; Deng, J.; Sun, D.; Fan, J. Shading Effect and Energy-Saving Potential of Rooftop Photovoltaic on the Top-Floor Room. Sol. Energy 2023, 265, 112099. [Google Scholar] [CrossRef]
  33. ISO6946:2007; Building Components and Building Elements—Thermal Resistance and Thermal Transmittance—Calculation Method. International Organization for Standardization: Geneva, Switzerland, 2007.
  34. Zhang, T.; Yang, H. Optimal Thickness Determination of Insulating Air Layers in Building Envelopes. Energy Procedia 2018, 152, 444–449. [Google Scholar] [CrossRef]
  35. Boukendil, M.; Abdelbaki, A.; Zrikem, Z. Numerical Simulation of Coupled Heat Transfer through Double Hollow Brick Walls: Effects of Mortar Joint Thickness and Emissivity. Appl. Therm. Eng. 2017, 125, 1228–1238. [Google Scholar] [CrossRef]
  36. Nath, B.; Roy, S.; Das, B.; Ehyaei, M.A. Experimental and Numerical Study of a Novel Composite Building Wall U-Value. Therm. Sci. Eng. Prog. 2024, 53, 102751. [Google Scholar] [CrossRef]
  37. Zhang, Y.; Du, K.; He, J.; Yang, L.; Li, Y.; Li, S. Impact Factors Analysis on the Thermal Performance of Hollow Block Wall. Energy Build. 2014, 75, 330–341. [Google Scholar] [CrossRef]
Figure 1. Overview of the test barn environment. (a) General view. Blue markers indicate measurement points inside and outside the barn. (b) Front view. (c) Side view. (d) Top view. (e) Real view.
Agriculture 15 01938 g001
Figure 2. The roof structures in (a) Condition A, (b) Condition B, and (c) Condition C.
Agriculture 15 01938 g002
Figure 3. Structure of ventilated air layer.
Agriculture 15 01938 g003
Figure 4. Changes in the characteristic number equation before and after correction.
Agriculture 15 01938 g004
Figure 5. (a) Harmonic eigenvalue and (b) air layer temperature ta with air layer spacing δa.
Agriculture 15 01938 g005
Figure 6. (a) Harmonic eigenvalue and (b) heat flux q with air layer thickness δa.
Agriculture 15 01938 g006
Figure 7. Equivalent thermal resistance Req with air layer thickness δa.
Agriculture 15 01938 g007
Table 1. Correction coefficient (ε) varies with body size (l/δa) of ventilated air layer.
IndexValue
l/δa2030406080≥100
ε1.281.181.131.051.021.00
Table 2. Thermal environment test results of the test barn.
Environmental ParameterValueUnit
Mean value of outdoor air velocity0.9m·s−1
Mean value of outdoor temperature29.4°C
Amplitude of outdoor temperature5.8°C
Peak time of outdoor temperature14.0h
Mean value of solar radiation intensity outdoors184W·m−2
Amplitude of solar radiation intensity outdoors232W·m−2
Peak time of solar radiation intensity outdoors12.0h
Mean value of indoor temperature28.0°C
Amplitude of indoor temperature3.0°C
Peak time of indoor temperature14.0h
Disclaimer/Publisher’s Note: The statements, opinions and data contained in all publications are solely those of the individual author(s) and contributor(s) and not of MDPI and/or the editor(s). MDPI and/or the editor(s) disclaim responsibility for any injury to people or property resulting from any ideas, methods, instructions or products referred to in the content.