Article

Precision Feeding on Pig Fattening Farms: Can Simplified Implementation Enhance Productivity and Reduce Pollutant Emissions?

1
Departamento de Producción Agraria, Escuela Técnica Superior de Ingeniería Agronómica, Agroalimentaria y de Biosistemas, Universidad Politécnica de Madrid, Ciudad Universitaria, 28040 Madrid, Spain
2
Animal Data Analytics, S.L., C/Dámaso Alonso, 14, 40006 Segovia, Spain
3
Departamento de Ciencia Animal, Escuela Técnica Superior de Ingeniería Agronómica y del Medio Natural, Universitat Politècnica de València, Camino de Vera s/n, 46022 Valencia, Spain
4
BC3—Basque Centre for Climate Change—Klima Alddaketa Ikergai, Sede Building 1, 1st Floor, Scientific Campus of the University of que Basque Country, 48940 Leioa, Spain
5
Ikerbasque, Basque Foundation Science, Plaza Eusakadi, 5, 48009 Bilbao, Spain
*
Author to whom correspondence should be addressed.
Agriculture 2025, 15(18), 1935; https://doi.org/10.3390/agriculture15181935
Submission received: 4 August 2025 / Revised: 9 September 2025 / Accepted: 9 September 2025 / Published: 12 September 2025
(This article belongs to the Section Farm Animal Production)

Abstract

This study evaluated a simplified precision feeding (PF) strategy on pig fattening farms to assess its effects on economic performance and pollutant emissions. PF in pig production can reduce nitrogen (N) intake, excretion, and slurry-related environmental impacts, yet its implementation is difficult due to the need for daily diet adjustments to match pigs’ changing requirements. This work tested a simplified PF approach: two commercial feeds, a nutrient-rich pre-grower and a nutrient-poor finisher, were blended weekly based on the lysine needs of two groups of pigs, defined by initial body weight. During the fattening period, blend feeding (BF) sustained growth and feed intake at levels comparable to those with conventional three-phase feeding, but heavy pigs under BF showed reduced feed efficiency. Nitrogen excretion and slurry ammonia (NH3) emissions did not differ significantly, but BF increased methane and carbon dioxide emissions in the slurry from heavy pigs. The results show that simplified PF can provide economic benefits without compromising performance, but BF formulation should also address potential NH3 and greenhouse gas emissions during slurry storage. The integration of artificial intelligence-driven tools for real-time diet adjustments at the farm level would be of great interest to enhance sustainability and efficiency, because the economic benefits of PF application were evident.

1. Introduction

The perspectives of several international organisations regarding meat consumption, such as the OECD-FAO Agricultural Outlook 2024–2035, indicate that the global meat supply will be expanded to meet the growing demand during the period 2025–2034, reaching 406 million tonnes (carcass weight) in 2034. It is expected that of the total meat demand, pigs will take a prominent place, reaching 130 Mt carcass weight equivalent by 2034. Pork will remain the third largest contributor to the growth in global meat consumption [1].
The increase in global pig production in the coming decade will be driven by the recovery from African swine fever in the Asian region, which will contribute two thirds of the additional global production. However, EU pork production is expected to decrease slightly due to environmental pressures. Although the positive economic impact of the sector will continue to be significant, the negative environmental aspects, including impacts on air and climate change, soil, water, and biodiversity, are also relevant [2]. Animal production generates emissions of gases such as ammonia (NH3), methane (CH4), and carbon dioxide (CO2). On pig farms, NH3 and CH4 are products of manure decomposition, while CO2 is mainly a product of animal metabolism [3].
Techniques to reduce emissions at the farm level (i.e., nutritional strategies) are of relevance, as they are located at the beginning of the livestock production chain and focused on optimising the utilisation of the nutrients provided through the feed, reducing their excretion. These techniques have a double benefit: (1) the use of raw materials is improved, with a consequent reduction in the indirect environmental impacts associated with ingredient sourcing, processing, and feed transport; (2) the benefit achieved is extended throughout the entire production chain, promoting lower impacts on housing, storage, and slurry application to the field [4].
Currently, these techniques are applied using several feeds in the piglet and fattening phases and are widely implemented in the intensive pig sector [5]. However, the technology available today allows this concept to be advanced by day-to-day adjustment of feed nutrients with the daily mixing of two types of feed, one with a high nutrient concentration and the other with a low density of nutrients. The mix is adapted to the actual requirements of the animals based on their age and body weight (BW), and a specific mix can be set up for each batch, pen, or feeder.
Utilisation of precision feeding (PF) techniques in growing pig operations can significantly reduce nitrogen (N) and phosphorous intake (25%), N excretion (40%), and greenhouse gas emissions (6%) by increasing individual nutrient efficiency [6]. Bourdon et al. [7] compared a diet (17.5% crude protein, CP) for growing/finishing with a phase-feeding strategy in which, every week, diets were adjusted with a variable mix of two diets (13.0 and 10.7% CP balanced with synthetic amino acids) and were able to achieve a 50% reduction in N excretion. Likewise, the European reference document on the best available techniques for pigs and poultry, IRPP-BREF [8], shows a reduction of more than 40% in NH3 emissions from fattening pigs with daily feed adjustments of 18 to 13% CP, balancing the content of limiting amino acids, mainly lysine, methionine, and threonine [9].
Studies involving the use of low-CP diets showed no negative effects on pig performance when feeds were optimally balanced in amino acids and other nutrients, such as energy content [10,11,12]. In addition, other studies [13,14] have found significant improvements in production efficiency with PF techniques and, consequently, a reduction in production costs. However, according to Andretta et al. [15], as well as taking into account the variation in pigs’ nutritional requirements over time, it is important to consider the inter-animal variability of these needs within the same population. Although under commercial conditions the same diet is fed to all pigs in each batch, requirements vary greatly from animal to animal, even in age- or sex-standardised groups. Considering this heterogeneity, optimal reduction in nutrient excretion can be achieved by tailoring diets to individual nutritional requirements over time.
Therefore, precision nutrition can significantly contribute to reducing the environmental footprint of animal production systems, but it requires the utilisation of sound nutritional concepts and detailed biological models developed to precisely estimate real-time nutrient requirements at the level of individual or small groups of animals [16]. One of the most significant implications of the PF system is that it represents a substantial change in pig feeding, as it takes into account the variation in nutrient requirements between animals, as well as their evolution over time. Pigs can effectively regulate their feed intake to meet energy needs but lack a precise mechanism to adjust protein or essential amino acid intake according to growth requirements [17]. Therefore, to better match nutrient intake with physiological needs during the fattening period, it is necessary to gradually reduce the protein content in their feed. Although current technology and knowledge allow for high degrees of precision, the application of this strategy may be complex on commercial farms. For that reason, the purpose of this work was to assess a simplified PF system where certain benefits can be anticipated with a relatively small adjustment to the production reality.
In view of previous work, it was considered relevant to apply PF principles to commercial feeds that are readily available on pig farms during the growing–fattening period in order to reduce nutrient loss, slurry gaseous emissions, and production costs. The aim was to determine whether production performance could be maintained while lowering pollutant emissions from slurry storage and saving money by mixing a feed with high nutrient content with another feed with low nutrient concentration on a weekly basis according to pig requirements.

2. Materials and Methods

2.1. Experimental Facilities and Animals

The trial took place on a research farm in Segovia, Spain. The animals were housed in clean and disinfected facilities with a capacity of 920 piglets and 1995 fattening pigs, with 48 pens for piglets and 160 pens for fattening. The trials in this work were conducted in the fattening area. This building had 4 rooms, 14.10 m wide and 30.54 m long, and had a 0.45–0.60 m deep slurry pit under a totally slatted floor with an available surface area of 423 m2 per room, excluding corridors (Figure 1). There were 40 pens (3.00 × 3.00 m) in each room. Each room was ventilated with four chimney fans, 0.63 m in diameter, that were operated at variable speed depending on the temperature. Pens included one feeder and one waterer. In this building, there were 16 pens with individual slurry pits, 4 per room, which allowed individual mass balances between feed input and slurry output. This permitted determination of the influence of the treatments on the quality of the slurry.
This farm had a PF system (Spotmix, Schauer Agrotronic GbmH., Prambachkirchen, Austria) that allowed automated feeding, applying feeding curves by pen adjusted to the pigs’ age and BW. Feed was delivered pneumatically to each pen, tailoring diets and monitoring intake remotely, to analyse the influence of small nutritional variations on animal performance and slurry emissions.
A total of 520 commercial crossbreed pigs (Pietrain boar × DNA sow; 260 males and 260 females) of 63 days of age and 23.1 ± 2.46 kg live weight, on average, were allotted to one experimental room (room 4, Figure 1); thirteen pigs were housed in each 9 m2 pen (0.62 m2 per pig, considering the space occupied by the feeder), according to their initial weight and sex, following a procedure commonly applied on commercial farms in Spain [5]. The duration of the experimental trial corresponded to the entire fattening period of the animals, and the expected final weight was around 105 kg (161 days of age).

2.2. Experimental Design

The study was extended over a three-month period during the growing–fattening period of a batch of pigs. The trial was carried out from 8th May to 13th August. Two feeding strategies were compared: conventional (C) feeding following a usual feeding plan with three diets (pre-grower, grower, and finisher feeds) and blend feeding (BF), in which two diets (pre-grower and a different low-nutrient-density finisher feed) were mixed weekly in different proportions according to lysine growth requirements and provided to the pigs (Table 1). Each replicate consisted of 13 pigs, with 20 replicates per feeding strategy. Thus, 260 pigs participated in each strategy, with a total of 40 replicates.
Any pig showing signs of illness or injury or in poor condition was excluded from the selection process. Pigs were distributed by sex and initial body weight (BW) into 20 pens by feeding treatment, ensuring that both strategies were analogous in terms of sex and initial BW. Pigs had ad libitum access to dry feed (pelleted) and drinking water. The amount of feed provided to feeders was adjusted, if needed, every day to avoid feed spoilage.
The trial room was split into blocks of four consecutive pens to ensure an even distribution of feeding strategies (C and BF) and genders in the room. Each block had two pens (a female pen and a male pen) assigned to each feeding strategy. Pigs were allocated to pens to ensure uniform average pen BW, and pens were categorised as light or heavy according to their initial BW. This categorisation was made by calculating the BW median; hence, on day 63 of life, 50% of pens within each feeding strategy were categorised as light and 50% as heavy.
Pigs in strategy C (both light and heavy) were fed using a commercial three-phase feeding programme, consisting of a pre-grower diet from 63 to 84 days of age, then a grower diet from 84 to 140 days of age, and finally, a finisher diet from 140 to 161 days of age.
For pigs in the BF group, two main diets were used: the same pre-grower as in the C strategy and a different finisher diet with a low nutrient density (finisher-BF). These diets were mixed weekly in proportions adjusted according to the animals’ lysine requirements. In order to accurately calculate lysine requirements, the BW categorisation of pigs was considered (light and heavy). Standardised ileal digestible (SID) lysine requirements were estimated using the Brazilian tables for poultry and swine [18]. This model, selected for its simplicity, uses the following empirical equation to estimate the daily population SID lysine requirements:
SID lysine requirements (g/day) = 0.036 × BW0.75 + Y × ADG
where BW is the body weight in kg, and ADG is the average daily gain in kg per day of the average pig population. The variable Y is defined as
Y = 16.664 + 0.0736 × BW − 0.0003 × BW2
Therefore, weekly requirements were established considering the initial average BW and estimating the ADG of light and heavy pigs for the next week, without differentiating by sex. To ensure that requirements remained accurate as pigs grew, lysine requirements were recalculated according to the average BW reached by the pigs in the light and heavy pens at the end of each phase (end pre-growing, day 84; end growing, day 140).
To predict feed consumption, the historical data from the same genotype of pigs receiving the C feeding strategy at the experimental farm was used as a reference. These consumption values were plotted on a graph, and several trend lines were obtained. The best fit was a second-degree polynomial trend line expressed as
Y = −0.0002x2 + 0.0632x − 2.0276
where Y was the estimated consumption (kg/day), and x the age of the animals in days. With this predicted intake, and knowing the lysine requirement in grams per day obtained with Equation (1), the weekly dietary lysine concentration was calculated separately for light and heavy pens.
Feed was provided ad libitum in pellets using feeders (one per pen), and non-medicated water was also freely provided from drinkers (one per pen). Environmental conditions (temperature and ventilation rate) appropriate for the age of the pigs were automatically controlled during the study. At the start of the experiment, allocation of feeding strategies to pens was performed randomly (computer-generated random allocation) to follow a randomised complete design (Figure 2). Of the four pens with independent pits available in room 4 (ID 405, 416, 425, and 436), two were assigned to C male animals and the other two to BF male pigs (both from the block of heavy pens).

2.3. Diets

Diets were manufactured by a local feed company, Proinserga (Fuentepelayo, Spain), and did not contain any antibiotics or any other growth promoters. The conventional feeding strategy (C) used in this trial has three diets formulated to meet or exceed the nutrient requirements for each growing phase, as recommended by De Blas et al. [19]. For the BF strategy, a low-nutrient-density diet intended for pig maintenance (finisher-BF) was selected. In this diet, wheat-middling and sunflower meal replaced soybean meal, and the fibre content was lower than that reported in other studies where decreased carcass performance was observed [20]. In commercial feeding mills, it is common practice to reduce the cost of finisher feed by adding calcium carbonate, and the finisher-BF strategy followed this approach. The composition and calculated nutrient content of the diets are presented in Table 2 and Table 3, respectively.

2.4. Productive Performance

Body weight was monitored by pen at 63 (initial), 84 (end of pre-growing), 140 (end of growing), and 161 days of age (end of finishing and end of trial). Feed intake by pen was automatically recorded weekly using the electronic feeder’s software (VFPig 6.0.63.0, Schauer Agrotronic GbmH, Prambachkirchen, Austria). From these data, ADG and feed conversion ratio (FCR; feed–gain) were calculated for the 63–84-, 84–140-, 140–161-, and 63–161-day periods. Mortality was recorded throughout the trial.

2.5. Slurry Controls and Gas Emissions

The slurry from two pits of males and heavy pigs was collected for both feeding strategies at two different timepoints of the experiment (n = 8): a first intermediate sampling in the middle of the growing phase (8 July 2024, day 120 of age) and a second final sampling at the end of the study (5 August 2024, 160 days of age). At each sampling point, a total of 50 L of manure was collected in 60 L drums from pits 405, 416, 425, and 436. Samples were transported on the same day of collection (day 120 and day 160 of age) to the Universitat Politècnica de València facilities for further analysis. Slurry drums were stored in cold storage at 4 °C until the start of the gas emission measurement trial.
The slurry gas emission trial was carried out under controlled and monitored conditions, which allowed comparative testing of the different treatments used, at the environmental simulation laboratory of the Institute of Animal Science and Technology of the Universitat Politècnica de València. This laboratory has a room with automated and homogeneous ventilation, avoiding differential interference from external factors. The trial was conducted over a total of 12 weeks, with measurements starting the week of 2 September and ending the week of 18 November.
During the experiment, slurry from each drum was sampled twice, at the beginning and at the end of the experiment, to determine its chemical composition. To ensure a representative sampling, the slurry was homogenised by agitation for 1 min in each drum before sampling. The determined parameters included dry matter (DM), ash, and total Kjeldahl N (TKN) and ammoniacal N (N-NH3). Organic matter (OM) was calculated by the difference between the percentage of DM and ash, following the American Public Health Association (APHA) methods [21]. Given the relevance of pH for NH3 emissions, pH was determined weekly, after the end of the gas emission measurements, using a pH-meter (Basic 20, CRISON, Barcelona, Spain). Electrical conductivity was measured only at the start of the emission trial with a conductivity meter (Basic 30, CRISON, Barcelona, Spain).
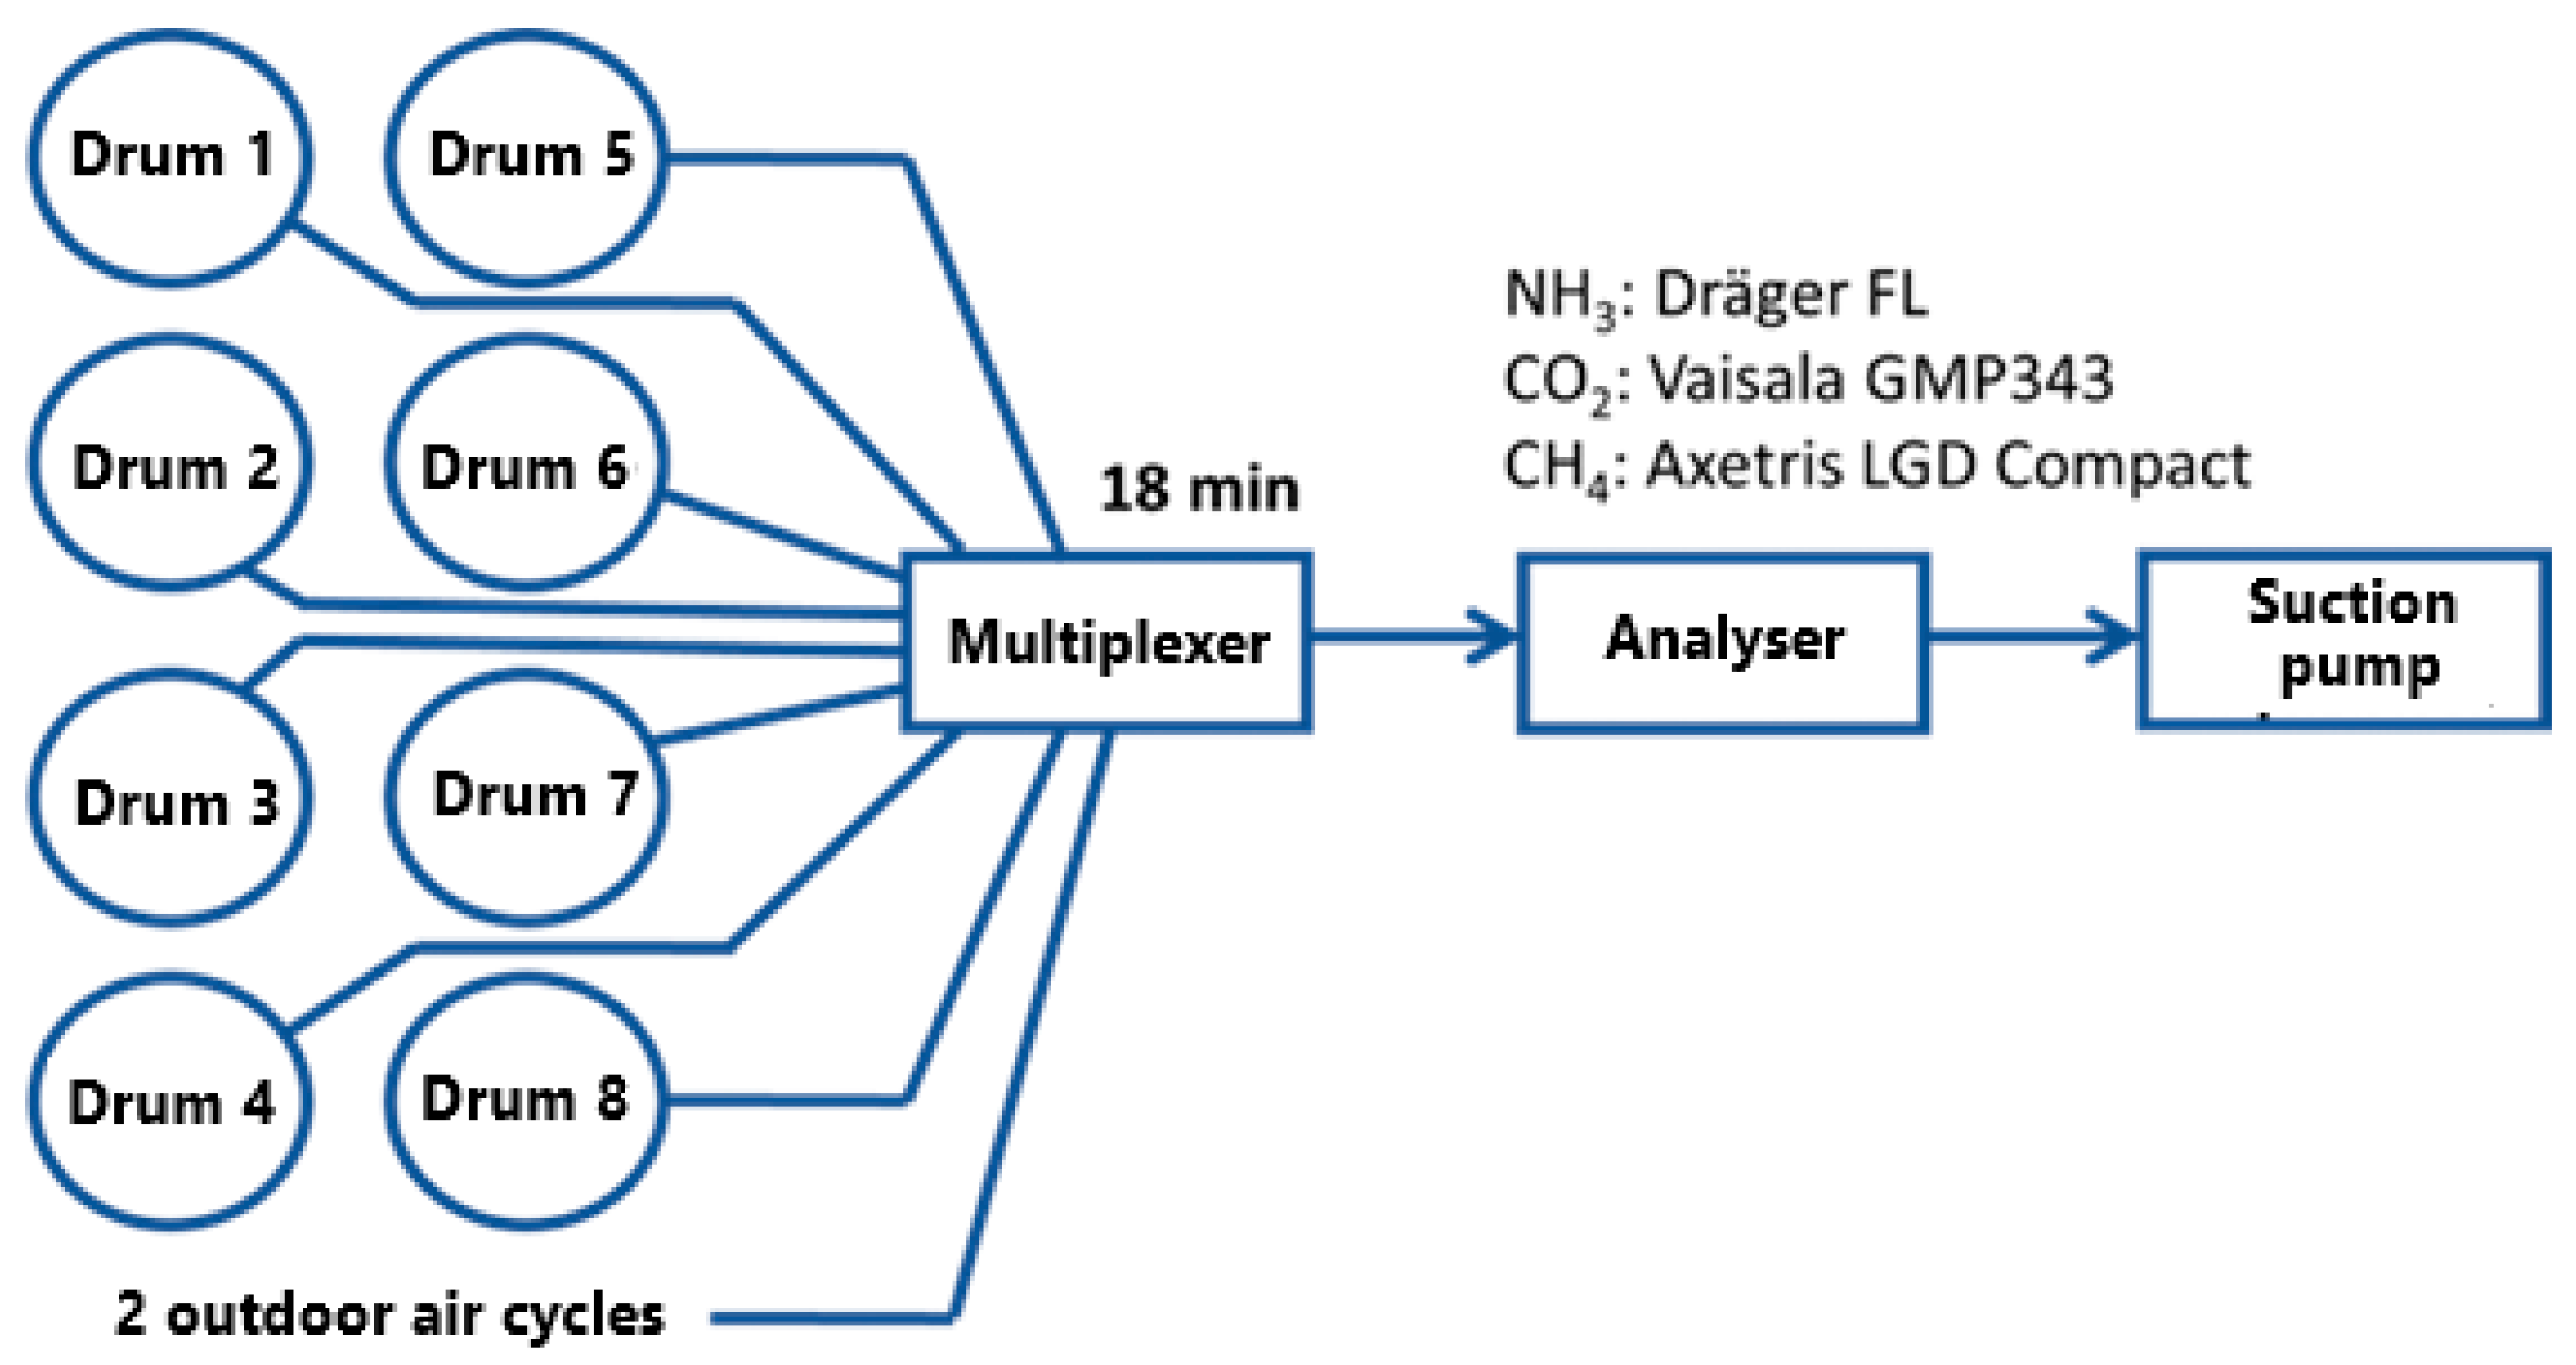
Gas emissions from each treatment were measured using the dynamic chamber technique, which consists of delimiting an enclosed space and ventilating it with a given ventilation flow rate. The NH3, CH4, and CO2 emissions were measured weekly in eight drums, as shown in Figure 3. The chambers were formed by closing each drum with a hermetic cover fitted with a flow-adjustable exhaust fan located in the centre of the cover. Additional holes in the cover were also created to allow free air to enter. The exhaust fan was connected to a plastic tube, from which the air sample was drawn for the determination of the outlet concentrations. A Dragger FL sensor (measuring range 0–100 ppm) was used to measure the NH3 concentration. CO2 concentration was measured using a Vaisala GMP343 sensor, Vantaa, Finland (range 0–2000 ppm). CH4 concentration was measured using an Axetris LGD Compact A, Kaegiswil, Switzerland (range 0–100 ppm). These three devices were connected to a suction pump that allowed air to circulate at a flow rate of 1 L per minute. These devices were connected to a data logger (HOBO MX1105, OnsetComp, Bourne, MA, USA), which recorded the data from the three sensors at a frequency of 10 s for further processing. The air velocity was measured at the beginning and at the end of each measurement cycle with a fan-wheel anemometer (Testo model 435 with 60 mm windlass sonde).
The emissions were calculated by multiplying the exhaust air flow rate by the difference in gas concentrations between the outlet and inlet, using this formula:
E = (Coutlet − Cinlet) × V
where E is the emission rate, expressed in mg/h; Coutlet and Cinlet are the outlet and inlet concentrations of the target gas, expressed in mg/m3; and V is the ventilation flow rate of the chamber, expressed in m3/h.
In addition, the ambient temperature and the temperature inside the drums were measured, as well as the ambient relative humidity. These records were made using the HOBO U12 sensor (OnsetComp, Bourne, MA, USA), collecting data at a frequency of 5 min.
The measurements were carried out continuously for three days (72 h) each week in consecutive measurement cycles that alternately sampled each of the drums and the outside air. A programmable multiplexer system with 10 input channels (8 drums and 2 outside) and 1 output to the measurement equipment was used for this purpose (Figure 3). Each measurement cycle was completed in three hours, allowing 18 min of measurement of each of the eight drums and 36 min of outside ambient air measurement. The gas concentrations provided by the sensors in volumetric concentration (ppm) were transformed to mass concentration (mg/m3), according to the air volume measured and the molecular mass of each gas, to calculate gas emissions, expressed in mg/h, using formula (4).

2.6. Nitrogen Balance

The N balance study was carried out following the methodology proposed in the Zootechnical Basis for the Calculation of the Feed Balance of Nitrogen and Phosphorus [22].
Crude protein intake was calculated by multiplying the DM intake by the CP content of the diets, expressed as total N, using a conversion factor of 0.16. To calculate N retained in the animals, the following formula, based on the provided methodology, was used:
Growing and fattening pigs (20 to 110 kg):
Nret (kg N per pig) = 0.16 × 0.168 × ADG (kg/day) × Total days of fattening
where Nret is the N retained in animal growth, and ADG is the average daily gain in kg per day.

2.7. Feed Cost Calculations

Feed costs for each dietary treatment were calculated based on the annual feed price trends observed in 2024 and the first half of 2025. Figure 4 shows the price development of the commercial feeds used over the year 2024 (Source: PROINSERGA, S.A., Segovia, Spain).
The cost of fattening a pig was calculated under the most extreme conditions, using the highest (January 2024) and the lowest (September 2024) feed/protein prices.
Cost Conventional (EUR/pig) = ADFIpre-grower × Nº days × COSTpre-grower + ADFIgrower × Nº days × COSTgrower + ADFIfinisher × Nº days × COSTfinisher
Cost Blend feeding (EUR/pig) = ∑ (ADFIweek × Blend COSTweek × 7) for all 12 weeks
where ADFI is the average daily feed intake in kg per day, and the weekly Blend Cost is calculated by multiplying the proportion of each feed (pre-grower and finisher-BF) in the blend by their respective costs.

2.8. Statistical Analysis

The statistical software used was SAS (version 9.4) [23]. For animal performance, the basic study design implemented was a randomised complete block design, and the pen was the experimental unit for statistical purposes. Normality of all growth performance data was checked using the proc UNIVARIATE of SAS. If the variable did not follow a normal distribution, the presence of outliers was evaluated with the analysis of studentised residuals. Variables that did not fit a normal distribution were analysed by the non-parametric Kruskal–Wallis test (Proc NPAR1WAY of SAS). Variables following a normal distribution were analysed by ANOVA using the PROC MIXED procedure of SAS, where feeding strategy (C or BF) and BW block (light or heavy) were included as fixed effects, and pen as a random effect. Mortality was analysed as a binary variable using the chi-square test (proc FREQ of SAS).
For gas emissions, the data was analysed as repeated measurements over time. Three-day data were aggregated into weekly averages for graphical representation. The slurry composition data are presented per sampling day (at the beginning and at the end of the gas measurement trial).
Variable = µ + Treatmentj + Samplingj + Treatmentj × Samplingj + εij
in which
  • Variable is the variable on which the effect is intended to be studied (emission, composition…);
  • µ is the mean of the model;
  • Treatmentj is the effect of the treatment (C or BF);
  • Samplingj is the effect of the time of sampling (Intermediate vs. Final);
  • Treatmenti × Samplingj is the effect of the interaction between the two previous variables;
  • εij is the error of the model.
Differences with p ≤ 0.05 were considered statistically significant, while those with 0.05 < p ≤ 0.10 were considered a trend. Least-square means are reported.

3. Results

3.1. Diets

All diets in this study consisted of standard commercial pig feeds obtained from a local supplier. In the C strategy, all pigs received isoenergetic diets, with protein and SID lysine concentrations progressively decreasing from the pre-grower to the finisher feeds. In the BF strategy, weekly custom-blended diets were provided to pens classified as light or heavy. Table 4 shows the proportions of pre-grower and finisher-BF feeds in the blended diets. It is worth mentioning that pig BW was measured at 84 and 140 days of age to reassess SID lysine requirements based on the average BW of each group at the end of the pre-growing and growing phases, respectively.
Since light pigs grew more slowly and remained lighter, they received a higher proportion of pre-grower feed for a longer duration compared to heavy pigs. On average, light pens consumed 67% pre-grower feed, while heavy pens received 53% throughout the trial. Consequently, the SID-lysine-to-net-energy ratios of the blended diets (3.52 and 3.42 g/Mcal for light and heavy pigs, respectively) closely matched the ratio of the C strategy (3.55 g/Mcal). The differences fall within the range (3.3 to 3.8 g/Mcal) previously confirmed not to adversely affect pig performance [24,25,26].

3.2. Animal Performance

Table 5 presents the fattening performance results of pigs fed C and BF strategies and categorised as heavy or light by initial pen BW for each growing period. Initial BW at day 63 did not differ between C and BF within either heavy or light pens, confirming effective block randomisation. During the early growth period (day 63–84), the BF strategy did not affect performance, while heavy pigs gained more weight (p = 0.024) and tended to consume more feed (p = 0.081), but FCR was not affected by BW. Final BW at day 84 was significantly different between heavy and light pigs (p = 0.022), indicating that the initial differences between BW blocks were retained.
From d84 to d140, the BF strategy continued to have no significant impact on ADG or ADFI. However, there was an interaction between feeding strategy and BW block for FCR (p = 0.036), with FCR improving for light but worsening for heavy pens. This effect was related to a trend toward higher ADG in light compared to heavy pens (a 4.6% increase; p = 0.086), while ADFI was similar between BW blocks. As a result, final BW at day 140 did not differ between BW blocks or feeding strategies.
In the final phase (d140 to d161), ADG remained unaffected by feeding strategies, while ADFI tended to increase in the BF group (2.9% increase; p = 0.086). Consequently, final BW did not differ between feeding strategies or BW blocks, while FCR was 6.5% higher (p < 0.05) in the BF strategy compared to the C strategy.
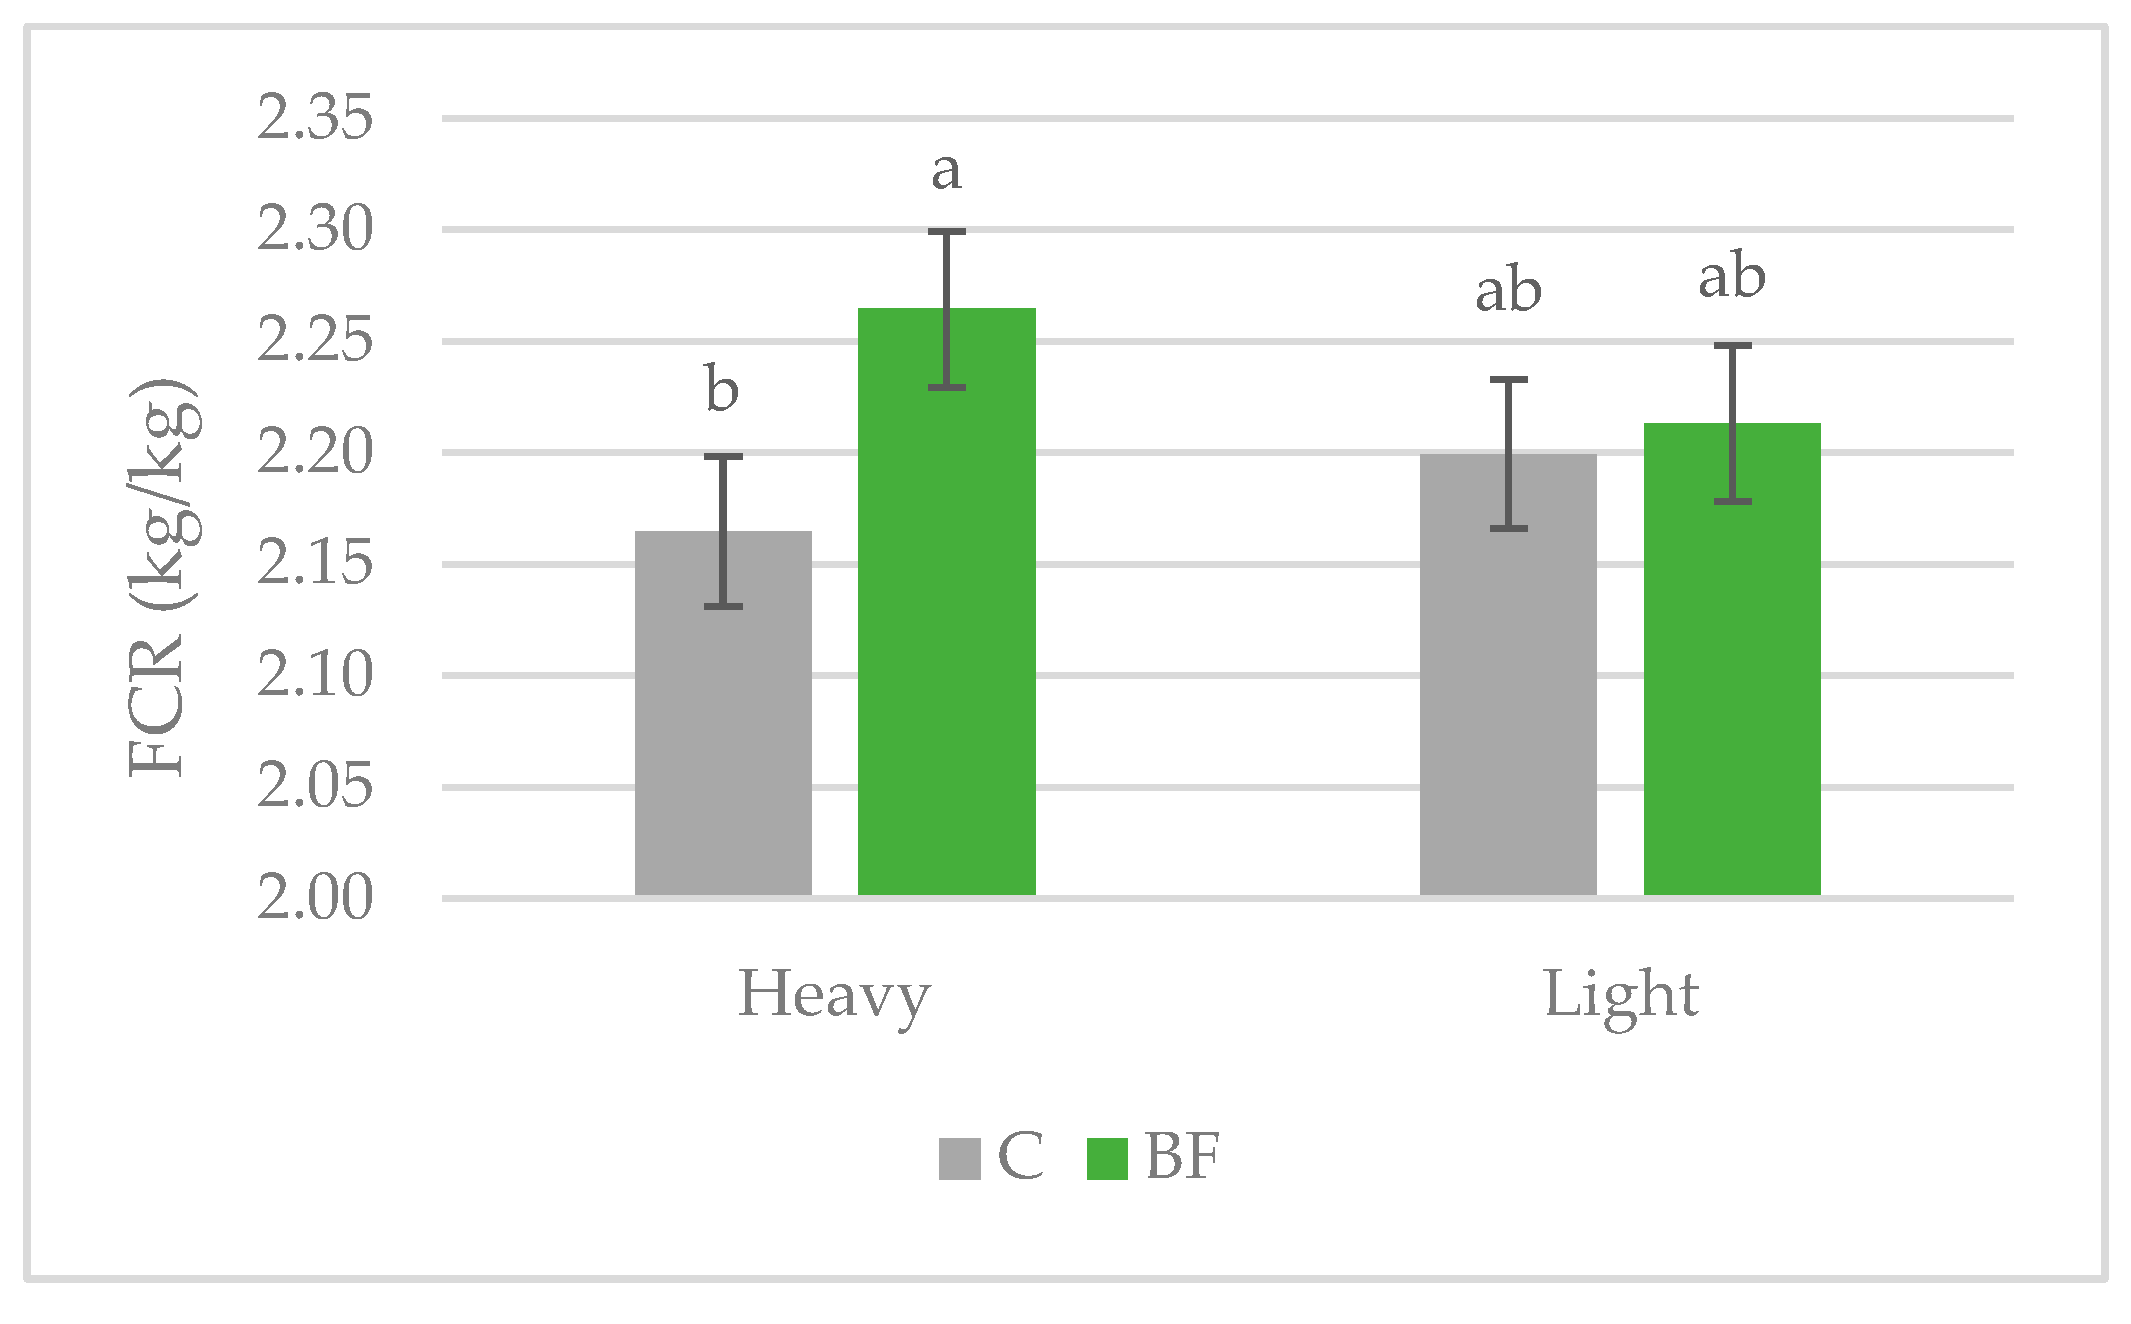
Focusing on the overall fattening period (63 to 161 days of age), both ADG and ADFI were similar across feeding strategies and BW blocks (p > 0.05). However, FCR showed a significant interaction between feeding strategy and BW block (p = 0.039). Heavy pigs on the BF diet performed less efficiently (higher FCR) compared to those on the C strategy, while light pigs showed intermediate FCR values, with no significant difference between feeding strategies (Figure 5). Final BW was not affected by feeding strategy or BW block at the end of the fattening period. This result suggests that adapting BF diets according to BW block may improve final BW uniformity within pig batches.
Mortality rates did not differ (p > 0.05) between feeding strategies, being 2.69% and 4.23% in C and BF, respectively. Similarly, they were 2.50% in the heavy and 4.42% in the light BW pig categories.

3.3. Nitrogen Balance Results

Table 6 shows the N intake and excretion per pig according to feeding strategy (C vs. BF) and BW category (heavy vs. light) during the fattening period. Nitrogen efficiency was calculated as the proportion of ingested N retained in growth.
N balance was influenced by the interaction between feeding strategy and BW block (Figure 6). In heavy pigs, BF reduced both N intake (−0.08 kg/pig) and N excretion (−0.03 kg/pig) compared to the C strategy. Conversely, in light pigs, BF increased both N intake (+0.03 kg N/pig) and N excretion (+0.02 kg/pig) relative to C. These opposing effects resulted in a statistically significant interaction between feeding strategy and BW block for N ingested (p < 0.05) and a tendency for N excreted (p = 0.057). Nitrogen efficiency did not differ significantly between feeding strategies or BW blocks, nor was there a significant interaction effect, indicating that the proportion of ingested N retained in growth remained relatively consistent regardless of pig BW or feeding strategy.

3.4. Slurry Composition

Table 7 presents the intermediate and final chemical compositions of the slurry collected from pigs subjected to either the C or BF strategy during the fattening period. Interactions between feeding strategy and time were non-significant (p > 0.10) and, therefore, are not reported. High variability was observed within the same feeding strategy, which made it difficult to obtain significant differences. The composition of the slurry in the BF group was notably influenced by the pen with ID 405, which consistently exhibited much higher DM, total N, and N-NH3 concentrations in both intermediate and final samplings compared to other pens. At the final sampling time, slurry composition showed marked decreases in the concentrations of total N and N-NH3, because of volatilisation, and a slight increase in DM content in most drums, probably due to water evaporation over time.
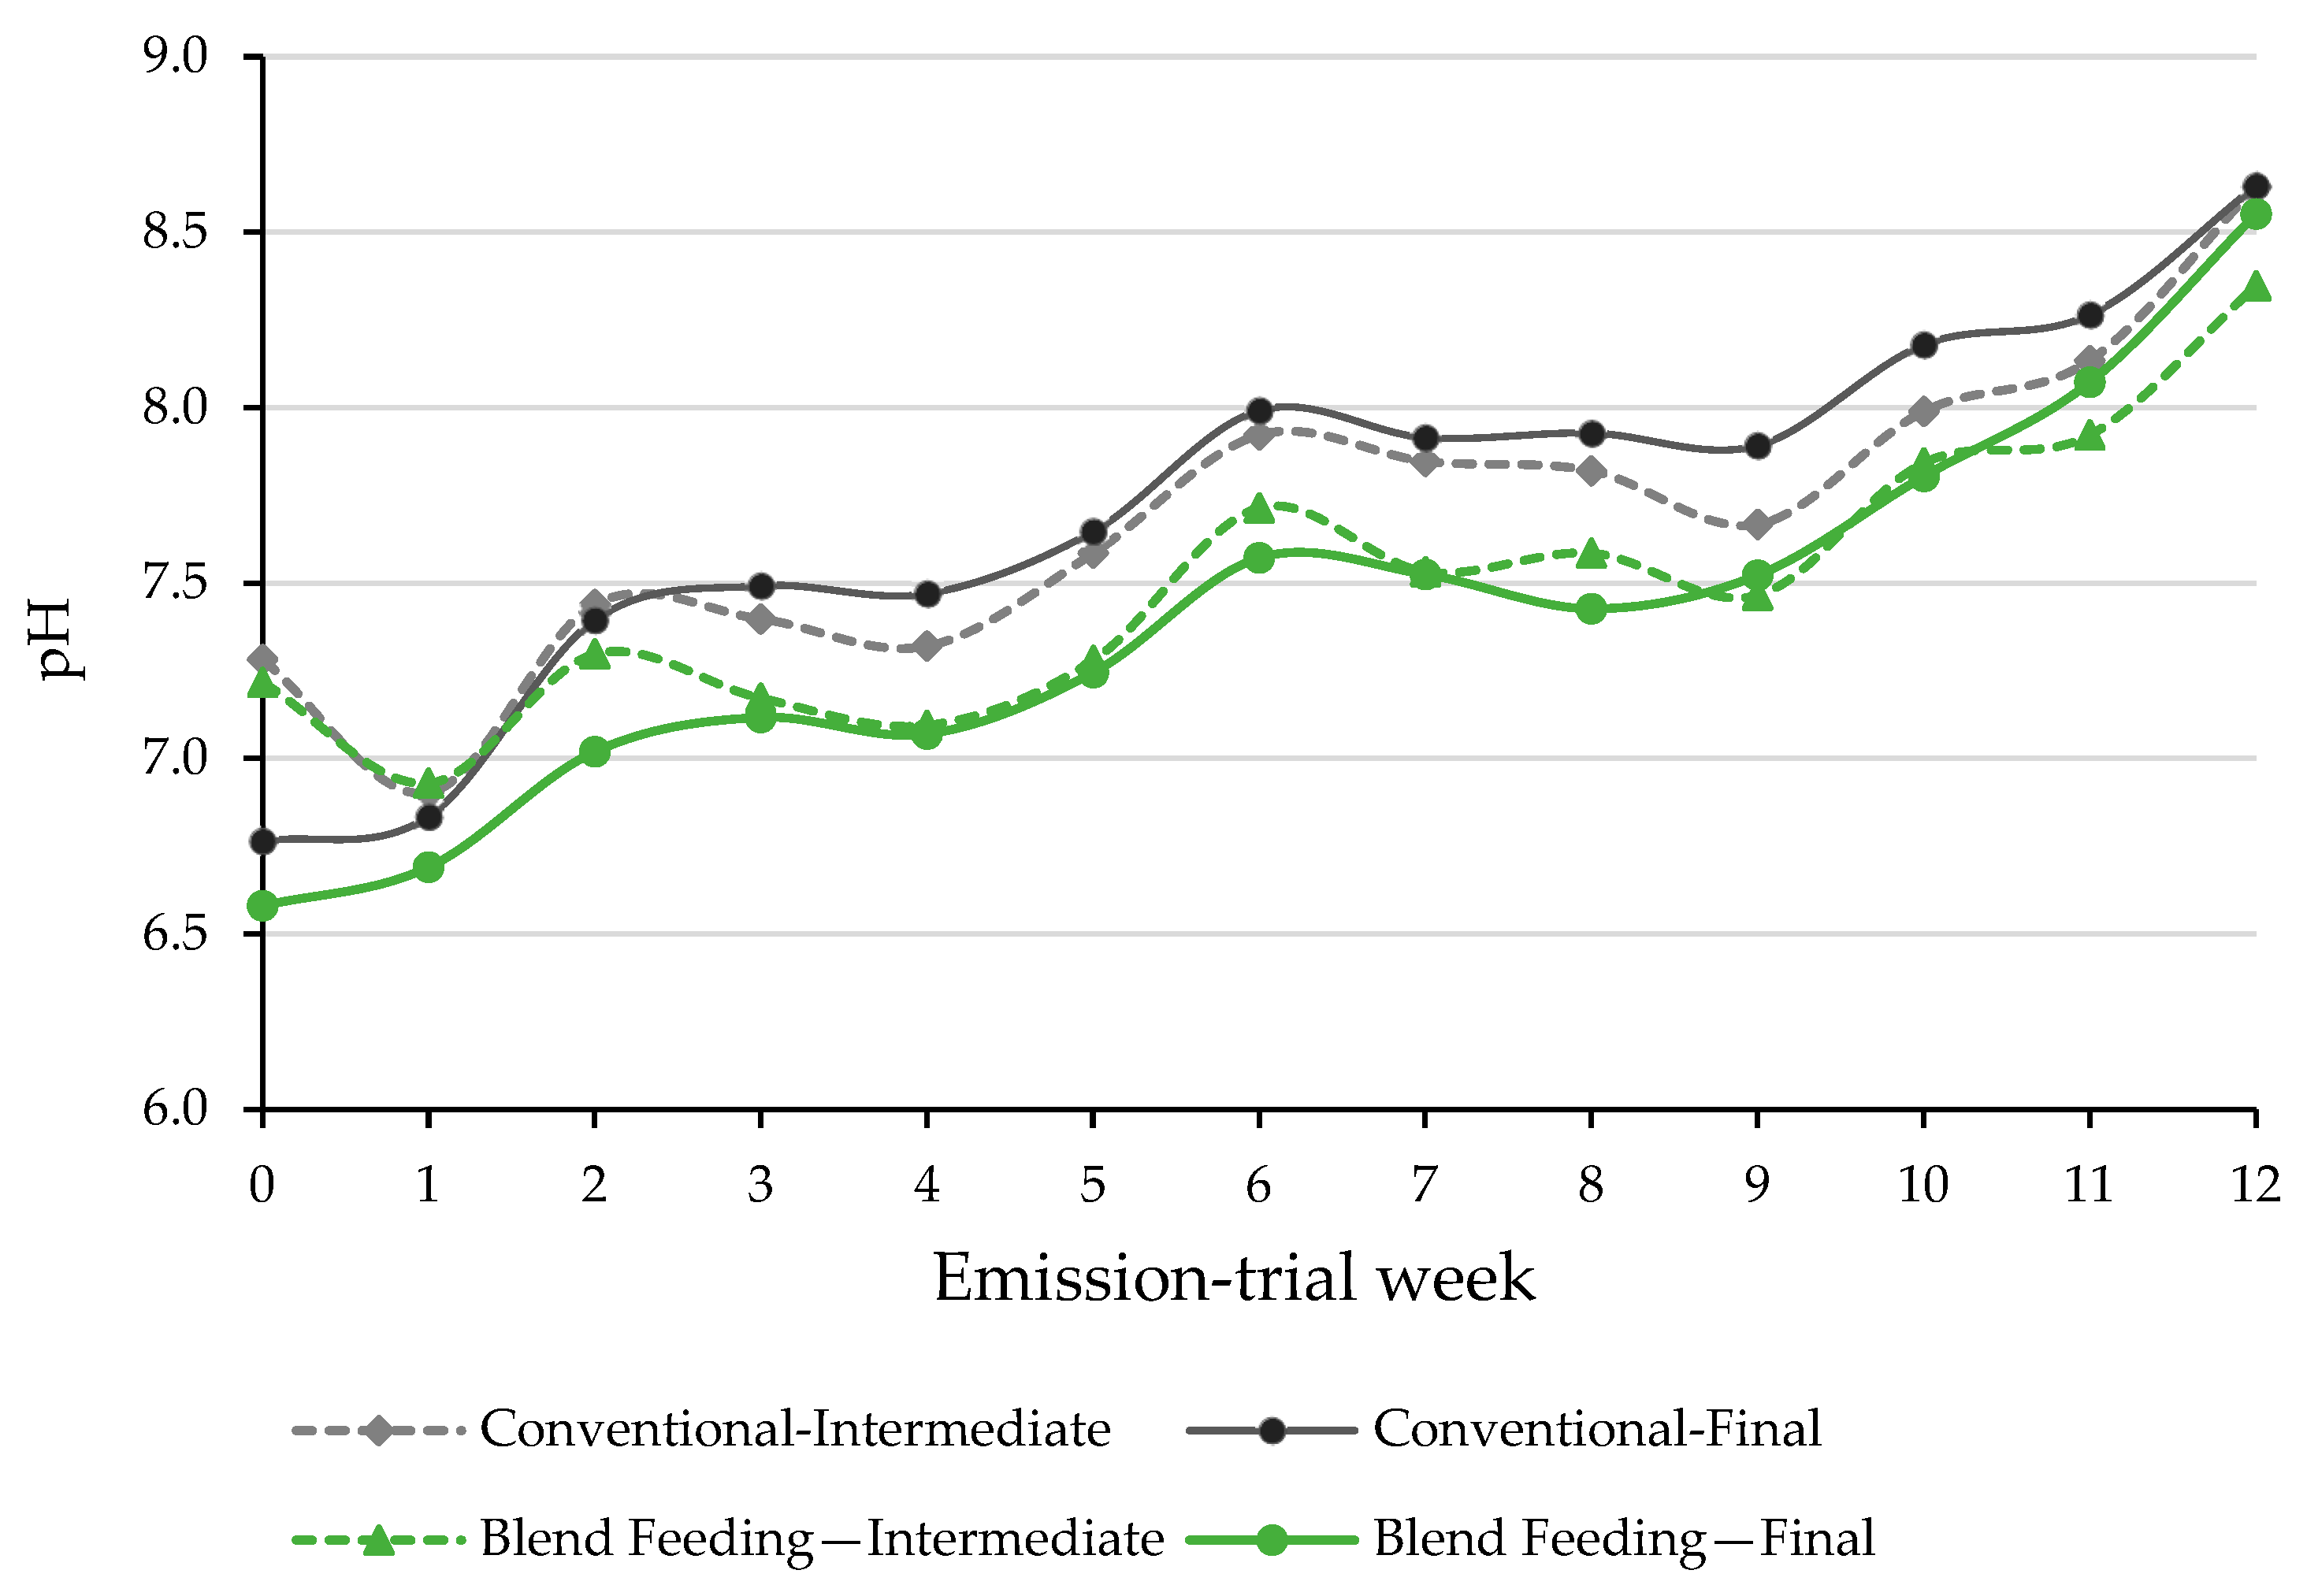
The weekly evolution of pH values during the 12-week emission trial is shown in Figure 7. Overall, the pH increased over the course of storage for all treatments. The sampling time affected (p < 0.05) the initial pH (Table 7), but this effect diminished over the course of storage. Slurry pH from the BF group was significantly lower than that from the C group (p < 0.001) throughout the storage period, despite there being no significant differences between feeding strategies (Table 7) in initial or final pH (neither for intermediate nor final sampling). This finding indicates that, despite similar pH values at the onset and conclusion of storage, the overall pH evolution differed by feeding strategy, with the BF group maintaining lower values during most of the storage period.

3.5. Temperature and Gas Emissions

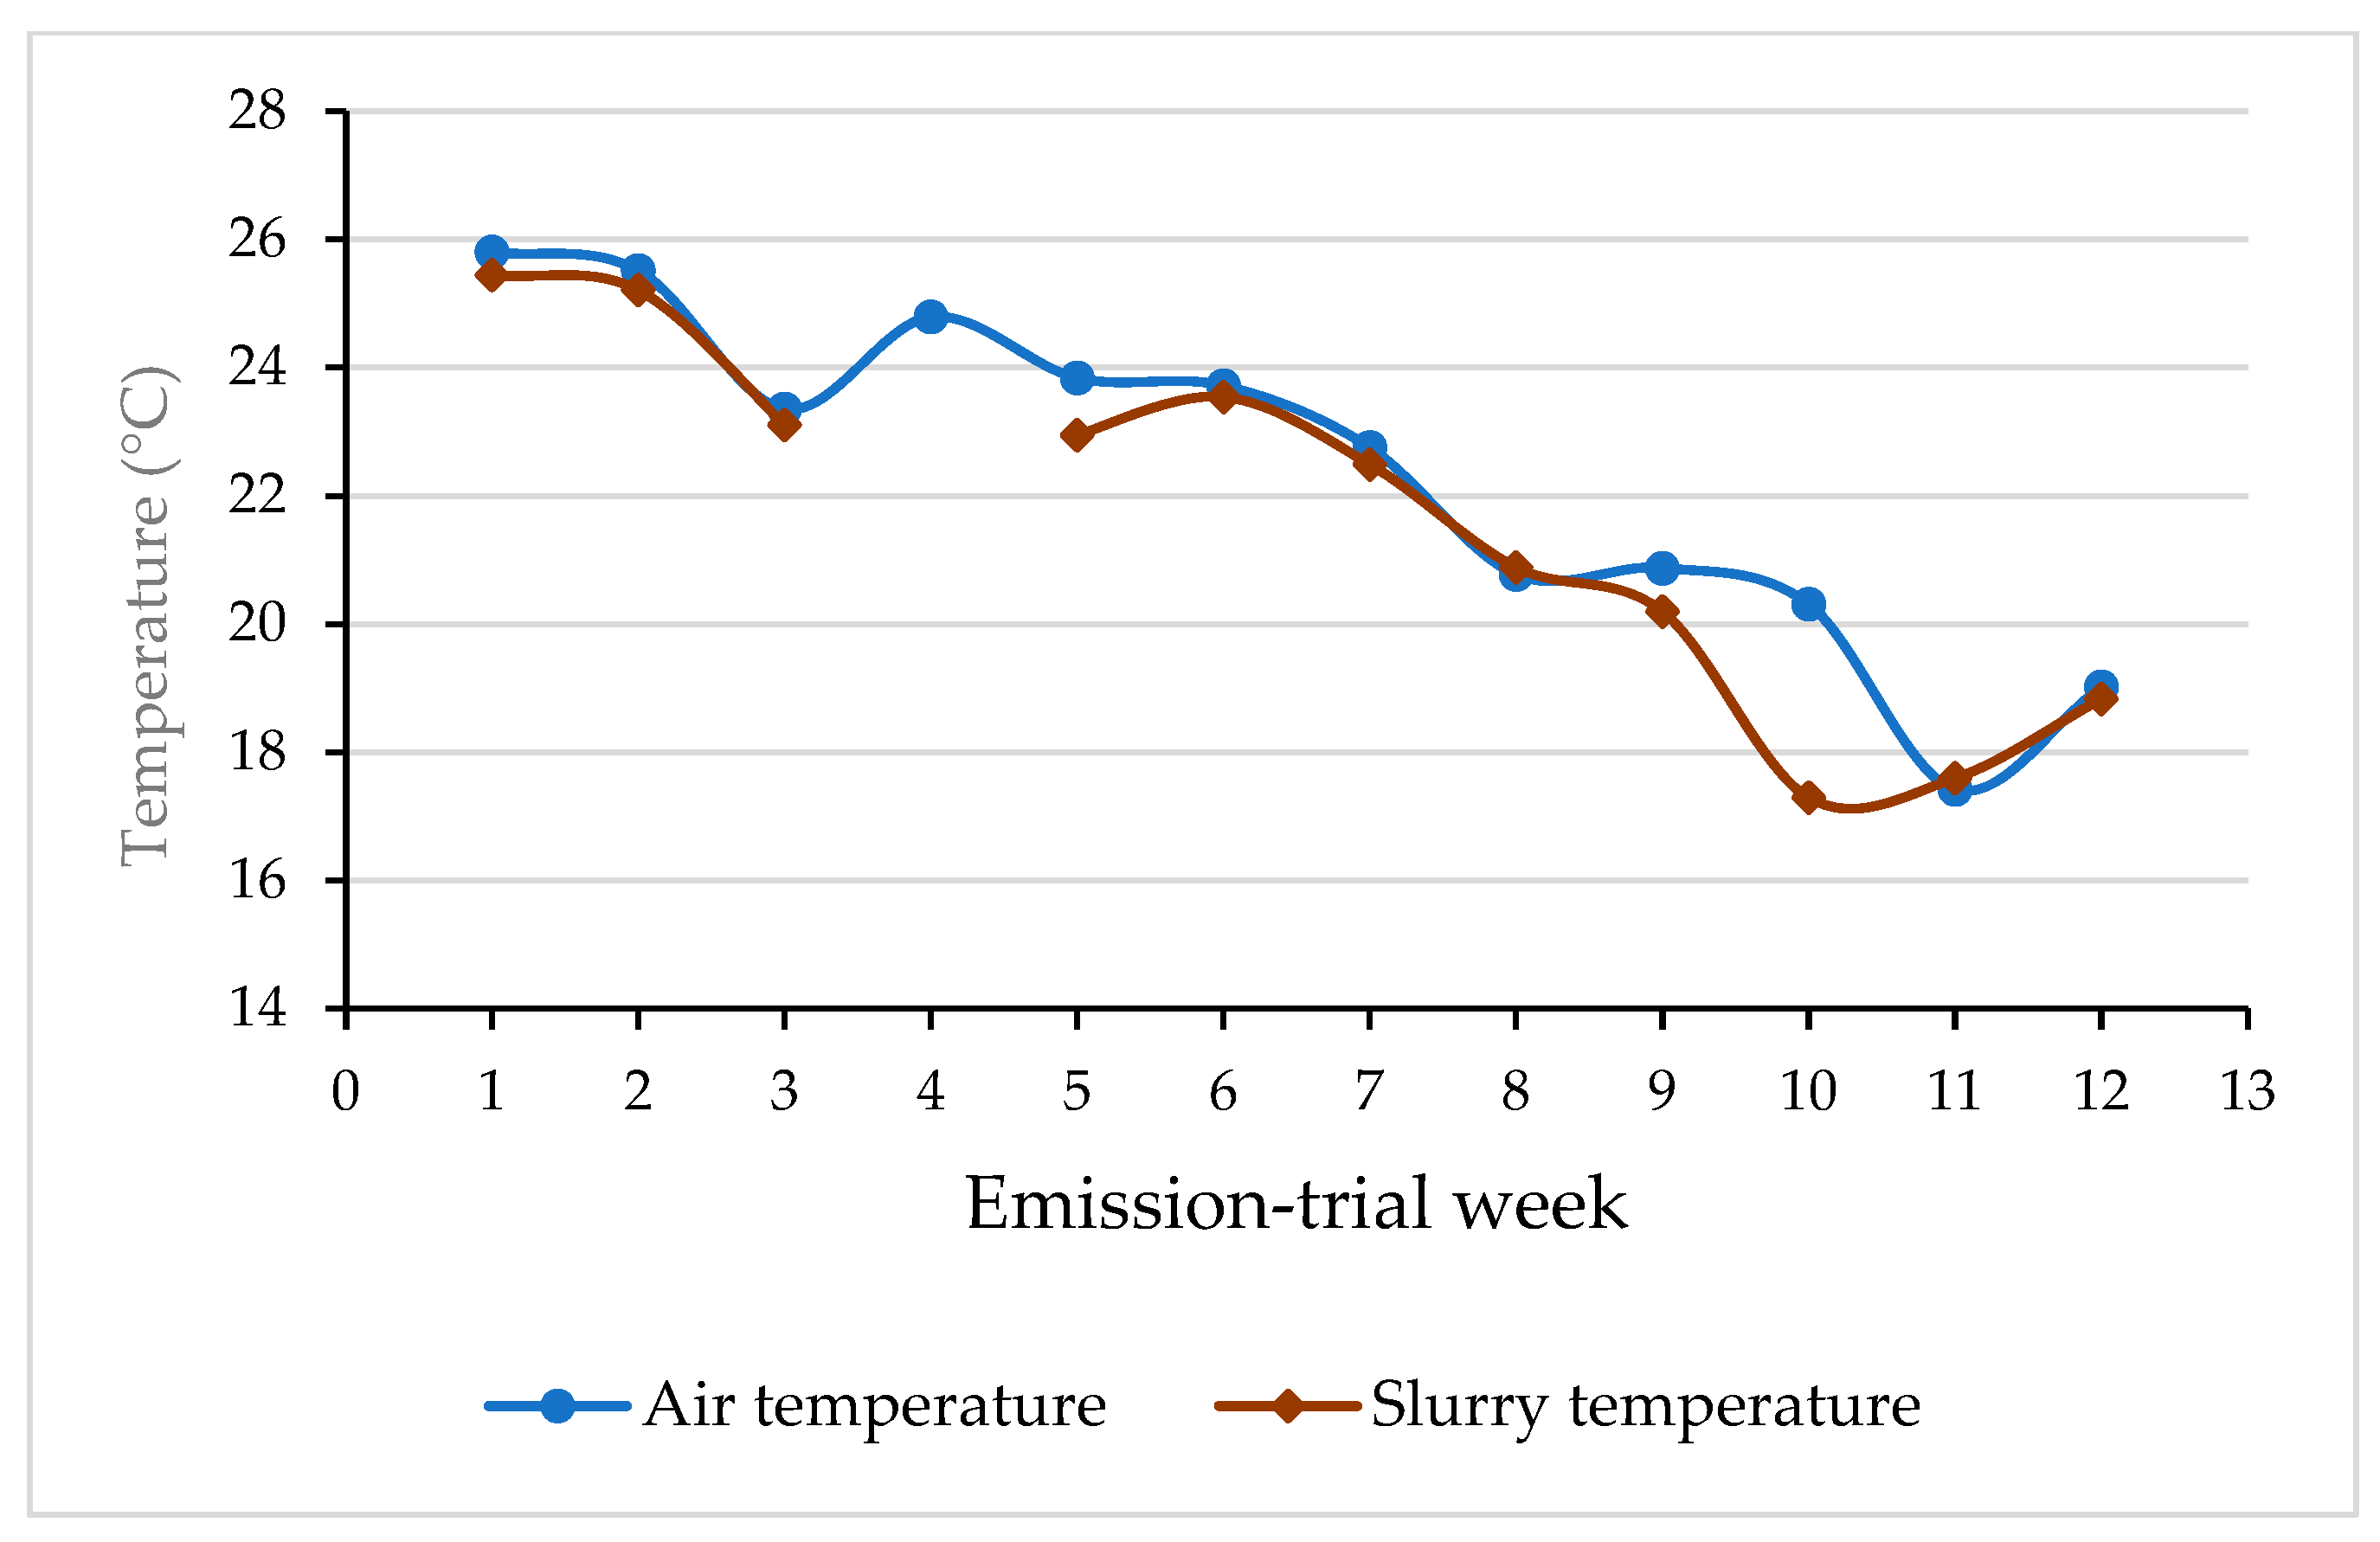
Figure 8 shows the evolution of both air and average slurry temperatures measured over the 12-week storage period. The temperature profiles for air and slurry remained closely aligned throughout the storage period, indicating the importance of environmental temperature in slurry thermal dynamics.
Table 8 shows the average NH3, CH4, and CO2 emission rates over the storage period. For NH3 emissions, values were similar between feeding strategies and across sampling periods, ranging from 1.88 to 2.46 g/m3 per hour, with no significant differences (p > 0.05) observed for strategy, sampling time, or their interaction. Methane emissions were higher (p < 0.001) in the BF compared to the C feeding strategy, on average, resulting in nearly a 90% increase in CH4 emissions across both sampling periods. With respect to sampling times, CH4 emissions increased (p < 0.001) from the intermediate to the final sampling, with an average rise of about 166% across both strategies. Finally, slurries from the BF group emitted 197% more CO2 than those from the C group (p = 0.001), which is also consistent with their higher average DM content, while sampling time and the interaction had no significant effects.
Figure 9 shows the accumulated gas emissions (NH3, CH4, and CO2) under the two feeding strategies over a 12-week period of storage (emission trial), each evaluated in slurries collected at intermediate and final sampling timepoints, which gives an additional indication of the dynamic temporal pattern of emissions.
For NH3 (Figure 9a), after the initial two weeks, emissions started to exhibit a decreasing pattern, most likely related to the decrease in ambient-slurry temperatures (Figure 7) and N available for volatilisation.
In the temporal evolution of CH4 emissions (Figure 9b), both C and BF groups display an increase in CH4 emissions during the initial weeks, followed by stabilisation and a slight decrease towards the end of the storage trial. The BF strategy consistently leads to higher CH4 emissions compared to the C group throughout the trial, with the difference being especially notable at the final sampling point due to the presence of an unusual sample. As previously noted, one sample at the final sampling presented anomalously high DM content, which affected the average CH4 emissions for this treatment.
In all cases, CO2 emissions (Figure 9c) followed a decreasing trend throughout the storage period. However, the BF group maintained higher CO2 production than the C group at both intermediate and final timepoints. The temporal decline in CO2 emissions with each feeding strategy likely reflects changes in microbial activity, with metabolic pathways shifting towards more anaerobic consortia that produce less CO2 and more CH4, as easily degradable substrates are depleted.
Gas emissions were also expressed as ratios relative to the emission substrate (Table 9). For NH3, emissions are shown as the ratio of N emitted as ammonia (N-NH3e) to the N-NH3 present in the slurry at the start of the emission trial. In the case of CH4, the ratio between total CH4 emitted (CH4e) and the theoretical CH4 production potential (MCF) calculated according to the IPCC [27] recommendations is presented. Neither the feeding strategy (BF vs. C) nor sampling time (intermediate vs. final) had a statistically significant effect on NH3 or CH4 emission ratios. Ammonia emission ratios ranged from 0.690 to 0.850, while CH4 emission ratios increased over time but did not differ between treatments. While numerical trends are apparent (e.g., lower final NH3 emissions for BF and increased CH4 ratios from intermediate to final sampling), these may be attributable to random variation (SEM: 0.130–0.200) rather than an effect of treatment or sampling time.

3.6. Feed Cost

Table 10 shows the feed cost of fattening a pig from 63 to 161 days of age according to the dietary treatment under two price scenarios for the feeds used in this trial: when the cost was cheaper (September 2024) and when it was expensive (January 2024).
BF consistently reduced feed costs (p < 0.05) across both low- and high-market-price scenarios, independent of the initial BW category of the animals. Feed cost savings were EUR −1.76 per pig and EUR −2.0 per pig under low- and high-feed-cost conditions, respectively.

4. Discussion

The implementation of precision nutrition represents a paradigm shift toward sustainable livestock farming, offering significant potential to optimise production efficiency, reduce costs, and minimise environmental impact through reduced nutrient waste. This approach extends beyond the use of advanced technologies in feed distribution, including a comprehensive management system for diet formulation that optimises both animal performance and resource utilisation. Precision nutrition involves three key actions: (1) automated data collection, (2) data processing and analysis, and (3) real-time control actions for dietary adjustments in response to an individual animal’s growth needs [14]. However, commercial adoption of this system remains limited, largely due to substantial variability in both initial BW and growth potential within pig batches. This variability constrains the ability to precisely match nutrient requirements and complicates the formulation of blended diets for groups of pigs rather than individual animals.
To address these limitations, this study prioritised the simplification of the PF system by categorising pigs into two groups—“heavy” or “light”—based on their initial BW. In the BF strategy, each group received weekly custom-blended diets made by mixing a nutrient-dense feed (2450 kcal NE/kg; 0.95% SID Lys) with a nutrient-poor feed (2315 kcal NE/kg; 0.67% SID Lys). The blending proportions were calculated to meet the specific lysine needs of each BW group throughout the trial. In contrast, the C feeding strategy applied a standard three-phase feeding strategy to all pigs irrespective of BW.

4.1. Animal Performance

In the C strategy, similar to that commonly used in commercial pig feedlots, the diet formulation is designed to cover the nutritional needs of the most demanding pigs, so some of the animals are overfed [28], and the efficiency of dietary nutrient utilisation is reduced [29]. Given that unutilised nutrients are excreted in urine and faeces, feeding pigs to maximise population responses is associated with high feeding costs and increased environmental nutrient excretion [14,28,29].
Precision feeding systems try to correct this nutritional mismatch by dynamically adjusting dietary nutrient concentrations, ideally daily, but weekly in the present trial, to align with the evolving nutritional needs of pigs during the fattening period [30]. This approach has been shown to reduce overfeeding, improve feed efficiency, lower feed costs, and minimise nutrient excretion into the environment [7,31]. Beyond temporal adjustments, it is also important to consider the variability in BW and growth potential among individuals within a given population; smaller (lighter) pigs eat less feed and grow more slowly than their heavier counterparts. Consequently, light pigs benefit from receiving more nutrient-dense diets for a longer period to maximise their grow potential [17,32]. Thanks to modern PF technologies, it is now possible to deliver custom-blended diets to pens of pigs sorted by BW, precisely formulated to meet the specific nutritional requirements and growth patterns of each BW group [14]. By closely matching diets to animal nutrient requirements, the BF strategy has the potential to improve pig farming sustainability by reducing both feed costs and nutrient excretion and improving economic and environmental outcomes.
In this trial, the low-nutrient-density finisher-BF diet (low-cost feed) had about 50% more fibre (17.5% vs. 11.6% NDF) and 5.5% less net energy (2315 vs. 2450 kcal/kg) compared to the rich-nutrient-density diet (C pre-grower feed). The results demonstrate that diluted BF diets have significant but phase-dependent effects on feed efficiency, modulated by pigs’ initial BW. In general, the feed energy concentration is the primary determinant of feed intake [33]. As the available energy content of BF diets decreases, pigs will try to keep daily energy intake constant by eating more feed, until feed intake is physically limited by the feed’s bulk (due to high fibre content) or other environmental factors [34].
During the pre-grower phase (days 63–84), when the proportion of finisher-BF diet was minimal (3% on average), heavy pigs showed higher ADG and ADFI than light pigs, confirming the well-established relationship between initial BW and early growth rates. However, during the grower phase (days 84–140), when energy dilution increased (finisher-BF making up 47.3% on average), heavy pigs reached physical satiety before they could consume enough feed, resulting in simultaneous energy and amino acid dilution and reduced growth rates. In contrast, light pigs received a lower proportion of finisher-BF feed (32% on average) during this phase, and their ADG did not differ from pigs fed the C diet. Consequently, ADFI did not differ between feeding strategies, and heavy pigs weighed the same as light pigs in the BW control carried out on day 140.
In the final fattening phase (days 140–161), finisher-BF proportions increased further (70 and 90% for light and heavy pigs, respectively), and the diets contained 2355 kcal/kg (light) and 2330 kcal/kg (heavy) in BF compared to 2450 kcal/kg in the C strategy. Despite the lower dietary energy, ADG and final BW of animals were not significantly different, but the overall FCR increased by 6.6% in the BF group. This likely reflects that as pigs grow larger and physical intake capacity increases, they can compensate for a lower dietary energy density by consuming more feed to maintain energy intake and growth performance [35]. Furthermore, protein restriction in the BF strategy compared to the C strategy may have induced a compensatory growth response during the final fattening phase. In pig production, moderate protein restriction during initial growth stages can lead to increased growth rates later during the finishing phase and improve feed efficiency [36]. Therefore, it can be concluded that the BF strategy appeared to disadvantage heavier pigs, whose higher growth potential was not fully realised due to physical constraints on feed intake that limited nutrient supply. Despite this, the BF strategy tended to improve batch uniformity of final BW (p = 0.08), as indicated by a decrease in the coefficient of variation (CV ± SE) from 13.2 ± 2.18% on day 63 to 11.2 ± 1.82% on day 161.
The adjustment and dosage of diets could benefit from artificial intelligence tools (AI), as well as technological advances in feed supply, to improve the prediction of the individual nutritional needs of each pig according to BW evolution. Some of the limitations outlined in this article for the systematic application of this technique can be minimised by applying AI and machine learning systems to analyse data automatically, predict nutrient requirements more frequently, and adjust diet composition in real time. The application of AI tools will enable the matching of real-time-monitored pig intake with the evolution of pig weight and nutritional requirements [29], guiding PF management toward more sustainable and cost-effective pig farming.
In a second phase, this study will be complemented by an equivalent experimental trial in which the diets will be formulated to be isoenergetic and iso-fibrous, and additional weight controls will be carried out for growth adjustment to animal requirements based on novel models, including AI prediction methods.

4.2. Nitrogen Balance and Slurry Composition

The BF strategy also demonstrated BW-dependent effects on N balance, with heavy pigs benefiting from diluted BF diets through compensatory growth mechanisms that improve N efficiency and reduce both intake and excretion. During compensatory growth, pigs exhibit enhanced protein synthesis efficiency and reduced maintenance energy requirements relative to their growth potential, allowing them to achieve higher N retention despite lower total N intake [35]. In contrast, light pigs presented slightly greater N intake and excretion under the BF strategy compared to C but have better N efficiency than heavy pigs, because N retention efficiency is inversely related to pig BW. The differential responses observed support the conclusion that the BF strategy should be tailored to initial pig BW to optimise N utilisation, as PF systems have demonstrated the ability to reduce excretion by up to 30% [16].
It should be noted that the N content of the slurry from each pen sampled should not be directly related to the N excreta of the pigs involved in the trial, as the N content of the slurry, expressed as a percentage of the volume, is determined by the slurry dilution. This, in turn, depends on the behaviour of the animals in each pen in terms of, e.g., water consumption or water wastage. In addition, it should be taken into account that, even under controlled conditions, the variability in the slurry collected from separated slurry pits shows important differences, as indicated in previous studies [37]. This variability was possibly influenced by differential behaviour between pens regarding feed consumption and water use and potentially made it difficult for significant differences between treatments to manifest despite numerical differences. For this reason, this article attempts to explain the causes and implications of the numerical differences obtained in the pH, N, or DM/OM content of the slurry. In future trials, it would be advisable to have a larger number of replicates to try to compensate for the high variability inherent in slurry samples.
The composition of the slurry is influenced by the fibre content of the pig’s diet. Increasing dietary fibre, particularly fermentable fibre, can affect slurry pH and DM and OM content and potentially impact CH4 production [38]. The lower pH in the BF strategy was related to its higher fibre content, which has been associated with a lower pH in the excreta [35]. It is notable that the lower pH of the BF slurry during the trial could compensate for its higher TKN and N-NH3 content in the BF slurry, which could explain the absence of significant differences in NH3 emissions. Increasing dietary fibre can lead to a higher proportion of OM in the slurry and affect its DM content [38]. Since the fibre level was higher in the BF feeding strategy, a higher DM content can be seen in its slurry. Additionally, the higher OM content in BF could facilitate the appearance of crusts in the slurry, particularly in the final sampling, which, combined with the lower pH, may compensate for the potential increase in NH3 emissions.

4.3. Gas Emissions

NH3 emissions were not affected by the treatment but were affected by the time of slurry sampling, being higher in the intermediate than in the final sampling. Although the TKN and N-NH3 content were numerically higher in the BF feeding strategy, the lower slurry pH of that treatment, due to the higher neutral detergent fibre consumption and the possible crust formed by the higher OM content, could mitigate the effect of the higher N concentration.
On the other hand, NH3 emissions were statistically higher in the first sampling (2.24 mg/m3 per h) than in the second sampling (1.89 mg/m3 per h). This is likely because the initial N-NH3 content in the slurry was greater during the intermediate fattening phase (high dietary N content) and decreased over time due to the emission of this gas. Additionally, the NH3 emission pattern was highly correlated (R2 = 0.94) with the air temperature at each point in time.
CH4 emissions were higher in the BF strategy and in the end-fattening sampling. Methane emissions from pig slurry are significantly influenced by the OM content and its degradation. The amount of OM in the slurry, largely determined by the indigestible feed components, affects the potential for CH4 production during anaerobic digestion [39]. Higher OM content in the BF slurry, resulting from a higher consumption of fibre, probably led to increased CH4 emissions, increasing anaerobic fermentation and volatile fatty acids production due to the greater substrate availability.
The average CH4 emissions were 35.8 mg/h per drum in the first sampling and 93.1 mg/h per drum in the second sampling, with a statistically significant difference between them. The temporal trend of CH4 emissions was increasing over the weeks due to the gradual development of anaerobic degradation processes, leading to CH4 formation. The temperature of the slurry could also affect the evolution of CH4 emissions, as there was a high correlation between the slurry temperature and the CH4 emission pattern (R2 = 0.84).
It should be noted that CO2 from the slurry is not considered a net emission, as it is part of a closed biological cycle in the short term. However, it is a gas that can provide information on the evolution of the slurry and the degradation of the OM it contains. In other words, the results presented in this study only include emissions from the degradation of the slurry, not from the biological cycle of the animals. One of the main sources of CO2 emissions from slurry is the microbial degradation of OM [40]. The higher CO2 emission rates observed in the BF strategy compared to C could be related to this process since, as indicated above, the OM content of slurry from the pigs in the BF group was higher than that in the C group.

4.4. Economic Evaluation

Pigs fed the BF diets reduced feeding costs by EUR 1.76 per pig in the cheap-feed context and by EUR 2.0 per pig when feed was expensive, for both heavy and light pigs. The economic benefits of PF programmes have been reported previously [14,30,41].
Feeding pigs with diets adapted daily reduces excesses of the most expensive nutrients and ingredients, but the magnitude of the reduction in feed costs depends on current local ingredient prices [41]. In addition, PF could provide greater economic benefits in a global scenario, as the system requires only two feeds to be prepared, transported, and stored. Therefore, this innovative feeding and decision support technology is an available tool that can improve the competitiveness of the pig industry.
Since this trial used commercially available feeds within a specific Spanish context, focused on a particular pig genotype and targeted final BW, the results might not be directly applicable to other settings. Variations in raw material costs, feed formulations, pig genetics, and environmental conditions across regions and production systems could lead to different outcomes.

4.5. Implications

In the coming years, the adoption of PF systems in pig production is expected to grow significantly, driven by advancements in AI. Beyond the proven economic benefits, AI will simplify the calculation of individualised nutritional requirements in real time and support their implementation using existing and adapted feeding equipment.
In addition, life-cycle analyses could be systematically integrated into studies through AI, helping to assess environmental impacts more holistically, since regional differences can play a very important role in overall outcomes.

5. Conclusions

Precision feeding is not limited to the incorporation of automated feeders on farms to control pigs’ consumption and manage feed supply in a precise way. Precision feeding should be understood, in a broader sense, as a change in the paradigm of animal nutrition in which new technologies allow us to adapt the real needs of the animals to the nutrient inputs provided by the farmer.
This study supports this postulate and demonstrates that deviations in these nutritional settings may significantly affect performance parameters, especially in animals with high growth potential. In parallel, excessive or poorly balanced diets may compromise the expected reduction in excreted nutrients, such as N, alter other slurry components, and potentially affect undesirable gaseous emissions. However, even partial implementation of PF concepts, as exemplified by this trial, can yield significant economic savings.

Supplementary Materials

The following supporting information can be downloaded at: https://www.mdpi.com/article/10.3390/agriculture15181935/s1, File S1: Composition of different premixes in Table 2.

Author Contributions

Conceptualisation, G.M., M.R., and P.G.-R.; methodology, G.M., M.R., and S.C.; validation, G.M., P.G.-R., C.P., and S.C.; formal analysis, G.M., M.R., and S.C.; investigation, G.M.; resources, C.P.; data curation, G.M., M.R., and S.C.; writing—original draft preparation, G.M.; writing—review and editing, M.R., P.G.-R., C.P., S.C., and M.J.S.; visualisation, G.M.; supervision, P.G.-R. and S.C.; project administration, G.M.; funding acquisition, C.P. All authors have read and agreed to the published version of the manuscript.

Funding

This research was funded by the European Union via the Horizon Europe funding programme for research and innovation and the project Facilitating Innovations for Resilient Livestock Farming Systems (Re-Livestock; 101059609).

Institutional Review Board Statement

Ethical review and approval were waived for this study because only data on pig intake and weight were obtained.

Data Availability Statement

Not applicable.

Acknowledgments

The authors thank ADA and PROINSERGA staff for their assistance with animal care and handling.

Conflicts of Interest

Authors G.M., M.R. and C.P. are employees of the company Animal Data Analytics, S.L. However, these relationships do not imply relevant financial or non-financial competing interests. The remaining authors declare that the research was conducted in the absence of any commercial or financial relationships that could be construed as a potential conflict of interest. The funders had no role in the design of the study; in the collection, analyses, or interpretation of data; in the writing of the manuscript; or in the decision to publish the results.

Abbreviations

The following abbreviations are used in this manuscript:
ADFIAverage daily feed intake
ADGAverage daily gain
AIArtificial intelligence
BFBlend feeding
BWBody weight
CControl
CFCrude fibre
CH4Methane
CO2Carbon dioxide
CPCrude protein
DMDry matter
ECElectrical conductivity
FAOFood and Agricultural Organization of the United Nations
FCRFeed conversion ratio
GHGGreenhouse gases
HHeavy pigs
IPCCIntergovernmental Panel on Climate Change
IRPP-BREFBest Available Techniques Reference Document for Intensive Rearing of Poultry/Pigs
LLight pigs
LysLysine
MCFMethane conversion factor
NNitrogen
N2ONitrous oxide
NDFNeutral detergent fibre
NH3Ammonia
N-NH3Ammoniacal nitrogen
NRCNutrient Requirements of Swine
OECDOrganisation for Economic Co-operation and Development
OMOrganic matter
PFPrecision feeding
SEMStandard error of the mean
SIDStandardised ileal digestible
TKNTotal Kjeldahl nitrogen

References

  1. OECD. Market Examinations in Mexico: Case Study of the Pork Meat Market 2019; OECD: Paris, France, 2019. [Google Scholar] [CrossRef]
  2. FAO. Livestock’s Long Shadow; FAO: Rome, Italy, 2006. [Google Scholar]
  3. National Research Council (NRC). Air Emissions from Animal Feeding Operations: Current Knowledge, Future Needs; National Academies Press: Washington, DC, USA, 2003. [Google Scholar] [CrossRef]
  4. Montalvo Bermejo, G.; Babot Gaspa, D.; Calvet Sanz, S.; Flotats Ripoll, X.; Gallart Arenal, R.; Herrero Encinas, M.; Higuera Pascual, M.Á.; Laínez Andrés, M. Sostenibilidad e Impacto Ambiental de las Explotaciones Porcinas, 1st ed.; Menéndez Carreño, M., Fuica Macías, E., Eds.; Grupo Asís Biomedia, S.L.: Zaragoza, Spain, 2024. [Google Scholar]
  5. Agostini, P.S.; Gasa, J.; Manzanilla, E.G.; Da Silva, C.A.; De Blas, C. Descriptive Study of Production Factors Affecting Performance Traits in Growing-Finishing Pigs in Spain. Span. J. Agric. Res. 2013, 11, 371–381. [Google Scholar] [CrossRef]
  6. Andretta, I.; Hauschild, L.; Kipper, M.; Pires, P.G.S.; Pomar, C. Environmental Impacts of Precision Feeding Programs Applied in Pig Production. Animal 2018, 12, 1990–1998. [Google Scholar] [CrossRef]
  7. Bourdon, D.; Dourmad, J.Y.; Henry, Y. Réduction Des Rejets Azotés Chez Le Porc En Croissance Par La Mise En Oeuvre de l’alimentation Multiphase, Associé à l’abaissement Du Taux Azoté. J. Rech. Porc. 1995, 27, 269–278. [Google Scholar]
  8. Giner Santonja, G.; Georgitzikis, K.; Maria Scalet, B.; Montobbio, P.; Roudier, S.; Delgado Sancho, L. Best Available Techniques (BAT) Reference Document for the Intensive Rearing of Poultry or Pigs—Industrial Emissions Directive 2010/75/EU (Integrated Pollution Prevention and Control); OECD: Paris, France, 2017. [Google Scholar] [CrossRef]
  9. Oenema, O.; Tamminga, S.; Menzi, H.; Aarnink, A.; Piñeiro Noguera, C.; Montalvo Bermejo, G. Livestock Feeding Strategies. In Options for Ammonia Mitigation: Guidance from the UNECE Task Force on Reactive Nitrogen; Bittman, S., Dedina, M., Howard, C.M., Oenema, O., Sutton, M.A., Eds.; Centre for Ecology and Hydrology (CEH): Edimburgh, Scotland, 2014; pp. 10–13. [Google Scholar]
  10. Le Bellego, L.; van Milgen, J.; Noblet, J. Effect of High Temperature and Low-Protein Diets on the Performance of Growing-Finishing Pigs1. J. Anim. Sci. 2002, 80, 691–701. [Google Scholar] [CrossRef]
  11. Rocha, G.C.; Duarte, M.E.; Kim, S.W. Advances, Implications, and Limitations of Low-Crude-Protein Diets in Pig Production. Animals 2022, 12, 3478. [Google Scholar] [CrossRef] [PubMed]
  12. Kerr, B.J.; Southern, L.L.; Bidner, T.D.; Friesen, K.G.; Easter, R.A. Influence of Dietary Protein Level, Amino Acid Supplementation, and Dietary Energy Levels on Growing-Finishing Pig Performance and Carcass Composition1. J. Anim. Sci. 2003, 81, 3075–3087. [Google Scholar] [CrossRef] [PubMed]
  13. Aparicio, M.; Yeste-Vizcaíno, N.; Morales, J.; Soria, N.; Isabel, B.; Piñeiro, C.; González-Bulnes, A. Use of Precision Feeding during Lactation Improves the Productive Yields of Sows and Their Piglets under Commercial Farm Conditions. Animals 2024, 14, 2863. [Google Scholar] [CrossRef] [PubMed]
  14. Pomar, C.; Hauschild, L.; Zhang, G.H.; Pomar, J.; Lovatto, P.A. Precision Feeding Can Significantly Reduce Feeding Cost and Nutrient Excretion in Growing Animals. In Modelling Nutrient Digestion and Utilisation in Farm Animals; Wageningen Academic Publishers: Wageningen, The Netherlands, 2011; pp. 327–334. [Google Scholar] [CrossRef]
  15. Andretta, I.; Pomar, C.; Rivest, J.; Pomar, J.; Lovatto, P.A.; Neto, J.R. The Impact of Feeding Growing-Finishing Pigs with Daily Tailored Diets Using Precision Feeding Techniques on Animal Performance, Nutrient Utilization, and Body and Carcass Composition 1. J. Anim. Sci. 2014, 92, 3925–3936. [Google Scholar] [CrossRef]
  16. Pomar, C.; Remus, A. Review: Fundamentals, Limitations and Pitfalls on the Development and Application of Precision Nutrition Techniques for Precision Livestock Farming. Animal 2023, 17, 100763. [Google Scholar] [CrossRef]
  17. Quiniou, N.; Noblet, J. Effect of the Dietary Net Energy Concentration on Feed Intake and Performance of Growing-Finishing Pigs Housed Individually1. J. Anim. Sci. 2012, 90, 4362–4372. [Google Scholar] [CrossRef]
  18. Horacio Santiago, R.; Luiz Fernando Teixeira, A.; Arele Arlindo, C.; Melissa Izabel, H.; Nilva Kazue, S.; Fenando Guilherme, P.; Gabriel Cipriano, R.; Alysson, S.; Márvio Lobão Teixeira de, A.; Jansller Luiz, G.; et al. Brazilian Tables for Poultry and Swine—Composition of Feedstuffs and Nutritional Requirements; Horacio Santiago, R., Luiz Fernando Teixeira, A., Eds.; Editora Scienza: Sao Carlos, Brazil, 2024. [Google Scholar] [CrossRef]
  19. De Blas, C.; Gasa, J.; Mateos, G.G. Necesidades Nutricionales Para Ganado Porcino. Normas FEDNA, 2nd ed.; FEDNA: Madrid, Spain, 2013. [Google Scholar]
  20. Mauch, E.D.; Young, J.M.; Serão, N.V.L.; Hsu, W.L.; Patience, J.F.; Kerr, B.J.; Weber, T.E.; Gabler, N.K.; Dekkers, J.C.M. Effect of Lower-Energy, Higher-Fiber Diets on Pigs Divergently Selected for Residual Feed Intake When Fed Higher-Energy, Lower-Fiber Diets1. J. Anim. Sci. 2018, 96, 1221–1236. [Google Scholar] [CrossRef]
  21. APHA. Standard Methods for the Examination of Water and Wastewater, 21st ed.; American Public Health Association, American Water Works Association, Water Environment Federation, Eds.; APHA: Washington, DC, USA, 2005. [Google Scholar]
  22. Babot Gaspa, D.; Coma, J.; Carrión, D. Bases Zootécnicas Para el Cálculo del Balance Alimentario de Nitrógeno y de Fósforo, 2nd ed.; Ministerio de Agricultura, Pesca y Alimentación, Eds.; Centro de Publicaciones del Ministerio de Agricultura y Pesca, Alimentación y Medio Ambiente: Madrid, Spain, 2024. [Google Scholar]
  23. SAS Institute Inc. SAS/STAT ® 9.1 User’s Guide; SAS Institute Inc.: Cary, NC, USA, 2004. [Google Scholar]
  24. Main, R.G.; Dritz, S.S.; Tokach, M.D.; Goodband, R.D.; Nelssen, J.L. Determining an Optimum Lysine:Calorie Ratio for Barrows and Gilts in a Commercial Finishing Facility. J. Anim. Sci. 2008, 86, 2190–2207. [Google Scholar] [CrossRef] [PubMed]
  25. Lee, J.H.; Lee, S.D.; Yun, W.; Oh, H.J.; An, J.S.; Kim, I.H.; Cho, J.H. Effects of Different Standardized Ileal Digestible Lysine: Net Energy Proportion in Growing and Finishing Pigs. J. Anim. Sci. Technol. 2020, 62, 198–207. [Google Scholar] [CrossRef]
  26. Marçal, D.A.; Kiefer, C.; Tokach, M.D.; Dritz, S.S.; Woodworth, J.C.; Goodband, R.D.; Cemin, H.S.; Derouchey, J.M. Diet Formulation Method Influences the Response to Increasing Net Energy in Finishing Pigs. Transl. Anim. Sci. 2019, 3, 1349–1358. [Google Scholar] [CrossRef]
  27. IPCC. 2019 Refinement to the 2006 IPCC Guidelines for National Greenhouse Gas Inventories; Calvo Buendia, E., Tanabe, K., Kranjc, A., Baasansuren, J., Fukuda, M., Ngarize, S., Osako, A., Pyrozhenko, Y., Shermanau, P., Federici, S., Eds.; Intergovernmental Panel on Climate Change: Hayama, Japan, 2019. [Google Scholar]
  28. Hauschild, L.; Pomar, C.; Lovatto, P.A. Systematic Comparison of the Empirical and Factorial Methods Used to Estimate the Nutrient Requirements of Growing Pigs. Animal 2010, 4, 714–723. [Google Scholar] [CrossRef] [PubMed]
  29. dit Bailleul, P.J.; Bernier, J.F.; van Milgen, J.; Sauvant, D.; Pomar, C. The Utilization of Prediction Models to Optimize Farm Animal Production Systems: The Case of a Growing Pig Model. In Modelling Nutrient Utilization in Farm Animals; CABI Publishing: Wallingford, UK, 2000; pp. 379–392. [Google Scholar] [CrossRef]
  30. Niemi, J.K.; Sevón-Aimonen, M.L.; Pietola, K.; Stalder, K.J. The Value of Precision Feeding Technologies for Grow–Finish Swine. Livest. Sci. 2010, 129, 13–23. [Google Scholar] [CrossRef]
  31. Pomar, C.; Pomar, J.; Dubeau, F.; Joannopoulos, E.; Dussault, J.P. The Impact of Daily Multiphase Feeding on Animal Performance, Body Composition, Nitrogen and Phosphorus Excretions, and Feed Costs in Growing-Finishing Pigs. Animal 2014, 8, 704–713. [Google Scholar] [CrossRef]
  32. Aymerich, P.; Soldevila, C.; Bonet, J.; Gasa, J.; Coma, J.; Solà-Oriol, D. Increasing Dietary Lysine Impacts Differently Growth Performance of Growing Pigs Sorted by Body Weight. Animals 2020, 10, 1032. [Google Scholar] [CrossRef]
  33. Henry, Y. Dietary Factors Involved in Feed Intake Regulation in Growing Pigs: A Review. Livest. Prod. Sci. 1985, 12, 339–354. [Google Scholar] [CrossRef]
  34. Menegat, M.B.; Dritz, S.S.; Tokach, M.D.; Woodworth, J.C.; DeRouchey, J.M.; Goodband, R.D. A Review of Compensatory Growth Following Lysine Restriction in Grow-Finish Pigs1. Transl. Anim. Sci. 2020, 4, 531–547. [Google Scholar] [CrossRef]
  35. Beaulieu, A.D.; Williams, N.H.; Patience, J.F. Response to Dietary Digestible Energy Concentration in Growing Pigs Fed Cereal Grain-Based Diets1. J. Anim. Sci. 2009, 87, 965–976. [Google Scholar] [CrossRef] [PubMed]
  36. Daza, A.; Rodriguez, I.; Ovejero, I.; López-Bote, C.J. Effect on Pig Performance of Feed Restriction during the Growth Period. Span. J. Agric. Res. 2003, 1, 3–8. [Google Scholar] [CrossRef]
  37. Canh, T.T.; Sutton, A.L.; Aarnink, A.J.; Verstegen, M.W.; Schrama, J.W.; Bakker, G.C. Dietary Carbohydrates Alter the Fecal Composition and PH and the Ammonia Emission from Slurry of Growing Pigs. J. Anim. Sci. 1998, 76, 1887. [Google Scholar] [CrossRef]
  38. Lashkari, S.; Dalby, F.R.; Krogh, U.; Sattarova, E.; Børsting, C.F. Estimating the Influence of Dietary Composition and Management on Nutrient Intake and Excretion and Methane Emission in Different Pig Categories. PLoS ONE 2025, 20, e0323024. [Google Scholar] [CrossRef]
  39. Møller, H.B.; Sommer, S.G.; Ahring, B.K. Biological Degradation and Greenhouse Gas Emissions during Pre-Storage of Liquid Animal Manure. J. Environ. Qual. 2004, 33, 27–36. [Google Scholar] [CrossRef]
  40. Dalby, F.R.; Hafner, S.D.; Petersen, S.O.; VanderZaag, A.C.; Habtewold, J.; Dunfield, K.; Chantigny, M.H.; Sommer, S.G. Understanding Methane Emission from Stored Animal Manure: A Review to Guide Model Development. J. Environ. Qual. 2021, 50, 817–835. [Google Scholar] [CrossRef]
  41. Andretta, I.; Pomar, C.; Rivest, J.; Pomar, J.; Radünz, J. Precision Feeding Can Significantly Reduce Lysine Intake and Nitrogen Excretion without Compromising the Performance of Growing Pigs. Animal 2016, 10, 1137–1147. [Google Scholar] [CrossRef] [PubMed]
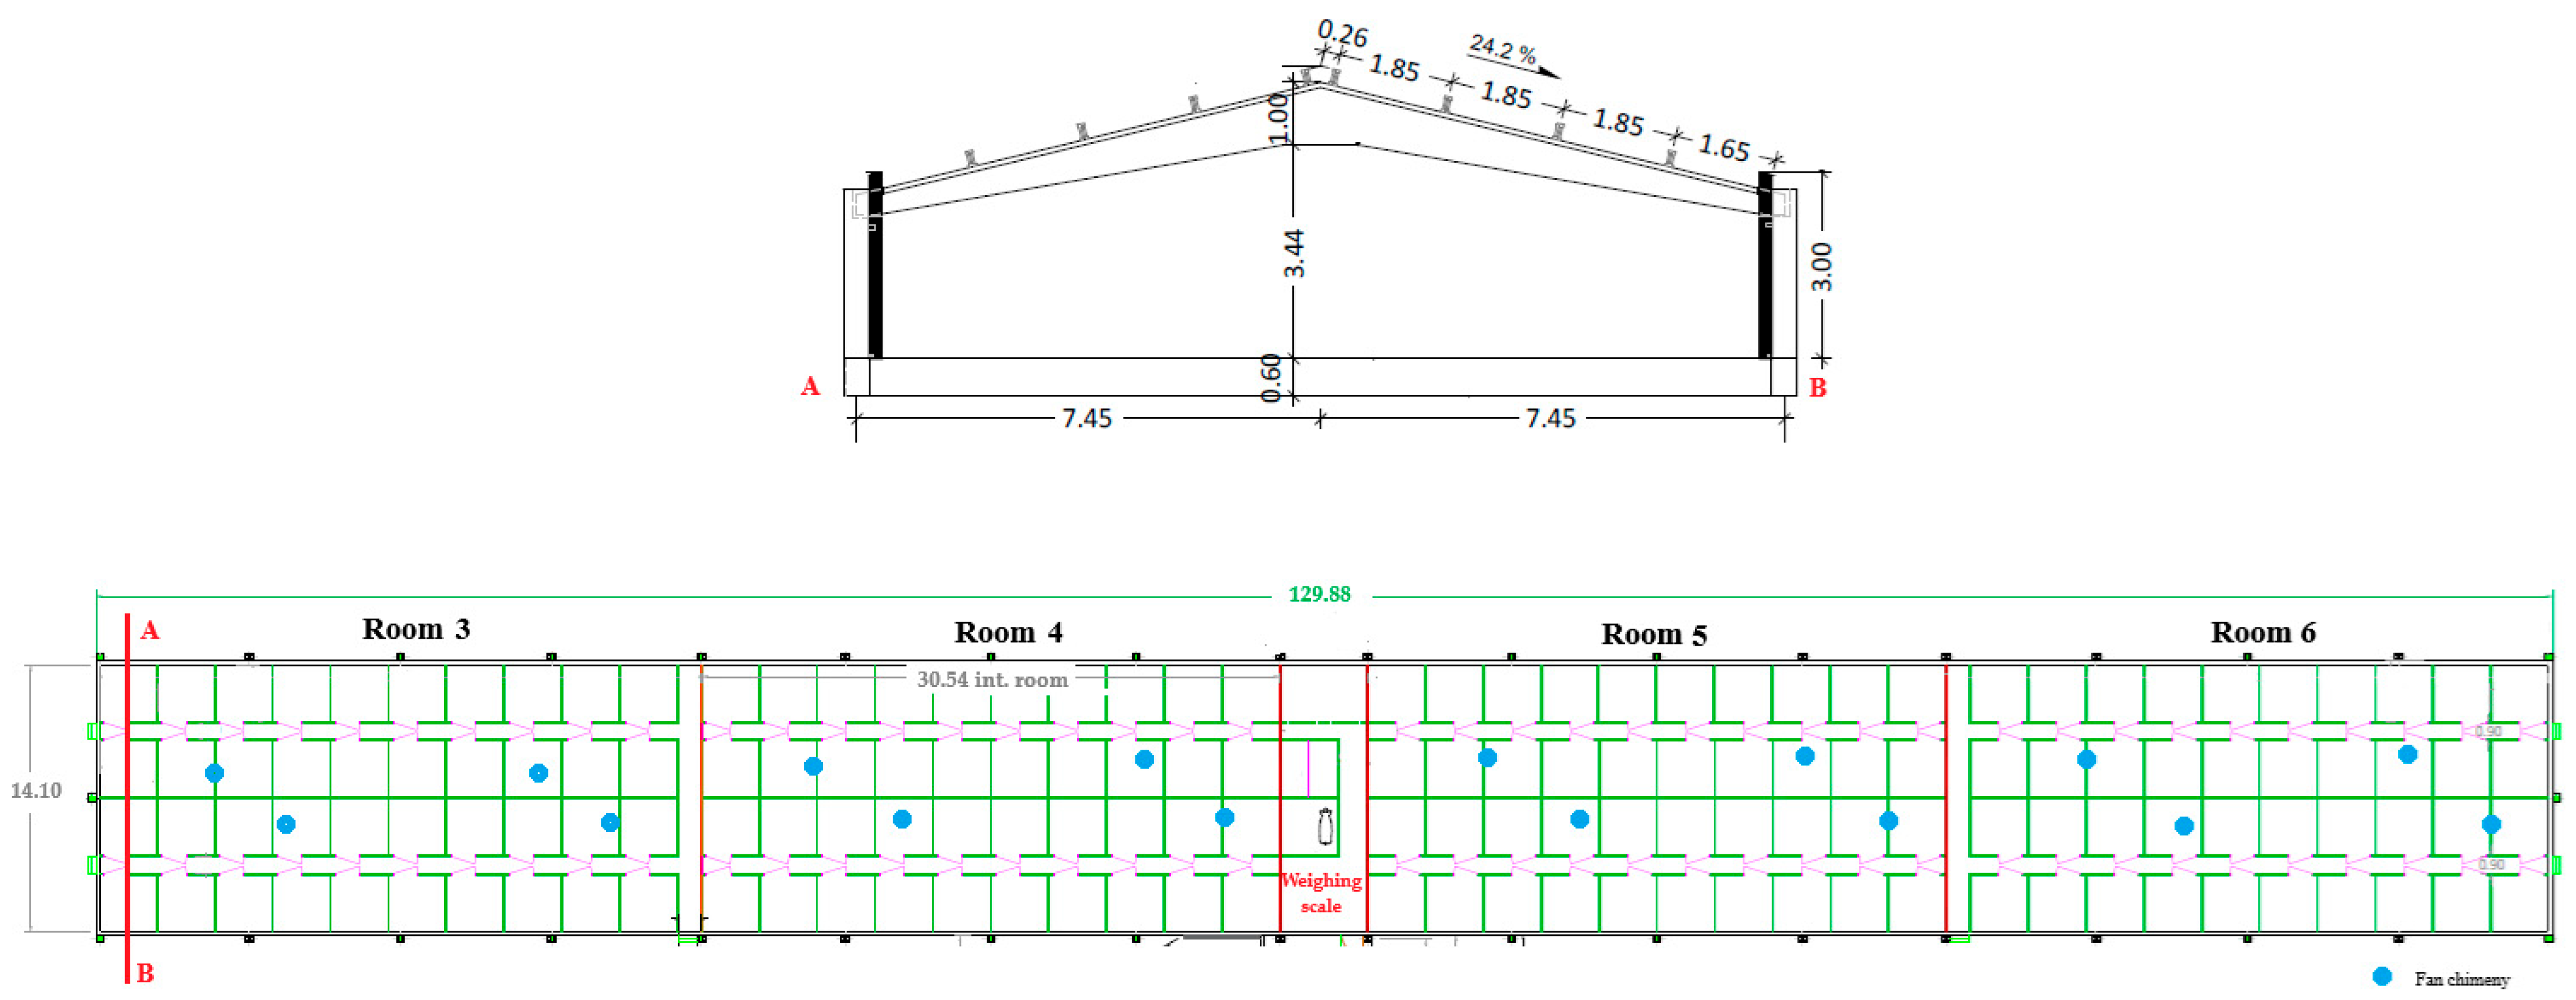
Figure 1. Cross-section (top) and floor plan (bottom) of the experimental facilities, with indication of chimney fan locations. A–B: Cross-section line.
Agriculture 15 01935 g001
Figure 2. Initial distribution of experimental groups. Pen IDs (401–440); feeding strategy (C, conventional feeding, grey colour; BF, blend feeding, green colour); gender (male, M; female, F); body weight block (light, L; heavy, H). Pens 405, 416, 425, and 436 had individualised pits for slurry sampling.
Agriculture 15 01935 g002
Figure 3. Gas measurement installation diagram.
Agriculture 15 01935 g003
Figure 4. Evolution of feed prices (EUR/t) in 2024 and the first half of 2025 for the diets used in this trial. The C strategy includes pre-grower, grower, and finisher feeds, while the BF strategy uses pre-grower and a low-nutrient-density finisher feed (finisher-BF).
Agriculture 15 01935 g004
Figure 5. Feed conversion ratio during overall fattening period (from day 63 to day 161) of pigs categorised as heavy and light under C and BF strategies. a, b: indicate p < 0.05.
Agriculture 15 01935 g005
Figure 6. Ingested (left) and excreted (right) nitrogen (N) of pigs categorised as heavy and light under the conventional (C) and blend feeding (BF) strategies during the overall fattening period (from day 63 to day 161). a, b: indicate p < 0.05.
Agriculture 15 01935 g006
Figure 7. Weekly evolution of slurry pH over the storage period for each combination of feeding strategy and sampling time.
Agriculture 15 01935 g007
Figure 8. Evolution of average air and slurry temperatures over the weeks of the storage emission period.
Agriculture 15 01935 g008
Figure 9. Evolution, over storage weeks, of (a) NH3 emissions, (b) CH4 emissions, and (c) CO2 emissions from slurries sampled at two timepoints during the fattening of pigs under conventional or blend feeding strategies.
Agriculture 15 01935 g009
Table 1. Experimental treatments and durations of feeding phases in the trial.
TreatmentNumber
of Diets
Duration
Pre-Growing
Duration
Growing
Duration
Finishing
Conventional
(C)
321 days
Pre-grower feed
56 days
Grower feed
20 days
Finisher feed
Blend feeding
(BF)
2 diets mixed weeklyPre-grower and a low-nutrient-density finisher feed mixed weekly according to lysine requirements
Table 2. Composition of the commercial diets (as-is, %).
Ingredients (%)Conventional (C)Blend Feeding (BF)
Pre-GrowerGrowerFinisherPre-GrowerFinisher-BF
Wheat35.037.537.535.020.0
Barley30.025.025.030.030.0
Soybean meal 4713.311.45.613.3-
Cookie flour8.164.607.708.165.76
Maize7.0017.616.67.0020.0
Wheat middling ----10.0
Sunflower meal 28----6.00
Rapeseed meal3.001.255.003.005.30
Animal fat1.030.2500.2501.030.500
Salt0.5000.5000.5000.5000.400
Mineral–vitamin premix 10.5000.5000.5000.500-
L-lysine0.4400.4300.4200.4400.400
Organic acid mix 10.300--0.300-
Liquid methionine0.2200.2000.1600.220-
Monocalcium phosphate0.2100.2000.0500.2100.200
Sodium bicarbonate----0.200
L-threonine0.1900.1800.1600.1900.070
Calcium carbonate0.1600.3500.2800.1600.760
Choline chloride 75%----0.020
Mineral mix 1--0.200--
Mineral–vitamin finisher premix 1----0.400
1 Composition is shown in Supplementary Materials.
Table 3. Calculated nutrient content of commercial diets (as-is, %).
Nutrients (%)Conventional (C)Blend Feeding (BF)
Pre-GrowerGrowerFinisherPre-GrowerFinisher-BF
Net energy, kcal/kg24502450245024502315
Dry matter89.389.089.189.389.0
Crude protein16.515.114.016.513.0
Crude fat3.112.282.503.113.06
Crude fibre3.593.223.473.595.56
Starch47.050.651.447.046.0
Crude ash4.003.773.674.004.43
Neutral detergent fibre11.811.211.811.817.0
Calcium0.3600.4100.4400.3600.520
Phosphorus0.4000.3700.3500.4000.460
Digestible Phosphorus0.2900.2800.2500.2900.220
Magnesium0.1500.1400.1400.1500.150
Sodium0.2600.2400.2600.2600.250
Potassium0.6600.6000.5300.6600.560
Chlorine0.5300.5000.5200.5300.430
Lysine SID0.9470.8660.7660.9470.670
Methionine SID0.3110.2860.2590.3110.193
Methionine + Cysteine SID0.5710.5280.4920.5710.413
Threonine SID0.6510.5970.5320.6510.407
Tryptophane SID0.1680.1500.1330.1680.121
Isoleucine SID0.5430.4940.4300.5430.373
Valine SID0.6400.5850.5250.6400.483
SID = Standardised ileal digestible.
Table 4. Proportion (%) of pre-grower and finisher diets1 provided to light and heavy pigs in the blend feeding (BF) strategy throughout the trial.
Day of Age/Day of TrialLight PigsHeavy Pigs
Pre-Grower 1Finisher-BF 1Pre-Grower 1Finisher-BF 1
63/110001000
70/810001000
77/151000919
84/229378515
91/2990107525
98/3681196337
105/4370305446
112/5062384654
119/5756443961
126/6450503367
133/7145552773
140/7833671585
147/8530701090
154/922773496
1 Pre-grower, the same pre-grower feed used in the C strategy; finisher-BF, a low-nutrient-density finisher feed for the BF strategy.
Table 5. Body weight (BW), average daily gain (ADG), average daily feed intake (ADFI), and feed conversion ratio (FCR) of pens categorised as heavy and light and fed according to C and BF strategies during pre-growing (60 to 84 days of age), growing (84 to 140 days of age), and finishing periods (140 to 161 days of age).
VariableFeeding StrategyBW BlockSEMp-Value
Conventional
(C)
Blend
Feeding
(BF)
HeavyLightStrategyBW BlockStrategy × BW Block
Day 63–84
BW d63, kg23.123.125.221.00.3040.992<0.0010.367
ADG, kg/d0.5880.5840.6210.5510.0180.8130.0240.909
ADFI, kg/d1.131.141.181.080.0300.6560.0810.468
FCR, kg/kg1.951.951.912.000.0280.9950.0900.966
BW d84, kg35.535.436.234.70.3760.7560.0220.989
Day 84–140
ADG, kg/d0.8250.8210.8040.8410.0120.7360.0860.168
ADFI, kg/d1.781.791.761.800.0380.5640.3070.978
FCR, kg/kg2.162.182.192.140.0430.1670.1690.036
BW d140, kg82.081.982.481.60.9740.9280.6500.541
Day 140–161
ADG, kg/d1.0150.9800.9921.0040.0300.2170.8240.289
ADFI, kg/d2.452.522.452.510.0440.0860.4300.785
FCR, kg/kg2.432.592.492.530.0740.0230.7620.260
BW d161, kg1021011021011.140.5060.6470.336
Day 63–161
ADG, kg/d0.8120.8010.8030.8090.0100.2440.7570.107
ADFI, kg/d1.771.791.781.780.0320.2860.9410.916
FCR, kg/kg2.182.242.222.210.0310.0070.8290.039
SEM = Standard error of the mean (n = 20).
Table 6. N intake, excretion, and efficiency in heavy and light pigs under conventional and blend feeding strategies over the total fattening period (63 to 161 days of age).
VariableStrategyBW BlockSEMp-Value
Conventional (C)Blend
Feeding (BF)
HeavyLightStrategyBW BlockStrategy × BW Block
Ingested N (kg/pig)4.104.074.164.010.02480.306<0.0010.044
Excreted N (kg/pig)1.961.962.031.900.02300.858<0.0010.057
N efficiency 1 (kg/kg)0.5130.5100.5050.5180.0050.1580.0830.414
SEM = Standard error of the mean (n = 20). 1 Calculated as N retained/N ingested.
Table 7. Intermediate and final chemical compositions of the slurry collected from pigs under the C or BF strategy during the fattening period.
SamplingParameterConventional (C)Blend feeding (BF)SEMp-Value
IntermediateFinalIntermediateFinalStrategyTime
Start of the test,
2 September.
DM
(%FM)
2.082.473.884.991.860.3120.708
OM (%DM)52.369.062.971.17.900.4700.191
pH7.286.767.226.580.160.4860.024
EC
(mS/cm)
22.816.623.717.03.500.8690.140
TKN
(mg/L)
22982075317732468990.3180.935
N-NH3
(mg/L)
18841621236321084600.3530.603
End of the test,
22 November.
DM
(%FM)
2.972.843.205.761.990.4730.575
OM (%DM)51.061.750.165.88.600.8610.200
pH8.638.638.348.550.240.4960.696
EC
(mS/cm)
NDNDNDNDNDNDND
TKN
(mg/L)
8881150271116459770.3010.534
N-NH3
(mg/L)
49860713609825160.2970.662
Dry matter (DM), fresh matter (FM), organic matter (OM) calculated as the difference between DM and ash percentage, electrical conductivity (EC), total Kjeldahl N (TKN), and ammoniacal N (N-NH3). SEM: Standard error of the mean (n = 2). ND: Not determined.
Table 8. Average gas emissions from slurries produced by pigs under the conventional or blend feeding strategy during the fattening period.
GasConventional (C)Blend Feeding (BF)SEMp-Value
IntermediateFinalIntermediateFinalStrategyTimeStrategy × Time
NH3
(mg/m3 per hour)
2.011.912.461.880.1810.2450.0600.177
CH4
(mg/m3 per hour)
0.481.360.952.360.166<0.001<0.0010.112
CO2
(mg/m3 per hour)
11.813.716.617.11.200.0010.3440.571
SEM = Standard error of the mean (n = 2).
Table 9. Average gas emissions (expressed as ratios to the emission substrates) from slurry storage produced by pigs under the conventional (C) or blend feeding (BF) strategies during the fattening period.
RatioConventional (C)Blend Feeding (BF)SEMp-Value
IntermediateFinalIntermediateFinalStrategyTimeStrategy × Time
N-NH3e
/N-NH3 slurry
0.7500.8500.7800.6900.1300.6670.9930.529
CH4e/Theoretical MCF0.3200.6100.3600.6000.2000.9370.2580.885
N-NH3e: N emitted as NH3; N-NH3 slurry: N-NH3 contained in the slurry at the start of the emission test. CH4e: Total CH4 emitted; theoretical MCF: theoretical CH4 conversion factor calculated according to IPCC [27]. SEM = Standard error of the mean (n = 2).
Table 10. Feed cost comparison under C and BF strategies over the fattening period (63–161 days old).
VariableStrategyBW BlockSEMp-Value
Control (C)Blend
Feeding (BF)
HeavyLightStrategyBW BlockTreat × BW Block
Low feed costs
EUR/pig50.548.849.649.70.4700.0120.9290.575
High feed costs
EUR/pig57.955.956.856.90.5390.0110.8910.562
SEM = Standard error of the mean (n = 20).
Disclaimer/Publisher’s Note: The statements, opinions and data contained in all publications are solely those of the individual author(s) and contributor(s) and not of MDPI and/or the editor(s). MDPI and/or the editor(s) disclaim responsibility for any injury to people or property resulting from any ideas, methods, instructions or products referred to in the content.