Abstract
To enhance the stability and consistency of topdressing depth during maize fertilization, an inter-row deep fertilizer application unit was designed. Through analysis of the coherence between subsurface pressure and topdressing depth stability obtained from stability performance tests, structural optimizations were implemented on the deep application unit. This resulted in an integrated vibration damping device incorporating a magnetorheological damper (MR damper fertilizer application unit). The MR damper fertilizer application unit was validated through simulation testing. Using an orthogonal experimental design approach, soil bin tests were conducted to identify the preferred parameter ensemble for this unit. Subsequent field trials under these optimized parameters enabled comparative performance evaluation of both fertilizer application units under actual operating conditions. The simulation results indicated that the MR damper fertilizer application unit achieved reductions in the standard deviation of the gauge wheel’s force on the ground by 39.6%, 41.0%, and 44.6% at three distinct operational speeds, respectively. The soil bin tests identified the optimal operational parameters as follows: MR damper current of 0.6 A, vibration damping system spring stiffness of 8 N/mm, and a working speed of 7.2 km/h. Field testing results indicated that, when utilizing the optimal parameters, the MR damper fertilizer application unit achieved a 6.9% improvement in the rate of qualified topdressing depth and a 3.8% reduction in the depth variation coefficient compared to the conventional deep fertilizer application unit. Compared to traditional fertilizer applicators, this study effectively addresses issues of poor fertilization depth uniformity and low qualification rates caused by severe gauge wheel bouncing due to uneven terrain during field operations.
1. Introduction
As one of the three major global cereal crops, maize accounts for approximately half of the total planting area dedicated to these staple crops in China [1,2]. During the growth stages of maize, topdressing fertilization is a critical agronomic practice that ensures nutrient supply and enhances the efficiency of fertilizer utilization [3]. Among these, the deep fertilization applicator plays a crucial role in ensuring effective fertilization and crop growth protection during inter tillage topdressing operations; adopting inter-row deep fertilization methods not only enhances nutrient uptake efficiency in maize plants and achieves the goal of yield increase with reduced fertilizer application, but also holds significant importance for advancing precision agriculture and high-efficiency agricultural systems [4].
During deep topdressing operations, maintaining a consistent furrow depth is critical for ensuring stable and uniform fertilizer placement [5,6]. Key influencing factors for achieving stable furrow depth include the soil disturbance characteristics of the furrowing device and the dynamic adjustment capability of the profiling system [7]. In the field of furrowing performance research, Zhao et al. [8] developed a novel acute-angled fertilizer opener to address the insufficient soil backfilling capacity of double-disk openers under deep fertilization conditions. By optimizing the integrated structural parameters of the fertilizer application and double-disk seeding opener system, experimental results demonstrated that the improved opener exhibits superior performance in reducing traction resistance and enhancing soil backfilling efficiency compared to conventional designs. Liu et al. [9] developed an anti-clogging, low-resistance disk-type fertilizer opener designed to enhance field clearance for precise side-band deep fertilization in potato direct seeding systems. Experimental validation demonstrated exceptional application uniformity, evidenced by a coefficient of variation (CV) of only 2.29% in fertilizer placement depth, thereby confirming the efficacy of the structural optimization in improving depth consistency. However, such opener structural modifications only address depth control under static operating conditions. Hebei Nonghaha Ltd. (Shijiazhuang, China) [10] has developed a wheat topdressing machine that incorporates a four-bar linkage floating mechanism in each fertilizer application unit. By adjusting the spring mounting position on the linkage, the ground contact pressure of the application unit can be modified, thereby enhancing the stability of topdressing depth. While this design successfully achieves basic terrain-following functionality, field tests have revealed a critical limitation: manual adjustment of the spring position cannot maintain a consistent force of the gauge wheel on the ground across varying field conditions. To ensure consistent topdressing depth stability across varying field conditions, researchers have adopted active control technologies for real-time regulation. For instance, Nielsen et al. [11,12] developed a furrowing depth control system that employs an inclination sensor to measure the tilt angle of the opener, which is subsequently converted into the actual furrowing depth. A hydraulic control system adjusts the opener’s position accordingly. Experimental results indicated depth deviations of 0.89 mm in sandy soil and −1.18 mm in rocky soil from the target depth, significantly mitigating the impact of soil variability. However, hydraulic transmission exhibits inherent hysteresis, making it unsuitable for high-speed topdressing operations where rapid control response is critical. Current active control methods for topdressing depth primarily focus on enhancing terrain-following capabilities to minimize depth variations caused by field soil heterogeneity. Pradhan, NC et al. [13] developed a LIDAR-navigated electronic maize hill-drop seeding system that optimized the parameters of the seed metering mechanism while constructing a seed flow sensing system to measure and compensate for time lag, with experimental tests evaluating system performance at different forward speeds, providing indirect insights for the system integration of topdressing sensors. In conclusion, to address the complexity and unpredictability inherent in field operating conditions, topdressing machinery must incorporate both optimized structural configurations and rapid-response actuation components to ensure enhanced stability and consistency of topdressing depth.
Magnetorheological (MR) fluid, composed of micron-sized magnetic particles with high permeability and low hysteresis, exhibits high yield strength, rapid response, and excellent stability, demonstrating broad application potential in automotive, mechanical, and civil engineering fields [14]. In the domain of semi-active vehicle suspensions, Lord Corporation (Cary, NC, USA) [15] has developed the Motion Master, an MR damper-based semi-active seat suspension system which has been successfully implemented in heavy-duty trucks, buses, and agricultural vehicles. The University of Nevada [16], in collaboration with CSA Engineering (Mountain View, CA, USA), has developed a MR damper specifically designed for military High-Mobility Multipurpose Wheeled Vehicles. Experimental results indicate that the MR semi-active suspension significantly enhances the vehicle’s mobility on rough terrains. Pradhan, NC et al. [17]. predicted vertical vibrations across different body parts of agricultural tractor operators during field operations through finite element modeling, identifying vibration frequencies and resonance conditions for each anatomical segment. Sun et al. [18] designed a rotary MR damper-based seat suspension, which provides advantages such as a reduced volume of MR fluid and lower sealing requirements. Bench tests confirmed that this system, when combined with an optimized control strategy, effectively reduces seat acceleration transmissibility. Zacek et al. [19] experimentally characterized the rheological response time of MR dampers, revealing that a higher magnetic susceptibility of the MR fluid correlates with shorter response times. Based on the aforementioned research results, the magnetorheological damper, leveraging its high response speed, controllability, and stability, provides a novel vibration reduction design solution for fertilization applicators during field operations; by regulating the input current to real-time adjust damping force, it effectively suppresses vibrations generated during implement operation, thereby significantly enhancing fertilization depth stability, ensuring fertilizer application uniformity, and improving operational efficiency. In topdressing operations, ground surface irregularities induce dynamic impacts on the fertilizer application unit, complicating the maintenance of a consistent force exerted by the gauge wheel on the ground and resulting in unstable topdressing depth. Therefore, the adoption of a semi-active control design methodology based on MR dampers represents a viable technical approach for optimizing fertilizer application units.
This study, based on the spring maize cultivation patterns and topdressing agronomic requirements in Northeast China, designed an inter-row deep fertilizer application unit employing downforce control technology. The main research contents include: (1) Analyzing the correlation between trenching depth and force on the ground from the gauge wheel, providing a theoretical basis for optimization of the fertilizer application unit. (2) Incorporating a MR damper to improve the deep fertilizer application unit structure, establishing a dynamic simulation model to verify the enhancement of downforce stability. (3) Conducting soil bin tests to identify optimal operational performance of the damped fertilizer application unit under different parameter combinations. (4) Performing field tests with optimal parameters to evaluate the qualified rate of topdressing depth for two types of fertilizer application units under actual field conditions.
2. Materials and Methods
2.1. Structural Design and Performance Validation of Deep Fertilization Application Unit
2.1.1. Overall Structure and Working Principle
To address the limitations in topdressing depth stability associated with existing topdressing equipment, a deep fertilization application unit has been designed, as illustrated in Figure 1. This implement is mounted to the unit frame via a rubber torsion spring assembly, which comprises a torsion spring seat and four elastomeric columns. The inherent elasticity of the rubber columns allows for angular displacement relative to the frame while generating a restoring torque. Additionally, a three-position depth adjustment mechanism has been incorporated through an adjustable linkage arm with tiered locating holes, providing discrete depth settings at 8 cm, 10 cm, and 12 cm [20].
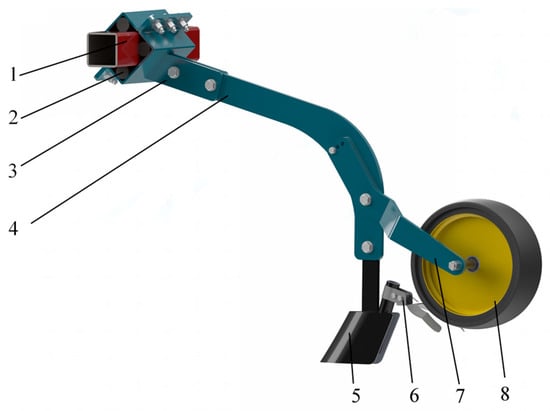
Figure 1.
Schematic diagram of the Deep fertilization application unit structure: 1—Mounting frame; 2—Elastomeric columns; 3—Rubber torsion spring seat; 4—Main chassis; 5—Furrow opener; 6—Soil covering device; 7—Adjustment arm; 8—Gauge wheel.
The deep fertilizer applicator unit is mounted on the implement frame, which is connected to the tractor’s three-point hitch via rubber torsion springs. The tractor provides the necessary draft force to operate the applicator unit. During operation, the furrow opener creates fertilizer trenches with a consistent depth, while fertilizer is delivered through the opener’s fertilizer tube into the trenches and subsequently covered by the soil covering device to minimize fertilizer volatilization.
2.1.2. Static Structural Analysis
During operation of the fertilizer application unit, the furrow opener trenches by overcoming soil resistance through the torque generated by the rubber torsion spring and the implement’s self-weight. When the furrowing depth reaches the target value, the force analysis of the deep fertilization application unit is illustrated in Figure 2.
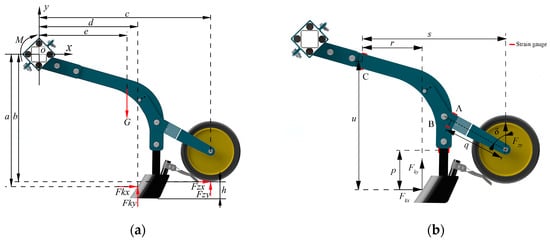
Figure 2.
Force analysis. (a) Static force analysis of the deep fertilizer application unit. (b) Strain gauge mounting configuration diagram.
Under consistent soil conditions, the primary factors affecting the horizontal and vertical resistance of the furrow opener are the operating depth and working speed [21]. To reduce the complexity of force analysis and simplify the theoretical model of opener forces, it is assumed that the forces acting on the furrow opener are solely dependent on the operating depth and working speed. Since the forces exerted by the soil on the covering device have minimal influence on the motion of the deep fertilization application unit, they are disregarded in the force analysis of the unit. The moment equation is established at the central point of the deep fertilization application unit in the planar coordinate system:
where Fkx is the horizontal resistance on the furrow opener (N); Fky is the vertical resistance on the furrow opener (N); Fzy is the horizontal resistance on the gauge wheel (N); G is the self-weight of the deep fertilization application unit (N); ab, c, d, e are the moment arms of each force (m); M is the torque generated by the rubber torsion spring (N·m); K1, K2 are the correlation coefficients for the horizontal and vertical resistances of the furrow opener, which are related to soil hardness and moisture; v is the operating speed of the deep fertilization application unit (km/h); h is the furrowing depth of the opener (m); μ is the resistance coefficient, taken as 0.03 [22].
Based on Equation (1), the furrowing depth formula for the furrow opener can be derived as:
According to Equation (2), the furrowing depth of the opener is determined by field operating conditions (including soil hardness, soil moisture, etc.), trenching speed, and the vertical force acting on the gauge wheel. The ground pressure exerted by the gauge wheel and the reaction force from the ground surface form an action-reaction pair. When operating conditions remain constant, improving the consistency of the gauge wheel’s ground pressure enhances the topdressing depth stability of the deep fertilization application unit.
During the operation of the deep fertilization application unit, the gauge wheel is mounted at the end of the adjustment arm, which complicates the direct measurement of its force on the ground. When the gauge wheel experiences ground reaction forces, it generates a measurable moment on the adjustment arm. Consequently, the ground force can be indirectly determined by measuring the resistance variations from electrical strain gauges [23]. Additionally, a dynamic signal test and analysis system, in conjunction with a strain conditioner, is utilized to acquire and process the signals from the strain gauges. The mounting configuration of the strain gauges is depicted in Figure 2b.
Let the section moduli at points A, B, and C be, WA, WB and WC respectively, and the strain values measured by strain gauges be, ԐA, ԐB and ԐC. According to the principles of mechanics of materials, the bending moments MA, MB, and MC at points A, B, and C can be calculated using the following formulas:
where E is the elastic modulus of the material, with a value of 210 GPa.
The bending moments MA, MB, and MC generated by the gauge wheel and furrow opener on the fertilizer application unit at points A, B, and C are given by:
where q is the distance between the gauge wheel axle center and strain gauge location A (mm); p is the vertical distance between the furrow opener center and strain gauge location B (mm); s is the horizontal distance between the gauge wheel axle center and strain gauge location C (mm); u is the indicates the vertical distance between the furrow opener center and strain gauge location C (mm); r is the stands for the horizontal distance between the furrow opener center and strain gauge location C (mm); δ is the angle of the adjustment arm’s central axis relative to the vertical direction (rad).
Substituting Equation (4) into Equation (3), the forces Fkx, Fky, and Fzy acting on the furrow opener and gauge wheel can be obtained as follows:
Therefore, by measuring the strain values at positions A, B, and C of the fertilizer application unit and substituting them into the above equations, the soil reaction forces acting on both the gauge wheel and furrow opener can be determined.
2.1.3. Specialized Stability Performance Test
The theoretical analysis in Section 2.1.2 demonstrates that improving the consistency of the gauge wheel’s force on the ground contributes to enhancing the topdressing depth stability of the deep fertilization application unit. To further validate this conclusion and test the qualified rate of topdressing depth at different operating speeds, this chapter conducts performance verification tests. During operation, the gauge wheel’s force on the ground was collected, and the coherence function was employed to analyze the coherence relationship between the gauge wheel’s force on the ground and the topdressing depth. The results provide a theoretical basis and foundational research for the subsequent optimization design of the implement.
- (1)
- Soil firmness measurement
During measurement, the conical probe of the soil penetrometer was vertically inserted into the soil at different depths to measure soil compaction, with the numerical value representing the soil’s compressive resistance; the experiment utilized a TYD-2 soil penetrometer (Zhejiang Top Cloud-agri Technology Co., Ltd., Hangzhou, China) to measure soil compaction, with measurement results directly readable on the screen; three soil samplings were conducted at each sampling point at depths of 0–100 mm and 100–200 mm, respectively, and the average values of the measurements were calculated, with the results shown in Table 1.

Table 1.
Soil physical properties parameters.
- (2)
- Test protocol
First, adjust the positioning holes to set the topdressing depth of the deep fertilization application unit to 10 cm. Then, by operating the hydraulic suspension system of the soil bin test vehicle, regulate the implement frame to an appropriate height so that the torque generated by the rubber torsion spring meets the required force on the ground for the gauge wheel.
To evaluate the stability of topdressing depth at various operational speeds, the soil bin test vehicle was set to conduct trials at constant speeds of 5.4 km/h, 7.2 km/h, and 9.0 km/h. Upon entering the stable working zone, sensor data acquisition commenced. Following each trial, the soil bin was leveled and compacted to ensure uniform soil conditions across all tests, thereby minimizing experimental errors. The soil bin test setup is illustrated in Figure 3 [24].
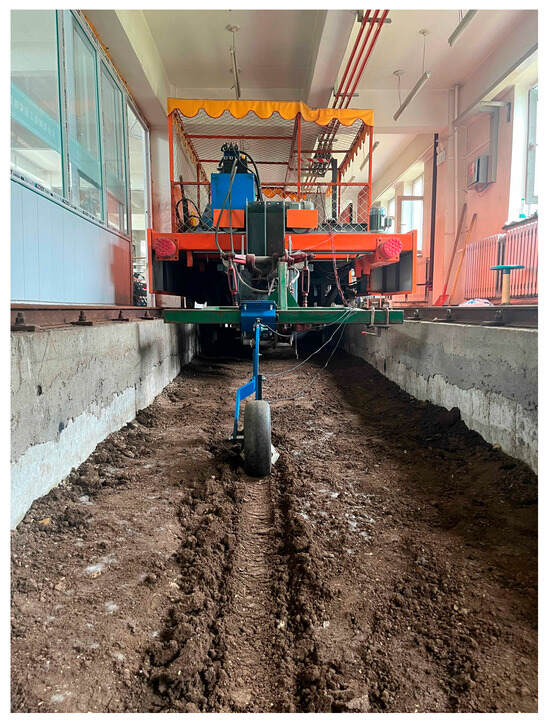
Figure 3.
Soil bin test setup.
- (3)
- Evaluation criteria
According to NY/T 1003-2006 [25], topdressing depth errors within ±2 cm are considered acceptable. In this experiment, with a target topdressing depth of 10 cm, actual depths ranging from 8 cm to 12 cm are deemed acceptable. The measurement device collected data to calculate the topdressing depth, with sampling points taken every 10 cm of travel distance. Each trial recorded 100 sampling points. The formulas for calculating the average topdressing depth and the qualification rate are as follows:
where is the average topdressing depth (cm); Wi is the topdressing depth at the ith sampling point (cm); n is the total number of sampling points; N is the number of qualified sampling points; γh is qualified rate of topdressing depth.
To investigate the relationship between the gauge wheel’s force on the ground and topdressing depth, it is essential to analyze the correlation between these two variables. The coherence function is employed to evaluate the mutual influence or relationship between two signals in the frequency domain—that is, the degree to which one signal affects another. This function quantifies the influence or connection using a specific numerical value, calculated as follows:
where SX(f) and SY(f) are the auto-power spectral density functions of the topdressing depth and the gauge wheel’s force on the ground, respectively; SXY(f) is the cross-power spectral density function between the topdressing depth and the gauge wheel’s force on the ground.
To facilitate statistical characterization of the variations in topdressing depth and gauge wheel’s force on the ground along the longitudinal direction, the spatial frequency n is introduced, with its conversion formula given by:
2.2. Structural Configuration and Operational Principle of the MR Damper Fertilizer Application Unit
To enhance the consistency of the gauge wheel’s force on the ground and achieve stable topdressing depth, as illustrated in Figure 4, a vibration damping device utilizing a MR damper was implemented to structurally optimize the deep fertilization application unit. This optimization aims to minimize the influence of ground profile fluctuations on the unit’s performance. The damping device primarily comprises an MR damper and a compression spring, along with its mounting seat. Together with the adjustment arm, swing arm, and main frame, these components form a four-bar linkage mechanism.
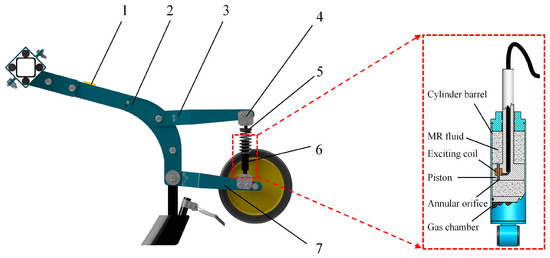
Figure 4.
Structural configuration of the MR damper fertilization application unit: 1—Resistance strain gauge; 2—Main frame; 3—Adjustment arm; 4—Mounting base; 5—Compression spring; 6—MR damper; 7—Swing arm.
During field operation on uneven terrain, the deep fertilization application unit experiences ground profile variations that impose dynamic impacts on the gauge wheel, resulting in significant fluctuations of the wheel’s force on the ground and consequent instability in topdressing depth. The vibration damping system addresses this through MR technology: when electric current is applied, the damper’s excitation coil generates a magnetic field that alters the alignment of ferromagnetic particles within the MR fluid, causing the MR damper to develop substantial damping force. Working in concert with the compression spring mechanism, this system effectively absorbs ground-induced impact forces on the gauge wheel while providing consistent restoring force, thereby maintaining stable downward pressure for continuous ground contact. This optimized dynamic performance ensures the gauge wheel follows terrain contours with minimal deviation, creating ideal trenching conditions for the furrow opener.
2.3. Dynamic Analysis
2.3.1. Deep Fertilization Application Unit
The dynamic equations incorporate the influence of the fertilization application unit’s self-weight on its motion state, enabling accurate analysis of how the unit’s movement affects fertilization depth through dynamic analysis methods; as shown in Figure 5a, the unit is mounted on the mounting frame via a rubber torsion spring, with a Cartesian coordinate system xoy established using the spring’s center o as the origin (x-axis: horizontal direction, y-axis: vertical direction); during operation, surface profile variations or changes in soil resistance cause disturbances to the gauge wheel and opener, resulting in oscillatory motion of the unit about the mounting frame; given the negligible impact of horizontal ground resistance on the gauge wheel, this factor is omitted in the dynamic modeling, and the equation of motion during operation is derived based on the law of rigid body fixed-axis rotation:
where J is the moment of inertia of the deep fertilization application unit about point o (kg·m2); φ is the rotation angle of the deep fertilization application unit (rad); ɸ is the angle between the line connecting the gauge wheel center to pivot point o and the reference x-axis (rad); γ is the angle between the line connecting the center of gravity of the deep fertilization application unit to point o and the reference x-axis (rad); η is the angle between the line connecting the furrow opener to point o and the reference x-axis (rad); Fzy is the vertical force exerted by the gauge wheel on the deep fertilization application unit (N); Fky is the vertical resistance of soil on the furrow opener (N); Fkx is the horizontal resistance of soil on the furrow opener (N); La is the distance from the gauge wheel center to point o (m); Lg is the distance from the center of gravity of the deep fertilization application unit to point o (m); Lk is the distance from the force application point of the furrow opener to point o (m); m is the mass of the deep fertilization application unit (kg); M is the torque provided by the rubber torsion spring (N·m).
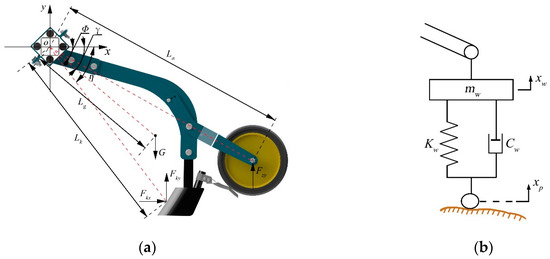
Figure 5.
(a) Force analysis diagram of deep fertilization application unit. (b) Equivalent mechanical model of gauge wheel.
Figure 5b illustrates the equivalent mechanical model of the gauge wheel. The rubber gauge wheel can be represented as a system characterized by specified stiffness and damping coefficients. The interaction force between the gauge wheel and the deep fertilization application unit can be expressed through the elastic and damping forces of the wheel, with the computational formula articulated as follows:
where Kw is the stiffness coefficient of the gauge wheel (N/m); Cw is the damping coefficient of the gauge wheel (N/(m/s)); xp is the displacement due to ground profile height variation (m); xw is the vertical displacement of the gauge wheel (m); mw is mass of the gauge wheel (kg).
Due to the relatively small horizontal displacement amplitude of the gauge wheel caused by angular variations in the deep fertilization application unit, the vertical displacement xw of the gauge wheel can be represented by the arc length corresponding to the rotation angle ɸ of the unit, expressed as:
By substituting Equation (11) into Equation (10), the ground reaction force acting on the gauge wheel can be expressed as:
To obtain precise tire stiffness coefficients, an analytical method is employed to determine the radial stiffness of the tire [26]. The calculation formula for the stiffness coefficient Kw of the gauge wheel is as follows:
where a is the semi-contact length between the tire and ground (m); P is the inflation pressure, here taken as 0 kPa; L is the contact width (m); W is the external load (N); R is the tire outer radius (m); r is the tire inner radius (m).
The damping coefficient Cw of the gauge wheel can be derived from the stiffness coefficient and tire mass [27,28], calculated as:
where ξ the damping ratio, typically assigned a value between 0.1 and 0.2.
2.3.2. MR Damper
This study employs a hyperbolic tangent model to establish the dynamic model of the MR damper, as illustrated in Figure 6. The model expression utilizes linear functions to describe stiffness and damping, while the nonlinear hysteresis effects of the MR damper are characterized using a hyperbolic tangent function [29]. The mathematical expression of the model is shown in Equation (15).
where α is the hysteresis scale factor; β is the hysteresis slope factor; δ is the hysteresis half-width; c0 is the post-yield damping coefficient (N (m/s)); k0 is the post-yield stiffness coefficient (N/m); F0 is the bias force (N); x is the displacement of the MR damper piston (m).
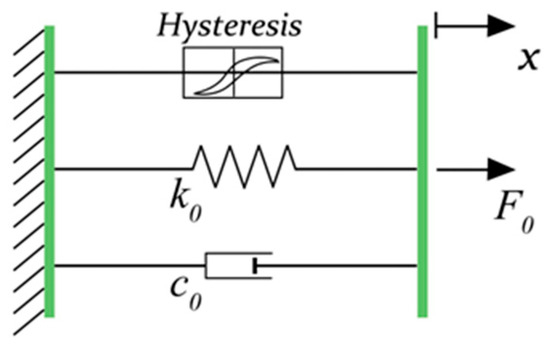
Figure 6.
Schematic diagram of the hyperbolic tangent model.
The hyperbolic tangent model contains six unknown parameters. When subjected to external excitation, the damping force output by the MR damper can be expressed as a function of these six parameters: F = Θ [α, β, δ, c0, k0, F0]. The relationship between the hysteresis scale factor α of the MR damper and the input current can be characterized as a quadratic function [30], expressed as:
The post-yield damping coefficient c0 can be characterized as having a linear functional relationship with the input current, expressed as:
2.3.3. MR Damper Fertilizer Application Unit
To analyze the effectiveness of the MR damper-equipped fertilization unit in stabilizing the gauge wheel’s force on the ground, it is first necessary to establish a dynamic model of the MR damper fertilizer application unit Figure 7 illustrates the equivalent mechanical model of the gauge wheel and damping device.
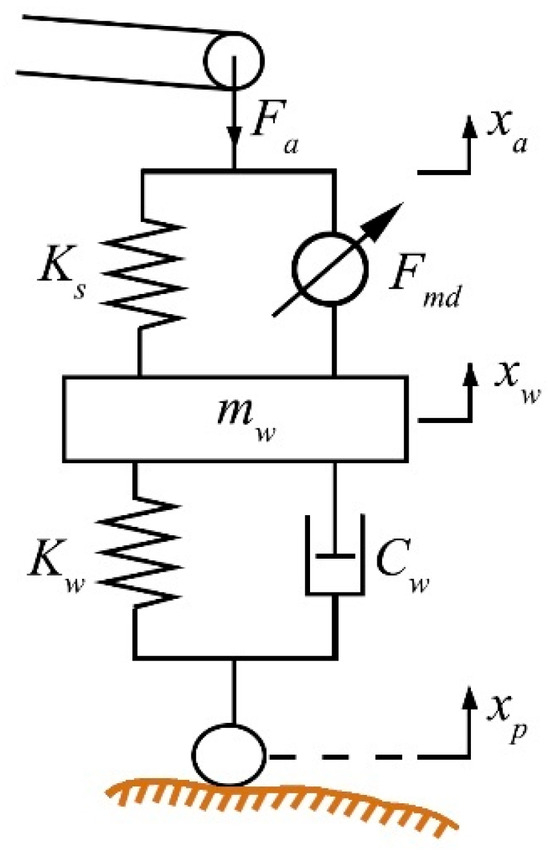
Figure 7.
The equivalent mechanical model of the gauge wheel and damping device.
Due to the telescopic nature of the damping device, the gauge wheel oscillates vertically within a constrained angular range along the swing arm when it encounters impacts from variations in the ground profile. Given the relatively small distance between the mounting bore of the gauge wheel on the swing arm and the mounting point of the damping device, we assume equal vertical displacement between the gauge wheel and the lower mounting seat of the damping device. Employing the isolation method, we establish dynamic equations for both the damping device and the gauge wheel as follows:
where Fa is the force exerted by the adjustment arm on the upper end of the damping device (N); Ks is the elastic coefficient of the compression spring in the damping device (N/m); xa is the displacement of the upper mounting hole of the damping device (m); Fmd is the output damping force of the MR damper (N).
2.4. Simulation Test Model
2.4.1. Simulation Model Establishment
Based on actual field measurements and the factory test report of the MR damper’s output damping force, the key parameter values for the dynamic simulation model were finalized as shown in Table 2.

Table 2.
Key Parameters of the Fertilization Unit Dynamic Simulation Model.
According to Equations (12) and (14), the dynamic simulation model of the deep fertilization application unit was implemented in Simulink (Matlab R2023b), as illustrated in Figure 8.
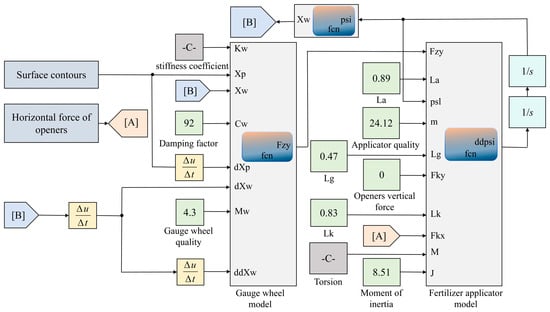
Figure 8.
Dynamic simulation model of deep fertilization application unit.
According to Equation (15) and Table 1, the hyperbolic tangent dynamic model of the MR damper was developed in Simulink, as shown in Figure 9.
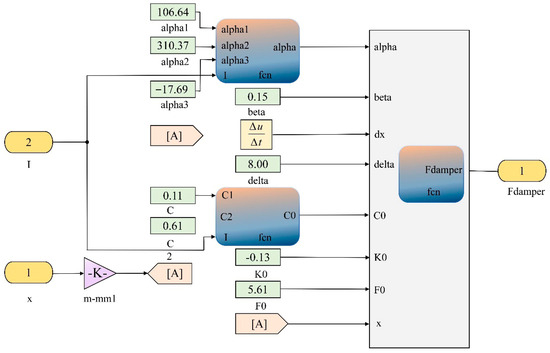
Figure 9.
Hyperbolic tangent dynamic model of MR damper.
The dynamic simulation model of the MR damper fertilizer application unit was implemented in Simulink based on Equation (18), with ground profile data and input current to the damper serving as excitation signals [31,32], as illustrated in Figure 10.
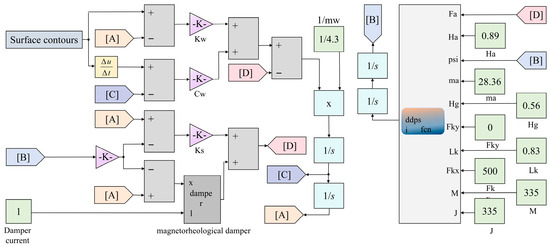
Figure 10.
Dynamic simulation model of MR damper fertilizer application unit.
2.4.2. Simulation Evaluation Metrics
A simulation-based comparative analysis was conducted to evaluate the fluctuation characteristics of the gauge wheel’s force on the ground for both fertilization units under identical operating conditions, thereby validating the effectiveness of the MR damper fertilizer application unit in stabilizing the gauge wheel’s force on the ground.
The simulated field terrain profile results were utilized as excitation signals for the simulation model inputs. The horizontal resistance acting on the furrow opener was set to 500 N, with vertical resistance at 0 N. A constant current of 0.5 A, equivalent to one-third of the MR damper’s maximum rated current, was applied as an input parameter for the dynamic model. To evaluate the effectiveness of the damping device in stabilizing the gauge wheel’s force on the ground under different operating speeds, three distinct working speeds were selected for simulation testing. A total of six simulation trials were conducted, with the testing factors and levels detailed in Table 3.

Table 3.
Test factors and levels.
The qualified rate of topdressing depth is influenced by the stability of the gauge wheel’s force on the ground. The standard deviation (STD) quantitatively reflects the dispersion degree of the gauge wheel’s force dataset. Therefore, the STD is adopted to evaluate the fluctuation characteristics of the gauge wheel’s force between the two fertilization application unit types. A smaller STD value indicates better stability of the gauge wheel’s force, with the STD calculated as:
where Fi is the gauge wheel’s force on the ground at the i-th sampling point (N); F is the mean value of the gauge wheel’s force on the ground (N); N is the total number of sampling points.
2.5. Parameter Optimization
To evaluate the rationality of the structural design of the MR damper fertilizer application unit, verify the reliability of the simulation results, and determine the optimal parameter combination including the current supplied to the MR damper, stiffness of the compression spring, and operating speed for achieving superior fertilization performance, soil bin testing of the MR damper fertilizer application unit is required.
2.5.1. Test Conditions and Equipment
The experiments were conducted in the agricultural soil bin laboratory. Following each test, the soil underwent processes of breaking, watering, compaction, and profile reshaping to replicate real field operating conditions. Influenced by natural environmental factors—particularly due to the widespread implementation of no-till conservation tillage practices—the soil surface profile exhibits certain undulations. To accurately simulate the characteristics of natural field soil profiles, manual adjustments were made in the soil bin, maintaining a height variation range of 0 to 20 cm. Furthermore, consistent soil conditions were ensured for each test, with the measured physical parameters of the soil detailed in Table 4.

Table 4.
Measured physical parameters of the soil detailed.
2.5.2. Comparative Testing of Topdressing Depth
During the experimental research process, the working depth of agricultural machinery is typically measured manually, which presents issues such as low measurement efficiency and poor accuracy [33]. With the advancement of precision agriculture technology, various sensors have been employed for detecting the working depth of agricultural machinery. To facilitate real-time measurement of topdressing depth in subsequent soil bin tests and to evaluate its dynamic performance, a comparative test was conducted between the topdressing depth data obtained from the measuring equipment and that from manual measurements [34].
For the soil bin test, the traveling speed of the experimental vehicle was set at 3.6 km/h, with a topdressing depth of 10 cm. During the test, data from the laser distance sensors and tilt angle sensor were collected in real-time using an upper computer. After the test, the soil above the measurement points was manually excavated until the fertilizer was exposed. Using the surface compacted by the gauge wheel as the reference plane, the distance from the fertilizer to the reference plane was measured with a steel ruler. Topdressing depth was measured at 20 cm intervals, resulting in a total of 50 data points. The field setup for the comparative test of topdressing depth is shown in Figure 11.
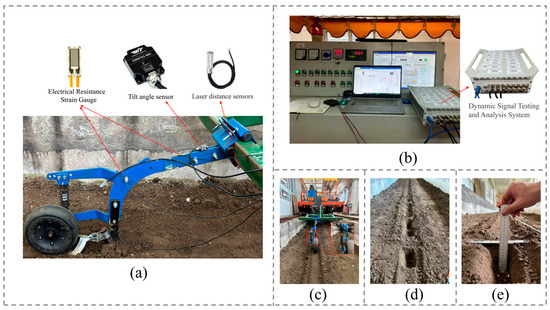
Figure 11.
Comparative test site of soil bin experiment. (a) Topdressing depth measurement equipment. (b) Data acquisition equipment. (c) Topdressing depth measurement test. (d) Field measurement of depth. (e) Manual measurement.
The experiment employed two evaluation metrics εmax maximum absolute error and mean error to assess the accuracy of the device in measuring topdressing depth. The calculation formulas are as follows:
where xi is the topdressing depth at the i-th point measured manually (cm); yi is the topdressing depth at the i-th point measured by the depth measurement device (cm); n is the total number of sampling points.
2.5.3. Soil Bin Test
The primary objective of the soil bin test is to determine the optimal operational parameter configuration for the MR damper fertilization application unit to achieve superior topdressing performance. The key factors influencing the stability of topdressing depth include the current of the MR damper, the stiffness of the compression spring, and the operational speed. Therefore, the current (I), spring stiffness (K), and operational speed (v) were selected as the test factors for the soil bin test. Given that the current of the MR damper has a significant impact on the stability of topdressing depth, it was set at six different test levels, while the operational speed and spring stiffness were each set at three test levels. The test factor level table is presented in Table 5. To ensure test effectiveness while minimizing the number of trials, this study adopted an orthogonal experimental design method. The experimental design did not account for interactions between factors, resulting in a total of 54 test runs [35]. To ensure test accuracy, the soil bin was divided into three zones: the first and last 5 m sections served as the acceleration and deceleration zones, respectively, while the central 10 m section was designated as the stable operational zone for data collection.

Table 5.
Factor levels of the soil bin test.
2.5.4. Evaluation Criteria for Soil Bin Tests
- (1)
- Qualified rate of topdressing depth
The qualified rate of topdressing depth, as a crucial indicator for evaluating the operational quality of the fertilization application unit, should exceed 80% according to international standards. The calculation methods for both the average topdressing depth and the qualified rate of topdressing depth are identical to Equation (6) in Section 2.1.3.
- (2)
- CV for topdressing depth
The CV for topdressing depth serves as a reference metric to evaluate the operational quality of the fertilization application unit, assessing the stability performance of the topdressing depth. A smaller CV value indicates better stability in topdressing depth. The calculation formula is as follows:
where is the average topdressing depth (cm); Wi is the topdressing depth at the i-th measurement point (cm); S is the STD of topdressing depth (cm); V is the coefficient of variation for topdressing depth (%); n is the total number of measurement points.
2.6. Field Validation
2.6.1. Field Test
To further investigate the performance improvement of the MR damper fertilizer application unit, field tests were conducted to comparatively analyze the topdressing operation effects and the force on the ground from the gauge wheel, thereby verifying the rationality and effectiveness of the structural improvement design for the deep fertilizer application unit.
The field tests were conducted at the experimental fields of Jilin Agricultural University (125.41′ E, 43.81′ N). The field environment for testing is shown in Figure 12a, with maize planted at 65 cm row spacing and averaging 50 cm in plant height in the test fields.
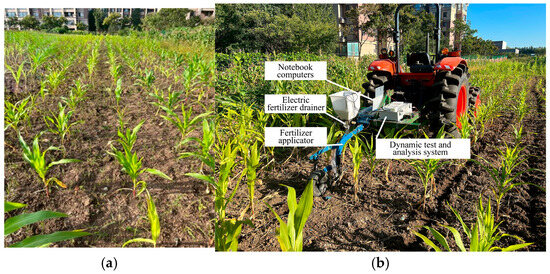
Figure 12.
Field test. (a) Field conditions. (b) Test equipment.
Prior to testing, instruments including a TYD-2 soil penetrometer, KH-35 drying oven (Guangzhou Kenton Instrument Co., Ltd., Guangzhou, China.), cutting ring assembly, and soil thermometer were used to measure soil compaction, moisture content, temperature, and bulk density within the 0–150 mm depth range. During measurement, a parallelogram sampling method was employed to randomly select 10 measurement points in the test area, with the results averaged as shown in Table 6. The experimental field was divided into six test zones, each measuring 2 m in width and 100 m in length. Both ends of each zone contained 10 m acceleration/deceleration buffers, leaving an 80 m central stable operation section for data collection.

Table 6.
Soil physical parameters of the experimental field.
The equipment used in the field tests is shown in Figure 12b. During testing, an electric fertilizer metering device was employed for fertilizer discharge. The fertilizer from the hopper fell into the fertilizer furrow through the fertilizer tube and opener. A 12 V portable power supply provided electricity to both the dynamic testing and analysis system and the numerically controlled DC regulated power supply. A laptop computer served as the upper computer to collect data from the dynamic testing analysis system. Putty knives, steel rulers (range: 20 cm; accuracy: 1 mm), and tape measures (range: 5 m; accuracy: 1 mm) were used to measure the topdressing depth.
2.6.2. Evaluation Criteria for Field Trials
- (1)
- Qualified rate and CV for topdressing depth
The performance evaluation metrics for the fertilizer application unit were the qualified rate of topdressing depth and the CV of topdressing depth. The measurement method was identical to that described in Section 2.1.3. The field measurement of topdressing depth is shown in Figure 13.
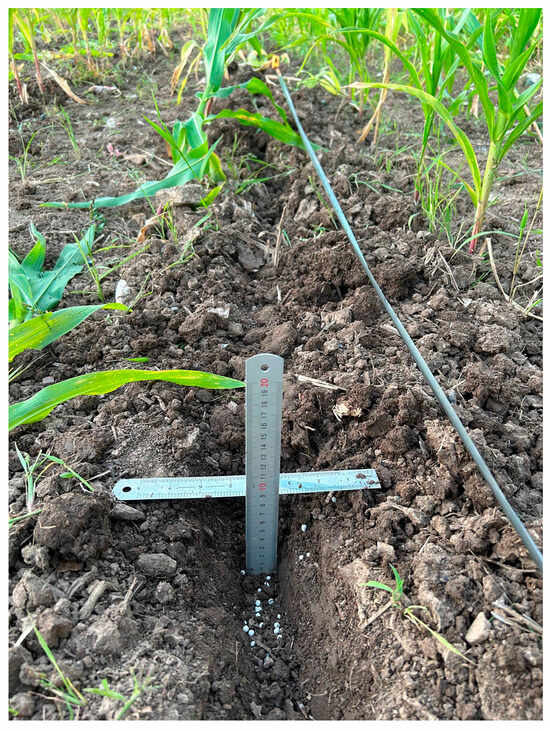
Figure 13.
Field measurement of topdressing depth.
- (2)
- STD of force on the ground from gauge wheel
The dynamic testing and analysis system was used to measure the force on the ground by the gauge wheel of both the two types of fertilizer application units within the stable operation zone. The calculation method for the STD of the gauge wheel’s force on the ground was consistent with Equation (19).
3. Results and Discussion
3.1. Stability Performance Test Results and Analysis
3.1.1. Qualified Rate of Topdressing Depth
The tests evaluated the topdressing depth of the deep fertilizer application unit across three operational speeds, with results presented in Figure 14. At speeds of 5.4 km/h, 7.2 km/h, and 9.0 km/h, the average topdressing depths were recorded at 9.8 cm, 10.2 cm, and 9.7 cm, respectively, yielding corresponding qualified rates of 93%, 87%, and 83%. These results satisfy the national standard requirement, which mandates a qualified rate exceeding 80% for topdressing depth. However, it is notable that the qualified rate of topdressing depth diminishes as operational speed increases. This phenomenon can be attributed to the fact that, when operating on uneven terrain, higher speeds amplify the force exerted on the ground by the gauge wheel, thereby exacerbating the vertical bouncing tendencies of the deep fertilizer application unit. As a result, the gauge wheel struggles to maintain consistent contact with the ground surface, which undermines effective control of trenching depth [36]. These results indicate that increased speed exacerbates ground impact forces, causing gauge wheel bouncing and resulting in ineffective control of furrowing depth.

Figure 14.
Topdressing depth at different operational speeds.
3.1.2. Force Analysis of Gauge Wheel and Furrow Opener
The force on the ground by the gauge wheel was calculated from strain data collected at three operational speeds, with results shown in Figure 15. The force exhibited fluctuations within a certain range, with more pronounced variations observed as operational speed increased. At speeds of 5.4 km/h, 7.2 km/h, and 9.0 km/h, the average force values were 170 N, 160 N, and 143 N, respectively, with corresponding CV of 21.4%, 24.1%, and 36.6%. The primary reason is that increased operational speed enhances the upward rotation tendency of the fertilization application unit, resulting in reduced gauge wheel force on the ground. Meanwhile, the increased CV at higher speeds is attributed to greater impact forces from soil contours on the gauge wheel, consequently expanding the fluctuation range of the force on the ground.
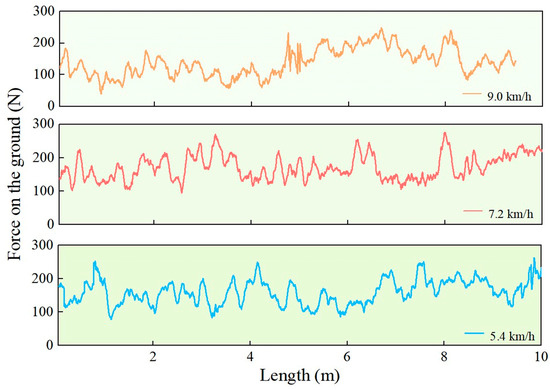
Figure 15.
Force on the ground by gauge wheel at different operational speeds.
The horizontal resistance exerted by the soil on the furrow opener was measured, with the results shown in Figure 16. At operational speeds of 5.4 km/h, 7.2 km/h, and 9.0 km/h, the average horizontal resistance values on the furrow opener were 490 N, 512 N, and 558 N, respectively. The average horizontal resistance from the soil to the furrow opener increased with higher operational speeds, while the horizontal resistance values fluctuated around 500 N
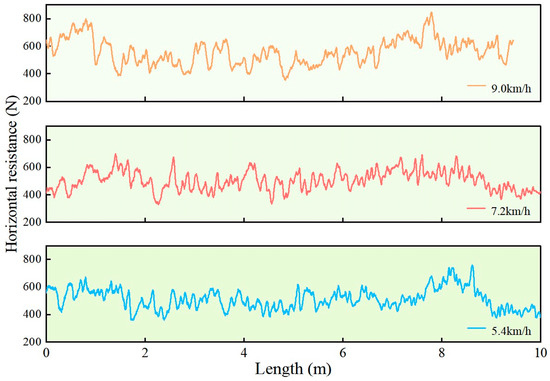
Figure 16.
Horizontal resistance of furrow opener at different operational speeds.
3.1.3. Coherence Analysis
The coherence function between topdressing depth and the force on the ground by the gauge wheel is shown in Figure 17. Under operational speeds of 5.4 km/h, 7.2 km/h, and 9.0 km/h, when the spatial frequency was less than 0.2 m−1, the coherence function exceeded 0.9, indicating excellent coherence between topdressing depth and the force on the ground by the gauge wheel at wavelengths greater than 5 m. For spatial frequencies above 0.2 m−1, the calculated coherence function exhibited some fluctuations due to vibrational interference from the deep fertilizer application unit and sampling frequency limitations of the topdressing depth measurement device. Nevertheless, the overall coherence function remained above the threshold of 0.6, demonstrating that topdressing depth and the force on the ground by the gauge wheel still maintained certain coherence at wavelengths less than 5 m. At the three operational speeds, the 60th percentiles of the coherence function were 0.63, 0.61, and 0.66, respectively, indicating that 60% of the coherence function values exceeded the 0.6 threshold. The coherence function results demonstrate that topdressing depth is influenced by the force on the ground exerted by the gauge wheel, and improving the consistency of this force contributes to enhanced stability of topdressing depth.

Figure 17.
Coherence function between topdressing depth and force on the ground by gauge wheel: (a) 5.4 km/h; (b) 7.2 km/h; (c) 9.0 km/h.
3.2. Simulation Test Results and Analysis
The test results of the force on the ground by the gauge wheel for both types of fertilizer application units, obtained through dynamic model simulation, are shown in Figure 18. As the operational speed increased, the fluctuation range of the force on the ground by the gauge wheel of the deep application fertilizer unit significantly expanded, while the MR damper fertilizer application unit showed no noticeable change. The results demonstrate that higher operational speeds amplify the instability of the force on the ground by the gauge wheel due to undulating terrain contours. However, the MR damper fertilizer application unit, through its vibration damping device incorporating a MR damper installed between the gauge wheel and frame, effectively mitigates the impact of terrain undulations on the force on the ground by the gauge wheel, thereby enhancing the stability of the force on the ground.

Figure 18.
Force on the ground by gauge wheel: (a) 5.4 km/h; (b) 7.2 km/h; (c) 9.0 km/h.
The STD of the force on the ground by the gauge wheel is shown in Table 7. Under the same operational speeds, the MR damper fertilizer application unit consistently demonstrated smaller STD values for the force on the ground by the gauge wheel. At operational speeds of 5.4 km/h, 7.2 km/h, and 9.0 km/h, the STD of the force on the ground by the gauge wheel for the MR damper unit was reduced by 39.6%, 41.0%, and 44.6%, respectively, compared to the deep application fertilizer unit. The test results indicate that the MR damper fertilizer application unit significantly improved the stability of the force on the ground by the gauge wheel. The primary mechanism is that when the gauge wheel traverses undulating surface profiles, the vibration reduction system dynamically adjusts its extension/compression in response to ground reaction forces acting on the gauge wheel with the MR damper effectively filtering impact effects caused by surface irregularities, thereby maintaining the gauge wheel’s force on the ground within a relatively stable range and significantly enhancing its pressure stability. In conclusion, the established dynamic simulation model can simulate the force on the ground by the gauge wheel based on input terrain contour information, with output results demonstrating high accuracy and reliability.

Table 7.
STD of Force on the Ground by Gauge Wheel.
3.3. Parameter Optimization Results and Analysis
3.3.1. Comparative Test Results
Topdressing depth measurements obtained by both the depth measurement device and manual methods are shown in Figure 19.
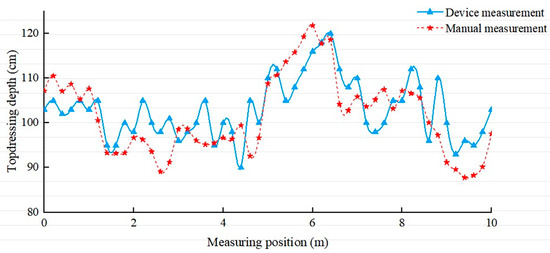
Figure 19.
Topdressing depth comparison.
The results demonstrate that both measurement methods exhibit consistent trends in topdressing depth values. Data analysis revealed a maximum absolute error of 1.2 cm and an average error of 0.5 cm, confirming that the topdressing depth measurement device satisfies experimental requirements. Discrepancies between device-measured and manually measured topdressing depths primarily occur because manual measurement requires soil excavation, which partially compromises the measurement reference benchmark. In contrast, the measurement device employs sensors to determine depth without soil disturbance, delivering superior measurement accuracy and efficiency. This advantage provides theoretical support for subsequent soil bin tests in parameter optimization studies.
3.3.2. Soil Bin Test Results and Analysis
The experimental results are shown in Table 8, where both the qualified rate of topdressing depth and the CV of topdressing depth represent average values from three replicate tests.

Table 8.
Soil bin test results.
The range analysis results indicate that among the three test factors affecting the qualified rate of topdressing depth, the optimal parameter level combination is A4B1C1; among the three factors influencing the CV of topdressing depth, the optimal parameter level combination is A4B1C2. After comprehensive consideration of both evaluation metrics—the qualified rate of topdressing depth and the CV of topdressing depth—a rational parameter combination was selected as A4B1C2, specifically: current at 0.6 A, spring stiffness at 8 N/mm, and speed at 7.2 km/h.
To accurately evaluate the significance of each test factor’s influence on both the qualified rate of topdressing depth and the coefficient of variation (CV) of topdressing depth, the orthogonal test data were subjected to analysis of variance (ANOVA) and p-value significance testing using SPSS (27.0) software, with the significance level set at 0.05. The ANOVA results are presented in Table 9.

Table 9.
ANOVE results.
The ANOVA results indicate that at the significance level α = 0.05, the current value of the MR damper, the spring stiffness of the vibration damping device, and the operational speed all have significant effects (p < 0.05) on both the qualified rate of topdressing depth and the CV of topdressing depth.
3.4. Field Test Results
The field tests were conducted at the experimental fields of Jilin Agricultural University (125.41′ E, 43.81′ N) from 3 to 4 September 2024, using a Kubota (Kubota Corporation, Osaka, Japan) M704 wheel tractor as the power source, with the tractor’s operational speed adjusted to 7.2 km/h. Two types of fertilizer application units were tested in the field experiments, with each group of tests repeated three times, resulting in a total of six test runs. Based on the optimal working parameters obtained from soil bin tests for the MR damper fertilizer application unit, the field validation tests were performed with the MR damper set at 0.6 A current and spring stiffness of 8 N/mm. These tests measured the topdressing depth and force on the ground under actual field operating conditions.
3.4.1. Topdressing Depth
The test results are presented in Table 10. The deep application fertilizer unit achieved an average qualified rate of topdressing depth of 86.5% with an average CV of 12.0%. In comparison, the MR damper fertilizer application unit showed superior performance with an average qualified rate of 93.4% and CV of 8.2%. Relative to the deep application unit, the MR damper unit demonstrated a 6.9%, The fertilization qualification rate showed a p-value of approximately 0.006, indicating a highly significant difference (p < 0.01) between the two types of fertilization application units, which demonstrates that the MR damper fertilizer application unit achieved significantly higher qualification rates than the standard deep fertilization application unit. Improvement in qualified rate and a 3.8% reduction in CV. These results indicate that the vibration damping device installed on the MR damper unit effectively mitigates bouncing phenomena caused by ground impacts and reduces fluctuations in soil resistance acting on the furrow opener. Consequently, the system maintains more consistent furrow depth during operation.

Table 10.
Field test results.
Comparative analysis of the field test results and soil bin test results reveals that under optimal parameter combinations, the qualified rate of topdressing depth in field tests decreased by 2.9% compared to soil bin tests, while the CV of topdressing depth increased by 4.8%. The primary reason for this discrepancy lies in differences in soil physical properties—particularly soil compaction and moisture content—between the controlled soil bin environment and actual field conditions. These field soil characteristics negatively impacted the operational performance of the fertilizer application unit, resulting in reduced topdressing effectiveness relative to soil bin tests.
3.4.2. Force on the Ground
The force on the ground by the gauge wheel, calculated from strain measurements of the adjustment arms of both types of fertilizer application units collected during field tests, is shown in Figure 20. The deep application fertilizer unit exhibited significant fluctuations in the force on the ground by its gauge wheel, ranging from 57.0 to 376.0 N. In contrast, the MR damper fertilizer application unit demonstrated more stable force application, with a narrower range of 92.0 to 285.0 N. The STDs of the force on the ground by the gauge wheel for the deep application unit were 58.2 N, 59.4 N, and 48.1 N across test conditions, while the MR damper fertilizer application unit showed lower STDs of 31.8 N, 26.9 N, and 35.4 N, respectively. This represents an average 42.2% reduction in STD for the MR damper fertilizer application unit compared to the conventional system.
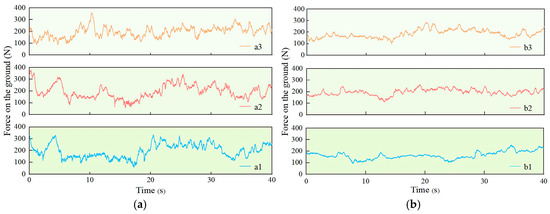
Figure 20.
Force on the ground by the gauge wheel. (a1–a3) in (a) represent field tests of the deep fertilization application unit. (b1–b3) in (b) represent field tests of the MR damper fertilizer application unit.
The test results demonstrate that the MR damper fertilizer application unit significantly reduces fluctuations in the gauge wheel’s force on the ground caused by undulating terrain profiles; compared to the deep fertilization application unit, the MR damper unit shows improvement across all experimental evaluation metrics, preliminarily validating the rationality of its structural design and its potential for enhancing operational stability.
4. Conclusions
This study addresses the issue of insufficient fertilization depth stability in maize deep fertilization operations by designing and optimizing a MR damper-based fertilization application unit, with its effectiveness validated through soil bin tests, dynamic simulations, and field experiments. The research found that the MR damper can suppress the bouncing vibration of the gauge wheel by dynamically adjusting the input current, significantly reducing the standard deviation of the gauge wheel’s force on the ground across different operating speeds, thereby improving the fertilization depth qualification rate; the core mechanism lies in its ability to dynamically match impact loads caused by soil surface variations, effectively addressing the poor contour-adaptability of traditional fertilization machinery and its difficulty in adapting to complex field conditions.
To further enhance the operational efficiency and fertilization depth stability of the maize inter-row deep fertilization application unit, future research will focus on real-time adjustment of the magnetorheological damper’s damping values based on continuously acquired field surface profile data, optimizing the damper’s structural design to reduce energy consumption, and developing intelligent control algorithms adaptable to varying soil conditions and operational speeds. Additionally, response surface methodology will be employed to investigate interaction effects between factors to enhance optimization reliability and explore long-term practical impacts in real farm environments.
Author Contributions
Conceptualization, S.W. and F.S.; methodology, S.W., Z.D. and D.H.; software, S.W. and X.Z.; validation, S.F.; formal analysis, Z.D. and F.S.; investigation, S.F., X.Z. and Z.L.; data curation, Z.D.; writing—original draft preparation, S.W.; writing—review and editing, D.H.; visualization, Z.L.; supervision, D.H.; project administration, D.H.; funding acquisition, D.H. All authors have read and agreed to the published version of the manuscript.
Funding
This work was financially supported by National Key Research and Development Program of China (grant number 2023YFD1500404).
Data Availability Statement
The data presented in this study are available on demand from the corresponding author at huangdy@jlu.edu.cn.
Acknowledgments
We thank the anonymous reviewers for their critical comments and suggestions to improve the manuscript.
Conflicts of Interest
The authors declare no conflicts of interest.
References
- Yang, S. Current Status and Development Trends of the Corn Industry in Northeast China. China Seed Ind. 2015, 161, 6–8. [Google Scholar] [CrossRef]
- Cui, A.M.; Zhang, J.G.; Zhang, H.; Shan, H.; Chen, W. Preliminary Exploration on Current Situation and Development of Maize Production in China. J. Agric. Sci. Technol. 2020, 22, 10–19. [Google Scholar] [CrossRef]
- Mirzakhaninafchi, H.; Singh, M.; Bector, V.; Gupta, O.P.; Singh, R. Design and Development of a Variable Rate Applicator for Real-Time Application of Fertilizer. Sustainability 2021, 13, 8694. [Google Scholar] [CrossRef]
- Konieczna, A.; Roman, K.; Roman, M.; Sliwinski, D.; Roman, M. Energy Efficiency of Maize Production Technology: Evidence from Polish Farms. Energies 2021, 14, 170. [Google Scholar] [CrossRef]
- Feng, H.M.; Gao, N.N.; Meng, Z.J.; Chen, L.P.; Li, Y.; Guo, Y. Design and experiment of deep fertilizer applicator based on autonomous navigation for precise row-following. Trans. Chin. Soc. Agric. Mach. 2018, 49, 60–67. [Google Scholar] [CrossRef]
- Zheng, Y.; Ji, J.H.; Liu, S.Q. Effect of topdressing time on spring maize yield and nitrogen utilization in black soil of northeast China. Sci. Rep. 2023, 13, 11841. [Google Scholar] [CrossRef] [PubMed]
- Jia, Z.Z. Improvement of the Design of Furrow Opener for Deep Fertilization on the Side of Corn Ridge Tillage. Agric. Sci. Technol. Equip. 2024, 1, 65–66. [Google Scholar] [CrossRef]
- Zhao, S.H.; Tan, H.W.; Chen, J.Z.; Chen, J.Q.; Yang, C. Performance experiment of double disk opener used for sowing under deep fertilization. J. Northeast Agric. Univ. 2017, 48, 86–96. [Google Scholar] [CrossRef]
- Liu, W.Z.; He, J.; Li, H.W.; Wei, Z.C.; Zhang, Z.G.; Li, X.Q. Design and experiment of double-side deep fertilizing device for potato micro-seed planter. Trans. Chin. Soc. Agric. Mach. 2020, 51, 56–65. [Google Scholar]
- Hebei Nonghaha Machinery Group Co., Ltd. Wheat Topdressing Machine. 2024. Available online: https://www.nonghaha.com/gzjx (accessed on 5 October 2024).
- Nielsen, S.K.; Norremark, M.; Green, O. Sensor and control for consistent seed drill coulter depth. Comput. Electron. Agric. 2016, 127, 690–698. [Google Scholar] [CrossRef]
- Nielsen, S.K.; Munkholm, L.J.; Lamandé, M.; Norremark, M.; Skou-Nielsen, N.; Edwards, G.T.C.; Green, O. Seed drill instrumentation for spatial coulter depth measurements. Comput. Electron. Agric. 2017, 141, 207–214. [Google Scholar] [CrossRef]
- Pradhan, N.C.; Sahoo, P.K.; Kushwaha, D.K.; Mani, I.; Srivastava, A.; Sagar, A.; Kumari, N.; Sarkar, S.K.; Makwana, Y. A Novel Approach for Development and Evaluation of LiDAR Navigated Electronic Maize Seeding System Using Check Row Quality Index. Sensors 2021, 21, 5934. [Google Scholar] [CrossRef]
- Carlson, J.D.; Catanzarite, D.M.; St. Clair, K.A. Commercial Magneto-Rheological Fluid Devices. Int. J. Mod. Phys. B 1996, 10, 2857–2865. [Google Scholar] [CrossRef]
- RD-1001/RD-1004; Lord Corporation Rheonetic Linear Damper. Product Information Sheet. Lord Corporation Publish: Tokyo, Japan, 1997.
- Kelso, S.P. Development and Investigation of Magneto-Rheological Fluid (MRF) Dampers for Off-Highway, High-Payload Vehicles. Master’s Thesis, University of Nevada, Reno, NV, USA, 1998. [Google Scholar]
- Pradhan, N.C.; Sahoo, P.K.; Kushwaha, D.K.; Makwana, Y.; Mani, I.; Kumar, M.; Aruna, T.N.; Krishnan, V.S. A finite element modeling-based approach to predict vibrations transmitted through different body segments of the operator within the workspace of a small tractor. J. Field Robot. 2023, 40, 1543–1561. [Google Scholar] [CrossRef]
- Sun, S.S.; Ning, D.H.; Yang, J.; Du, H.; Zhang, S.W.; Li, W.H. A seat suspension with a rotary magnetorheological damper for heavy duty vehicles. Smart Mater. Struct. 2016, 25, 105032. [Google Scholar] [CrossRef]
- Zácek, J.; Sebesta, K.; Mohammad, H.; Jenis, F.; Strecker, Z.; Kubík, M. Experimental Evaluation of Modified Groundhook Car Suspension with Fast Magnetorheological Damper. Actuators 2022, 11, 354. [Google Scholar] [CrossRef]
- Szulc, P.; Ambrozy-Deregowska, K.; Waligora, H.; Mejza, I.; Grzes, S.; Zielewicz, W.; Wrobel, B. Dry Matter Yield of Maize (Zea mays L.) as an Indicator of Mineral Fertilizer Efficiency. Plants 2021, 10, 535. [Google Scholar] [CrossRef]
- Zhao, J.H.; Yang, X.J.; Liu, L.J.; Liu, Z.J.; Zhou, J.P.; Jin, C. Mechanical Performance Testing Device for Planter Openers Based on PLC. Trans. Chin. Soc. Agric. Mach. 2014, 45, 29–34. [Google Scholar]
- Yin, X.Q.; Xu, A.M.; Zhou, F. Determination of Rolling Resistance Coefficient under Vehicle Driving Conditions. Automob. Technol. 1999, 2, 23–25. [Google Scholar]
- Marcinkiewicz, J.; Spadlo, M.; Staszak, Z.; Selech, J. Shaping the Design Features of a Dynamometer for Measuring Resistance Biaxial Components of Symmetrical Coulters. Sensors 2022, 22, 272. [Google Scholar] [CrossRef]
- Hu, L.; Du, P.; Luo, X.W.; Zhou, H.; Tang, L.M.; Su, H.Y. Design and experiment on multi-wheel support laser land leveler hanging on tractor. Trans. Chin. Soc. Agric. Mach. 2019, 50, 15–21. [Google Scholar]
- NY/T 1003-2006; Technical Specification for Quality Evaluation of Fertilizer Application Machinery. Standards Press of China: Beijing, China, 2009.
- Zong, L.H. Magnetorheological dampers: Dynamic models and application in vehicle suspensions. Doc 2013, 10, 181. [Google Scholar]
- Zhu, X.Y.; Xie, Z.M.; Yan, X.Q.; Du, X.W. Determination for ground contact length and static radial stiffness of tire. Tire Ind. 1998, 8, 10–13. [Google Scholar]
- Yoo, H.; Oh, J.; Chung, W.J.; Han, H.W.; Kim, J.T.; Park, Y.J.; Park, Y. Measurement of stiffness and damping coefficient of rubber tractor tires using dynamic cleat test based on point contact model. Int. J. Agric. Biol. Eng. 2021, 14, 157–164. [Google Scholar] [CrossRef]
- Graczykowski, C.; Pawlowski, P. Exact physical model of magnetorheological damper. Appl. Math. Model. 2017, 47, 400–424. [Google Scholar] [CrossRef]
- Hui, X.W.; Wang, Z.T.; Long, H.Y.; Li, Y.G. Establishment of hyperbolic tangent model of magnetorheological damper based on MATLAB. Mech. Eng. Autom. 2021, 2, 67–69. [Google Scholar]
- Chen, S.A.; Tong, J.C.; Jiang, X.D.; Wang, Y.X.; Yao, M. Modeling method for non-stationary road irregularity based on modulated white noise and lookup table method. J. Traffic Transp. Eng. 2020, 20, 171–179. [Google Scholar] [CrossRef]
- Wang, L.J.; Yan, J.G.; Hou, Z.F.; Zhang, Y. Design and experiment on agricultural field profiling apparatus. J. Shenyang Agric. Univ. 2018, 49, 425–432. [Google Scholar]
- Jiang, X.H.; Tong, J.; Ma, Y.H.; Li, J.G.; Wu, B.G.; Sun, J.Y. Study of Tillage Depth Detecting Device Based on Kalman Filter and Fusion Algorithm. Trans. Chin. Soc. Agric. Mach. 2020, 51, 53–60. [Google Scholar]
- Suomi, P.; Oksanen, T. Automatic working depth control for seed drill using ISO 11783 remote control messages. Comput. Electron. Agric. 2015, 116, 30–35. [Google Scholar] [CrossRef]
- Ren, L.Q. Experimental Design and Optimization; Science Press: Beijing, China, 2009. [Google Scholar]
- Bai, H.J.; Fang, X.F.; Wang, D.C.; Yuan, Y.W.; Zhou, L.M.; Niu, K. Design and Test of Control System for Seeding Depth and Compaction of Corn Precision Planter. Trans. Chin. Soc. Agric. Mach. 2020, 51, 61–72. [Google Scholar]
Disclaimer/Publisher’s Note: The statements, opinions and data contained in all publications are solely those of the individual author(s) and contributor(s) and not of MDPI and/or the editor(s). MDPI and/or the editor(s) disclaim responsibility for any injury to people or property resulting from any ideas, methods, instructions or products referred to in the content. |
© 2025 by the authors. Licensee MDPI, Basel, Switzerland. This article is an open access article distributed under the terms and conditions of the Creative Commons Attribution (CC BY) license (https://creativecommons.org/licenses/by/4.0/).