Abstract
To ensure the safety and quality of grain during storage requires distributed monitoring of temperature and relative humidity within the bulk material, where hundreds of sensors may be needed. Conventional multi-channel systems are often constrained by the limited number of sensors connectable to a single acquisition unit, high hardware cost, and poor scalability. To address these challenges, this study proposes a novel design method for a multi-channel temperature and relative humidity acquisition system (MTRHAS). The system integrates sequential sampling control and a time-division multiplexing mechanism, enabling efficient data acquisition from multiple sensors while reducing hardware requirements and cost. This system employs sequential sampling control using a single complex programmable logic device (CPLD), and uses multiple CPLDs for multi-channel sensor expansion with a shared address and data bus for communication with a microcontroller unit (MCU). A prototype was developed using two CPLDs and one MCU, achieving data collection from 80 sensors. To validate the approach, a simulated grain silo experiment was conducted, with nine sensors deployed to monitor temperature and relative humidity during aeration. Calibration ensured sensor accuracy, and real-time monitoring results revealed that the system effectively captured spatial and temporal variation patterns of intergranular air conditions. Compared with conventional designs, the proposed system shortens the sampling cycle, decreases the number of acquisition units required, and enhances scalability through the shared bus architecture. These findings demonstrate that the MTRHAS provides an efficient and practical solution for large-scale monitoring of grain storage environments.
1. Introduction
Grains have long been essential to the human diet and have been subject to specific quality requirements [1]. Within the grain supply chain, storage served as a critical post-harvest phase for commercialization [2] and was considered a key factor in ensuring a stable and secure global food supply [3]. To safeguard national food security, it was recommended that static grain storage capacity exceed production capacity [2,4]. Various storage structures, including grain bins, warehouses, and silos, were employed to store unprocessed grain in bulk. In China, storage periods were often prolonged, lasting up to three years or more before processing and consumption. During these extended storage periods, both the quality and quantity of grain were affected by numerous biotic and abiotic factors. Inadequate monitoring and management often led to severe degradation and loss of stored grain [5]. Therefore, high-capacity storage, long-duration preservation, loss mitigation, and supply-maintenance technologies were regarded as key elements in achieving safe and high-quality grain storage.
Among these technologies, real-time monitoring of grain temperature and moisture inside the silos was considered one of the most critical factors for effective storage [6,7]. It played a pivotal role in early warning for food safety, preservation of grain quality, and in guiding aeration and energy-saving strategies.
The temperature and moisture of stored grain exhibited pronounced spatial variability. Distributed temperature monitoring was commonly implemented during grain storage, typically using cable-based systems equipped with thermocouples, thermistors, digital temperature sensors, or fiber-optic sensors to represent the thermal conditions inside the grain mass [2,5,8,9,10,11,12,13]. Real-time measurement of grain moisture content was historically challenging and costly [5]. In most cases, moisture was assessed offline by collecting samples and applying the oven-drying method [14] or using practical grain moisture analyzers [15,16]. To enhance grain storage safety, several novel online moisture measurement techniques were proposed in recent years, including radio frequency tomography systems [17], electromagnetic imaging systems [18,19], and near-infrared spectroscopy [20]. However, these technologies were rarely implemented for large-scale, real-time, distributed, and continuous monitoring of grain moisture content during storage. Grain moisture content was found to be closely correlated with the temperature and relative humidity of intergranular air. In certain cases, the equilibrium moisture content of grains was derived from the temperature and relative humidity of the air between kernels [21,22,23,24], highlighting intergranular relative humidity as another critical parameter requiring monitoring during the storage process [25,26,27]. Deploying temperature and humidity monitoring devices at key positions within grain silos was therefore considered highly significant for ensuring the safe storage of grain.
In recent years, wireless sensing technologies have been increasingly applied in agricultural storage monitoring. For instance, battery-free flexible sensors have been used to continuously monitor food package temperatures at low cost and with high efficiency [28]. Battery-free RFID-based systems have also been developed for cold chain logistics, such as table grapes, to improve temperature transparency [29]. In bulk storage environments, wireless sensor networks have been deployed to track temperature variations in silage stacks [30], while wireless monitoring combined with machine learning has been applied to predict spontaneous combustion in cotton storage [31]. These studies highlight the potential of wireless monitoring in agricultural storage; however, real-time multi-channel temperature and relative humidity acquisition for large-scale grain storage remain insufficiently addressed.
In large-scale grain silos, such as China’s tall flat warehouses, ensuring storage safety and quality typically requires the deployment of hundreds of sensors to capture the temperature distribution within the grain bulk. The number of sensors varies depending on the silo’s size and the type of grain being stored. For instance, in a wheat silo measuring 35.76 m × 23.26 m × 13.26 m (length, width, and height), 240 sensors were installed for temperature monitoring [32]. In another study on summer storage of soybeans with different moisture levels, researchers deployed 264 and 288 sensors, respectively, in two silos of different lengths but similar widths and heights [33]. In a separate investigation assessing the effects of two temperature control techniques on the quality of japonica rice, 416 sensors were used for temperature measurement [34]. These cases illustrate that large-scale distributed parameter monitoring in grain silos has primarily focused on temperature. Although relative humidity is also a critical parameter, the ability to perform real-time distributed monitoring of hundreds of temperature and humidity sensors remains limited in practical storage settings due to constraints in device capabilities and cost. Thus, achieving real-time multi-point temperature and humidity monitoring in large-scale grain storage facilities remains a technical challenge requiring further investigation.
To address these issues, this study develops a distributed multi-channel temperature and relative humidity acquisition system (MTRHAS) suitable for large-scale grain storage, with the aim of solving the following key problems:
- Real-time acquisition using a single data acquisition unit: A single unit collects data from multiple temperature and humidity sensors and communicates with the host computer through a simplified interface with minimal hardware components, thereby reducing cost.
- Sensor compatibility with grain bulk deployment: The sensors are compact and suitable for placement within the grain mass, with minimal impact on measurement accuracy.
- High-speed data acquisition: In large-scale sensor deployments, the system ensures all data are collected within each monitoring cycle.
- Scalability: As the monitoring scale increases, the system can be easily extended to accommodate a greater number of sensors using the same approach.
2. Design of a Multi-Channel Temperature and Relative Humidity Acquisition System Based on Sequential Sampling Control Strategy
Conventional temperature and humidity monitoring systems are limited in the number of sensors that a single acquisition unit can manage. When a microcontroller-based acquisition unit connects to sensors via bus communication protocols, it typically consumes fewer I/O pins; however, the scalability of sensor connections is often restricted. For instance, the Inter-Integrated Circuit (I2C) protocol theoretically supports up to 127 slave devices with 7-bit addressing, but in practice, signal integrity and bus capacitance limitations reduce this number to typically no more than eight devices to ensure stable operation. Similarly, the Serial Peripheral Interface (SPI) protocol—when configured in master mode on microcontrollers such as STM32—can support up to 16 independent slave devices. RS-485 buses allow multi-sensor connections, but few commercial sensors support RS-485 natively; additional RS-485 communication modules are usually required, which significantly increase sensor size and cost, making them unsuitable for large-scale deployment within grain bulks. Alternatively, I/O multiplexing using multiple microcontrollers may offer expandability, but this approach substantially increases the sampling period due to the need for sequential software-based data handling. A common solution for acquiring data from hundreds of sensors in large grain silos involves deploying multiple acquisition units, which introduces added hardware complexity and cost.
To address the challenges associated with limited sensor capacity per acquisition unit, increased hardware demands for distributed monitoring, and system scalability, this study proposes a novel design method for a MTRHAS based on a sequential sampling control strategy. This approach aims to meet the requirements of high-density temperature and humidity data acquisition in large-scale grain storage environments.
2.1. System Architecture
The MTRHAS consists of a lower-level hardware system and an upper-level software system. The overall system architecture is illustrated in Figure 1. The lower-level hardware includes a single-chip microcontroller (MCU), multiple complex programmable logic devices (CPLDs), temperature and humidity sensors, power supply units, communication modules, interfaces, and peripheral circuits. This configuration supports real-time acquisition of multi-channel temperature and humidity data. The upper-level software, designed for PC platforms, provides real-time visualization and monitoring of sensor data. A key feature of the proposed system is its use of CPLDs to extend the number of available I/O ports, enabling a single acquisition unit to control and communicate with multiple sensors in a time-division multiplexing manner. This design overcomes the physical I/O limitations of the MCU and significantly reduces the number of acquisition units required in large-scale monitoring scenarios, thereby lowering overall hardware costs. Furthermore, it provides a flexible foundation for future expansion and adaptation to diverse environmental conditions and sensor system requirements.
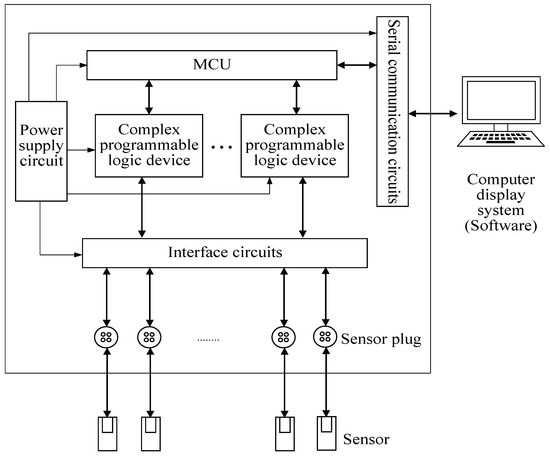
Figure 1.
System architecture.
2.2. Composition of the Lower-Level Hardware System and Key Component Selection
The lower-level hardware system employs the STM32F103C8T6 (STMicroelectronics, Shenzhen WaveShare Electronics Co. Ltd., Shenzhen, China) (MCU). Due to the limited number of I/O ports available on the MCU, the system integrates CPLD (EPM1270, Altera Shenzhen WaveShare Electronics Co. Ltd., Shenzhen, China) to enable multi-channel temperature and humidity data acquisition. The EPM1270 supports a wide operating temperature range from −40 °C to 100 °C and is capable of managing up to 40 sensors per chip via time-division read/write control. Multiple CPLDs communicate with the MCU through a shared address and data bus, enabling coordinated data interaction across modules. The MCU is responsible for orchestrating the sampling timing of multiple CPLD units, performing validation and calibration of temperature and humidity data and transmitting real-time data to the upper-level computer via a serial interface (RS232 to USB).
The system uses SHT15 (Sensirion China Co. Ltd., Shenzhen, China) digital temperature and humidity sensors, which are characterized by low power consumption. Because the signal pins of the SHT15 operate with minimal input/output current, each sensor can be directly interfaced with CPLD pins, eliminating the need for additional driver circuitry and thus simplifying the overall hardware design. The SHT15 offers a temperature accuracy of ±0.3 °C and a relative humidity accuracy of ±2%, meeting the precision requirements for grain storage monitoring. Each sensor is enclosed in a stainless-steel honeycomb protective shell with micropores that allow air flow, facilitating both sensor protection and deployment within the grain mass. The physical structure of the sensor is illustrated in Figure 2. The four-wire interface module of the SHT15 includes a clock line (SCK), a bidirectional data line (DATA), a ground line (GND), and a power line (VCC). These four leads are connected to the sensor interface module via shielded cables to ensure signal integrity and electromagnetic interference resistance [35].
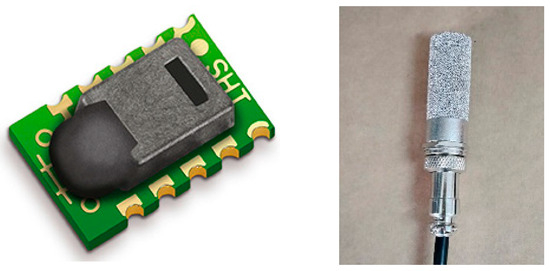
Figure 2.
Temperature and humidity sensor and outer protective cover package.
2.3. Sequential Sampling Control Strategy for Data Acquisition
To address access conflicts in large-scale sensor arrays, this study proposes a sequential sampling control strategy based on CPLDs. The system adopts a grouped multiplexing architecture, wherein sensors managed by each CPLD are divided into groups of n channels. Within each group, channel switching is performed using bidirectional tri-state gates (Figure 3). For example, when E11 = 1 and E12 = 0, the CPLD issues a measurement command to the sensor; conversely, when E11 = 0 and E12 = 1, the CPLD receives data from the sensor. This mechanism effectively avoids bus contention.
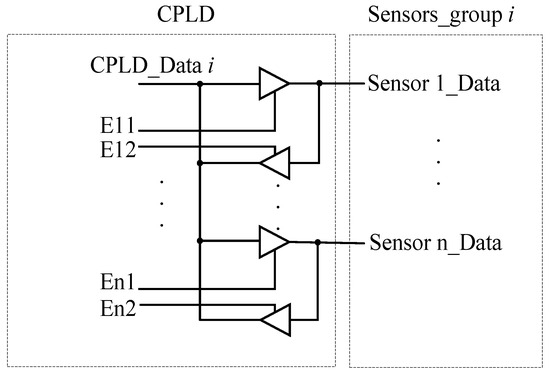
Figure 3.
Schematic of bidirectional tri-state gate designed in CPLD for each sensor group.
The sequential sampling process follows the operational order of “write register → temperature measurement → humidity measurement”. Within the i-th sensor group, all sensors are sampled sequentially under unified control logic. Leveraging channel-level consistency, the CPLD implements a dedicated timing sequence for read/write operations across the group. Under a single control sequence, the system collects data from multiple digital temperature and humidity sensors using tri-state gate-based channel switching. Time-division multiplexing enables efficient data acquisition across all channels. The detailed data acquisition process is illustrated in Figure 4.
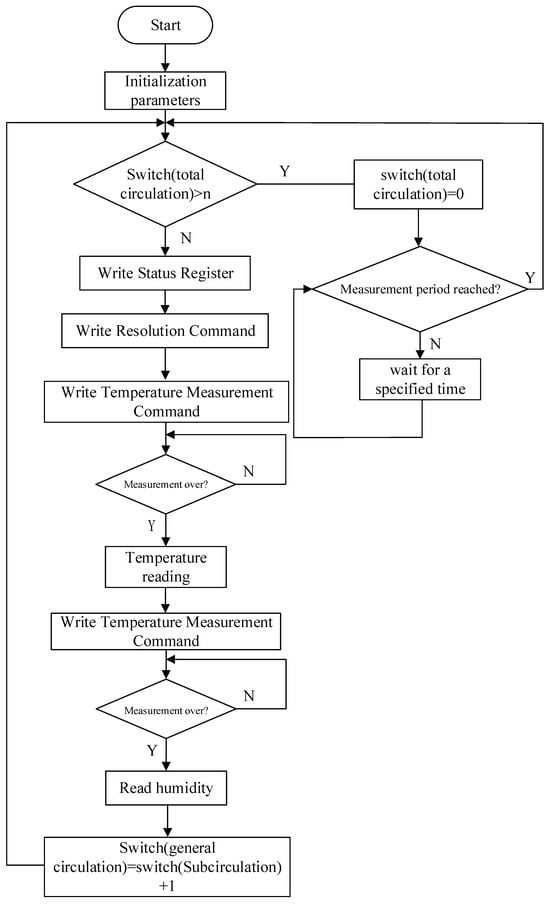
Figure 4.
Sequential sampling control strategy.
The process begins with parameter initialization, followed by entry into the acquisition loop. In each loop iteration, the CPLD performs the following operations in order: write to the status register, set measurement resolution, and issue a temperature measurement command. After the temperature measurement is completed, the system reads the temperature value. It then issues a humidity measurement command and subsequently reads the humidity value. If the number of completed cycles is less than n, the loop continues until all temperature and humidity data from the associated sensor modules are acquired. Once n cycles are completed, the measurement phase ends, and the system waits for the next acquisition cycle to begin. Each CPLD communicates with the MCU through a shared address–data bus, allowing parallel data transfer to the MCU, even when I/O resources are limited.
The system architecture, which combines a single MCU with multiple CPLDs, enables sequential sampling-based acquisition of numerous low-power, high-precision digital temperature and humidity sensors. This design addresses the challenges of large-scale, multi-channel environmental data acquisition in grain storage facilities. It simplifies circuit complexity, increases sensor density, enhances sampling speed, and enables real-time data transmission to the host computer through a single serial interface. Consequently, the system effectively realizes high-speed, real-time, multi-channel temperature and humidity monitoring in storage environments.
2.4. The Software Design
The software system on the host computer receives data from the lower-level acquisition unit via serial port interrupts. It verifies each byte within the data frame using the checksum field and discards any erroneous data. Valid temperature and humidity parameters are extracted through background processing, enabling the separation and interpretation of meaningful data from the serial input stream.
The computational layer of the software converts the raw byte data from the SHT15 sensors into physical temperature and humidity values in real time, using the following formulas:
(1) SHT15 Temperature—temperature acquired from the SHT sensor
According to the specifications of the selected sensor model, the parameter values used in Equation (1) are = −39.7, = 0.04, and represents the 2-byte temperature data returned by the lower-level acquisition system. T is the acquired temperature in °C.
(2) SHT15 Humidity—relative humidity acquired from the SHT sensor
Based on the sensor specifications, the constants used in Equation (2) are = −2.0468, = +0.0367, and = −0.0000015955, and in Equation (3), = +0.01, = +0.00008, and is the current temperature in °C. In both equations, represents the 2-byte humidity data transmitted from the lower-level system. is the acquired relative humidity in %.
The software flowchart is shown in Figure 5. The process begins with initialization. Upon clicking to open the serial port, the host establishes a data connection with the lower-level acquisition unit. If the connection is successful, the system initiates a data request and launches a transmit/receive thread. Incoming data packets are parsed in real time and decoded, and the calculated temperature and humidity values are displayed through the user interface.

Figure 5.
System control flow.
2.5. Prototype Development
Based on the aforementioned design and component selection, a prototype of the system is developed for experimental application scenarios. The prototype integrates two CPLD chips (EPM1270, Altera), each capable of acquiring data from 40 SHT15 temperature and humidity sensors using the proposed sequential sampling control strategy. The sensors connected to each CPLD are divided into four groups of 10 channels, and sensor data within each group are acquired using time-division multiplexing. Together, the two CPLDs enable data acquisition from 80 temperature and humidity sensor channels. Multiple CPLDs communicate with the microcontroller unit (MCU) via a shared address and data bus, enabling coordinated data exchange. The system’s sampling period is set to 2 s. For demonstration purposes, a host-side software interface is designed to visualize data from a subset of 45 sensors. The hardware configuration and the user interface of the prototype system are shown in Figure 6.
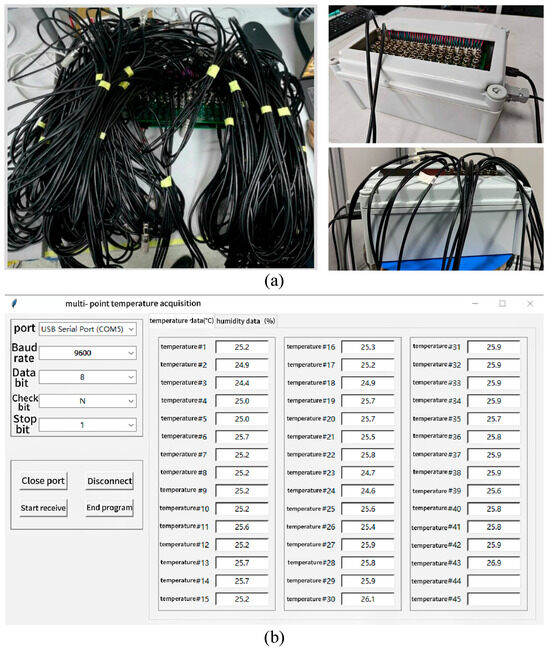
Figure 6.
Prototype hardware (a) and software (b).
3. Test of the MTRHAS for Temperature and Relative Humidity Monitoring
To evaluate the effectiveness of the designed MTRHAS and ensure its adaptability to subsequent experimental scenarios, tests were conducted in a laboratory setting.
3.1. Calibration Test
In this study, the accurate measurement of temperature and humidity by the SHT15 sensors is crucial for the reliability and precision of the experimental results. Therefore, a calibration experiment was conducted to ensure the accuracy of the sensor measurements. The calibration was performed in a climatic chamber with controlled temperature and humidity conditions.
The temperature calibration was carried out in environments maintained at 35 °C and 15 °C, where the temperature data measured by the SHT15 sensor were recorded. Simultaneously, measurements were taken using a nationally calibrated standard thermometer. The data from both the sensor and the standard thermometer were compared under identical environmental conditions. The thermometer used in the calibration experiment had a model specification of (−10~50) °C and was manufactured by Heng shui Chuang ji Instrument and Meter China Co. Ltd., Hengshui, China. The thermometer was calibrated by the Thermology Laboratory of Taiyuan Testing and Certification Group China Co. Ltd., Taiyuan, China. with reference to the technical document JJG130-2011, and the results met the experimental requirements.
The humidity calibration was based on the saturated salt solution method and pure water method to create standard humidity environments. NaCl saturated salt solution and pure water were selected as calibration mediums. Large beakers were used as the containers for the solution, and the surface area of the solution was increased to accelerate vapor equilibrium. According to the principles of humidity thermodynamics, a saturated NaCl solution in a closed system can create a relatively stable relative humidity (RH) environment of 75.3% (with an uncertainty of 0.2). Therefore, the sensor can be calibrated at 75% RH using the calibration formula. When pure water reaches vapor–liquid equilibrium in a closed environment, it can achieve a saturated humidity environment of 100% RH. For the 75% RH calibration, the sensors were placed above the NaCl saturated salt solution and sealed until equilibrium was reached. For the 100% RH calibration, the sensors were sealed above pure water until vapor equilibrium was achieved. Calibration measurements were then taken, during which the temperature was kept at 25 °C.
The temperature and humidity calibration are performed using a standard linear method. represents the actual temperature measured by the SHT15 sensor, and represents the humidity, while the calibrated standard values are denoted as and . The following linear calibration relations can then be established:
By substituting the measured and calibrated values for temperature from the temperature calibration experiment into Equation (4), the constants a and b can be obtained. Similarly, for the humidity calibration experiment, the measured and calibrated values for humidity are substituted into Equation (5) to solve for constants c and d. As an example, the calibration curves for 10 sensors are shown in Figure 7. For the subsequent data collection in system applications, the calibrated parameters will be used as the final measured data.

Figure 7.
Fitting of calibration curves: (a) relative humidity calibration curves for Sensors 1–10; (b) temperature calibration curves for Sensors 1–10.
To ensure the consistency, reliability, and repeatability of the temperature and humidity data, each measurement point is repeated three times. By comparing the data measured by the sensor with the standard data, the accuracy of the SHT15 can be evaluated, and its output can be adjusted to match the standard measurement values. In the later experiments, the calibrated temperature and humidity data are used.
3.2. Experimental Apparatus
To conduct application testing of MTRHAS, a stored grain aeration experimental apparatus was designed. The setup consists of a simulated grain silo (inner diameter: 0.4 m, height: 1.5 m, and wall thickness: 0.005 m), along with auxiliary aeration equipment. The silo is filled with test grain and has a top opening with a diameter of 13.5 cm reserved for installation. An external insulation layer approximately 2 cm thick covers the silo. A blower (air pressure p = 1 kPa, outlet diameter D = 0.06 m, rotation speed s = 2800 r/min, and power P = 0.12 kW) is used to provide the required airflow rate. Air from the blower is directed into the silo via a plenum connected between the blower and the experimental silo. Inside the simulated silo, a metal mesh is placed 10 cm above the bottom, creating a 0.1 m high air chamber at the base and a 1.4 m vertical space above it to hold the grain.
The structure of the experimental apparatus is shown in Figure 8. The entire setup is placed inside an environmental climate chamber with controllable temperature and humidity (internal dimensions: 3 m × 3 m × 2.2 m), as shown in Figure 9. The outer cover of the simulated silo is thermally insulated from the climate chamber environment. During the aeration experiment, the blower forces air from the climate chamber into the base of the silo, allowing it to flow upward through the grain mass. This process alters the temperature and relative humidity of the intergranular air, which, in turn, affects the temperature and moisture content of the grain.
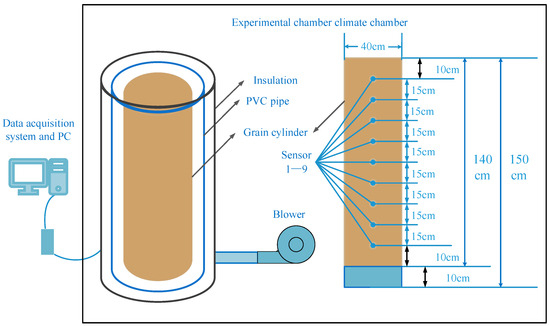
Figure 8.
The structure of the experimental apparatus.
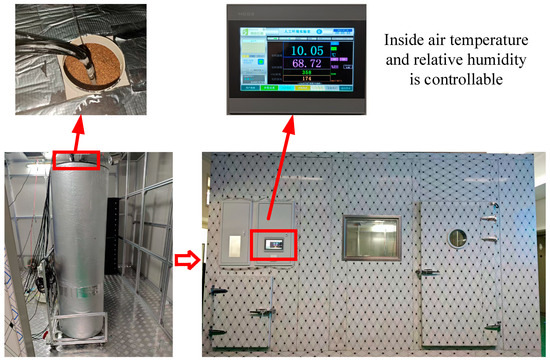
Figure 9.
Experimental apparatus and its arrangement in an artificial climate chamber.
In this study, sensors of the MTRHAS were embedded in the grain bulk to continuously collect the temperature and relative humidity data of the intergranular air. These measurements reflect the variations in the thermal and moisture parameters during the aeration process in grain storage.
3.3. Experimental Conditions
Wheat was used as the experimental grain. Samples were collected proportionally from different locations within the bulk, and the average dry basis moisture content was measured using the oven-drying method, resulting in a value of 12.26%. A total of 250 kg of wheat was loaded into the experimental silo, and nine SHT15 temperature and humidity sensors were installed evenly from bottom to top, labeled 1–9. The vertical distance between adjacent sensors was 15 cm, as shown in Figure 8.
The initial temperature of the intergranular air was 35 °C, and the relative humidity ranged between 65% and 70%. The climate chamber was set to maintain an ambient temperature of 10 °C and a relative humidity between 55% and 60%, which served as the inlet air conditions for aeration. After the aeration started, the MTRHAS was used to monitor the temperature and relative humidity of intergranular air in real time at different positions within the grain bulk. The aeration experiment lasted for 16.5 h.
4. Results
Experimental Results
Variations of intergranular air temperature and relative humidity were monitored with MTRHAS during the stored grain aeration process. The results are shown in Figure 10 and Figure 11.
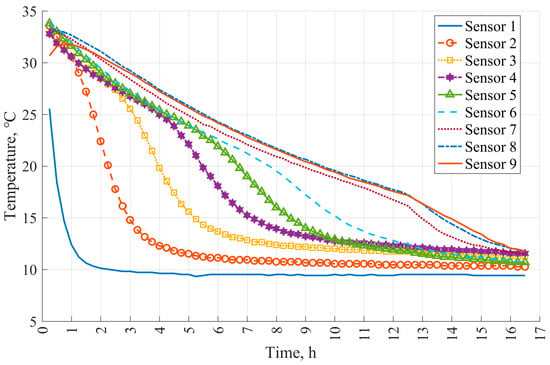
Figure 10.
Schematic diagram of temperature variation curves.
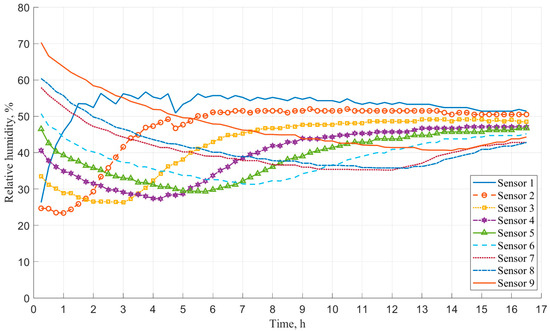
Figure 11.
Schematic diagram of relative humidity variation curves.
The temperature variation curves illustrate the vertical distribution of temperature within the grain bulk as acquired by the nine SHT15 sensors over a 16.5-h aeration period.
During the initial stage of aeration (0–2 h), characterized by rapid cooling, Sensor 1, located at the bottom of the grain silo near the air chamber and above the mesh plate, responded most quickly due to its first exposure to the incoming air from the pump, of which the temperature and relative humidity were stable. The synchronous cooling rates of Sensor 3, Sensor 6, and Sensor 9 at different heights decreased as the height increased. This trend can be attributed to the fact that cold air first penetrated the bottom grain layers, and as the airflow path extended upward, the heat exchange efficiency gradually weakened.
In the mid-aeration stage (2–8 h), a gradual equilibrium was established. The aeration and cooling process of the bottom grain layer was gradually completed, and cooling continued in the middle of the grain silo. The temperatures recorded by Sensors 4–6 showed a linear downward trend, though the average cooling rate was slower than in the initial stage. The top of the grain bulk, being farthest from the air inlet, exhibited a noticeable delay in temperature change. After 8 h of aeration, the maximum vertical temperature difference between the top and bottom layers reached 12.08 °C.
In the final aeration stage (8–16.5 h), known as the residual heat layer stage, no significant temperature changes were observed in most sensors, except for Sensors 7–9, located at the top of the silo. After 16.5 h of aeration, the temperature within the grain bulk had generally converged to the ambient temperature of the climate chamber (10 °C), and the temperature changes recorded by Sensors 1–9 met the expected outcomes. The key cooling parameters are summarized in Table 1.

Table 1.
Statistical data of intergranular air temperature variations during aeration.
The relative humidity variations indicate a significant coupling between the humidity and temperature fields within the grain bulk.
During the initial ventilation period (0–2 h), characterized by intense humidity redistribution, air was introduced from the bottom of the grain bin. Sensor 1, located near the air duct at the bottom close to the mesh plate air chamber, recorded a 30% increase in relative humidity. As the first sensor exposed to the cold air delivered by the pump, it directly contacted the bottom grain, causing a rapid decrease in grain temperature and a saturation effect that sharply increased the relative humidity of the intergranular air at the bottom. In contrast, Sensor 9, positioned at the top of the bin, showed a slower decline in grain temperature. With the continuous inflow of low-temperature and low-humidity air, and as the grain moisture could not desorb quickly, the relative humidity of the intergranular air at the top exhibited a downward trend, while the introduced airflow facilitated the redistribution of water vapor.
In the mid-aeration stage (2–8 h), the humidity field in the grain bulk entered a phase of dynamic equilibrium adjustment. The relative humidity of the intergranular air at the bottom reached a steady state, slightly lower than that of the incoming air and the ambient climate chamber. Given the inverse relationship between air temperature and relative humidity under constant absolute humidity, the gradual temperature drop in the middle layers led to a corresponding rise in relative humidity. Residual heat in the upper grain layers suppressed moisture adsorption, resulting in a slower rate of humidity decline.
During the final aeration stage (8–16.5 h), the humidity field of the grain bulk exhibited a combined pattern of local desorption and delayed humidification. Once the top grain layers had cooled to near the temperature of the incoming air, the relative humidity of the intergranular air in the upper layers began to increase. The humidity variations observed by Sensors 1–9 aligned with expectations. The statistical parameters of intergranular air humidity are summarized in Table 2.

Table 2.
Statistical data of intergranular air relative humidity variation during aeration.
5. Discussion
During the testing process of the multi-sensor system within the stored grain aeration experimental setup, the system successfully performed real-time monitoring of temperature and relative humidity and displayed the collected data on the host computer. It was able to accurately reflect the variation patterns of intergranular air temperature and relative humidity within the simulated grain silo. Calibration tests ensured that the SHT15 sensors provided accurate readings with minimal deviation compared to reference standards. The temperature and relative humidity data collected during the aeration test further confirmed that the sensor system was capable of responding correctly and promptly to changes in the internal temperature and humidity conditions of the silo. Through experiments simulating grain storage conditions, the system was able to measure temperature and relative humidity data in real time. The experimental results demonstrated that the proposed MTRHAS is applicable to large-scale grain storage facilities.
By utilizing the logic resources of CPLD to expand the I/O ports, a bidirectional tri-state gate time-division multiplexing mechanism was designed, and a sequential sampling control strategy was implemented. Through unified scheduling of sensor read/write timing sequences by the CPLD, the sampling cycle is shortened, enabling effective time-division multiplexed data acquisition from multiple sensors. Each CPLD can achieve data acquisition from up to 40 temperature and humidity sensors. This strategy ensures that a single acquisition unit can successfully and rapidly read and process data from multiple sensors, effectively addressing the limitation of sensor quantity connected to a single acquisition device. This approach significantly reduced the total number of acquisition units required, thereby lowering hardware investment and long-term operational costs.
Moreover, under scenarios with the same number of monitoring points, this design can significantly reduce the number of acquisition units required, thereby lowering hardware resource investment and cost. In terms of scalability, due to the shared address and data bus, the sensor numbers can be exponentially increased by adding more CPLDs, as long as the temperature and relative humidity monitoring cycle requirements of the grain storage are met. The system design method proposed in this paper is applicable to system development for large-scale temperature and relative humidity monitoring in grain storage environments. In addition, the scalable design of the system provides a reference for the integration of wireless data transmission technologies. The experimental validation in this study not only confirmed the technical feasibility of the system but also highlighted its practical significance in enhancing the safety and sustainability of large-scale grain storage.
6. Conclusions
The proposed multi-sensor temperature and humidity monitoring system has successfully fulfilled the requirements for real-time supervision of grain storage conditions. In contrast to conventional MCUs that suffer from limited I/O capacity and timing constraints, the integration of CPLD logic resources for I/O expansion, sequential sampling control, and optimized sensor calibration endows the system with high accuracy, rapid response, low cost, and excellent scalability. This approach offers a practical solution for large-scale temperature and humidity monitoring in grain storage facilities. Future work will focus on scaling the system to full warehouse applications, where sensor deployment can provide early warnings of grain deterioration and support modern intelligent storage strategies. In addition, reducing energy consumption in sensor detection systems will be a promising direction to enhance sustainable and environmentally friendly grain storage practices.
Author Contributions
Conceptualization, C.W. and J.L.; methodology, J.L.; software, C.W. and B.Z.; validation, C.W. and B.Z.; formal analysis, C.W. and J.L.; investigation, B.Z.; data curation, C.W.; writing—original draft preparation, C.W. and B.Z.; writing—review and editing, C.W. and J.L.; funding acquisition, J.L. All authors have read and agreed to the published version of the manuscript.
Funding
This research received no external funding.
Institutional Review Board Statement
Not applicable.
Data Availability Statement
The data presented in this study are available on request from the first author.
Conflicts of Interest
The authors declare no conflicts of interest.
References
- Wrigley, C.; Batey, I.; Miskelly, D. Chapter 1—Assessing and Managing Quality at all Stages of the Grain Chain. In Cereal Grains, 2nd ed.; Woodhead Publishing: London, UK, 2017; pp. 3–25. [Google Scholar]
- Ziegler, V.; Paraginski, R.T.; Ferreira, C.D. Grain storage systems and effects of moisture, temperature and time on grain quality—A review. J. Stored Prod. Res. 2021, 91, 101770. [Google Scholar] [CrossRef]
- Rizwan, M.; Atta, B.; Ali, M.Y.; Ashraf, I.; Arshad, M.; Tahir, M.; Rizwan, M.; Sabir, A.M.; Shehzadi, N.; Khalid, U.B.; et al. The comparison of interstitial relative humidity and temperatures of hermetic and polypropylene bag for wheat grain storage under different agro-climatic conditions of rice-wheat ecosystem of Pakistan: Effect on seed quality and protection against insect pests. J. Stored Prod. Res. 2022, 96, 101936. [Google Scholar] [CrossRef]
- Jianyao, Y.; Zhang, Q.; Ge, L.; Chen, J. Technical methods of national security supervision: Grain storage security as an example. J. Saf. Sci. Resil. 2023, 4, 61–74. [Google Scholar] [CrossRef]
- Wu, W.; Cui, H.; Han, F.; Liu, Z.; Wu, X.; Wu, Z.; Zhang, Q. Digital monitoring of grain conditions in large-scale bulk storage facilities based on spatiotemporal distributions of grain temperature. Biosyst. Eng. 2021, 210, 247–260. [Google Scholar] [CrossRef]
- Thorpe, G.R. Modelling ecosystems in ventilated conical bottomed farm grain silos. Ecol. Model. 1997, 94, 255–286. [Google Scholar] [CrossRef]
- Liu, J.; Li, P. Control and Real-Time Data Acquisition of an Experimental Platform for Stored Grain Aeration Study. Sensors 2021, 21, 5403. [Google Scholar] [CrossRef]
- Yuan, J.; Zheng, D.; Meng, X.; Zhao, H. Research progress of grain monitoring and early warning technology. J. Chin. Cereals Oils Assoc. 2022, 37, 19–26. [Google Scholar]
- Chen, W. Temperature detecting system for food storing. J. Henan Univ. Technol. (Natl. Sci. Ed. ) 2009, 30, 82–84. [Google Scholar] [CrossRef]
- Chen, Y.; Chen, J. The design of multi-channel temperature detecting system. In Anti-Counterfeiting, Security, and Identification; IEEE: Taipei, China, 2012. [Google Scholar] [CrossRef]
- Kaushik, R.; Singhai, J. An approach for the development of a sensing system to monitor contamination in stored grain. In Proceedings of the 2019 6th International Conference on Signal Processing and Integrated Networks (SPIN), Noida, India, 7–8 March 2019. [Google Scholar] [CrossRef]
- Wang, T.; Wang, J.; Zhao, L. Research on fiber optic temperature and humidity monitoring technology of grain silo. Grain Oil Storage Sci. Technol. Commun. 2019, 35, 49–52. [Google Scholar]
- Neto, A.J.S.; Lopes, D.C. Thermistor based system for grain aeration monitoring and control. Comput. Electron. Agric. 2015, 116, 45–54. [Google Scholar] [CrossRef]
- ASAE Standards No. S352.2; Moisture Measurement—Unground Grain and Seeds. American Society of Agricultural Engineers: St. Joseph, MI, USA, 2016.
- Nelson, S.O.; Kraszewski, A.W.; Trabelsi, S.; Lawrence, K.C. Using cereal grain permittivity for sensing moisture content. IEEE Trans. Instrum. Meas. 2000, 49, 470–475. [Google Scholar] [CrossRef]
- Zhou, H.; Liu, J.; Jayas, D.S.; Wu, Z.; Zhou, X. A distributed parameter model predictive control method for forced air ventilation through stored grain. Appl. Eng. Agric. 2014, 30, 593–600. [Google Scholar] [CrossRef]
- Mohd Ramli, N.A.; Fazalul Rahiman, M.H.; Kamarudin, L.M.; Mohamed, L.; Zakaria, A.; Ahmad, A.; Rahim, R.A. A New Method of Rice Moisture Content Determination Using Voxel Weighting-Based from Radio Tomography Images. Sensors 2021, 21, 3686. [Google Scholar] [CrossRef]
- Asefi, M.; Gilmore, C.; Jeffrey, I.; LoVetri, J.; Paliwal, J. Detection and continuous monitoring of localised high-moisture regions in a full-scale grain storage bin using electromagnetic imaging. Biosyst. Eng. 2017, 163, 37–49. [Google Scholar] [CrossRef]
- Gilmore, C.; Asefi, M.; Paliwal, J.; LoVetri, J. Industrial scale electromagnetic grain bin monitoring. Comput. Electron. Agric. 2017, 136, 210–220. [Google Scholar] [CrossRef]
- Lin, L.; He, Y.; Xiao, Z.; Zhao, K.; Dong, T.; Nie, P. Rapid-Detection Sensor for Rice Grain Moisture Based on NIR Spectroscopy. Appl. Sci. 2019, 9, 1654. [Google Scholar] [CrossRef]
- Armstrong, P.R.; McNeil, S.G.; Manu, N.; Bosomtwe, A.; Danso, J.K.; Osekre, E.; Opit, G. Development and evaluation of a low-cost probe-type instrument to measure the equilibrium moisture content of grain. Appl. Eng. Agric. 2017, 33, 619–627. [Google Scholar] [CrossRef]
- Lutz, É.; Coradi, P.C.; Jaques, L.B.A.; de Oliveira Carneiro, L.; Teodoro, L.P.R.; Teodoro, P.E.; Meneghetti, V.L.; de Souza, G.A.C. Real-time equilibrium moisture content monitoring to predict grain quality of corn stored in silo and raffia bags. J. Food Process Eng. 2022, 45, e14076. [Google Scholar] [CrossRef]
- Uddin, M.S.; Armstrong, P.R.; Zhang, N. Accuracy of grain moisture content prediction using temperature and relative humidity sensors. Appl. Eng. Agric. 2006, 22, 267–273. [Google Scholar] [CrossRef]
- Lopes, D.D.C.; Steidle Neto, A.J.; Vasco Júnior, R. Comparison of equilibrium models for grain aeration. J. Stored Prod. Res. 2015, 60, 11–18. [Google Scholar] [CrossRef]
- Jian, F.; Liu, J.; Jayas, D.S. A new mathematical model to simulate sorption, desorption and hysteresis of stored canola during aeration. Dry. Technol. 2019, 38, 2190–2201. [Google Scholar] [CrossRef]
- Zhao, L.; Wang, J.; Li, Z.; Hou, M.; Dong, G.; Liu, T.; Sun, T.; Grattan, K.T.V. Quasi-Distributed Fiber Optic Temperature and Humidity Sensor System for Monitoring of Grain Storage in Granaries. IEEE Sens. J. 2020, 20, 9226–9233. [Google Scholar] [CrossRef]
- Bharathi, V.S.K.; Jian, F.; Jayas, D.S. Study on 300 t of wheat stored in corrugated steel bin for two years in Canada. Part I—Temperature and moisture profiles of the grain. J. Stored Prod. Res. 2023, 100, 102057. [Google Scholar] [CrossRef]
- Wan, Z.; Chen, X.; Song, D.; Wu, Z.; Zhang, R.; Wang, M.; Xiao, X. Battery-free fexible wireless temperature sensing for food storage. FlatChem 2024, 47, 100709. [Google Scholar] [CrossRef]
- Xiao, X.; Fu, Z.; Zhang, X.; Cheng, J.; Yang, M. Battery-free wireless sensor system with compressed sensing for table grapes cold chain. Comput. Electron. Agric. 2019, 163, 104869. [Google Scholar] [CrossRef]
- Green, O.; Nadimi, E.S.; Blanes-Vidal, V.; Jørgensen, R.N.; Drejer Storm, I.M.L.; Sørensen, C.G. Monitoring and modeling temperature variations inside silage stacks using novel wireless sensor networks. Comput. Electron. Agric. 2009, 69, 149–157. [Google Scholar] [CrossRef]
- Shafi, U.F.; Anwar, W.; Bajwa, I.S.; Sattar, H.; Yaqoob, I.; Mahmood, A.; Ramzan, S. Smart Predictor for Spontaneous Combustion in Cotton Storages Using Wireless Sensor Network and Machine Learning. Int. J. Distrib. Sens. Netw. 2024, 2024, 5551759. [Google Scholar] [CrossRef]
- Zhao, X.; Hao, S.; Shi, Y. Temperature Field Distribution Model of The National Grain Reserve Warehouse. J. Chin. Cereals Oils Assoc. 2019, 34, 57–63. [Google Scholar]
- Luo, R. Analysis of Temperature Changes of Imported Soybeans with Different Moisture Contents during the Summer. Grain Oil Storage Sci. Technol. Commun. 2024, 40, 42–44. [Google Scholar]
- Zhao, X.; Cao, Y.; Dong, M.; Lin, Z.; Zhao, H.; Li, X.; Li, J. Research on effect of two temperature-controlled grain storage techniques on quality change of northeast japonica rice. Sci. Technol. Cereals Oils Foods 2021, 29, 194–199. [Google Scholar] [CrossRef]
- Barroca, N.; Borges, L.M.; Velez, F.J.; Monteiro, F.; Górski, M.; Castro-Gomes, J. Wireless sensor networks for temperature and humidity monitoring within concrete structures. Constr. Build. Mater. 2013, 40, 1156–1166. [Google Scholar] [CrossRef]
Disclaimer/Publisher’s Note: The statements, opinions and data contained in all publications are solely those of the individual author(s) and contributor(s) and not of MDPI and/or the editor(s). MDPI and/or the editor(s) disclaim responsibility for any injury to people or property resulting from any ideas, methods, instructions or products referred to in the content. |
© 2025 by the authors. Licensee MDPI, Basel, Switzerland. This article is an open access article distributed under the terms and conditions of the Creative Commons Attribution (CC BY) license (https://creativecommons.org/licenses/by/4.0/).