3.3. Comparison Between Vegetation Index Values and Actual Chlorophyll Measurements
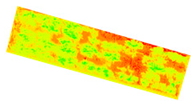
Table 6 shows the index values obtained from the vegetation index maps generated by Pix4Dmapper.
Overall, NDVI showed the highest average index value, whereas CCCI values were comparable. A closer examination revealed that index values increased slightly from June to July and then declined after July.
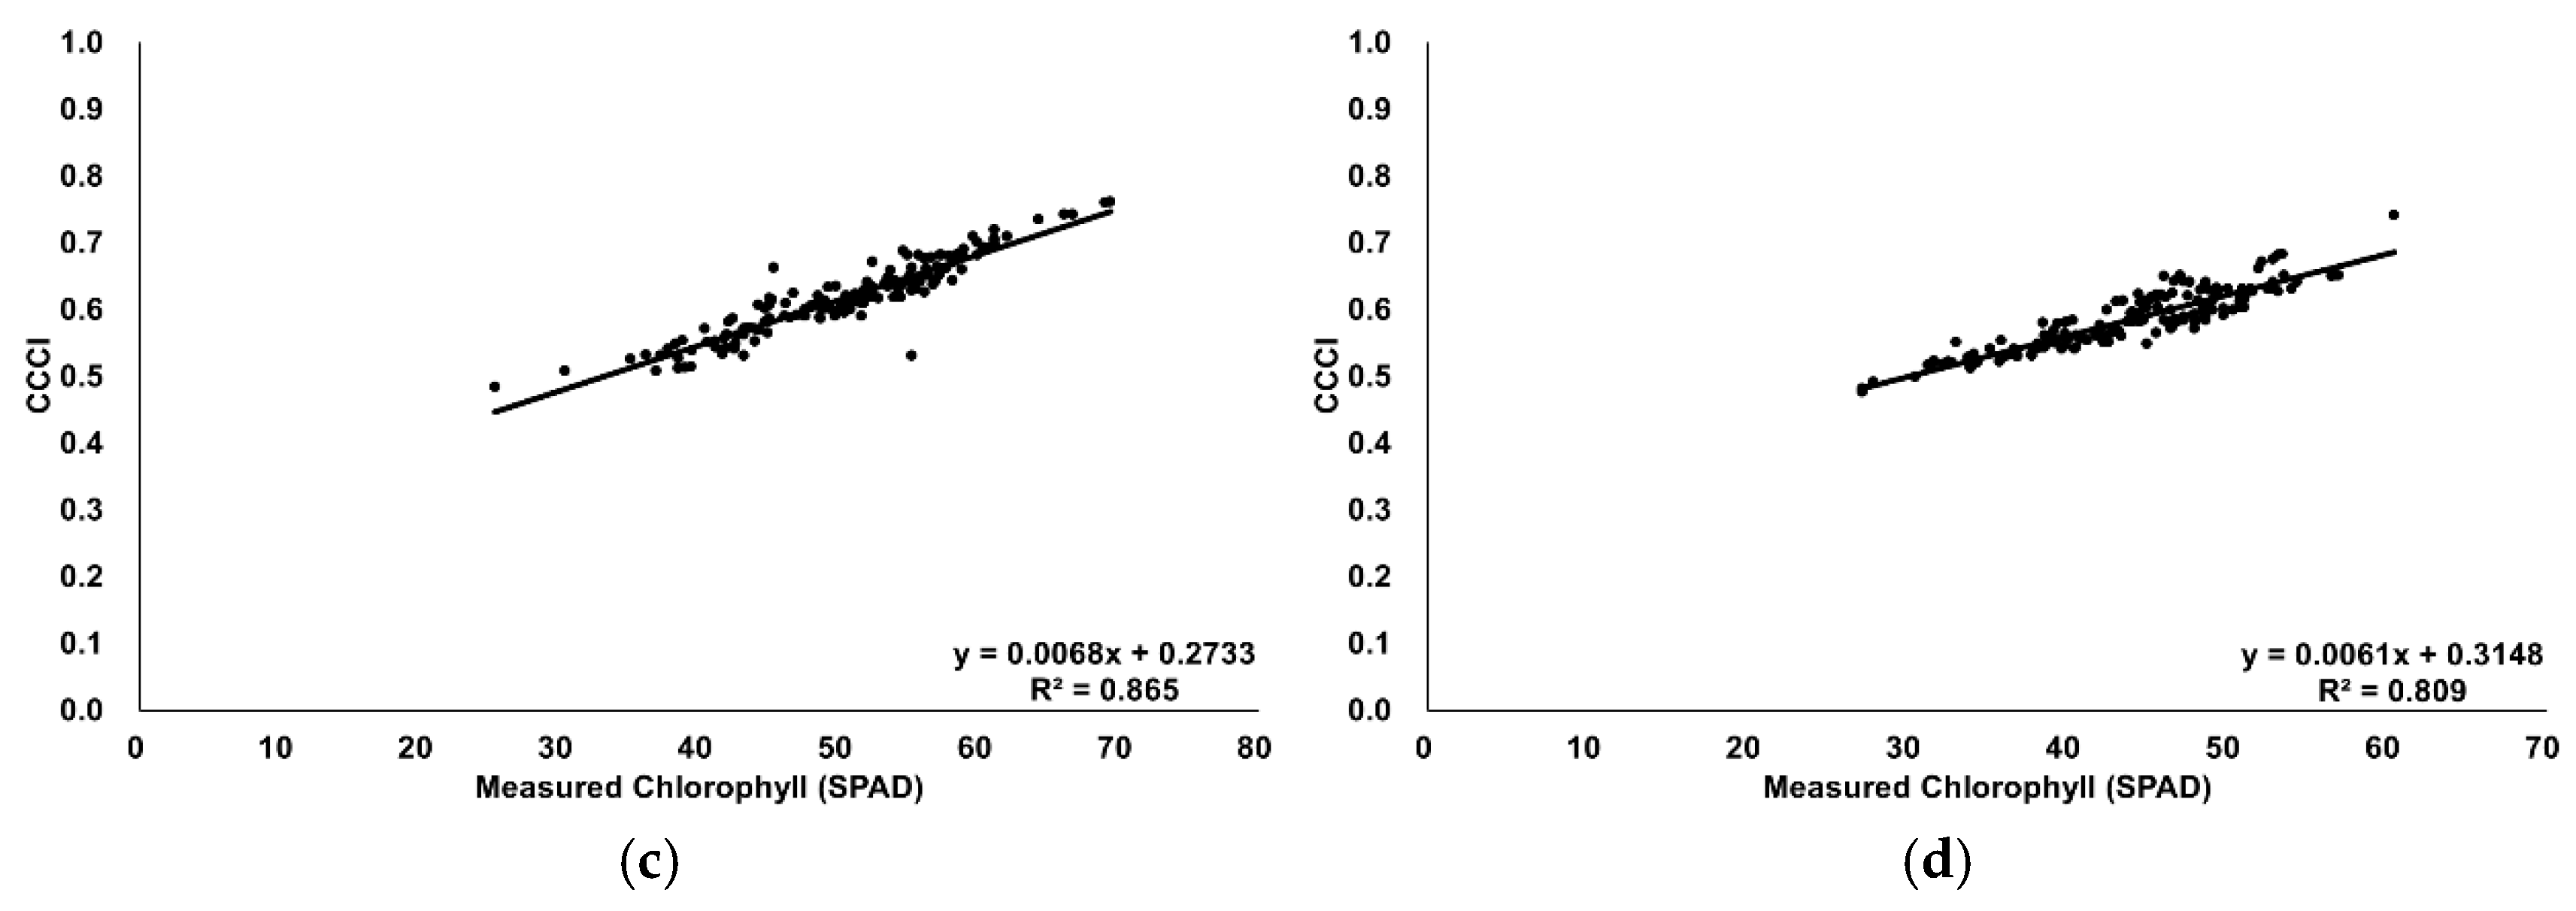
Figure 6 shows a graph of the regional averages of the measured chlorophyll content.
The monthly chlorophyll values measured using the portable chlorophyll meter followed a trend similar to that of the average index values, with chlorophyll content increasing from June and decreasing after July. Accordingly, a normality test (
Table 7) was performed to assess whether a linear relationship existed between the actual chlorophyll content of hardy kiwi leaves and each vegetation index value.
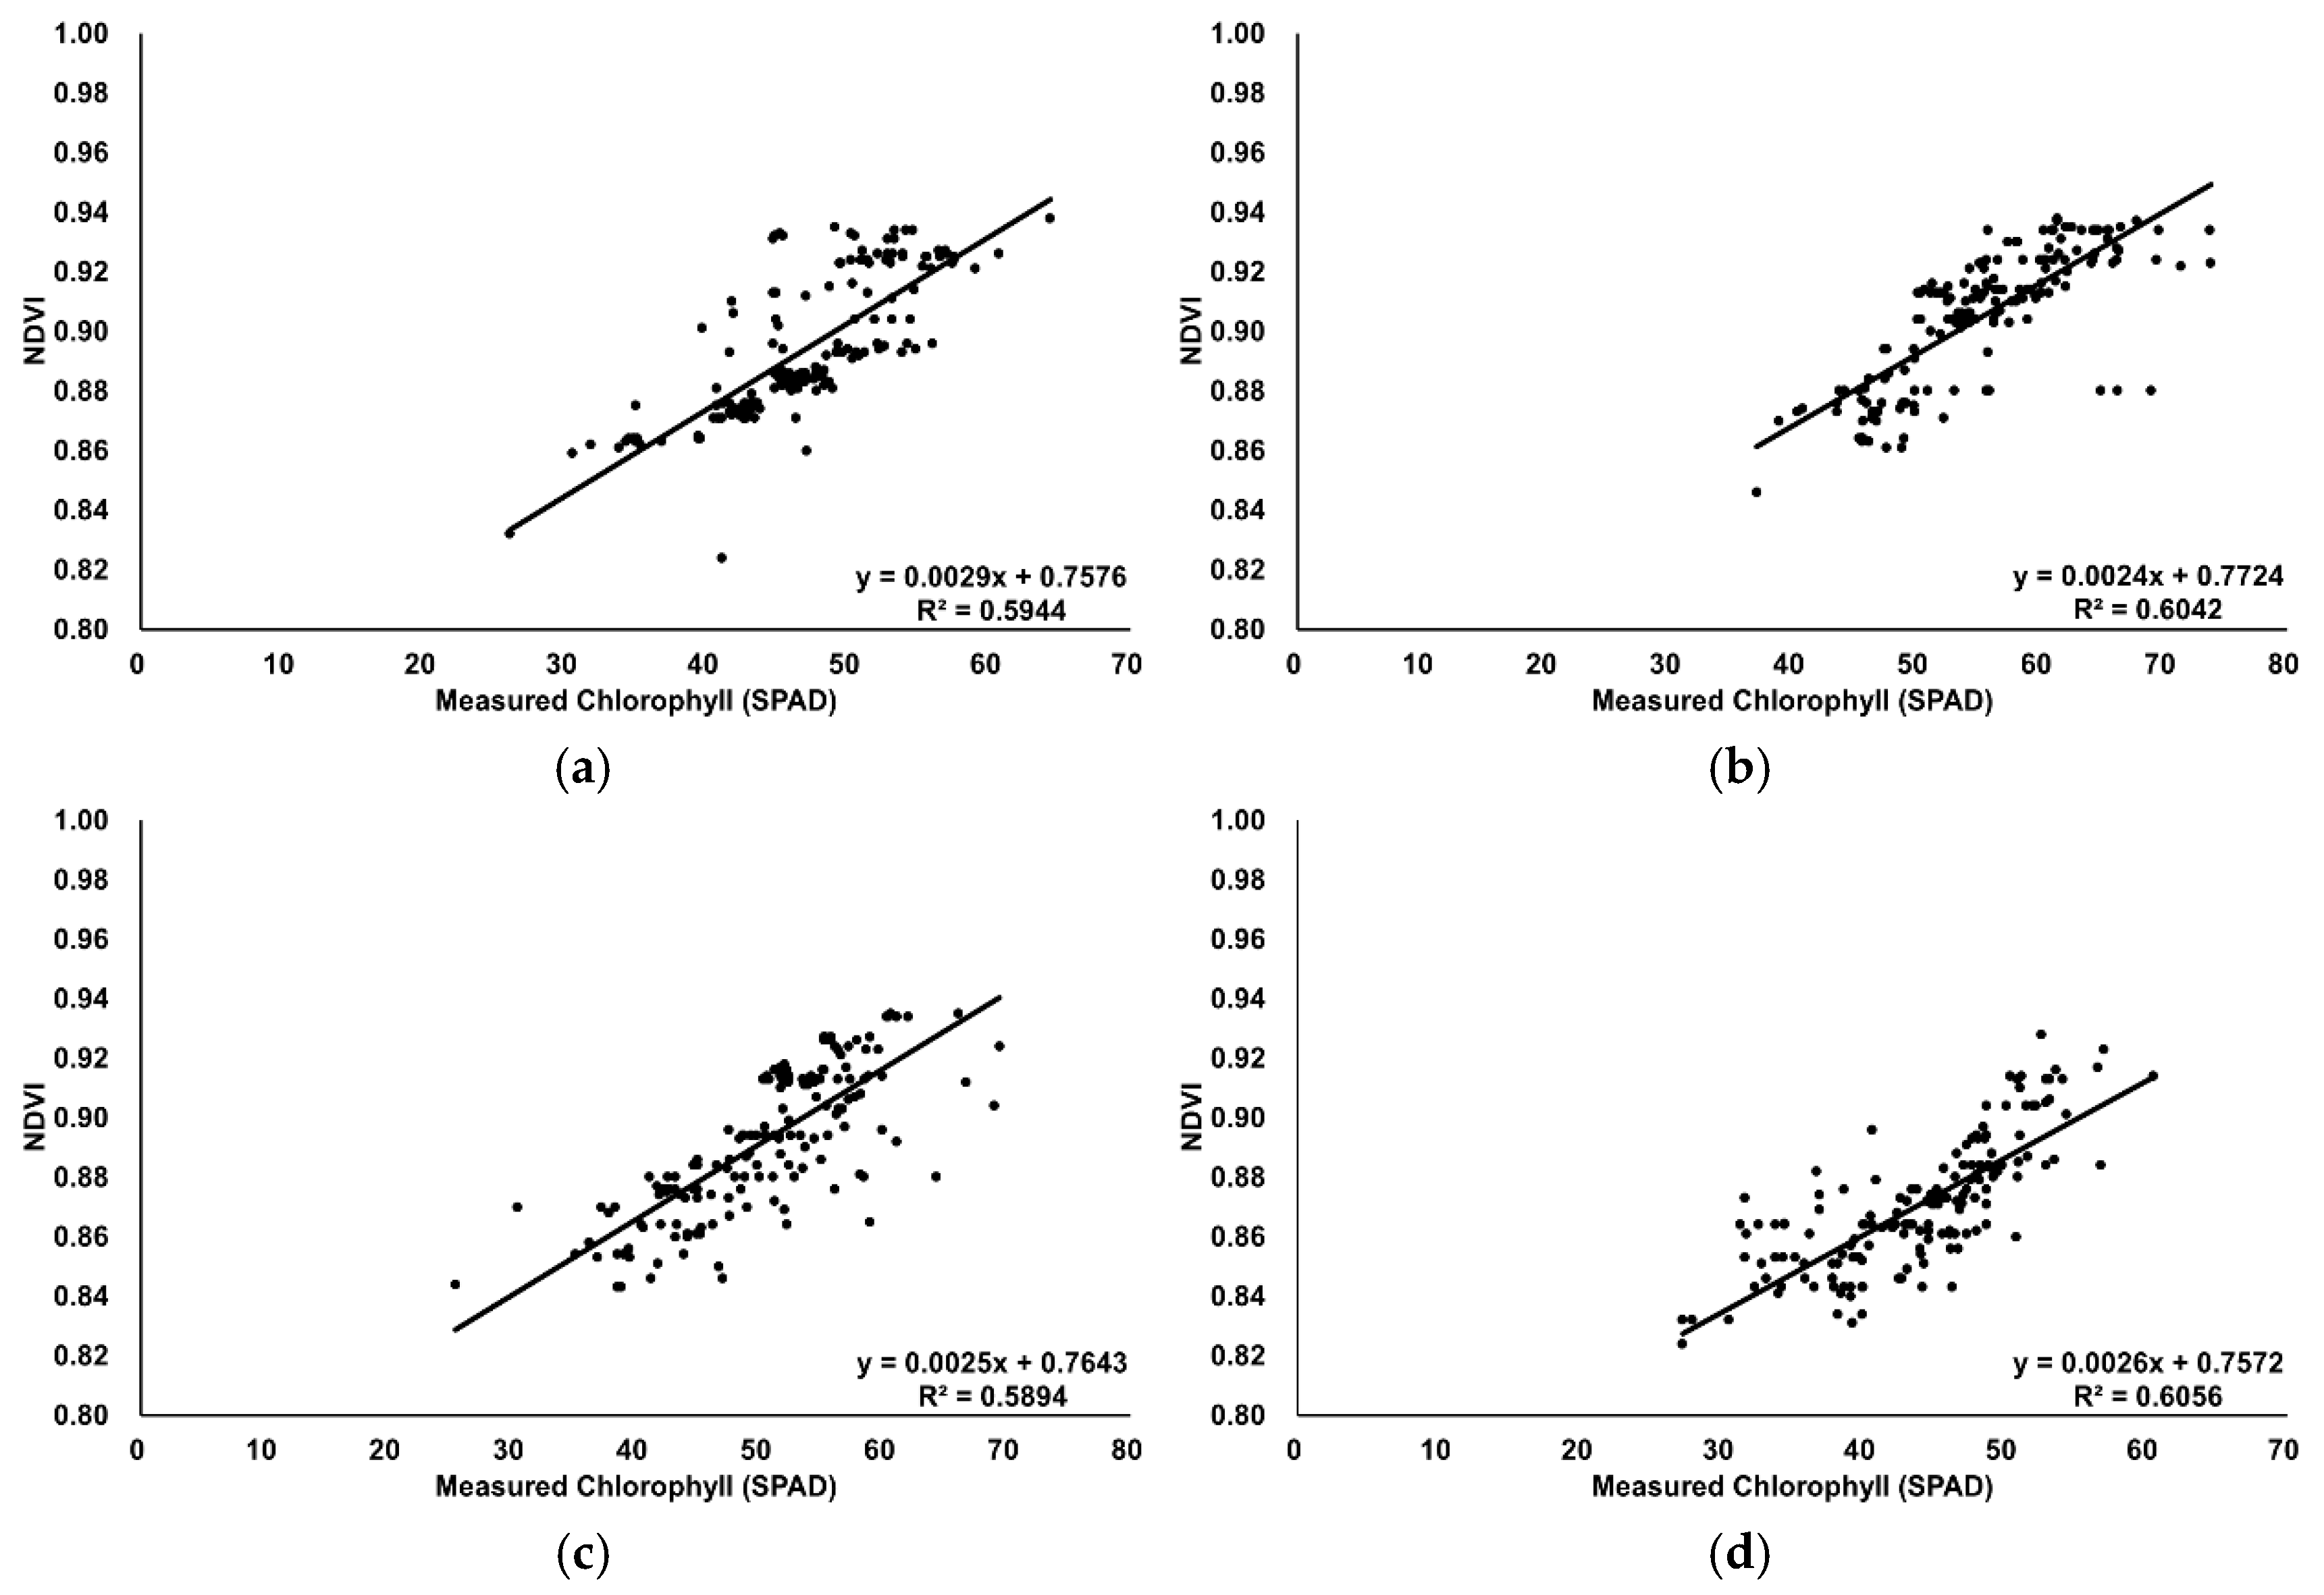
The measured chlorophyll values were confirmed to follow a normal distribution. Vegetation index values increased proportionally with the actual chlorophyll measurements (
Figure 7 and
Figure 8), indicating a positive correlation. Thus, a correlation analysis was performed (
Table 8).
Next, bivariate correlation analyses were performed between each vegetation index value and the actual chlorophyll measurements. The results showed strong correlations at a significance level below 0.01, with the monthly analysis also revealing consistent trends. Similarly, the monthly correlation coefficients between NDVI and CCCI were high for each vegetation index map: 0.632 in June, 0.724 in July, 0.678 in August, and 0.691 in October—all significant at
p < 0.01. Mitra et al. [
19], Ali et al. [
20] and Miller et al. [
21] reported that the NDVI model is effective for predicting nitrogen content. Rodriguez et al. [
22] developed indexes sensitive to chlorophyll content, such as NDRE, based on the close relationship between chlorophyll pigments, light absorption, and photosynthetic efficiency. A stronger correlation was obtained using the CCCI map, which incorporates NDRE, than with NDVI alone. Performance benchmarking reveals significant advantages of our hardy kiwi-specific approach. Fitzgerald et al. [
23] reported CCCI–nitrogen correlations of approximately 0.6 for broadleaf crops, while our hardy kiwi study achieved substantially higher correlations (r = 0.847–0.936). This 40–56% improvement in correlation strength can be attributed to hardy kiwi’s unique leaf architecture and chlorophyll distribution patterns, which appear more responsive to multispectral analysis than traditionally studied crops. According to Netto et al. [
24], the chlorophyll content measured using the SPAD-502 m shows a correlation of approximately 0.7 with actual nitrogen levels. Further studies are necessary to directly compare nitrogen concentrations with vegetation index maps.
Subsequently, a one-way ANOVA was performed to examine regional differences. Although the chlorophyll content followed a normal distribution (
Table 7), it did not meet the assumption of homogeneity of variance. Thus, these data were analyzed using Welch’s test. The results showed significant differences in chlorophyll content (Welch statistic = 46.462,
p < 0.001) (
Table 9). Post hoc analysis was performed using the Games–Howell method, which is appropriate when equal variances cannot be assumed. Overall, the Muju region showed the lowest average chlorophyll measurement, whereas Gwangyang, Wonju, and Suwon had similar levels, and Yeongwol had the highest.
For NDVI and CCCI, which did not follow a normal distribution (
Table 7), the nonparametric Kruskal–Wallis test was conducted. The results revealed significant differences for NDVI (χ
2 = 75.887,
p < 0.001) and CCCI (χ
2 = 74.507,
p < 0.001) (
Table 10). Post hoc analysis of regional differences was performed using the Mann–Whitney
U tests. The Muju region had the lowest average index values across all vegetation index models, while the Gwangyang, Wonju, Yeongwol, and Suwon regions exhibited similar patterns, with Yeongwol showing slightly higher values.
The multi-regional validation approach addresses a critical limitation in the existing UAV-based crop monitoring literature, where most studies focus on single-location assessments. Regional performance variations (R2 = 0.77–0.89) reflect hardy kiwi’s sensitivity to local environmental conditions—soil fertility, moisture regimes, and microclimatic factors—characteristics not adequately addressed in previous fruit crop monitoring studies. This regional specificity analysis provides practical insights for scaling UAV-based nitrogen monitoring systems across diverse hardy kiwi production areas, establishing location-specific calibration protocols essential for commercial adoption.
3.4. Chlorophyll Estimation Model for Hardy Kiwi Plantations Using Multispectral Images
Overall, analysis of the relationship between vegetation index values from previously generated maps and the actual chlorophyll measurements revealed strong correlations. The CCCI model, which showed the highest correlation with measured chlorophyll content, was selected to develop and validate a chlorophyll estimation model.
Before developing the prediction models, it is important to acknowledge potential limitations of UAV-based data collection that may affect index accuracy. Environmental factors such as wind conditions during flight can introduce motion blur and geometric distortions in imagery. Additionally, canopy occlusion in dense vegetation areas may result in incomplete spectral information, while GPS positioning errors could affect the spatial accuracy of measurements and complicate the matching between UAV-derived indices and ground-truth samples.
The mean values and their 95% confidence intervals were calculated under the assumption of normality. Normality was assessed using Q-Q plots and the Shapiro–Wilk test. In cases where the normality assumption was not met, data transformations such as log transformation were applied to correct deviations from normality, and subsequent Q-Q plots confirmed that the transformed data satisfied the normality assumption.
First, a regression equation for Prediction Model A was developed using CCCI values and actual chlorophyll measurements from June, July, and August. The CCCI values from October were then entered into this equation, and the predicted chlorophyll values were compared with the actual measurements to determine correlation. Similarly, Prediction Models B (June, July, and October), C (June, August, and October), and D (July, August, and October) were validated by entering the respective month’s data into each regression equation (
Table 11).
As a result, Model A showed a coefficient of determination of 0.81 and an RMSE of 3.41. Models B, C, and D showed R2 values of 0.87, 0.88, and 0.72, with corresponding RMSE values of 3.02, 2.78, and 3.33, respectively. Model C demonstrated the highest correlation, whereas Model D showed the lowest. Nevertheless, Model D’s correlation of 0.72 indicates that monthly chlorophyll estimation of hardy kiwi plantations using vegetation index maps is feasible with at least 70% accuracy. Correlation analysis was also performed between the actual chlorophyll measurements and the predicted values.
In general, the results of correlation analysis showed strong relationships between variables (see Model A at 0.899, Model B at 0.930, Model C at 0.936, and Model D at 0.847, all significant at the
p < 0.01 level;
Table 12). In addition to the monthly chlorophyll estimation models, we developed regional chlorophyll estimation models, validated their performance, and assessed their significance levels via correlation analysis (
Table 13 and
Table 14).
When chlorophyll estimation models were developed for each region using the CCCI vegetation index map, their predictive performance was evaluated. Model E showed an R2 value of 0.84 and an RMSE of 2.47. The R2 values for Models F, G, H, and I were 0.87, 0.88, 0.77, and 0.89, respectively, with corresponding RMSE values of 3.87, 2.62, 3.07, and 3.47. All regression equations were significant at the p < 0.01 level, indicating that the chlorophyll estimation models based on the vegetation index were valid.
Comparative performance analysis demonstrates the superiority of our hardy kiwi-specific modeling approach. While Gitelson et al. [
25] achieved high R
2 values (0.94) for other crop species, their standard errors (4.26–4.06 μg/cm
2) exceeded our performance metrics. More significantly, Croft et al. [
26]’s satellite-based models, despite reasonable correlations (~0.75), exhibited RMSE values of 7.05–13.40—more than double our average RMSE of 3.1. This superior precision reflects the advantages of UAV-based multispectral monitoring specifically calibrated for hardy kiwi physiological characteristics, contrasting with generic satellite approaches designed for broader crop categories.
Finally, we analyzed the correlations among actual leaf nitrogen content, chlorophyll meter readings, and CCCI values derived from multispectral imagery. To this end, twelve leaves were randomly sampled during a visit to the Hardy kiwifruit farm in Suwon in October, following the same sampling protocol, measurement procedures, and CCCI calculation methods as described previously. The actual nitrogen content of each leaf was determined through laboratory analysis at the Cooperative Laboratory of Gyeongsang National University.
The correlation coefficient between actual nitrogen content and the values measured with the portable chlorophyll meter was 0.72 (
Figure 9), consistent with the findings of Netto et al. [
24]. The correlation coefficient of 0.66 between actual nitrogen content and CCCI values obtained from the multispectral camera indicates a moderately strong positive relationship, suggesting that CCCI can be a useful proxy for assessing crop nitrogen status (
Figure 10). However, it is important to recognize that CCCI alone may not reliably represent nitrogen content across all environmental and growth conditions due to potential variability caused by factors such as canopy structure, light conditions, and developmental stages. Therefore, CCCI should be interpreted with caution and supplemented by additional vegetation indices or integrated into multivariate machine learning models that combine spectral, phenotypic, and environmental data to improve estimation accuracy. Further validation across diverse crop types, growing regions, and seasons, along with periodic calibration using direct field measurements, is essential to enhance the robustness and generalizability of UAV-based nitrogen monitoring systems. In practical applications, UAV-derived CCCI offers an efficient and non-destructive tool for large-scale, real-time monitoring of crop nutritional status, but should be used as a complementary approach alongside traditional measurement methods when precise nitrogen management decisions are required. This integrated strategy will ensure more reliable nitrogen diagnostics and sustainable crop management.
Although the SPAD-502 m has an inherent error margin of ±0.3 SPAD units, our findings indicate that further improvements in chlorophyll estimation models are possible. For instance, improving the accuracy of parameters such as the distance between the multispectral camera and the canopy, or enhancing the precision of leaf localization, could further refine model performance.
In this study, the regional models exhibited a wide range of determination coefficients (R
2 values from 0.72 to 0.89), which are closely associated with the distinct environmental characteristics of each region. The hardy kiwi plantations were located in areas with diverse soil types, climatic conditions, and cultivation practices, all of which serve as major factors influencing the linear relationship between vegetation indices and actual chlorophyll content. For example, differences in soil fertility or moisture content between regions can cause variations in the actual chlorophyll concentration, i.e., the nutritional status of the crop, even at identical vegetation index values. Additionally, meteorological variables such as precipitation, mean temperature, and solar radiation can induce differences in crop growth and stress levels, leading to variations in model explanatory power. This variability has been consistently referenced in previous studies; indeed, Kong et al. [
27] reported that not only environmental stresses but also structural characteristics and planting density of vegetation significantly affect the accuracy of chlorophyll estimation through remote sensing.
Among the vegetation indices, NDVI is the most widely used for diagnosing crop vitality, chlorophyll content, and leaf area index (LAI). However, NDVI is prone to saturation in dense canopies or when chlorophyll content exceeds a certain threshold, thereby limiting its sensitivity to subtle variations. As an alternative, the canopy chlorophyll content index (CCCI), which incorporates red-edge bands, partially overcomes the saturation issue. In the present study, CCCI consistently exhibited notably higher correlation coefficients with actual chlorophyll content than NDVI. CCCI is particularly useful for estimating not only chlorophyll but also in-field nitrogen content, as the red and red-edge spectral regions are highly sensitive to variations in leaf chlorophyll and nitrogen. Accordingly, the use of CCCI facilitates the real-time diagnosis of crop nutritional status—particularly nitrogen availability—enabling more precise fertilizer management and reinforcing the applicability of precision agriculture. Nevertheless, CCCI may experience saturation effects in extremely dense canopies where high biomass levels can limit the sensitivity of spectral indices to further increases in chlorophyll content. Future studies should consider integrating alternative vegetation indices such as the red-edge normalized difference vegetation index (NDRE), photochemical reflectance index (PRI), or enhanced vegetation index (EVI) to overcome potential saturation limitations and improve estimation accuracy under varying canopy conditions.
Recently, bi-angular observation-based vegetation indices (BCVI) have been proposed. Kong et al. [
27] demonstrated that, in wheat crops, combining vegetation indices derived from two different viewing angles (e.g., +30° and −20°) can improve the R
2 value for chlorophyll estimation by 25–51% compared to conventional mono-angular approaches. BCVI accounts for the three-dimensional structure of the canopy and shaded areas, thereby minimizing the saturation effect in dense crops. These advances suggest that BCVI is a promising new approach for large-scale agricultural monitoring. In future studies, further research and evaluation should be conducted based on the methodologies and findings presented in this study to enhance the accuracy of nitrogen monitoring.
Several methodological considerations warrant acknowledgment for future research development. All models were developed and validated using the same dataset, limiting assessment of generalizability across different growing seasons and climatic conditions. Environmental factors during UAV data collection—including wind-induced motion blur, canopy occlusion in dense vegetation areas, and GPS positioning errors—can affect measurement accuracy and require standardized protocols for operational deployment. Additionally, CCCI may experience saturation effects in extremely dense canopies, necessitating integration of alternative vegetation indices (NDRE, PRI, and EVI) for comprehensive nitrogen assessment under varying canopy conditions. Future validation across independent datasets from different geographic regions and growing seasons will be essential to confirm the broader applicability of these hardy kiwi-specific monitoring protocols.
This study establishes the first comprehensive framework for UAV-based nitrogen monitoring specifically developed for hardy kiwi cultivation, addressing a critical knowledge gap in high-value fruit crop management. The cost-effective multispectral approach enables real-time, large-scale monitoring at significantly lower operational costs than traditional soil and tissue sampling methods, making precision agriculture accessible to small-scale hardy kiwi producers. The identified seasonal monitoring protocols—particularly the July optimization window—provide actionable insights for fertilizer timing and dosage adjustments, supporting both economic efficiency and environmental sustainability in hardy kiwi production systems. Future integration of these monitoring protocols with automated fertilizer application systems could revolutionize nutrient management in high-value fruit crop production, establishing hardy kiwi as a model for precision agriculture adoption in specialty crop sectors.
