Article

Monitoring Fertilizer Effects in Hardy Kiwi Using UAV-Based Multispectral Chlorophyll Estimation

1
Department of Convergence Biosystems Engineering, Sunchon National University, Suncheon 57922, Republic of Korea
2
Department of Animal Science and Technology, Sunchon National University, Suncheon 57922, Republic of Korea
3
Department of Multimedia Engineering, Sunchon National University, Suncheon 57922, Republic of Korea
*
Author to whom correspondence should be addressed.
These authors contributed equally to this work.
Agriculture 2025, 15(16), 1794; https://doi.org/10.3390/agriculture15161794 (registering DOI)
Submission received: 30 June 2025 / Revised: 16 August 2025 / Accepted: 20 August 2025 / Published: 21 August 2025
(This article belongs to the Section Artificial Intelligence and Digital Agriculture)

Abstract

This study addresses the need for efficient and non-destructive monitoring of the nutrient status of hardy kiwi (Actinidia arguta), a plantation crop native to East Asia. Traditional nutrient monitoring methods are labor-intensive and often destructive, limiting their practicality in precision agriculture. To overcome these challenges, we deployed a rotary-wing unmanned aerial vehicle (UAV) equipped with a multispectral camera to capture monthly images of 10 hardy kiwi orchards in South Korea from June to October 2019. We extracted spectral bands (i.e., red, red-edge, green, and near-infrared) to generate normalized difference vegetation index and canopy chlorophyll content index maps, which were correlated with in situ chlorophyll measurements using a chlorophyll meter. Strong positive correlations were observed between vegetation indexes and actual chlorophyll content, with canopy chlorophyll content index achieving the highest predictive accuracy (average correlation coefficient > 0.84). Regression models based on multispectral data enabled reliable estimation of leaf chlorophyll across months and regions, with an average RMSE of 3.1. Our results confirmed that UAV-based multispectral imaging is an effective, scalable approach for real-time monitoring of nutrient status, supporting timely, site-specific fertilizer management. This method has the potential to enhance fertilizer efficiency, reduce environmental impact, and improve the quality of hardy kiwi cultivations.

1. Introduction

Hardy kiwi (Actinidia arguta) is an economically important perennial fruit crop native to East Asia, including South Korea, and it has gained increasing commercial attention owing to its appealing flavor and nutritional attributes. While this species is characterized by its strong resistance to cold and disease, optimal crop management—particularly with regard to nutrient supply—remains essential for maximizing growth and yield. However, despite its rising cultivation and value, research focused on efficient and objective monitoring of hardy kiwi’s physiological and nutritional status remains lacking, particularly in relation to real-time, non-destructive techniques suited to commercial production.
Nitrogen plays a fundamental role among plant nutrients, directly influencing photosynthetic capacity, shoot development, and fruit quality. Both insufficient and excessive nitrogen supply can negatively impact growth, disease resistance, and fruit composition [1]. Therefore, accurate monitoring of plant nitrogen status is key to precision fertilization and sustainable orchard management. Traditionally, nitrate–nitrogen analysis in plant tissues has relied on destructive collection methods, which are labor-intensive and limit both the frequency and spatial coverage of assessments [2]. While chlorophyll content, which closely reflects foliar nitrogen status, can be measured by handheld meters as a non-destructive proxy, such methods still require manual sampling, and their scalability for plantation-level applications is limited.
Recent advances in agricultural remote sensing, especially the deployment of unmanned aerial vehicles (UAVs) equipped with multispectral and hyperspectral sensors, present promising opportunities for high-throughput, non-destructive monitoring of crop nutrient status and canopy health. These imaging systems capture spectral information across different wavelength bands, including the visible and near-infrared (NIR) regions, yielding indices such as the normalized difference vegetation index (NDVI), normalized difference red-edge index (NDRE), and canopy chlorophyll content index (CCCI). These indices have been widely used to assess biomass, chlorophyll content, and nitrogen status in major row crops such as rice, maize, wheat, and cotton [3,4,5,6]. However, studies applying UAV-based spectral monitoring to perennial fruit crops, including hardy kiwi, remain rare, and few have validated the potential for integrating spectral indices with ground-truth measurements in these systems.
Multispectral imaging has particular advantages for practical deployment in Korean orchards, where farm sizes tend to be small and management is intensive; it offers a rapid, cost-effective alternative to hyperspectral methods while maintaining adequate precision for nutrient diagnostics. Despite growing interest in smart farming and precision agriculture, the adoption of such remote sensing solutions in hardy kiwi production is still in its infancy, and research is needed to evaluate their effectiveness and potential for routine crop management [7].
Recent research on nitrogen monitoring using drones (UAVs) and remote sensing has primarily focused on large-scale cereal crops such as wheat and rice. However, there has been little investigation into customized UAV-based nitrogen diagnosis for high-value fruit crops with unique growth environments and canopy characteristics, such as hardy kiwi. Hardy kiwi is gaining attention as a next-generation crop due to its high content of vitamins and antioxidants, as well as its excellent cold tolerance. Despite this, there is a lack of fundamental data on cultivar-specific physiological traits and compositional changes across developmental stages, highlighting the need for tailored growth diagnostics and advanced nitrogen management strategies. Therefore, this study aims to evaluate the feasibility and applicability of UAV-based nitrogen assessment methods that incorporate the physiological characteristics of hardy kiwi [8,9,10].
Accordingly, this study investigated the feasibility of using UAV-mounted multispectral cameras for the non-destructive, spatially explicit monitoring of chlorophyll and nitrogen status in hardy kiwi plantations. Monthly aerial imagery was acquired, and key spectral bands (red, red-edge, green, and NIR) were extracted to generate NDVI and CCCI maps. These remote sensing indices were validated against direct measurements of leaf chlorophyll content, enabling the development and evaluation of estimation models for both chlorophyll and nitrogen status. This work aims to provide a foundation for objective, efficient, and scalable crop nutrition monitoring in hardy kiwi, addressing an important research gap in both the literature and commercial practice.

2. Materials and Methods

2.1. Study Sites

We selected 10 sites across South Korea to monitor crop growth and estimate nitrogen fertilization in hardy kiwi plantations. The sites included Bujeo-ri, Bonggang-myeon, Gwangyang-si, Jeollanam-do (G); Goemok-ri, Jeoksang-myeon, Muju-gun, Jeollabuk-do (M1); Cheongnyang-ri, Seolcheon-myeon, Muju-gun, Jeollabuk-do (M2); Dangsan-ri, Muju-eup, Muju-gun, Jeollabuk-do (M3); Chilbong-ro, Hojeo-myeon, Wonju-si, Gangwon-do (W1); Heungyang-ri, Socho-myeon, Wonju-si, Gangwon-do (W2); Un’gye-ri, Gwirae-myeon, Wonju-si, Gangwon-do (W3); Yeonsang-ri, Jungdong-myeon, Yeongwol-gun, Gangwon-do (Y); Onjeong-ro, Gwonseon-gu, Suwon-si, Gyeonggi-do (S1); and Eocheon-ri, Maesong-myeon, Suwon-si, Gyeonggi-do (S2).
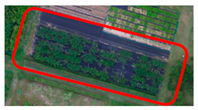
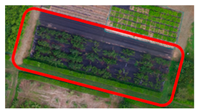
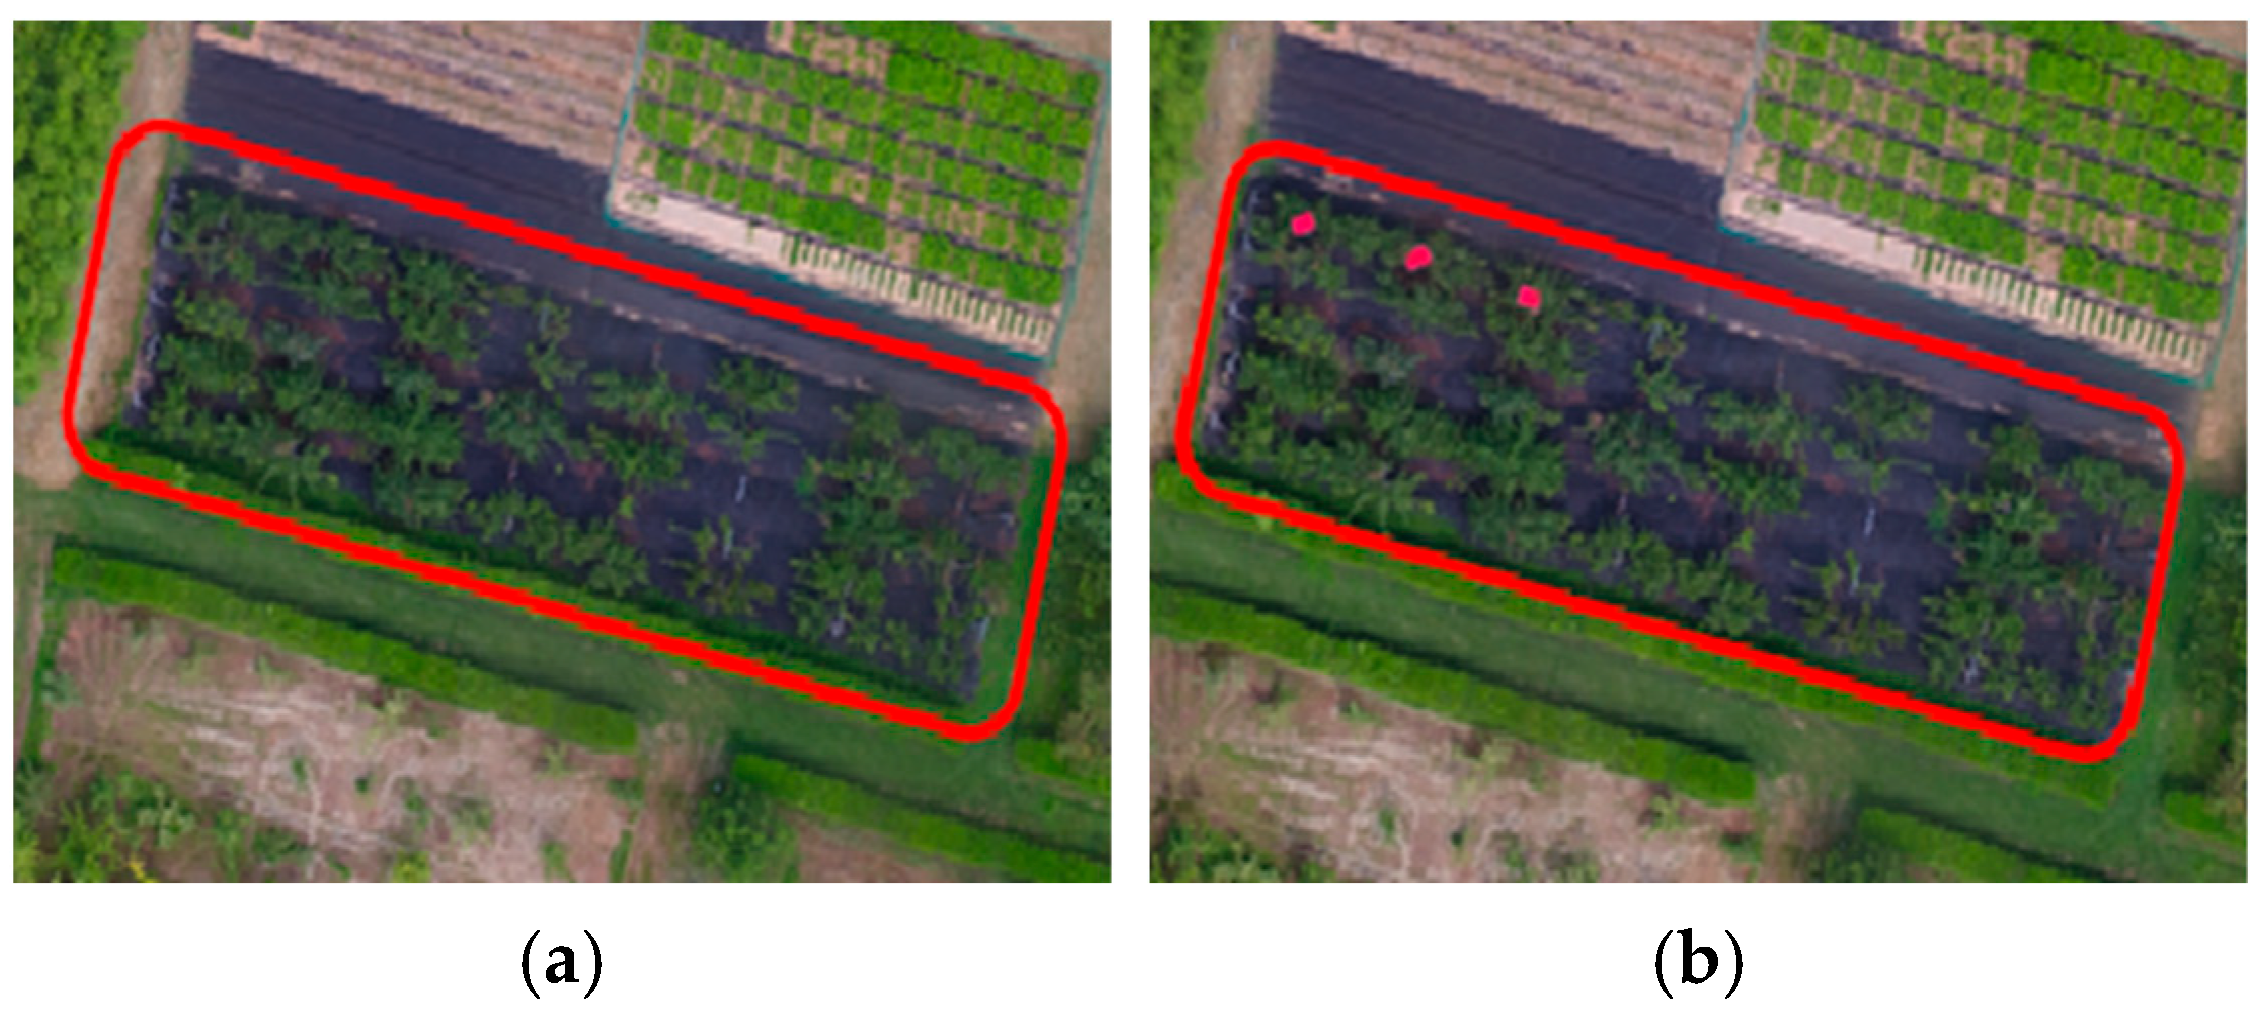
To obtain multispectral images, each plantation was photographed monthly from June to October 2019, except in September, when typhoons and strong winds prevented imaging. For chlorophyll content analysis, three trees were selected from each plantation. A red panel was affixed to the top of each tree trunk, and two images were taken per month—once with the panel attached and once after removal. The purpose of the red panel was to acquire GPS data for that specific location. Subsequently, these data were used to identify and correct the exact position of the target tree within the vegetation index map generated from the multispectral images (Figure 1).

2.2. Multispectral Imaging System

In this study, a Parrot Sequoia multispectral camera (Parrot Inc., Paris, France) was employed for remote sensing-based crop growth assessment. This device captures images across four primary spectral bands: green (550 ± 40 nm), red (660 ± 40 nm), red-edge (735 ± 10 nm), and near-infrared (790 ± 40 nm), resulting in a significantly lower data volume compared to hyperspectral cameras, thus enhancing efficiency in field data processing and storage.
The multispectral camera is compact and lightweight (dimensions: 59 × 41 × 28 mm; weight: 72 g), facilitating easy integration and operation on drone platforms (Table 1). In contrast, hyperspectral cameras acquire data across dozens to hundreds of narrow spectral bands, producing large volumes of high-precision data that demand high-performance computing resources and complex post-processing. Moreover, hyperspectral systems entail substantially higher equipment and maintenance costs, posing economic challenges for experiments on small-scale farmland.
The study area consisted of domestic small-scale farmlands (less than 1 hectare) characterized by spatial constraints, the need for frequent monitoring, and limited budgets, all of which necessitate the practical applicability of multispectral systems. Therefore, the multispectral camera was selected due to its capability to efficiently acquire adequate spectral information for key vegetation indices, combined with cost-effectiveness and ease of operation.
In drone-based multispectral imaging, ensuring spatial accuracy and reliable radiometric information requires a systematic calibration process. This study employed a standardized calibration panel (MicaSense, Seattle, WA, USA) for calibration. The calibration panel, which has certified reflectance properties for white, gray, and black surfaces, was used to perform both geometric and radiometric calibration according to the recommended guidelines.
For geometric calibration, images of the calibration panel were captured from multiple angles before and after drone flights using the multispectral camera. From these images, lens distortion parameters, intrinsic camera matrices, and principal point coordinates were estimated separately for each spectral band. This step effectively corrected spatial inaccuracies caused by drone vibrations, lens distortions, and sensor assembly misalignments, resulting in precise spatial alignment between ground coordinates and image pixel coordinates.
For radiometric and illumination calibration, the calibration panel was positioned on-site under controlled conditions, and images were captured before takeoff and after landing. The measured pixel values from these images were compared against the panel’s certified reflectance reference values for each spectral band to derive band-specific calibration coefficients [11]. These coefficients were then applied to the entire dataset, normalizing reflectance values and minimizing variations caused by differing lighting conditions. This was particularly important to mitigate the effects of canopy shading and subtle environmental illumination changes, ensuring consistent data normalization across capture sessions.
Complementing panel-based calibration, a Parrot Sequoia sunshine sensor synchronized with the drone system recorded real-time solar irradiance, spectral characteristics, and environmental lighting changes—including cloud cover and solar angle—at one-second intervals throughout the flight. This irradiance data was integrated with the metadata of each captured image to dynamically adjust radiometric calibration on a per-frame basis. This dynamic calibration minimized the influence of sudden changes in solar irradiance, such as cloud movement and transient shadows, significantly improving radiometric correction accuracy [12].
The multispectral camera and sensor were mounted on the upper and lower parts of a Phantom 4 UAV (DJI, Shenzhen, China) (Figure 2). The system was connected to a smartphone via Wi-Fi, enabling users to calibrate the camera, toggle image capture ON/OFF, and review the collected images after flight using a dedicated application.

2.3. Multispectral Image Acquisition and Processing

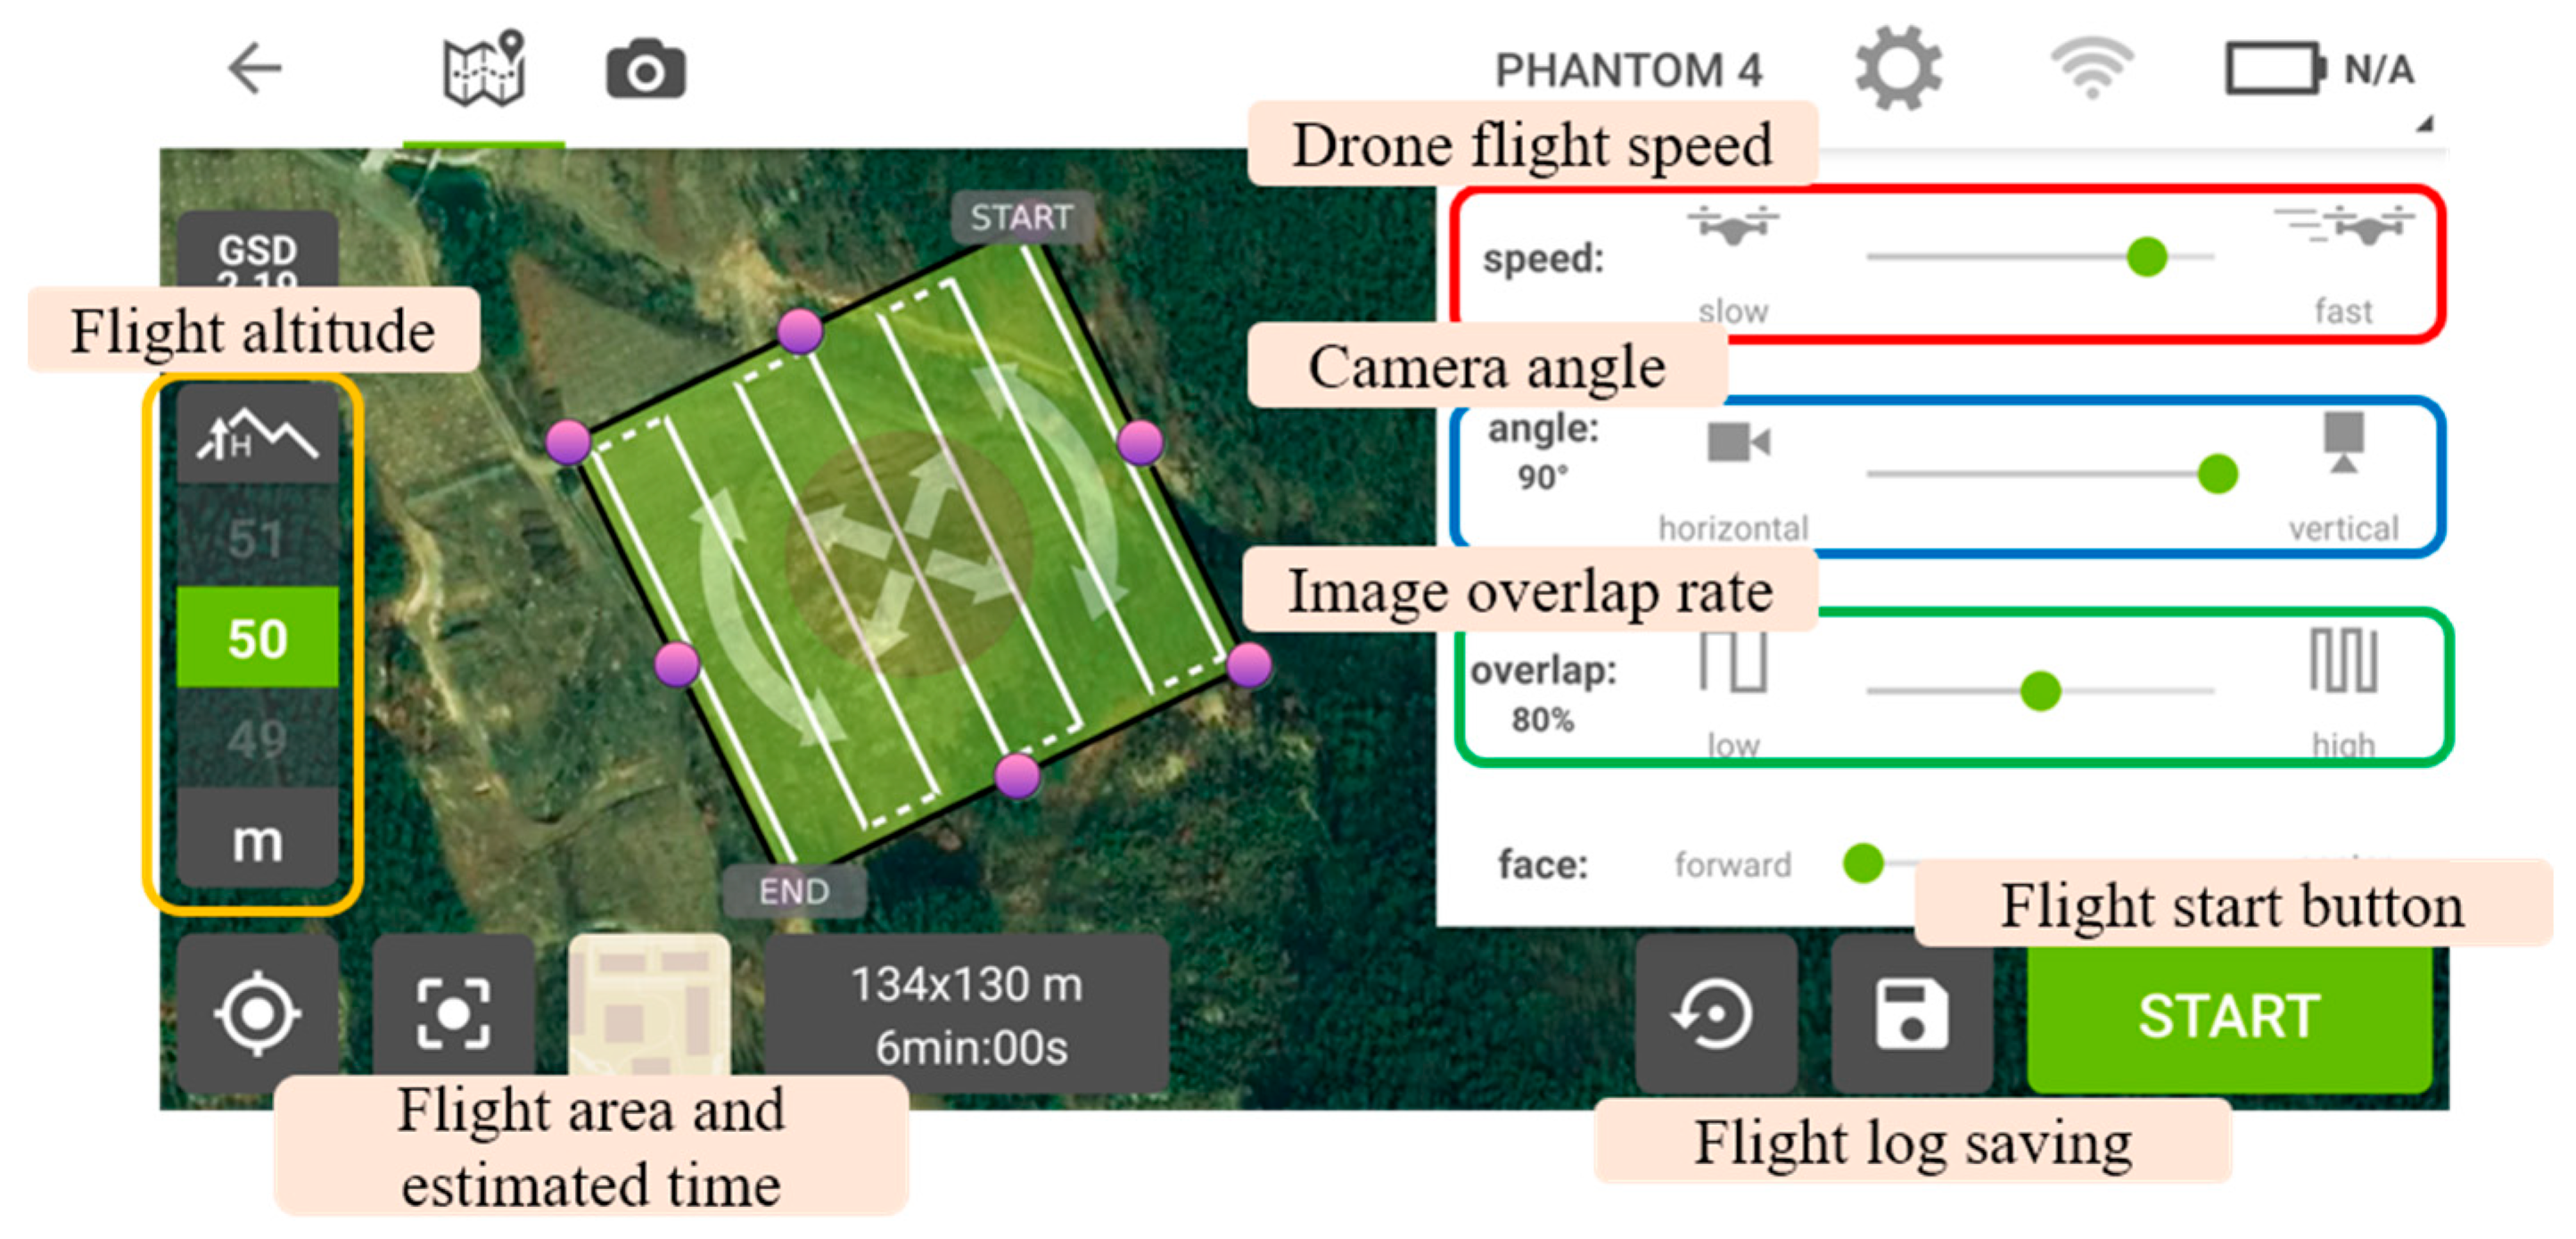
We used Pix4Dmapper and Pix4Dcapture (Pix4D S.A., Prilly, Switzerland) for user convenience and accurate analyses. The hardy kiwi plantations are located in mountainous terrain; therefore, aerial imaging was conducted at an altitude of 50 m, with the overlap between images set to 80% (Figure 3). The collected images were merged using Pix4Dmapper (Pix4D S.A., Prilly, Switzerland)., and vegetation index maps were generated by combining the spectral bands to predict chlorophyll and nitrogen content in the hardy kiwi plantations (Figure 4).
Vegetation indexes are indicators that reflect plant vitality and growth conditions. Their development is based on the principle that chlorophyll, which drives photosynthesis, absorbs strongly in the blue and red regions of visible light, while exhibiting lower absorption in the green, red-edge, and NIR regions. In general, vigorously growing green vegetation reflects 40–50% of incident NIR light, whereas chlorophyll absorbs 80–90% of visible light. In contrast, vegetation with reduced vitality or senescence reflects 20–30% of visible light—higher than healthy vegetation—while reflecting relatively less NIR light [13]. Vegetation indexes calculated from the relationship between reflectance in the visible and NIR regions yield unitless radiometric values that convey information on parameters such as relative distribution, vitality, chlorophyll content, leaf area, and photosynthetic activity.
Among the various vegetation indexes, the most representative is the NDVI, originally proposed by Kriegler [14] and later used in studies by Rouse et al. [15] for the first time. NDVI is calculated as the difference between the NIR and red bands divided by their sum, and it is particularly effective for mapping vegetation distribution. In this study, NDVI and an additional vegetation index enabling quantitative estimation of total leaf chlorophyll were calculated using Pix4Dmapper software v.4.6.2 These values were subsequently used to analyze their correlation with actual chlorophyll content and to estimate nitrogen levels (Table 2). For each regional hardy kiwi plantation, five vegetation index values were extracted in each of the four cardinal directions, east, west, south, and north, relative to the center of a selected tree (marked by the GPS point on the red board). The average of these values was used in subsequent analyses.
To measure the actual chlorophyll content, five leaves were collected from the highest position in each of the east, west, south, and north directions relative to the center of the tree where the red board was placed. For each collected leaf, chlorophyll content was measured three times using the portable chlorophyll meter described in Table 3. The average of these three measurements was used as the representative chlorophyll content value for each leaf.
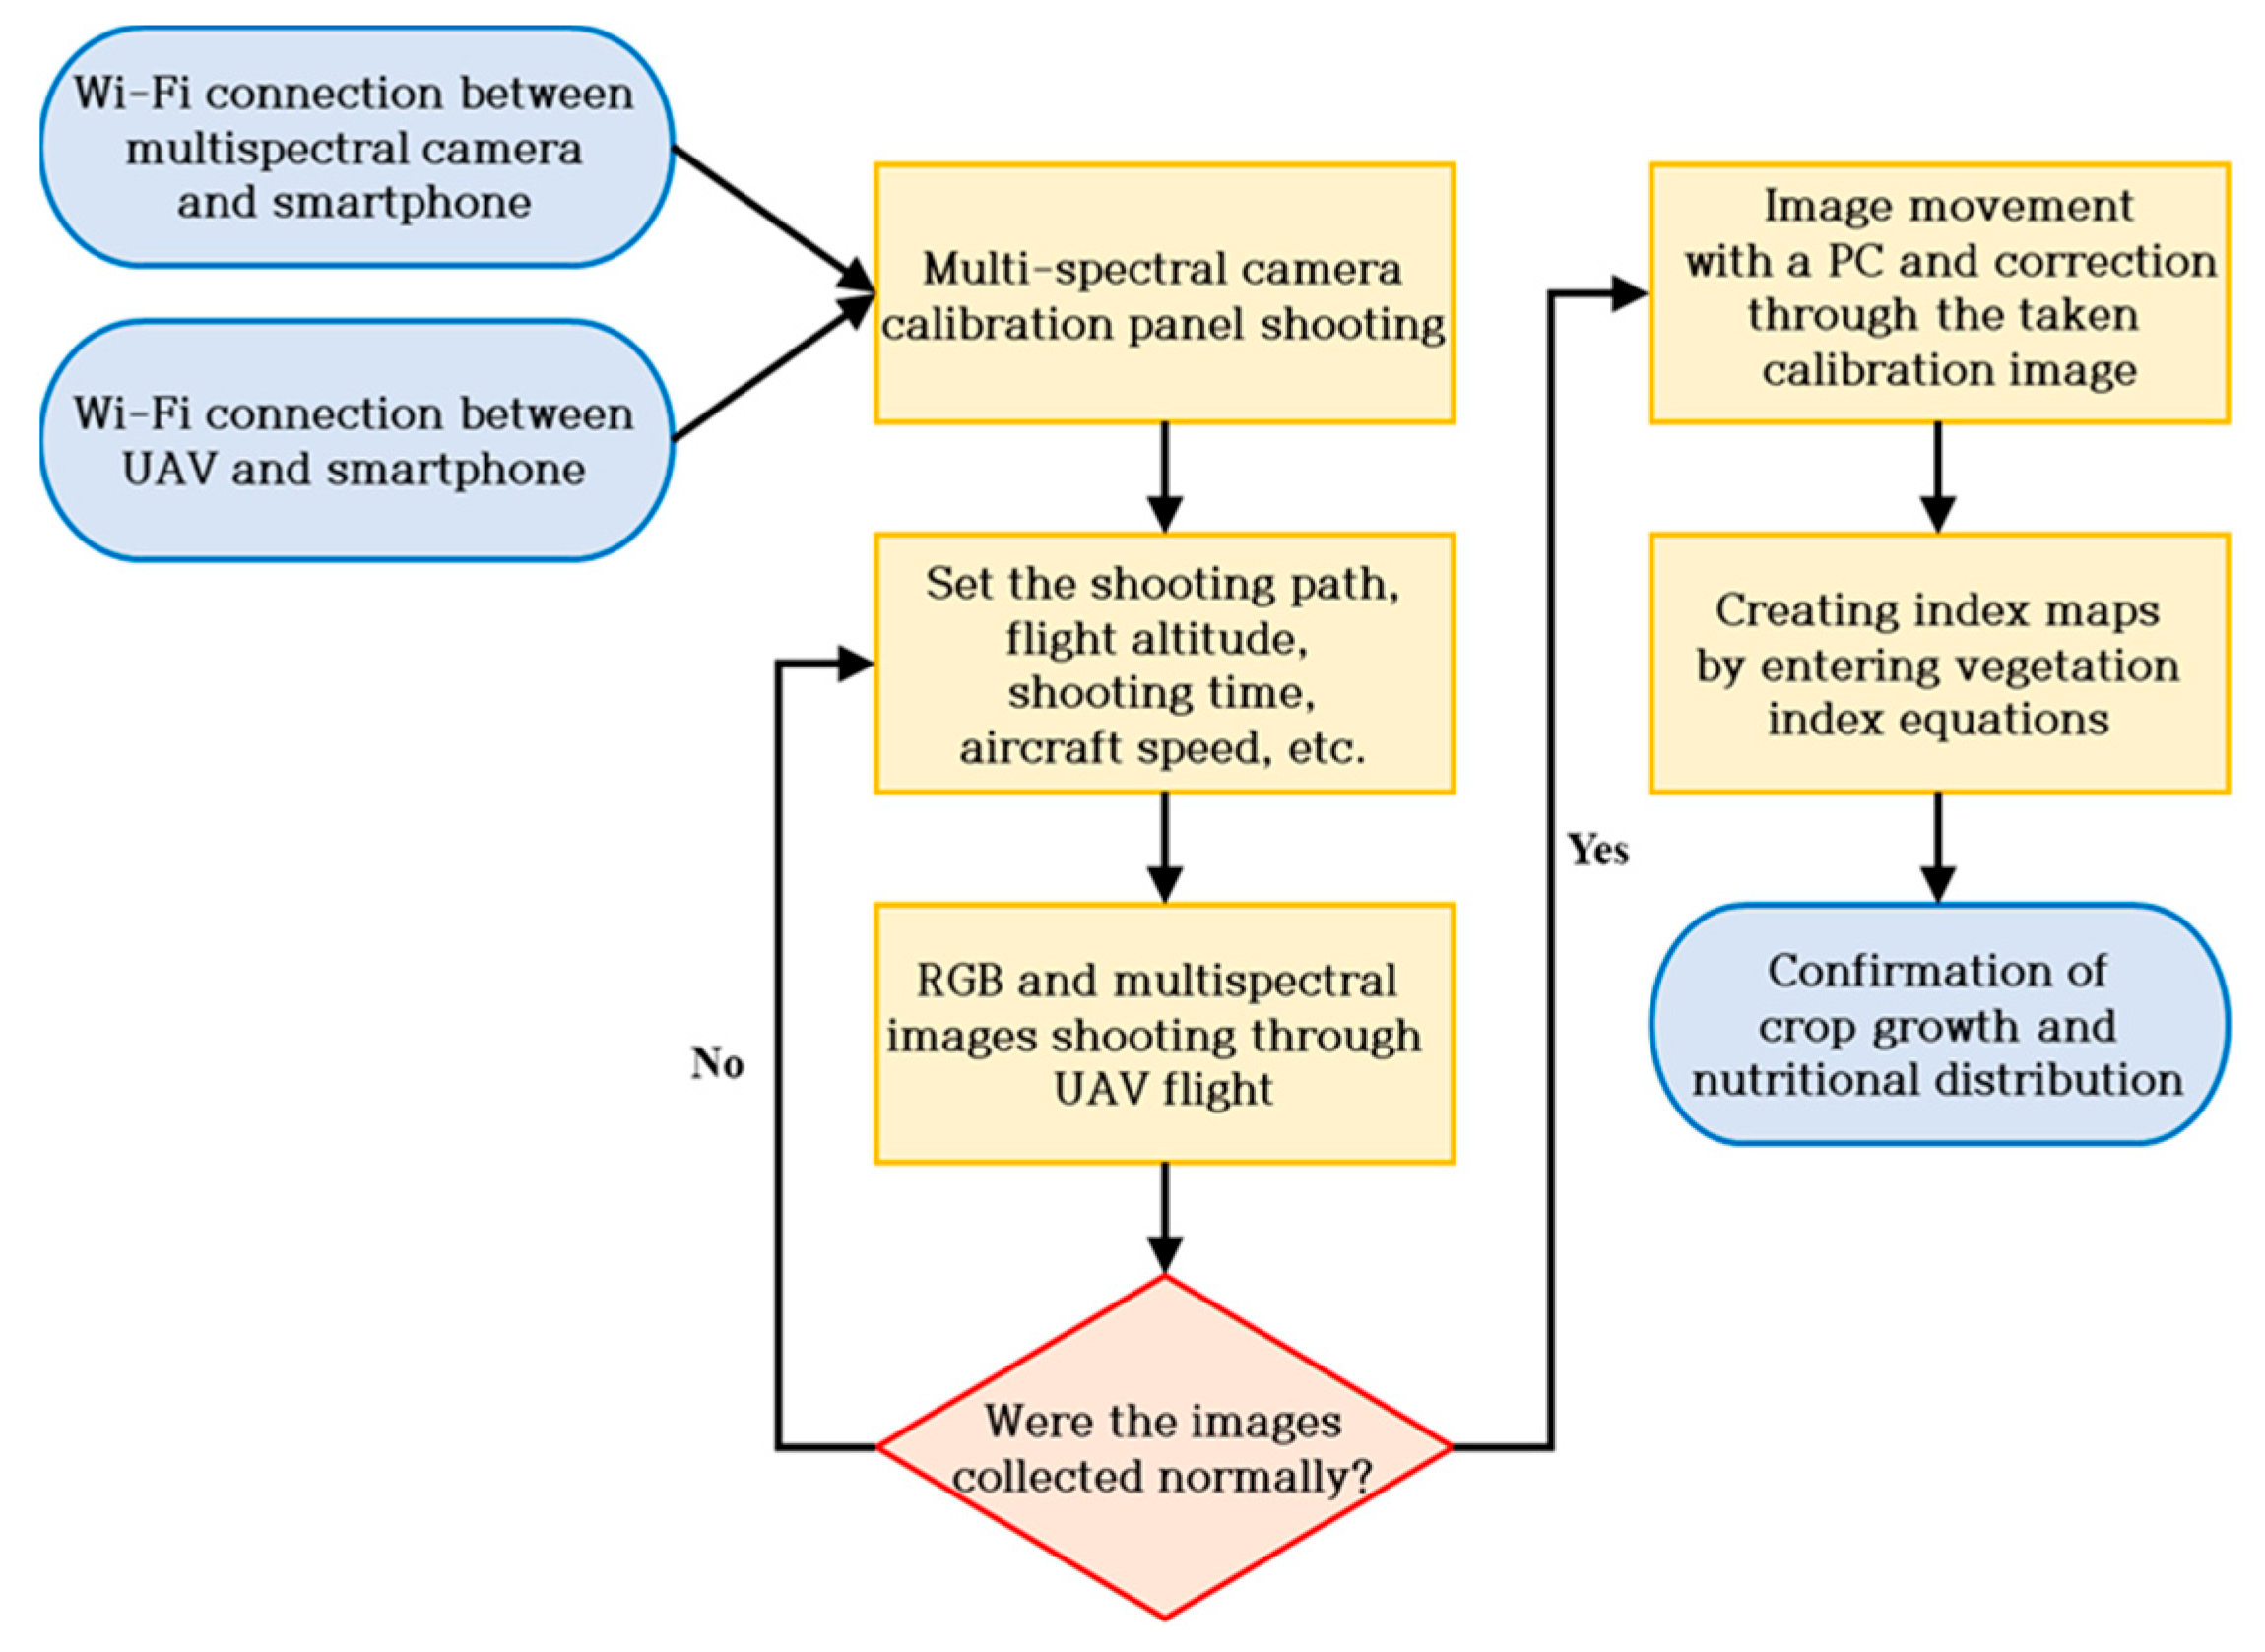
The average vegetation index value, calculated from the relevant vegetation index equations, was compared with the corresponding chlorophyll measurements (Figure 5).

2.4. Correlation and Predictive Performance Analysis Between Vegetation Index Values and Actual Nutrient Measurements

All correlation analyses between vegetation index data obtained from multispectral imaging (collected from June to October 2019, excluding September) and actual leaf chlorophyll measurements from each hardy kiwi plantation site were statistically examined using SPSS Statistics version 26 (IBM SPSS, Armonk, NY, USA). The data were divided into training datasets for developing separate predictive models by month, region, and cultivar and validation datasets for evaluating the performance of each model. Using the full dataset, an integrated chlorophyll content prediction model was developed and evaluated to determine whether chlorophyll levels could be predicted solely from multispectral image data, independent of region or time.

2.5. Fertilizer Prescriptions in Hardy Kiwi Plantations

In South Korea, hardy kiwi cultivation follows a monthly management calendar (Table 4). Top dressing is typically applied in June during the cultivation period. If proper fertilization is not implemented, plant growth and fruit set may be suboptimal. Excessive nitrogen fertilizer can reduce fruit sugar content, decrease aroma, and result in pale-colored flesh. Conversely, overapplication of phosphate and potassium fertilizers can increase sweetness and juice content but may cause fruit decay; greater susceptibility to fungal diseases; and losses during harvesting, storage, and distribution [16].
Therefore, an appropriate dose and type of fertilizer must be applied before fruit maturity. After top dressing, it takes about 2 weeks to be absorbed into the soil. In this study, NPKO Super-70 fertilizer (N-P-K [5-2-1.5], magnesium 1.5, organic matter 70; and Pungnong Co., Ltd., Naju, Republic of Korea) was applied in mid-June, and crop and soil conditions from July to October were evaluated using vegetation index values.

3. Results and Discussion

3.1. Generation of Vegetation Index Maps from Multispectral Images

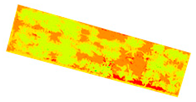
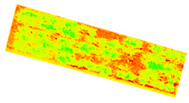
From June to October 2019, we collected multispectral images from 10 hardy kiwi plantations located in Bujeo-ri, Bonggang-myeon, Gwangyang-si, Jeollanam-do (G); Muju-gun, Jeollabuk-do (M); Wonju-si and Yeongwol-gun, Gangwon-do (W, Y); and Suwon-si, Gyeonggi-do (S). Based on these images, NDVI and CCCI maps were generated (Table 5). Although these maps enabled the visualization of overall crop growth and nutrient distribution over time, they did not enable the direct assessment of the degree of change that occurred. Therefore, we examined the correlation between measured chlorophyll content in hardy kiwi leaves and vegetation index values from June to October. Finally, we developed and validated a model to estimate chlorophyll content from vegetation index maps.

3.2. Feasibility of Estimating Soil Status Using Multispectral Images

Fertilization of hardy kiwi was performed uniformly across all regions in mid-June. According to Wang et al. (2021) [17] and Wang et al. (2024) [18], soil nitrogen content is strongly correlated with chlorophyll content. Based on the CCCI map, which reflects chlorophyll levels, crop growth improved starting in July, which is consistent with the expected fertilizer prescription and soil absorption period. Figure 5 shows an increase in chlorophyll content between June and July. These findings indicate that multispectral imagery can enable the precise and timely assessment of plantation nutrient status, thereby supporting localized fertilizer application. This assessment, in turn, can enhance the efficiency of fertilizer use and reduce environmental pollution.

3.3. Comparison Between Vegetation Index Values and Actual Chlorophyll Measurements

Table 6 shows the index values obtained from the vegetation index maps generated by Pix4Dmapper.
Overall, NDVI showed the highest average index value, whereas CCCI values were comparable. A closer examination revealed that index values increased slightly from June to July and then declined after July. Figure 6 shows a graph of the regional averages of the measured chlorophyll content.
The monthly chlorophyll values measured using the portable chlorophyll meter followed a trend similar to that of the average index values, with chlorophyll content increasing from June and decreasing after July. Accordingly, a normality test (Table 7) was performed to assess whether a linear relationship existed between the actual chlorophyll content of hardy kiwi leaves and each vegetation index value.
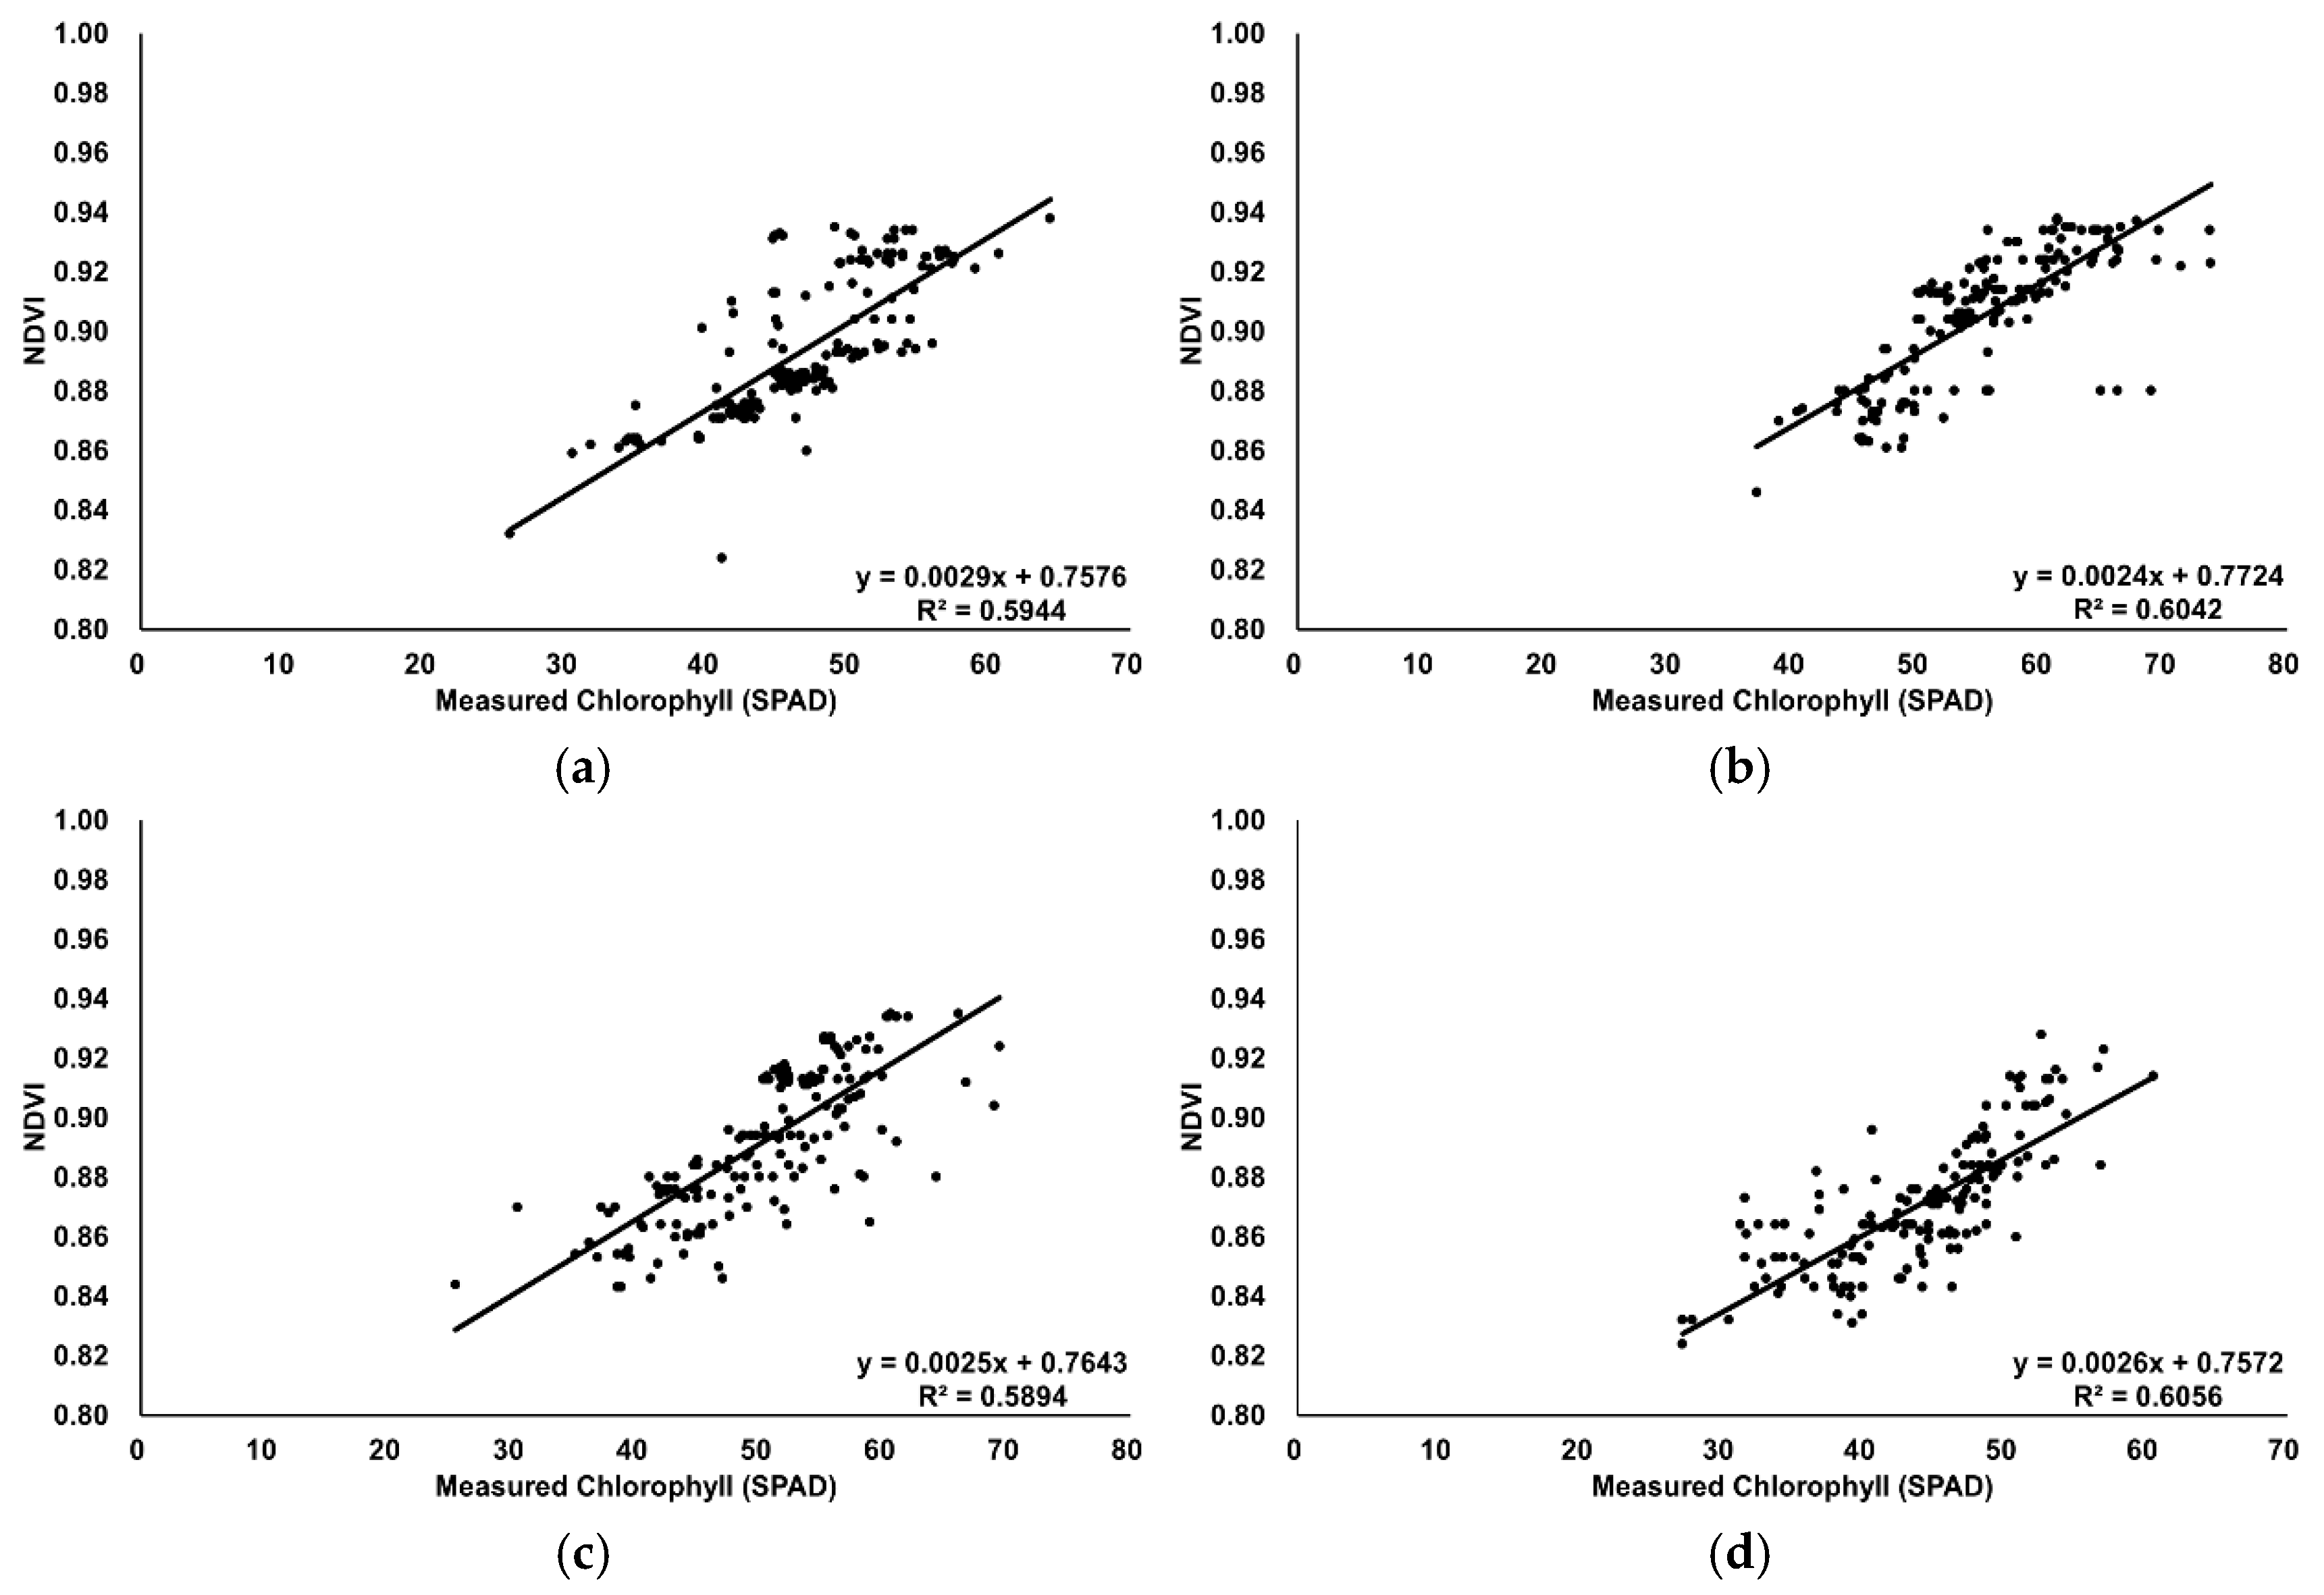
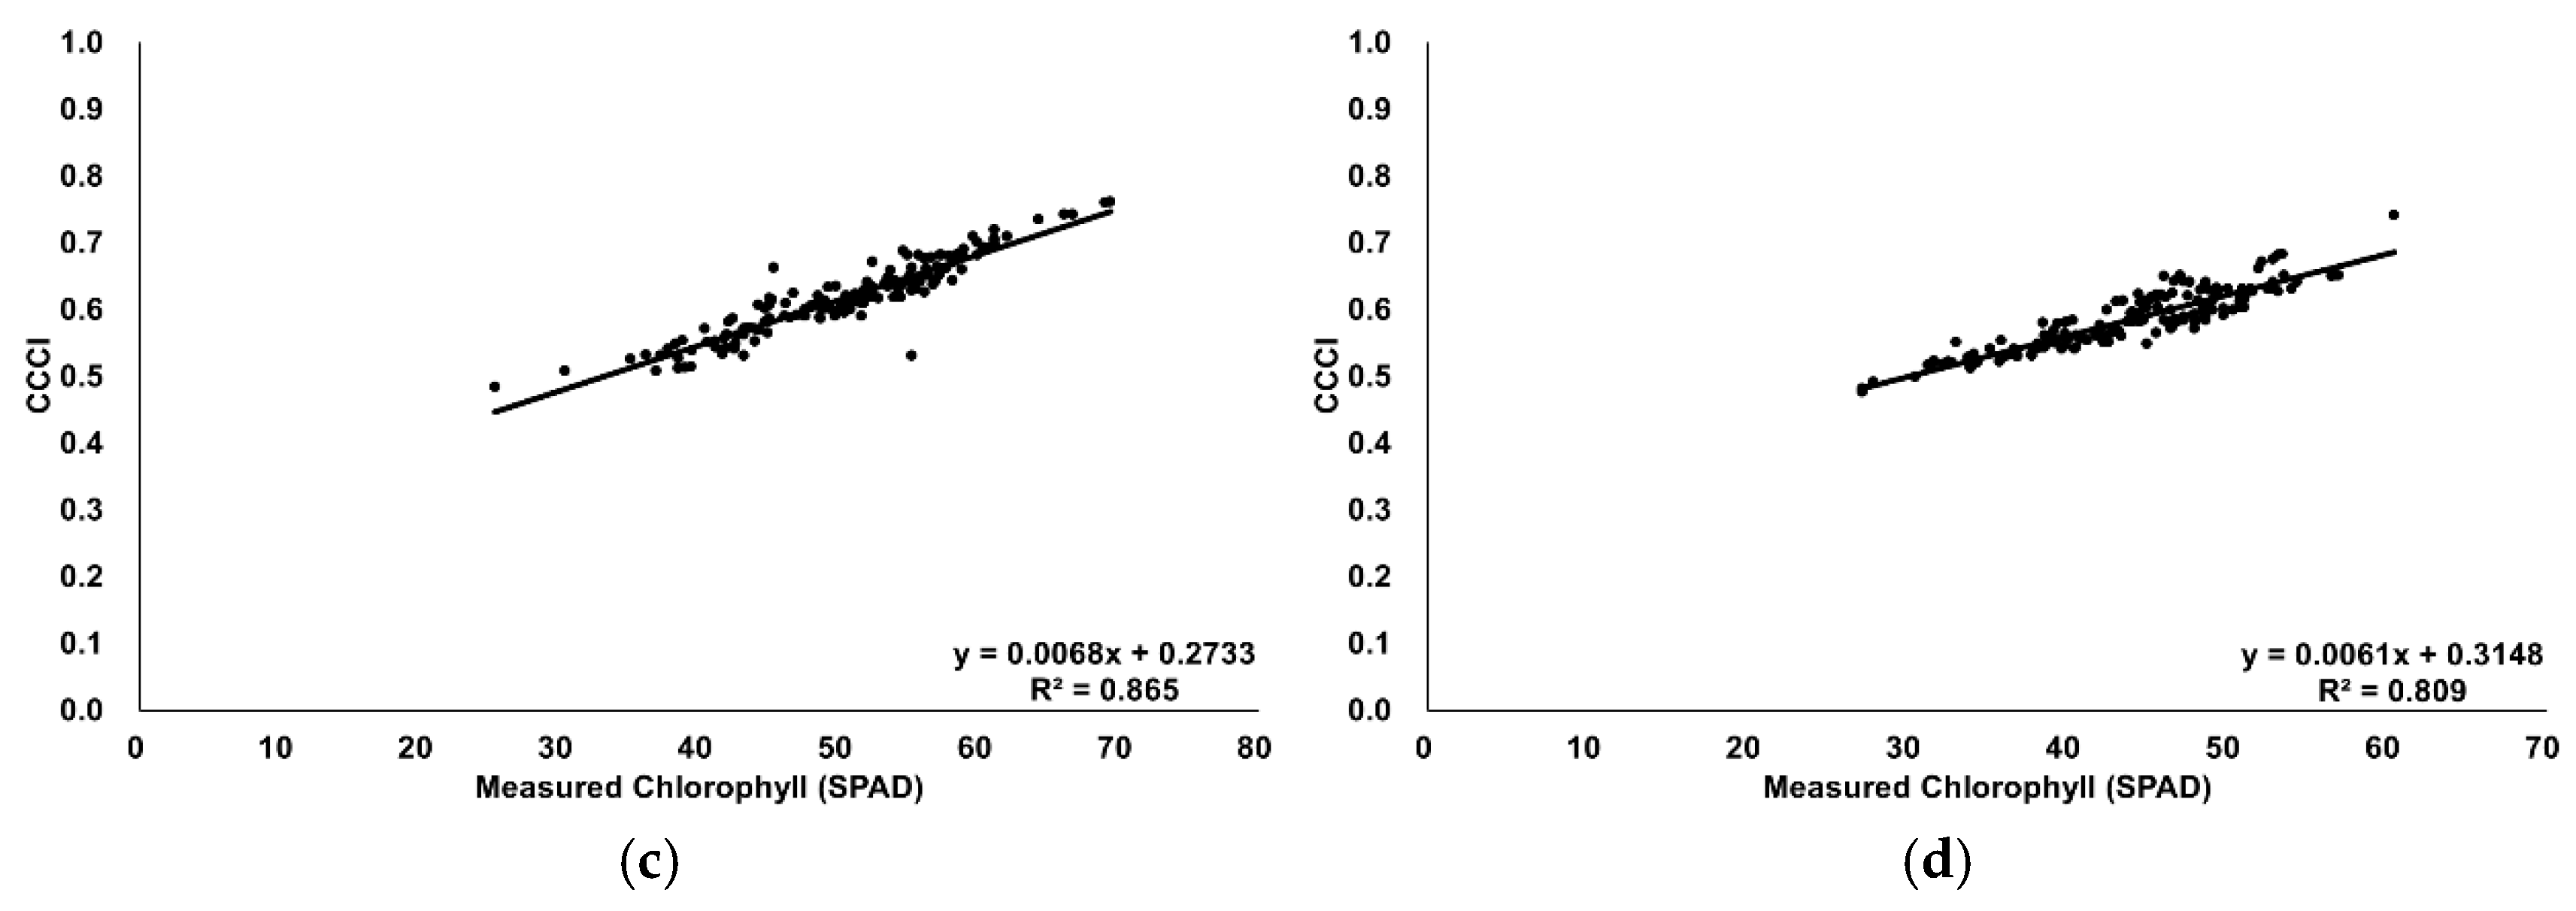
The measured chlorophyll values were confirmed to follow a normal distribution. Vegetation index values increased proportionally with the actual chlorophyll measurements (Figure 7 and Figure 8), indicating a positive correlation. Thus, a correlation analysis was performed (Table 8).
Next, bivariate correlation analyses were performed between each vegetation index value and the actual chlorophyll measurements. The results showed strong correlations at a significance level below 0.01, with the monthly analysis also revealing consistent trends. Similarly, the monthly correlation coefficients between NDVI and CCCI were high for each vegetation index map: 0.632 in June, 0.724 in July, 0.678 in August, and 0.691 in October—all significant at p < 0.01. Mitra et al. [19], Ali et al. [20] and Miller et al. [21] reported that the NDVI model is effective for predicting nitrogen content. Rodriguez et al. [22] developed indexes sensitive to chlorophyll content, such as NDRE, based on the close relationship between chlorophyll pigments, light absorption, and photosynthetic efficiency. A stronger correlation was obtained using the CCCI map, which incorporates NDRE, than with NDVI alone. Performance benchmarking reveals significant advantages of our hardy kiwi-specific approach. Fitzgerald et al. [23] reported CCCI–nitrogen correlations of approximately 0.6 for broadleaf crops, while our hardy kiwi study achieved substantially higher correlations (r = 0.847–0.936). This 40–56% improvement in correlation strength can be attributed to hardy kiwi’s unique leaf architecture and chlorophyll distribution patterns, which appear more responsive to multispectral analysis than traditionally studied crops. According to Netto et al. [24], the chlorophyll content measured using the SPAD-502 m shows a correlation of approximately 0.7 with actual nitrogen levels. Further studies are necessary to directly compare nitrogen concentrations with vegetation index maps.
Subsequently, a one-way ANOVA was performed to examine regional differences. Although the chlorophyll content followed a normal distribution (Table 7), it did not meet the assumption of homogeneity of variance. Thus, these data were analyzed using Welch’s test. The results showed significant differences in chlorophyll content (Welch statistic = 46.462, p < 0.001) (Table 9). Post hoc analysis was performed using the Games–Howell method, which is appropriate when equal variances cannot be assumed. Overall, the Muju region showed the lowest average chlorophyll measurement, whereas Gwangyang, Wonju, and Suwon had similar levels, and Yeongwol had the highest.
For NDVI and CCCI, which did not follow a normal distribution (Table 7), the nonparametric Kruskal–Wallis test was conducted. The results revealed significant differences for NDVI (χ2 = 75.887, p < 0.001) and CCCI (χ2 = 74.507, p < 0.001) (Table 10). Post hoc analysis of regional differences was performed using the Mann–Whitney U tests. The Muju region had the lowest average index values across all vegetation index models, while the Gwangyang, Wonju, Yeongwol, and Suwon regions exhibited similar patterns, with Yeongwol showing slightly higher values.
The multi-regional validation approach addresses a critical limitation in the existing UAV-based crop monitoring literature, where most studies focus on single-location assessments. Regional performance variations (R2 = 0.77–0.89) reflect hardy kiwi’s sensitivity to local environmental conditions—soil fertility, moisture regimes, and microclimatic factors—characteristics not adequately addressed in previous fruit crop monitoring studies. This regional specificity analysis provides practical insights for scaling UAV-based nitrogen monitoring systems across diverse hardy kiwi production areas, establishing location-specific calibration protocols essential for commercial adoption.

3.4. Chlorophyll Estimation Model for Hardy Kiwi Plantations Using Multispectral Images

Overall, analysis of the relationship between vegetation index values from previously generated maps and the actual chlorophyll measurements revealed strong correlations. The CCCI model, which showed the highest correlation with measured chlorophyll content, was selected to develop and validate a chlorophyll estimation model.
Before developing the prediction models, it is important to acknowledge potential limitations of UAV-based data collection that may affect index accuracy. Environmental factors such as wind conditions during flight can introduce motion blur and geometric distortions in imagery. Additionally, canopy occlusion in dense vegetation areas may result in incomplete spectral information, while GPS positioning errors could affect the spatial accuracy of measurements and complicate the matching between UAV-derived indices and ground-truth samples.
The mean values and their 95% confidence intervals were calculated under the assumption of normality. Normality was assessed using Q-Q plots and the Shapiro–Wilk test. In cases where the normality assumption was not met, data transformations such as log transformation were applied to correct deviations from normality, and subsequent Q-Q plots confirmed that the transformed data satisfied the normality assumption.
First, a regression equation for Prediction Model A was developed using CCCI values and actual chlorophyll measurements from June, July, and August. The CCCI values from October were then entered into this equation, and the predicted chlorophyll values were compared with the actual measurements to determine correlation. Similarly, Prediction Models B (June, July, and October), C (June, August, and October), and D (July, August, and October) were validated by entering the respective month’s data into each regression equation (Table 11).
As a result, Model A showed a coefficient of determination of 0.81 and an RMSE of 3.41. Models B, C, and D showed R2 values of 0.87, 0.88, and 0.72, with corresponding RMSE values of 3.02, 2.78, and 3.33, respectively. Model C demonstrated the highest correlation, whereas Model D showed the lowest. Nevertheless, Model D’s correlation of 0.72 indicates that monthly chlorophyll estimation of hardy kiwi plantations using vegetation index maps is feasible with at least 70% accuracy. Correlation analysis was also performed between the actual chlorophyll measurements and the predicted values.
In general, the results of correlation analysis showed strong relationships between variables (see Model A at 0.899, Model B at 0.930, Model C at 0.936, and Model D at 0.847, all significant at the p < 0.01 level; Table 12). In addition to the monthly chlorophyll estimation models, we developed regional chlorophyll estimation models, validated their performance, and assessed their significance levels via correlation analysis (Table 13 and Table 14).
When chlorophyll estimation models were developed for each region using the CCCI vegetation index map, their predictive performance was evaluated. Model E showed an R2 value of 0.84 and an RMSE of 2.47. The R2 values for Models F, G, H, and I were 0.87, 0.88, 0.77, and 0.89, respectively, with corresponding RMSE values of 3.87, 2.62, 3.07, and 3.47. All regression equations were significant at the p < 0.01 level, indicating that the chlorophyll estimation models based on the vegetation index were valid.
Comparative performance analysis demonstrates the superiority of our hardy kiwi-specific modeling approach. While Gitelson et al. [25] achieved high R2 values (0.94) for other crop species, their standard errors (4.26–4.06 μg/cm2) exceeded our performance metrics. More significantly, Croft et al. [26]’s satellite-based models, despite reasonable correlations (~0.75), exhibited RMSE values of 7.05–13.40—more than double our average RMSE of 3.1. This superior precision reflects the advantages of UAV-based multispectral monitoring specifically calibrated for hardy kiwi physiological characteristics, contrasting with generic satellite approaches designed for broader crop categories.
Finally, we analyzed the correlations among actual leaf nitrogen content, chlorophyll meter readings, and CCCI values derived from multispectral imagery. To this end, twelve leaves were randomly sampled during a visit to the Hardy kiwifruit farm in Suwon in October, following the same sampling protocol, measurement procedures, and CCCI calculation methods as described previously. The actual nitrogen content of each leaf was determined through laboratory analysis at the Cooperative Laboratory of Gyeongsang National University.
The correlation coefficient between actual nitrogen content and the values measured with the portable chlorophyll meter was 0.72 (Figure 9), consistent with the findings of Netto et al. [24]. The correlation coefficient of 0.66 between actual nitrogen content and CCCI values obtained from the multispectral camera indicates a moderately strong positive relationship, suggesting that CCCI can be a useful proxy for assessing crop nitrogen status (Figure 10). However, it is important to recognize that CCCI alone may not reliably represent nitrogen content across all environmental and growth conditions due to potential variability caused by factors such as canopy structure, light conditions, and developmental stages. Therefore, CCCI should be interpreted with caution and supplemented by additional vegetation indices or integrated into multivariate machine learning models that combine spectral, phenotypic, and environmental data to improve estimation accuracy. Further validation across diverse crop types, growing regions, and seasons, along with periodic calibration using direct field measurements, is essential to enhance the robustness and generalizability of UAV-based nitrogen monitoring systems. In practical applications, UAV-derived CCCI offers an efficient and non-destructive tool for large-scale, real-time monitoring of crop nutritional status, but should be used as a complementary approach alongside traditional measurement methods when precise nitrogen management decisions are required. This integrated strategy will ensure more reliable nitrogen diagnostics and sustainable crop management.
Although the SPAD-502 m has an inherent error margin of ±0.3 SPAD units, our findings indicate that further improvements in chlorophyll estimation models are possible. For instance, improving the accuracy of parameters such as the distance between the multispectral camera and the canopy, or enhancing the precision of leaf localization, could further refine model performance.
In this study, the regional models exhibited a wide range of determination coefficients (R2 values from 0.72 to 0.89), which are closely associated with the distinct environmental characteristics of each region. The hardy kiwi plantations were located in areas with diverse soil types, climatic conditions, and cultivation practices, all of which serve as major factors influencing the linear relationship between vegetation indices and actual chlorophyll content. For example, differences in soil fertility or moisture content between regions can cause variations in the actual chlorophyll concentration, i.e., the nutritional status of the crop, even at identical vegetation index values. Additionally, meteorological variables such as precipitation, mean temperature, and solar radiation can induce differences in crop growth and stress levels, leading to variations in model explanatory power. This variability has been consistently referenced in previous studies; indeed, Kong et al. [27] reported that not only environmental stresses but also structural characteristics and planting density of vegetation significantly affect the accuracy of chlorophyll estimation through remote sensing.
Among the vegetation indices, NDVI is the most widely used for diagnosing crop vitality, chlorophyll content, and leaf area index (LAI). However, NDVI is prone to saturation in dense canopies or when chlorophyll content exceeds a certain threshold, thereby limiting its sensitivity to subtle variations. As an alternative, the canopy chlorophyll content index (CCCI), which incorporates red-edge bands, partially overcomes the saturation issue. In the present study, CCCI consistently exhibited notably higher correlation coefficients with actual chlorophyll content than NDVI. CCCI is particularly useful for estimating not only chlorophyll but also in-field nitrogen content, as the red and red-edge spectral regions are highly sensitive to variations in leaf chlorophyll and nitrogen. Accordingly, the use of CCCI facilitates the real-time diagnosis of crop nutritional status—particularly nitrogen availability—enabling more precise fertilizer management and reinforcing the applicability of precision agriculture. Nevertheless, CCCI may experience saturation effects in extremely dense canopies where high biomass levels can limit the sensitivity of spectral indices to further increases in chlorophyll content. Future studies should consider integrating alternative vegetation indices such as the red-edge normalized difference vegetation index (NDRE), photochemical reflectance index (PRI), or enhanced vegetation index (EVI) to overcome potential saturation limitations and improve estimation accuracy under varying canopy conditions.
Recently, bi-angular observation-based vegetation indices (BCVI) have been proposed. Kong et al. [27] demonstrated that, in wheat crops, combining vegetation indices derived from two different viewing angles (e.g., +30° and −20°) can improve the R2 value for chlorophyll estimation by 25–51% compared to conventional mono-angular approaches. BCVI accounts for the three-dimensional structure of the canopy and shaded areas, thereby minimizing the saturation effect in dense crops. These advances suggest that BCVI is a promising new approach for large-scale agricultural monitoring. In future studies, further research and evaluation should be conducted based on the methodologies and findings presented in this study to enhance the accuracy of nitrogen monitoring.
Several methodological considerations warrant acknowledgment for future research development. All models were developed and validated using the same dataset, limiting assessment of generalizability across different growing seasons and climatic conditions. Environmental factors during UAV data collection—including wind-induced motion blur, canopy occlusion in dense vegetation areas, and GPS positioning errors—can affect measurement accuracy and require standardized protocols for operational deployment. Additionally, CCCI may experience saturation effects in extremely dense canopies, necessitating integration of alternative vegetation indices (NDRE, PRI, and EVI) for comprehensive nitrogen assessment under varying canopy conditions. Future validation across independent datasets from different geographic regions and growing seasons will be essential to confirm the broader applicability of these hardy kiwi-specific monitoring protocols.
This study establishes the first comprehensive framework for UAV-based nitrogen monitoring specifically developed for hardy kiwi cultivation, addressing a critical knowledge gap in high-value fruit crop management. The cost-effective multispectral approach enables real-time, large-scale monitoring at significantly lower operational costs than traditional soil and tissue sampling methods, making precision agriculture accessible to small-scale hardy kiwi producers. The identified seasonal monitoring protocols—particularly the July optimization window—provide actionable insights for fertilizer timing and dosage adjustments, supporting both economic efficiency and environmental sustainability in hardy kiwi production systems. Future integration of these monitoring protocols with automated fertilizer application systems could revolutionize nutrient management in high-value fruit crop production, establishing hardy kiwi as a model for precision agriculture adoption in specialty crop sectors.
4. Conclusions

In this study, we created maps of vegetation indexes such as NDVI and CCCI to assess crop nutrient status. These maps were developed using spectral imagery captured by a UAV equipped with a multispectral camera. Subsequently, we examined whether the index values obtained could be used to estimate the actual nutrient status of hardy kiwi plantations.
Meanwhile, the actual chlorophyll content of hardy kiwi leaves was measured using a portable chlorophyll meter. These values were compared with the vegetation index values, with both NDVI and CCCI showing significant correlations. Among these, the CCCI model was the most effective for estimating chlorophyll content. Further analysis of regional differences in measured data revealed significant differences for chlorophyll, NDVI, and CCCI, indicating the need to incorporate regional climatic and geographical factors. Subsequently, a correlation analysis was performed to determine whether actual chlorophyll values could be predicted by month and region. The highly significant results (significance level < 0.01) from our predictive models indicate that effective prediction is possible. However, all models were developed and validated using the same dataset, which limits assessment of their generalizability. Future research should validate these UAV-based nitrogen estimation models on independent datasets from different geographic regions, growing seasons, and environmental conditions to ensure robust performance across diverse agricultural settings.
Once actual chlorophyll estimation becomes possible through the use of vegetation index maps, nitrogen content prediction becomes more feasible via the correlation between nitrogen and chlorophyll established in previous studies. This approach would facilitate convenient monitoring of plantation nutritional status. Furthermore, appropriate fertilizer prescriptions can prevent economic losses and reduce environmental pollution.

Author Contributions

Conceptualization, S.L., H.M. and B.M.; methodology, S.L. and H.M.; validation, S.L. and H.M.; investigation, S.L. and H.M.; data curation, S.L. and H.M.; writing—original draft preparation, S.L. and H.M.; writing—review and editing, S.L. and H.M.; supervision, B.M.; project administration, B.M.; All authors have read and agreed to the published version of the manuscript.

Funding

This research received no external funding.

Institutional Review Board Statement

Not applicable.

Data Availability Statement

The data presented in this study are available on request from the corresponding author.

Acknowledgments

This work was supported by Korea Institute of Planning and Evaluation for Technology in Food, Agriculture and Forestry (IPET) and Korea Smart Farm R&D Foundation (KosFarm) through Smart Farm Innovation Technology Development Program, funded by Ministry of Agriculture, Food and Rural Affairs (MAFRA) and Ministry of Science and ICT (MSIT), Rural Development Administration (RDA) (RS-2025-02220471). This study was part of Sangyoon Lee’s Doctoral study on Analysis of growth information of hardy kiwi (Actinidia arguta) cultivated field and development of Soluble Solids Content (SSC) prediction model and verification of fruits.

Conflicts of Interest

The authors declare no conflicts of interest.

References

  1. Tian, Z.; Zhang, Y.; Zhang, H.; Li, Z.; Li, M.; Wu, J.; Liu, K. Winter wheat and soil total nitrogen integrated monitoring based on canopy hyperspectral feature selection and fusion. Comput. Electron. Agric. 2022, 201, 107285. [Google Scholar] [CrossRef]
  2. Lin, P.; Song, C.; Yang, C.; Zhang, M.; Ma, S.; Wen, J.; Dong, D.; Han, Y. Rapid and accurate detection of total nitrogen in different types of soil using laser-induced breakdown spectroscopy combined with transfer learning. Comput. Electron. Agric. 2024, 226, 109396. [Google Scholar] [CrossRef]
  3. Yang, K.; Mo, J.; Luo, S.; Peng, Y.; Fang, S.; Wu, X.; Zhu, R.; Li, Y.; Yuan, N.; Zhou, C.; et al. Estimation of rice aboveground biomass by UAV imagery with photosynthetic accumulation models. Plant Phenomics 2023, 5, 0056. [Google Scholar] [CrossRef]
  4. Cheng, K.; Yan, J.; Li, G.; Ma, W.; Guo, Z.; Wang, W.; Li, H.; Da, Q.; Li, X.; Yao, Y. Remote sensing inversion of nitrogen content in silage maize plants based on feature selection. Front. Plant Sci. 2025, 16, 1554842. [Google Scholar] [CrossRef]
  5. Sun, H.; Feng, M.; Yang, W.; Bi, R.; Sun, J.; Zhao, C.; Xiao, L.; Wang, C.; Kubar, M.S. Monitoring leaf nitrogen accumulation with optimized spectral index in winter wheat under different irrigation regimes. Front. Plant Sci. 2022, 13, 913240. [Google Scholar] [CrossRef]
  6. Singh, R.; Kaur, S.; Joshi, D.R.; Iboyi, J.; Dar, E.; Sharma, L.K.; Singh, H. Estimating cotton biomass and nitrogen content using high-resolution satellite and UAV data fusion with machine learning. Smart Agric. Technol. 2025, 12, 101191. [Google Scholar] [CrossRef]
  7. Xi, R.; Gu, Y.; Zhang, X.; Ren, Z. Nitrogen monitoring and inversion algorithms of fruit trees based on spectral remote sensing: A deep review. Front. Plant Sci. 2024, 15, 1489151. [Google Scholar] [CrossRef]
  8. Yuanxiu, L.; Honglan, T.; Bing, Z.; Diya, L.; Xuan, Z.; Wantian, Y.; Jinming, F.; Yunting, Z.; Qing, C.; Yan, W.; et al. Comparative changes of health-promoting phytochemicals and sugar metabolism of two hardy kiwifruit (Actinidia arguta) cultivars during fruit development and maturity. Front. Plant Sci. 2022, 13, 1087452. [Google Scholar] [CrossRef]
  9. Morton, A.R. Kiwifruit (Actinidia spp.) Vine and Fruit Responses to Nitrogen Fertiliser Applied to the Soil or Leaves. 2013. Available online: https://mro.massey.ac.nz/bitstream/handle/10179/6856/02_whole.pdf (accessed on 20 July 2019).
  10. Castilho, D.; Tedesco, D.; Hernandez, C.; Madari, B.E.; Ciampitti, I. A global dataset for assessing nitrogen-related plant traits using drone imagery in major field crop species. Sci. Data 2024, 11, 585. [Google Scholar] [CrossRef]
  11. Swaminathan, V.; Thomasson, J.A.; Hardin, R.G.; Rajan, N.; Raman, R. Radiometric calibration of UAV multispectral images under changing illumination conditions with a downwelling light sensor. Plant Phenomics J. 2024, 7, 70005. [Google Scholar] [CrossRef]
  12. Nagpal, V.; Devare, M. Improving georeferencing accuracy in drone imagery: Combining drone camera angles with high and variable fields of view. QAJ 2025, 5, 228–246. [Google Scholar] [CrossRef]
  13. Stamford, J.D.; Vialet-Chabrand, S.; Cameron, I.; Lawson, T. Development of an accurate low cost NDVI imaging system for assessing plant health. Plant Methods 2023, 19, 9. [Google Scholar] [CrossRef]
  14. Kriegler, F.J. Preprocessing transformations and their effects on multispectral recognition. In Proceedings of the Sixth International Symposium on Remote Sensing of the Environment, Paphos, Cyprus, 26–29 March 2018; University of Michigan: Ann Arbor, MI, USA, 1969; pp. 97–131. [Google Scholar]
  15. Rouse, J.W.; Haas, R.H.; Schell, J.A.; Deering, D.W. Monitoring vegetation systems in the Great Plains with ERTS. NASA Spec. Publ. 1974, 351, 309. Available online: https://ntrs.nasa.gov/citations/19740022614 (accessed on 20 July 2019).
  16. Park, Y.K.; Kim, S.H.; Kim, C.W.; Kim, J.H. Hardy Kiwifruit Cultivation Q&A; National Institute of Forest Science (NIOFS): Seoul, Republic of Korea, 2016. [Google Scholar]
  17. Wang, S.; Guan, K.; Wang, Z.; Ainsworth, E.A.; Zheng, T.; Townsend, P.A.; Li, K.; Moller, C.; Wu, G.; Jiang, C. Unique contributions of chlorophyll and nitrogen to predict crop photosynthetic capacity from leaf spectroscopy. J. Exp. Bot. 2021, 72, 341–354. [Google Scholar] [CrossRef]
  18. Wang, X.; Shi, J. Leaf chlorophyll content is the crucial factor for the temporal and spatial variation of global plants leaf maximum carboxylation rate. Sci. Total Environ. 2024, 927, 172280. [Google Scholar] [CrossRef]
  19. Mitra, B.; Singha, P.; Roy Chowdhury, A.; Sinha, A.K.; Skalicky, M.; Brestic, M.; Alamri, S.; Hossain, A. Normalized difference vegetation index sensor-based nitrogen management in bread wheat (Triticum aestivum L.): Nutrient uptake, use efficiency, and partial nutrient balance. Front. Plant Sci. 2023, 14, 1153500. [Google Scholar] [CrossRef]
  20. Ali, A.M.; Ibrahim, S.M.; Salem, E.M.M.; El-Sadek, A.N.; Salem, H.M. In-season estimation of wheat response to nitrogen using normalized difference vegetation index. Int. J. Plant Prod. 2022, 16, 681–689. [Google Scholar] [CrossRef]
  21. Miller, J.O.; Mondal, P.; Sarupria, M. Sensor-based measurements of NDVI in small grain and corn fields by tractor, drone, and satellite platforms. Crop Environ. 2024, 3, 33–42. [Google Scholar] [CrossRef]
  22. Rodriguez, D.; Fitzgerald, G.J.; Belford, R.; Christensen, L.K. Detection of nitrogen deficiency in wheat from spectral reflectance indices and basic crop eco-physiological concepts. Aust. J. Agric. Res. 2006, 57, 781–789. [Google Scholar] [CrossRef]
  23. Fitzgerald, G.; Rodriguez, D.; O’Leary, G. Measuring and predicting canopy nitrogen nutrition in wheat using a spectral index—The Canopy Chlorophyll Content Index (CCCI). Field Crops Res. 2010, 116, 318–324. [Google Scholar] [CrossRef]
  24. Netto, A.T.; Campostrini, E.; Oliveira, J.G.; Bressan-Smith, R.E. Photosynthetic pigments, nitrogen, chlorophyll a fluorescence and SPAD-502 readings in coffee leaves. Sci. Hortic. 2005, 104, 199–209. [Google Scholar] [CrossRef]
  25. Gitelson, A.A.; Merzlyak, M.N. Remote estimation of chlorophyll content in higher plant leaves. Int. J. Remote Sens. 1997, 18, 2691–2697. [Google Scholar] [CrossRef]
  26. Croft, H.; Chen, J.M.; Zhang, Y.; Simic, A.; Noland, T.L.; Nesbitt, N.; Arabian, J. Evaluating leaf chlorophyll content prediction from multispectral remote sensing data within a physically-based modelling framework. ISPRS J. Photogramm. 2015, 102, 85–95. [Google Scholar] [CrossRef]
  27. Kong, W.; Huang, W.; Ma, L.; Li, C.; Tang, L.; Guo, J.; Zhou, X.; Casa, R. Biangular-Combined Vegetation Indices to Improve the Estimation of Canopy Chlorophyll Content in Wheat Using Multi-Angle Experimental and Simulated Spectral Data. Front. Plant Sci. 2022, 13, 866301. [Google Scholar] [CrossRef] [PubMed]
Figure 1. Hardy kiwi plantations from site S1 (a) without the red panel; (b) with the red panel.
Agriculture 15 01794 g001
Figure 2. Multispectral photographing system.
Agriculture 15 01794 g002
Figure 3. Drone flight parameter (Pix4D Capture).
Agriculture 15 01794 g003
Figure 4. Multispectral image acquisition and analysis example (Pix4D Mapper).
Agriculture 15 01794 g004
Figure 5. Multispectral image collection and processing flow chart.
Agriculture 15 01794 g005
Figure 6. Average monthly chlorophyll measurements for each region.
Agriculture 15 01794 g006
Figure 7. Correlation between normalized difference vegetation index and actual chlorophyll measurements by month. (a) June; (b) July; (c) August; (d) October.
Agriculture 15 01794 g007
Figure 8. Correlations between canopy chlorophyll content index and actual chlorophyll values by month. (a) June; (b) July; (c) August; (d) October.
Agriculture 15 01794 g008aAgriculture 15 01794 g008b
Figure 9. Correlations between actual chlorophyll values (SPAD) and actual nitrogen content.
Agriculture 15 01794 g009
Figure 10. Correlations between canopy chlorophyll content index (CCCI) and actual nitrogen content.
Agriculture 15 01794 g010
Table 1. Specification of multispectral camera.
DIMENSIONS and CHARACTERISTICS16 MPIX RGB CAMERA
59 mm × 41 mm × 28 mmDefinition: 4608 × 3456 pixels
72 g (2.5 oz)HFOV: 63.9°
Up to 1 fpsVFOV: 50.1°
64 GB built-in storageDFOV: 73.5°
IMU and magnetometer4 1.2 MPIX GLOBAL SHUTTER SINGLE-BAND CAMERAS
5 W (~12 W peak)Definition: 1280 × 960 pixels
SUNSHINE SENSORHFOV: 61.9°
Four spectral sensors (same filters as body)VFOV: 48.5°
GPSDFOV: 73.7°
IMU and magnetometerFOUR SEPARATE BANDS
SD Card slotGREEN (550 BP 40)
47 mm × 39.6 mm × 18.5 mmRED (660 BP 40)
35 g (1.2 oz)RED-Edge (735 BP 10)
1 WNear-infrared (790 BP 40)
Table 2. Vegetation index equations.
NameAbbreviationEquation
Normalized difference vegetation indexNDVI N I R R E D N I R + R E D
Normalized difference red-edgeNDRE N I R R e d _ E d g e N I R + R e d _ E d g e
Canopy chlorophyll concentration indexCCCI N D R E N D R E m i n N D R E m a x N D R E m i n
Table 3. Specification of portable chlorophyll meter (SPAD 502 plus, SPECIM, SPECTRAL IMAGING Ltd., Oulu, Finland).
Measurement subjectCrop leaves
Measurement methodOptical density difference at 2 wavelengths
Measurement area2 mm × 3 mm
Subject thickness1.2 mm maximum
Subject insertion depth12 mm (with stopper having position adjustable from 0 to 6 mm)
Light source2 LED elements
Receptor1 SPD (silicon photodiode)
DisplayLCD panel showing 4-digit measurement value and 2-digit number of measurement
Display range−9.9 to 199.9 SPAD units
Memory functionMemory capacity for up to 30 values
Power2 AA-size alkaline batteries
Battery performanceMore than 20,000 measurements
Minimum measurement intervalApprox. 2 s
AccuracyWithin ±1.0 SPAD units
RepeatabilityWithin ±0.3 SPAD units
ReproducibilityWithin ±0.5 SPAD units
Temperature driftWithin ±0.04 SPAD units
Operation temperature/humidity range0 to 50 °C; relative humidity of 85% or less (at 35 °C) with no condensation
Storage temperature/humidity range−20 to 55 °C; relative humidity of 85% or less (at 35 °C) with no condensation
Size (W × H × D), weight78 × 164 × 49 mm, 200 g
Table 4. Hardy kiwi cultivation calendar.
MonthCultivation Step
January(Winter) pruning and cutting; (base dressing) fertilizer application
FebruaryFacility and drainage maintenance
MarchTree planting
AprilDecapitation and irrigation
MayBloom: Artificial pollination
June(Summer) pruning, decapitation, and (top dressing) fertilizer application
JulyDrainage maintenance (preparation for the rainy season)
August(Summer) pruning and topping
SeptemberFruit maturity
OctoberHarvest period
NovemberLeaf fall period
December(Winter) pruning and (base dressing) fertilizer application
Table 5. Cultivation, NDVI maps, and CCCI maps by month (National Recreation Forest Management Office, Suwon).
CategoryCultivationNDVICCCI
JuneAgriculture 15 01794 i001Agriculture 15 01794 i002Agriculture 15 01794 i003
JulyAgriculture 15 01794 i004Agriculture 15 01794 i005Agriculture 15 01794 i006
AugustAgriculture 15 01794 i007Agriculture 15 01794 i008Agriculture 15 01794 i009
OctoberAgriculture 15 01794 i010Agriculture 15 01794 i011Agriculture 15 01794 i012
Table 6. Calculated vegetation index by region.
CategoryMinimumMaximumMeanS.D.
GNDVIJune0.830.930.890.02
July0.870.940.910.02
August0.840.940.890.03
October0.830.910.870.02
CCCIJune0.480.660.590.05
July0.600.810.690.05
August0.540.760.630.06
October0.510.660.590.05
MNDVIJune0.860.940.880.02
July0.860.920.890.02
August0.840.930.880.02
October0.820.910.860.02
CCCIJune0.510.630.590.04
July0.540.680.600.03
August0.510.690.590.04
October0.480.620.550.04
WNDVIJune0.820.930.900.02
July0.850.940.910.02
August0.840.930.900.02
October0.830.910.870.02
CCCIJune0.570.700.630.04
July0.530.800.670.06
August0.480.720.610.05
October0.520.740.600.05
YNDVIJune0.870.940.910.02
July0.880.940.910.02
August0.870.940.910.02
October0.850.930.890.02
CCCIJune0.550.730.600.04
July0.590.770.680.05
August0.530.740.650.05
October0.540.650.600.03
SNDVIJune0.860.930.890.02
July0.860.930.890.02
August0.860.920.890.02
October0.830.920.870.02
CCCIJune0.550.650.600.03
July0.600.690.650.03
August0.530.680.610.04
October0.520.650.580.04
Table 7. Normality test of vegetation index values and actual chlorophyll measurements.
Shapiro–Wilk TestDFp-Value
Chlorophyll (SPAD)0.9986720.56
NDVI0.9716720.00
CCCI0.9856720.00
Table 8. Correlation analysis between vegetation indexes and actual chlorophyll measurements.
Chlorophyll (SPAD)NDVICCCI
Month678106781067810
Chlorophyll
(SPAD)
Pearson’s
p-value
11110.771 **0.777 **0.768 **0.778 **0.847 **0.936 **0.930 **0.899 **
p-value----0.0000.0000.0000.0000.0000.0000.0000.000
NDVIPearson’s
p-value
0.771 **0.777 **0.768 **0.778 **11110.632 **0.724 **0.678 **0.691 **
p-value0.0000.0000.0000.000----0.0000.0000.0000.000
CCCIPearson’s
p-value
0.847 **0.936 **0.930 **0.899 **0.632 **0.724 **0.678 **0.691 **1111
p-value0.0000.0000.0000.0000.0000.0000.0000.000----
**: p-value < 0.01
Table 9. Differences in chlorophyll measurements by region as determined by ANOVA.
RegionNMeanSDWelchp-ValuePost Hoc Analysis
Gwangyang (a)14449.229.4046.462 ***0.000b < a, c, e < d,
e < c
Muju (b)14444.036.08
Wonju (c)14450.897.64
Yeongwol (d)14453.656.36
Suwon (e)9647.657.97
***: p-value < 0.001
Table 10. Differences between NDVI and CCCI measurements by regions determined using nonparametric statistical tests.
IndexRegionNMean Rankx2p-ValuePost Hoc Analysis
NDVIGwangyang (a)144319.7875.887 ***0.000b < a, c, e, d,
c < d
Muju (b)144241.16
Wonju (c)144374.97
Yeongwol (d)144428.61
Suwon (e)96308.72
CCCIGwangyang (a)144371.0674.507 ***0.000b < a, c, e, d,
c < d
Muju (b)144218.44
Wonju (c)144372.45
Yeongwol (d)144391.22
Suwon (e)96325.73
***: p-value < 0.001
Table 11. Development and validation of a monthly prediction model for chlorophyll estimation.
ModelRegression EquationJuneJulyAugustOctober
R2RMSER2RMSER2RMSER2RMSE
Ay = 122.78x − 25.949------0.813.41
By = 128.76x − 30.447----0.873.02--
Cy = 132.46x − 32.471--0.882.78----
Dy = 129.17x − 30.2430.723.33------
A: Models developed using index values from actual chlorophyll and vegetation index maps for June, July, and August. B: Models developed using index values from actual chlorophyll and vegetation index maps for June, July, and October. C: Models developed using index values from actual chlorophyll and vegetation index maps for June, August, and October. D: Models developed using index values from actual chlorophyll and vegetation index maps for July, August, and October.
Table 12. Correlation between the monthly chlorophyll measurements and predicted values.
ModelJuneJulyAugustOctober
APearson’s p-value---0.899 **
p-value---<0.0001
BPearson’s p-value--0.930 **-
p-value--<0.0001-
CPearson’s p-value-0.936 **--
p-value-<0.0001--
DPearson’s p-value0.847 **---
p-value<0.0001---
**: p-value < 0.01. A: Models developed using index values from actual chlorophyll and vegetation index maps for June, July, and August. B: Models developed using index values from actual chlorophyll and vegetation index maps for June, July, and October. C: Models developed using index values from actual chlorophyll and vegetation index maps for June, August, and October. D: Models developed using index values from actual chlorophyll and vegetation index maps for July, August, and October.
Table 13. Development and verification of regional prediction models for chlorophyll estimation.
ModelRegression EquationSuwonYeongwolWonjuMujuGwangyang
R2RMSER2RMSER2RMSER2RMSER2RMSE
Ey = 128.45x − 29.7780.842.47--------
Fy = 128.51x − 30.582--0.873.87------
Gy = 129.70x − 30.716----0.882.62----
Hy = 126.07x − 28.222------0.773.07--
Iy = 129.20x − 30.007--------0.893.47
E: Model developed using index values from actual chlorophyll and vegetation index maps in Gwangyang, Muju, Wonju, and Yeongwol. F: Model developed using index values from actual chlorophyll and vegetation index maps in Gwangyang, Muju, Wonju, and Suwon. G: Model developed using index values from actual chlorophyll and vegetation index maps in Gwangyang, Muju, Yeongwol, and Suwon. H: Model developed using index values from actual chlorophyll and vegetation index maps in Gwangyang, Wonju, Yeongwol, and Suwon. I: Model developed using index values from actual chlorophyll and vegetation index maps in Muju, Wonju, Yeongwol, and Suwon.
Table 14. Correlation analysis between chlorophyll measurements and predicted values by region.
ModelSuwonYeongwolWonjuMujuGwangyang
EPearson’s p-value0.916 **----
p-value0.000----
FPearson’s p-value-0.933 **---
p-value-0.000---
GPearson’s p-value--0.940 **--
p-value--0.000--
HPearson’s p-value---0.878 **-
p-value---0.000-
IPearson’s p-value----0.946 **
p-value----0.000
E, F, G, H, and I are the same as Table 13, **: p-value < 0.01.
Disclaimer/Publisher’s Note: The statements, opinions and data contained in all publications are solely those of the individual author(s) and contributor(s) and not of MDPI and/or the editor(s). MDPI and/or the editor(s) disclaim responsibility for any injury to people or property resulting from any ideas, methods, instructions or products referred to in the content.