Article

Design and Performance Testing of a Multi-Variety Forage Grass Mixed-Sowing Seed Metering Device

1
College of Mechanical and Electrical Engineering, Inner Mongolia Agricultural University, Hohhot 010018, China
2
Institute of Grassland Research, Chinese Academy of Agricultural Sciences, Hohhot 010013, China
*
Author to whom correspondence should be addressed.
Agriculture 2025, 15(16), 1788; https://doi.org/10.3390/agriculture15161788
Submission received: 26 July 2025 / Revised: 14 August 2025 / Accepted: 19 August 2025 / Published: 21 August 2025
(This article belongs to the Section Agricultural Technology)

Abstract

Traditional fluted roller seed metering devices exhibit unstable seeding rates during forage seed mixed sowing. To address this issue, a new seed metering device was designed based on the agronomic requirements of forage seed mixing and the structural characteristics of fluted roller mechanisms. The discrete element method (DEM) was employed to numerically simulate the movement of particles within the seed metering device. Single-factor experiments identified optimal parameter ranges for the seed metering device: a metering shaft speed of 10–20 r/min, a seed inlet width of 8–24 mm, and a seed outlet height of 10–20 mm. A response surface methodology (RSM) experiment was then designed using Design-Expert 13 software. The results yielded optimal operating parameters: a metering shaft speed of 18.9 r/min, a seed inlet width of 9.3 mm, and a seed outlet height of 14.4 mm. The field experiment validated the seeding performance with the optimal parameter combination. The coefficient of variation (CV) for the first-class seed (CV1) was 4.16%, and for the second-class seed (CV2) it was 2.98%, both of which met the requirements for mixed sowing of forage.

1. Introduction

Grasslands are a vital ecological system and natural resource in China, playing a fundamental and strategic role in safeguarding national ecological security, promoting sustainable economic and social development, and increasing the income of farmers and herders [1]. The introduction of forage seed mixing technology and the application of mechanized grassland equipment can effectively increase forage yield and improve forage quality, thereby fostering a positive cycle in the grassland ecological environment. As a critical stage in forage production, the quality of seeder operations directly affects seedling emergence and growth, which in turn influences both the yield and quality of forage [2,3,4]. Therefore, improving the operational quality of forage seeders is a key measure for enhancing forage production and quality.
Currently, forage sowing is predominantly carried out using drill seeding [5]. Representative international models include the John Deere 1590 no-till drill from the United States, the Great Plains 1006NT no-till drill, and the 5500HD Air Drill no-till seeder produced by Canada’s Flexi-coil. After years of technological development, foreign agricultural machinery manufacturers have created drill seeders with excellent performance and high efficiency. However, their high costs have limited widespread adoption in China [6,7,8].
Domestic drill seeders primarily utilize traditional external groove-wheel seed metering devices, which can meet basic drill seeding requirements but still suffer from issues such as seed clumping and poor seeding uniformity [9,10]. To address these problems, researchers have focused on optimizing the structure of the seed metering device based on the groove-wheel design to enhance seeding performance. Yu Yongchang et al. significantly improved the performance of the external groove-wheel seed metering device by modifying its seed cleaning and delivery mechanisms [11]. Li Mingsheng et al. conducted discrete element method (DEM) simulations to optimize the structure of a buckwheat-specific groove-wheel seed metering device, effectively improving sowing quality [12]. Yin Wenqing et al. designed a pneumatic-groove combined precision seed metering device, which employs a primary groove-wheel mechanism followed by a secondary pneumatic system to address performance issues caused by large variations in seed properties [13]. Zhen Juan et al. developed a pneumatic conical-disk seed metering device based on the principles of dragged agitation seed filling, vacuum suction, and gravity-driven seed delivery, solving the problems of disordered seed flow and unstable output typical of groove-wheel devices [14]. Zhang Chunling et al. proposed an interlaced-tooth precision seed metering device for wheat, where staggered teeth guide seeds in an orderly manner, thereby improving distribution uniformity [15,16]. Although these studies have largely resolved the issues associated with groove-wheel seed metering devices, they mainly target single-crop seeding. For multi-species forage mixtures, which often involve seeds with significant differences in size and shape, stability in seed metering remains a major challenge. Therefore, developing a seed metering device suitable for multi-species forage mixtures has become an urgent need.
In the design and development of seed metering devices, it is difficult to accurately obtain key physical parameters such as force, velocity, and displacement through physical experiments. However, these parameters are critical for the design and optimization of seed metering devices [17,18,19,20]. Numerical simulation using the discrete element method (DEM) offers an effective solution to these challenges [21,22,23]. As a result, researchers have increasingly adopted DEM to simulate the working process of seed metering devices. For instance, Li Zhaodong et al. used the DEM to simulate the particle motion during the seed filling process of a variable-aperture-wheel seed metering device for wheat, identifying the optimal seed filling state [24]. Wang Jianxiao et al. simulated the operation of a groove-wheel seed metering device using the DEM and optimized key structural parameters through response surface methodology [25]. By analyzing the motion characteristics of seed metering devices through simulation, it becomes possible to accurately determine critical design parameters [26,27,28,29]. Based on this, the present study employs DEM to conduct simulation experiments.
In summary, based on the agronomic requirements of forage seed mixtures and the structural characteristics of groove-wheel mechanisms, a spiked-tooth combined seed metering device for forage mixture sowing was designed. A technical approach for compartmentalized seed metering was proposed, where eight types of grass seeds were divided into two categories and metered separately by two seeders, ultimately achieving uniform mixed sowing of the grass seeds. The discrete element method (DEM) was employed to numerically simulate the motion characteristics of particles within the seed metering device, with a detailed analysis of how factors such as metering shaft speed, seed inlet width, and seed outlet height affect the dynamic behavior of seed particles. The operational parameters of the spiked-tooth combined seed metering device were optimized using response surface methodology, and field validation tests were conducted to verify its performance.

2. Materials and Methods

2.1. Structure and Working Principle of the Mixed-Forage Seed Metering Device

2.1.1. Structure of the Mixed-Forage Seed Metering Device

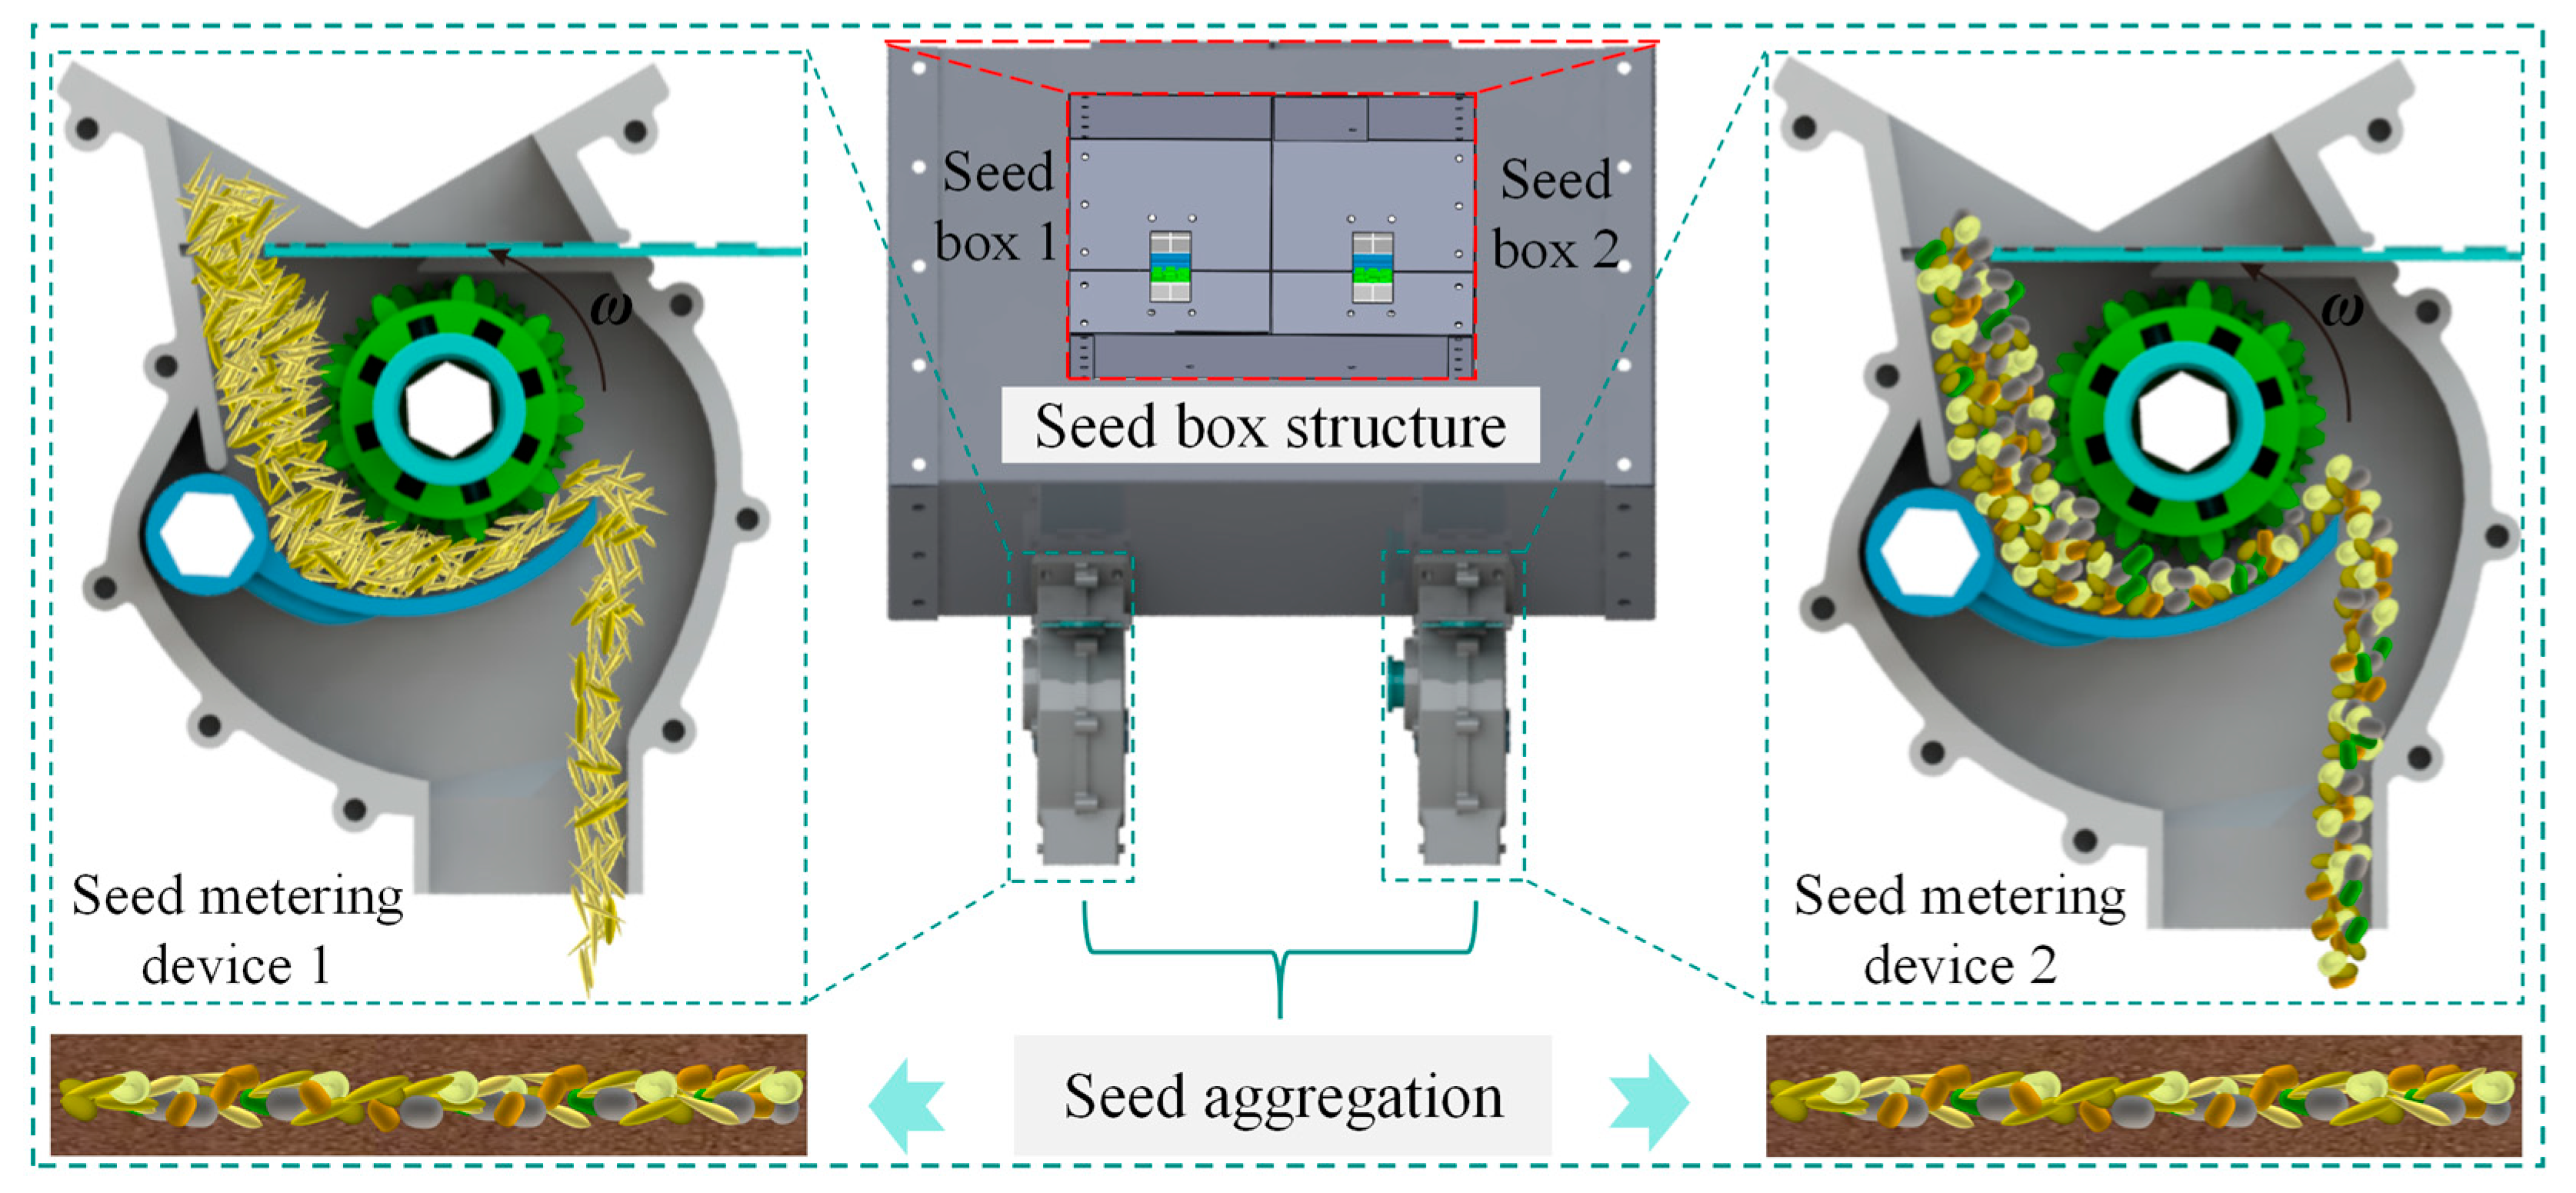
The mixed-seeding device mainly consists of a seed box, side baffles, a seed metering shaft, a seed metering tongue adjustment shaft, a seed metering device, and a seed scraper, as shown in Figure 1. Among these, the seed metering device is the core component of the mixed-seeding device, composed of a front shell, seed metering tongue, seed metering baffle, small seed metering wheel, large seed metering wheel, limiter, and rear shell. The seed metering wheel has three structures: (a) nail wheel structure, (b) gear structure, and (c) nail-and-gear combination structure. To address the issue of uneven seeding during the mixing process of eight types of forage seeds, the seed box is divided using baffles to separate the seeds based on their shape. Seeds with similar shapes, such as sheepgrass, fescue, and oats, are classified as one kind of seed, while alfalfa, sand awn, Daurian lespedeza, barberry, and sheepbrush seeds are classified as the second kind of seed. Two seed metering devices are used to distribute the seeds, and ultimately, both kinds of seeds converge into the same furrow through a seed guide pipe.

2.1.2. The Working Principle of the Mixed-Seeding Seed Metering Device

Shown in Figure 2 is a schematic diagram of the working principle of the mixed-seeding device. During operation, one kind of seed is loaded into seed box 1 and metered by seed metering device 1. Seeds of the second kind are placed into seed box 2 and metered by seed metering device 2. The seeds enter the interior of the seed metering device through the gap (seed inlet) between the seed metering baffle and the seed metering device housing, relying on gravity, and are stored in the seed metering tongue. The large and small seed metering wheels rotate along with the seed metering shaft, and the nail-and-tooth structure on the seed metering wheels agitates the seeds. The nails apply positive pressure on the seeds, pushing them away from the seed metering tongue, and they exit through the seed metering device outlet. Finally, under the action of the seed guide pipe, the seeds from both seed metering devices converge in the same furrow, completing the seeding operation.

2.2. Design of Key Components

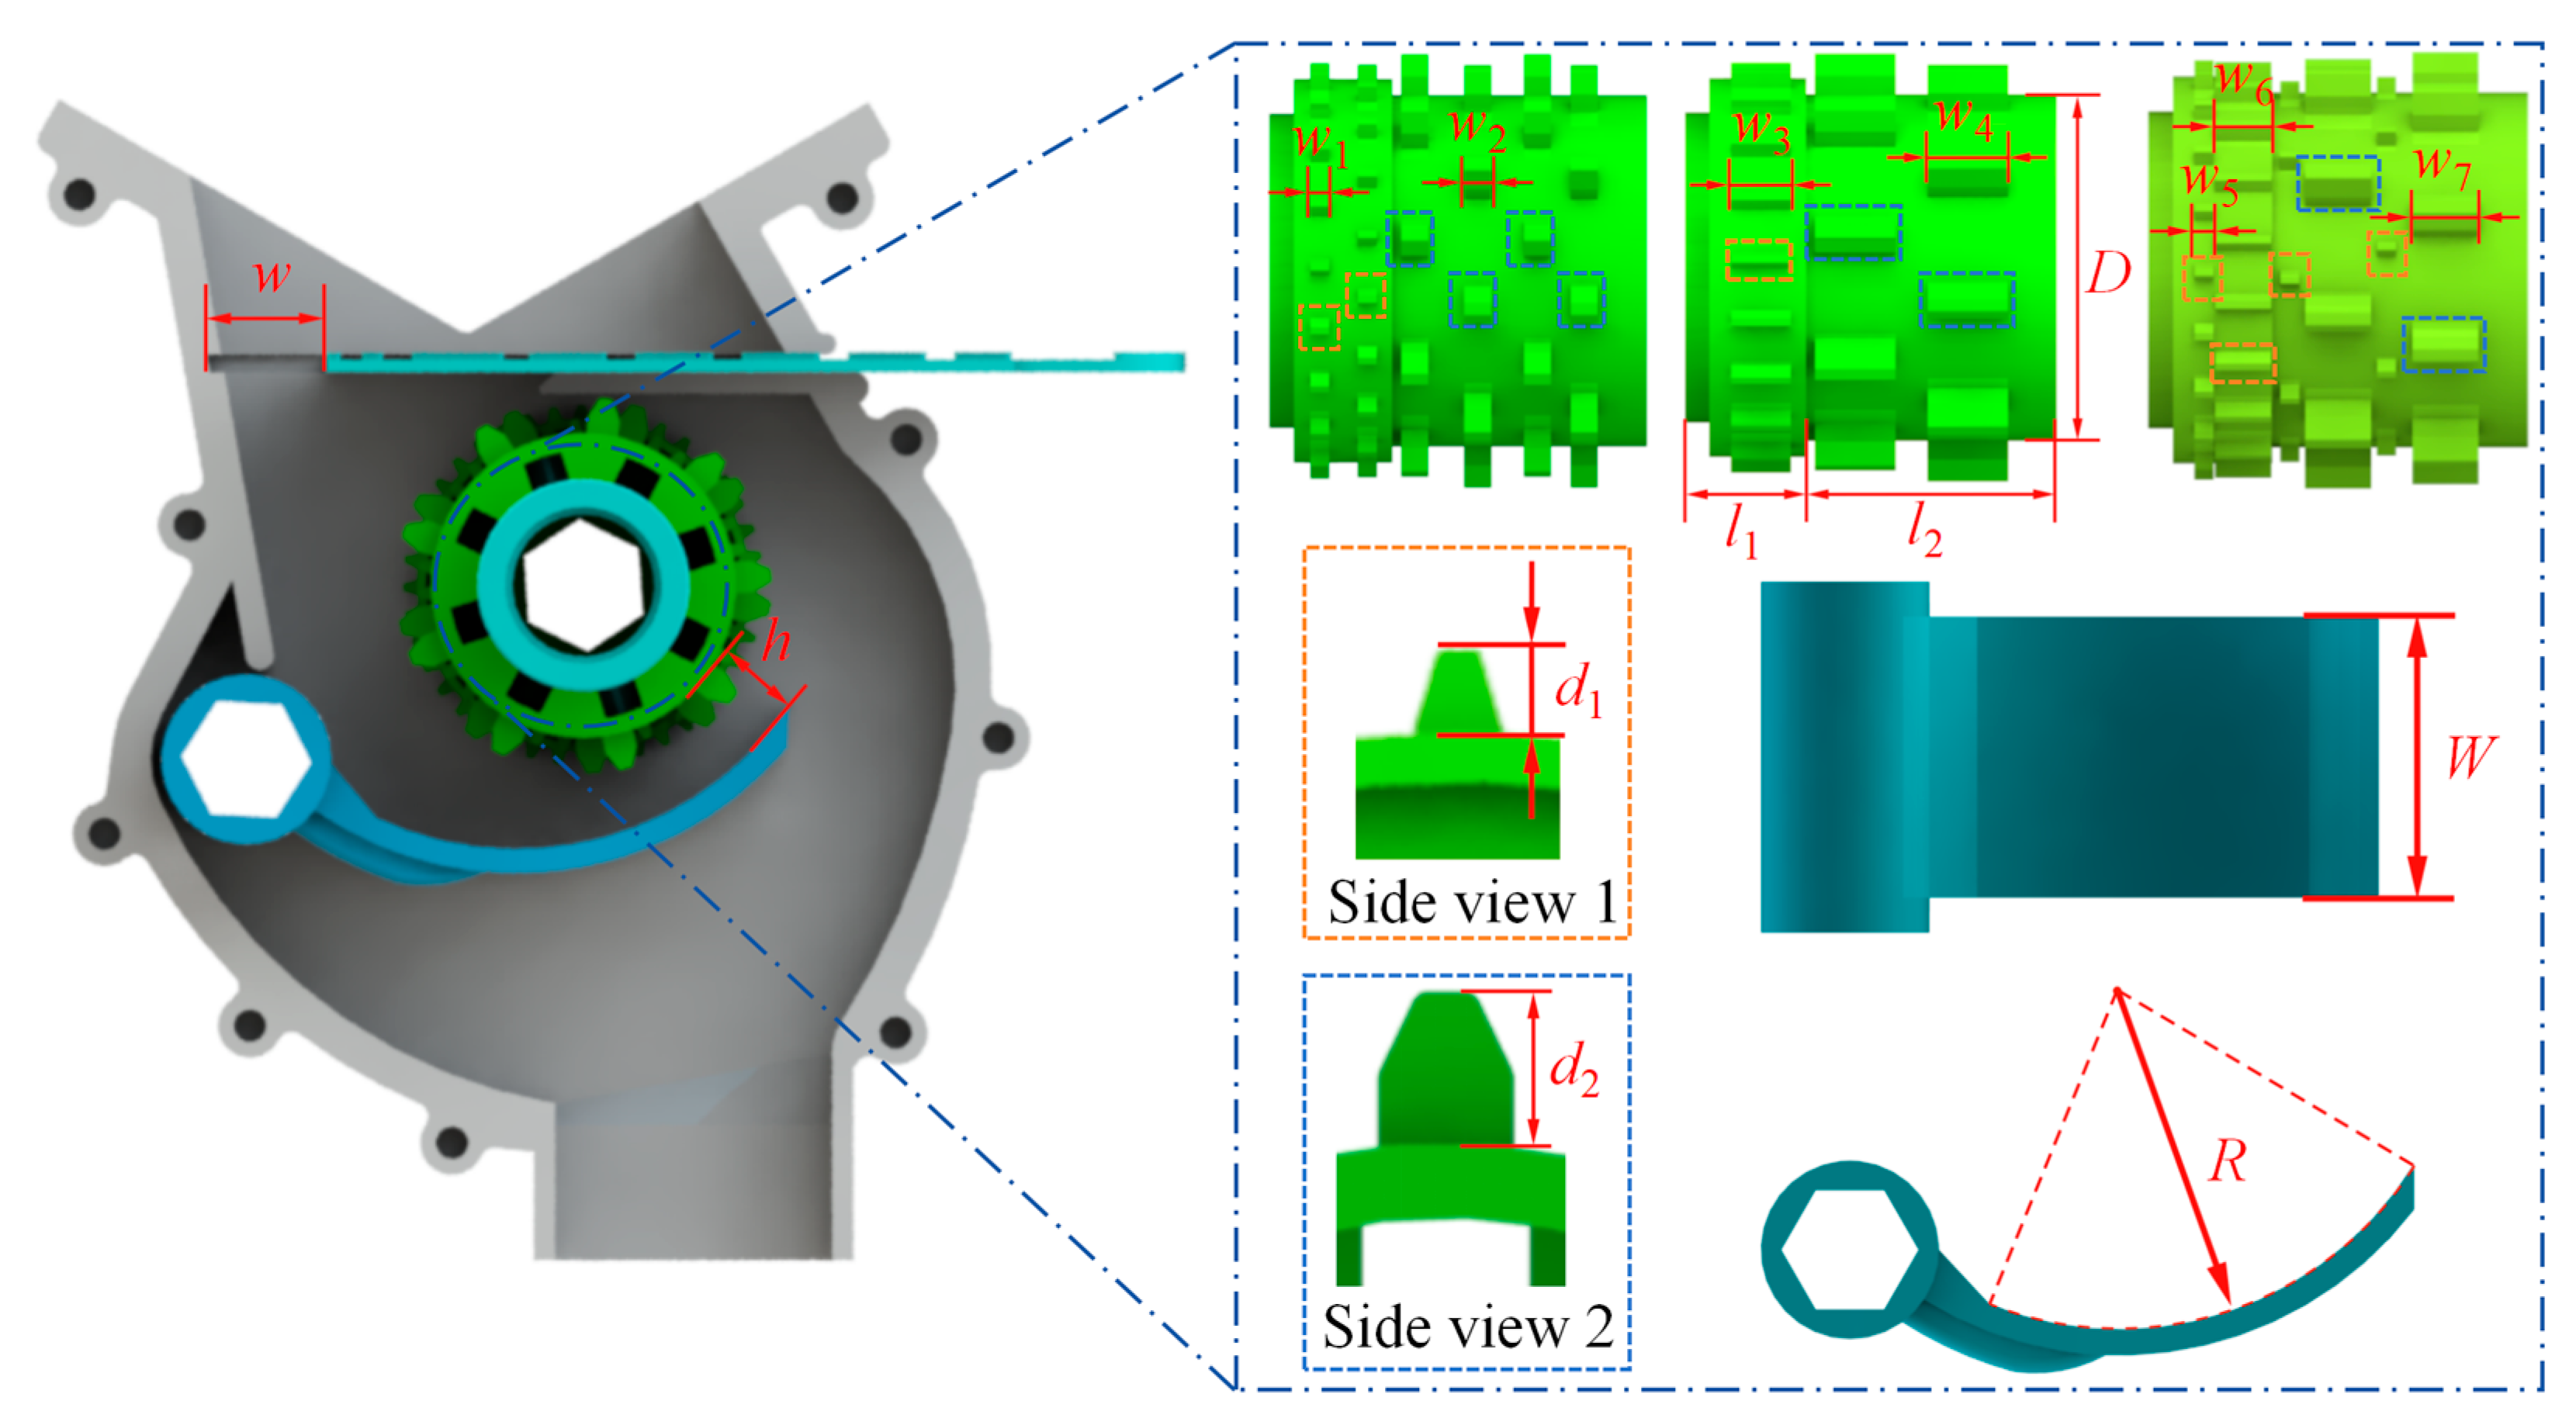
In this study, three types of seed metering wheel structures were designed: nail wheel type, gear wheel type, and nail–tooth combination type, as shown in Figure 3. For different levels of grassland degradation, the seed metering wheels were set as large and small seed metering wheels. For severely degraded grasslands, both the large and small seed metering wheels rotate simultaneously, which can increase the seeding rate of forage seeds. For grasslands with less severe degradation, only the small seed metering wheel rotates, which effectively saves seeds.
To improve the uniformity of the forage seed seeding rate, the main structural parameters of the seed metering wheel were designed based on the “Agricultural Machinery Design Handbook.” The diameter of the seed metering wheel is D = 46 mm, with the length of the small seed metering wheel being l1 = 15 mm and the length of the large seed metering wheel being l2 = 33 mm. The width of the small nails is w1 = w5 = 2.3 mm, the width of the large nails is w2 = 3.3 mm, the width of the small teeth is w3 = w5 = 6.8 mm, and the widths of the large teeth are w4 = 10 mm and w7 = 8 mm. The height difference between the small nails and teeth is d1 = 2 mm, while for the large nails and teeth, it is d2 = 5 mm. The width of the seed metering tongue is W = 40 mm, and the radius of the seed metering tongue is R = 46 mm.
The seeding rate Q of the seed metering device can be calculated according to Formula (1).
q = π D w a ρ a 0 f q t + λ Q = q n
where q is the seeding rate per revolution of the seed metering wheel, g/r; D is the diameter of the seed metering wheel, mm; wa is the width of the nail wheel, mm; ρ is the average seed density, g/cm3; a0 is the effective seed displacing coefficient of the seed nails; fq is the cross-sectional area of the nail wheel, mm2; t is the pitch of the seed nails, mm; and λ is the characteristic coefficient of the driving layer.
From this, it can be concluded that when the seed inlet width w and seed outlet height h are fixed, the seeding rate is directly proportional to the rotation speed of the seed metering wheel.

2.3. Force Analysis

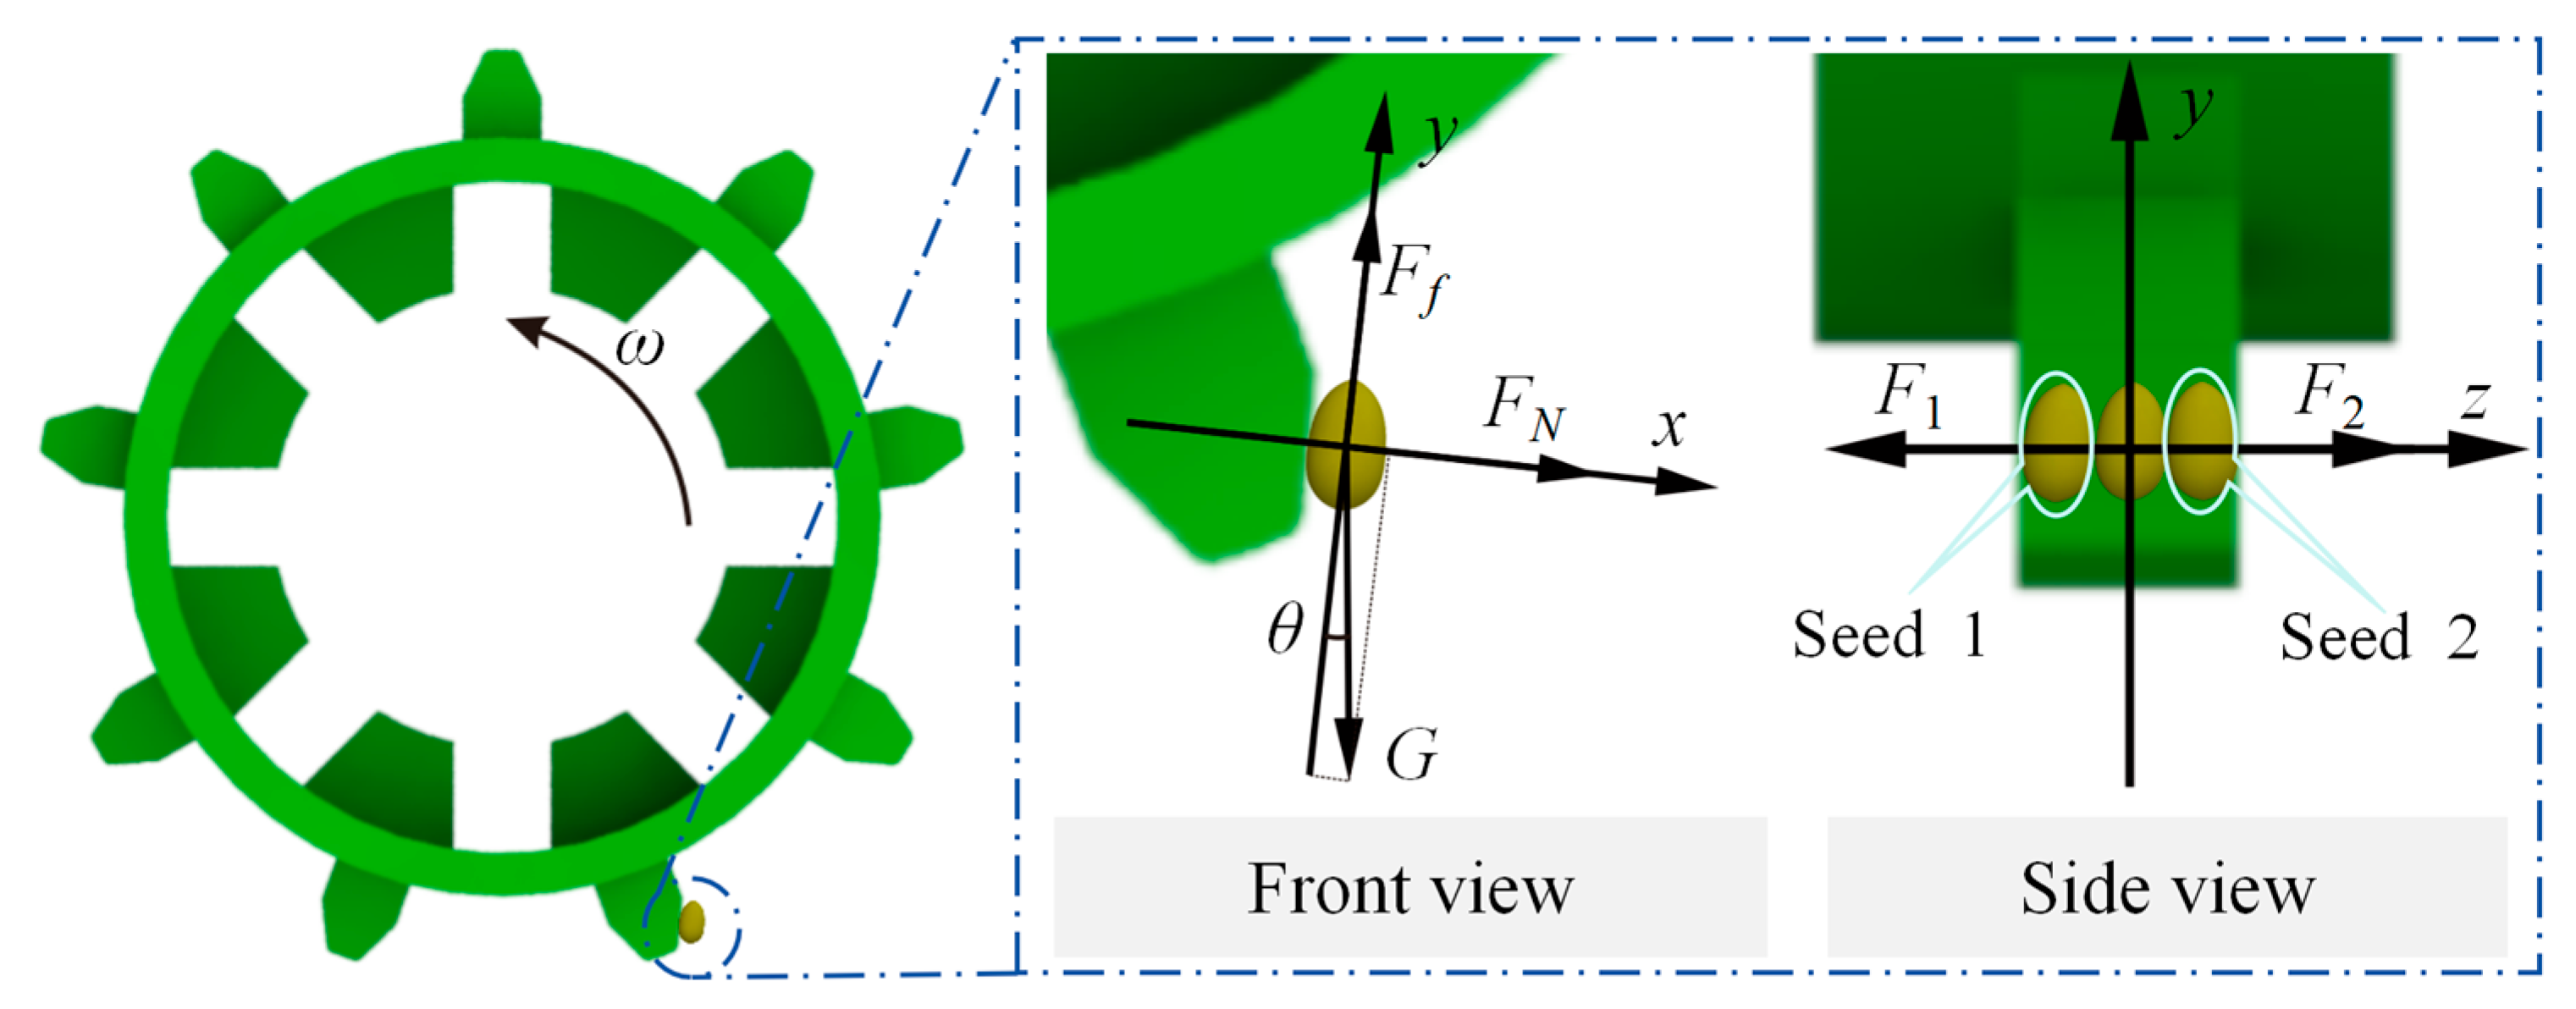
The seeds enter the seed metering tongue, and the upper layer of seeds rotates with the seed metering wheel. Taking the seeds displaced by the seed metering wheel nails as the object of study, a 3D Cartesian coordinate system is established. The x-axis is perpendicular to the tooth surface direction, the y-axis is parallel to the tooth surface direction, and the z-axis is parallel to the tooth surface and perpendicular to the y-axis. The seeds are subjected to gravity, support force, friction, and inter-seed pressure, as shown in Figure 4.
F x = F N + G cos θ F y = F f G sin θ F z = F 2 F 1
where ω is the rotation speed of the seed metering device, r/min; G is the gravitational force acting on the seeds, N; Ff is the frictional force acting on the seeds, N; θ is the angle between the y-axis and the direction of gravity, °; FN is the support force of the nail teeth on the seeds, N; F1 is the support force of seed 2 on seed 1, N; and F2 is the support force of seed 1 on seed 2, N.
From this, it can be concluded that in the y-direction, the frictional force acting on the seeds and the gravitational force component cancel each other out. In the z-direction, the support force of seed 1 on seed 2 and the support force of seed 2 on seed 1 cancel each other out. Therefore, the seeds are in a balanced state in both the y- and z-directions. In the x-direction, the seeds are subjected to the support force in the same direction as the gravitational force component, causing the seeds to move with the nail teeth.

2.4. Simulation of the Seed Metering Device

2.4.1. Modeling of the Seed Metering Device

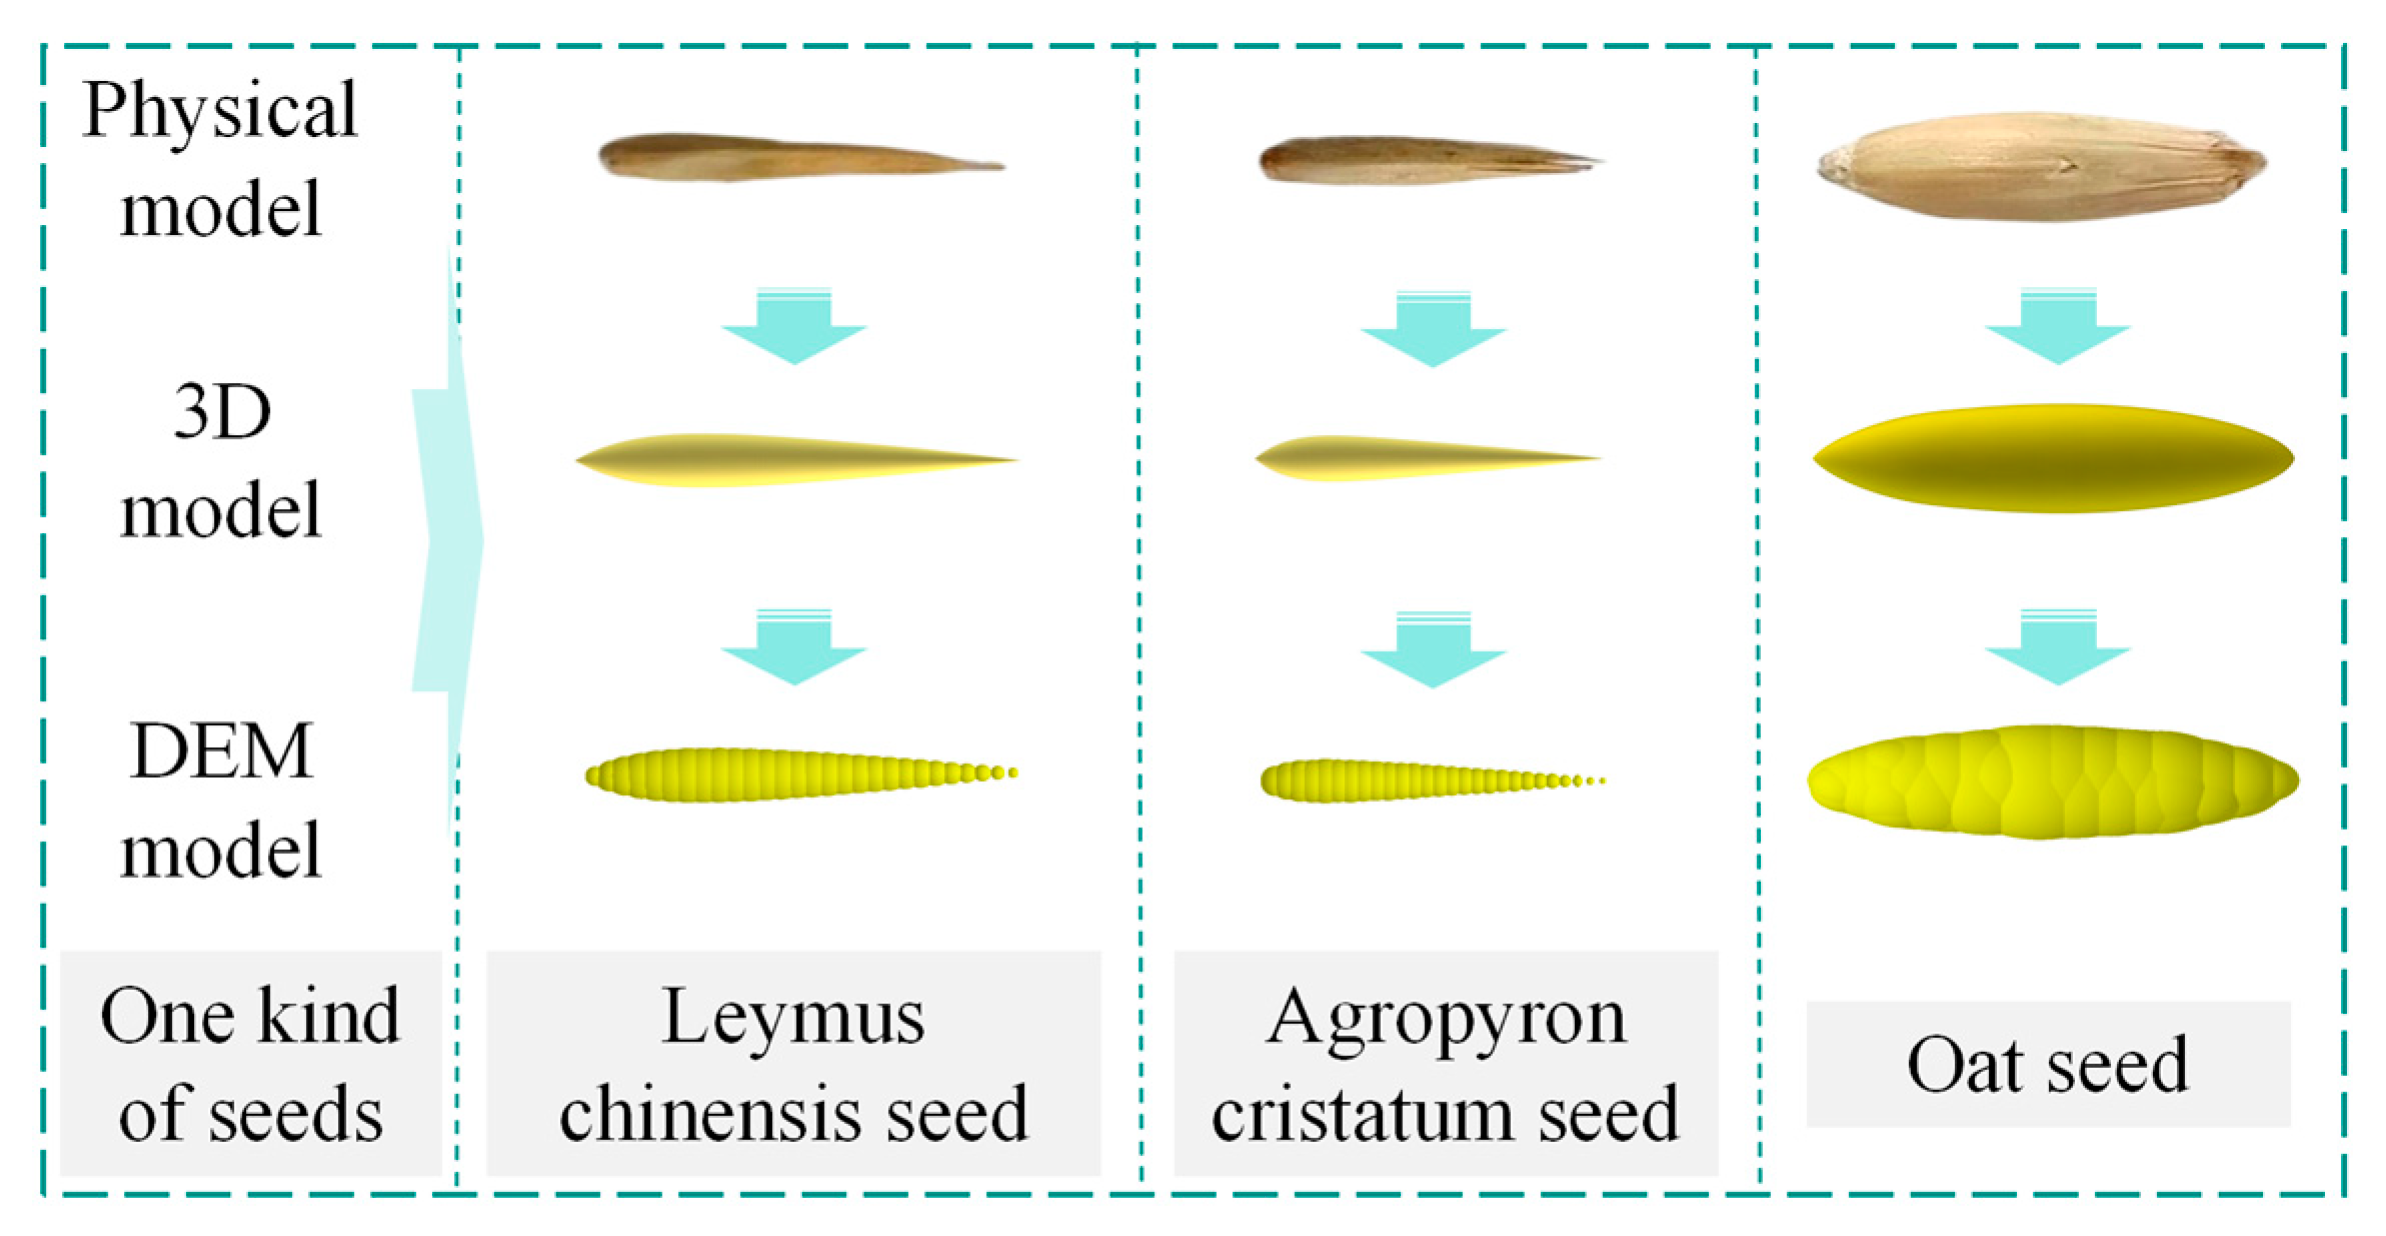
The seeds used in this study are divided into two kinds of seeds. The first kind of seed includes Nongqing 11 Leymus chinensis seed, Mengnong No. 1 Agropyron cristatum seed, and Mengyan No. 1 oat seeds, as shown in Figure 5. Due to the small size of the seeds and the minimal differences between them, it is assumed during the simulation that each type of seed has the same external dimensions. The seeds are three-dimensionally modeled using SolidWorks 2018 software, and their 3D models are converted into step format. The step format oat model is then imported into the EDEM simulation software for filling.
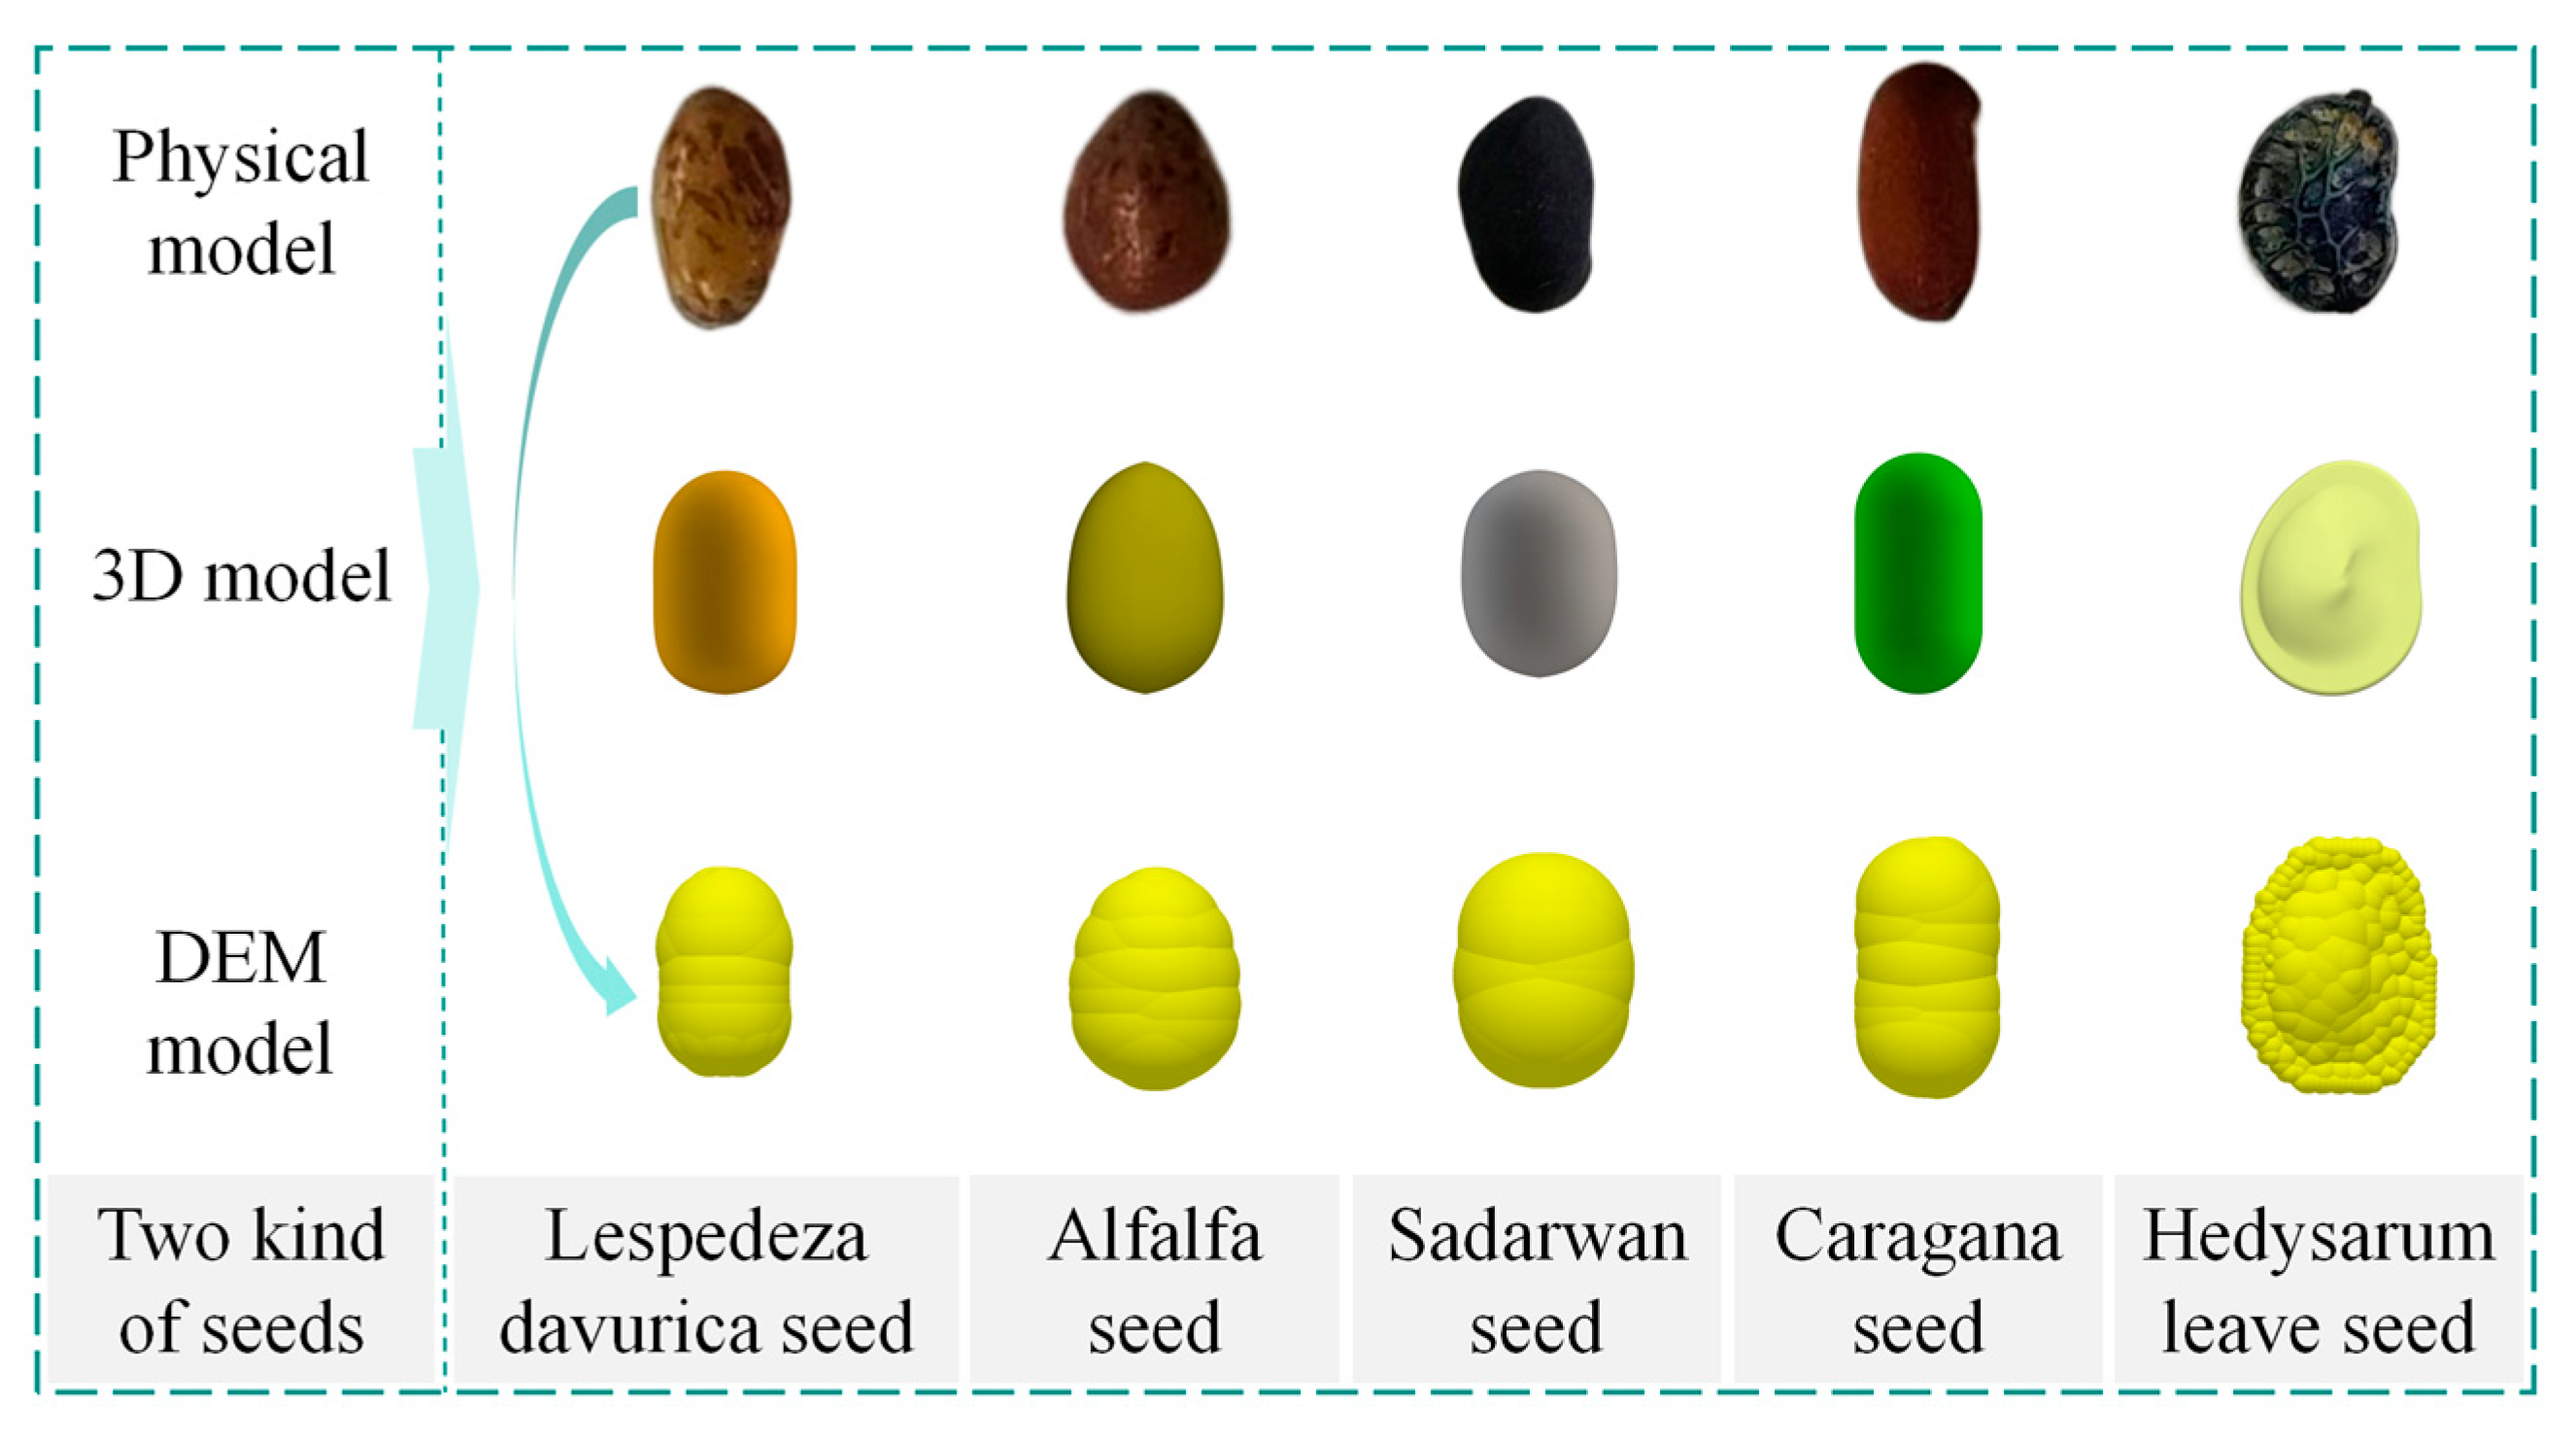
The second kind of seed includes DHZZ-87 daurian lespedeza, Banongke No. 1 alfalfa seed, Shanxi sadarwan seeds, NT-22 caragana seeds, and Mongolian hedysarum leave seeds, as shown in Figure 6. Due to the small size of the seeds and the minimal differences between them, it is assumed during the simulation that each type of seed has the same external dimensions. The filling process is carried out using the aforementioned method to obtain the simulation model.
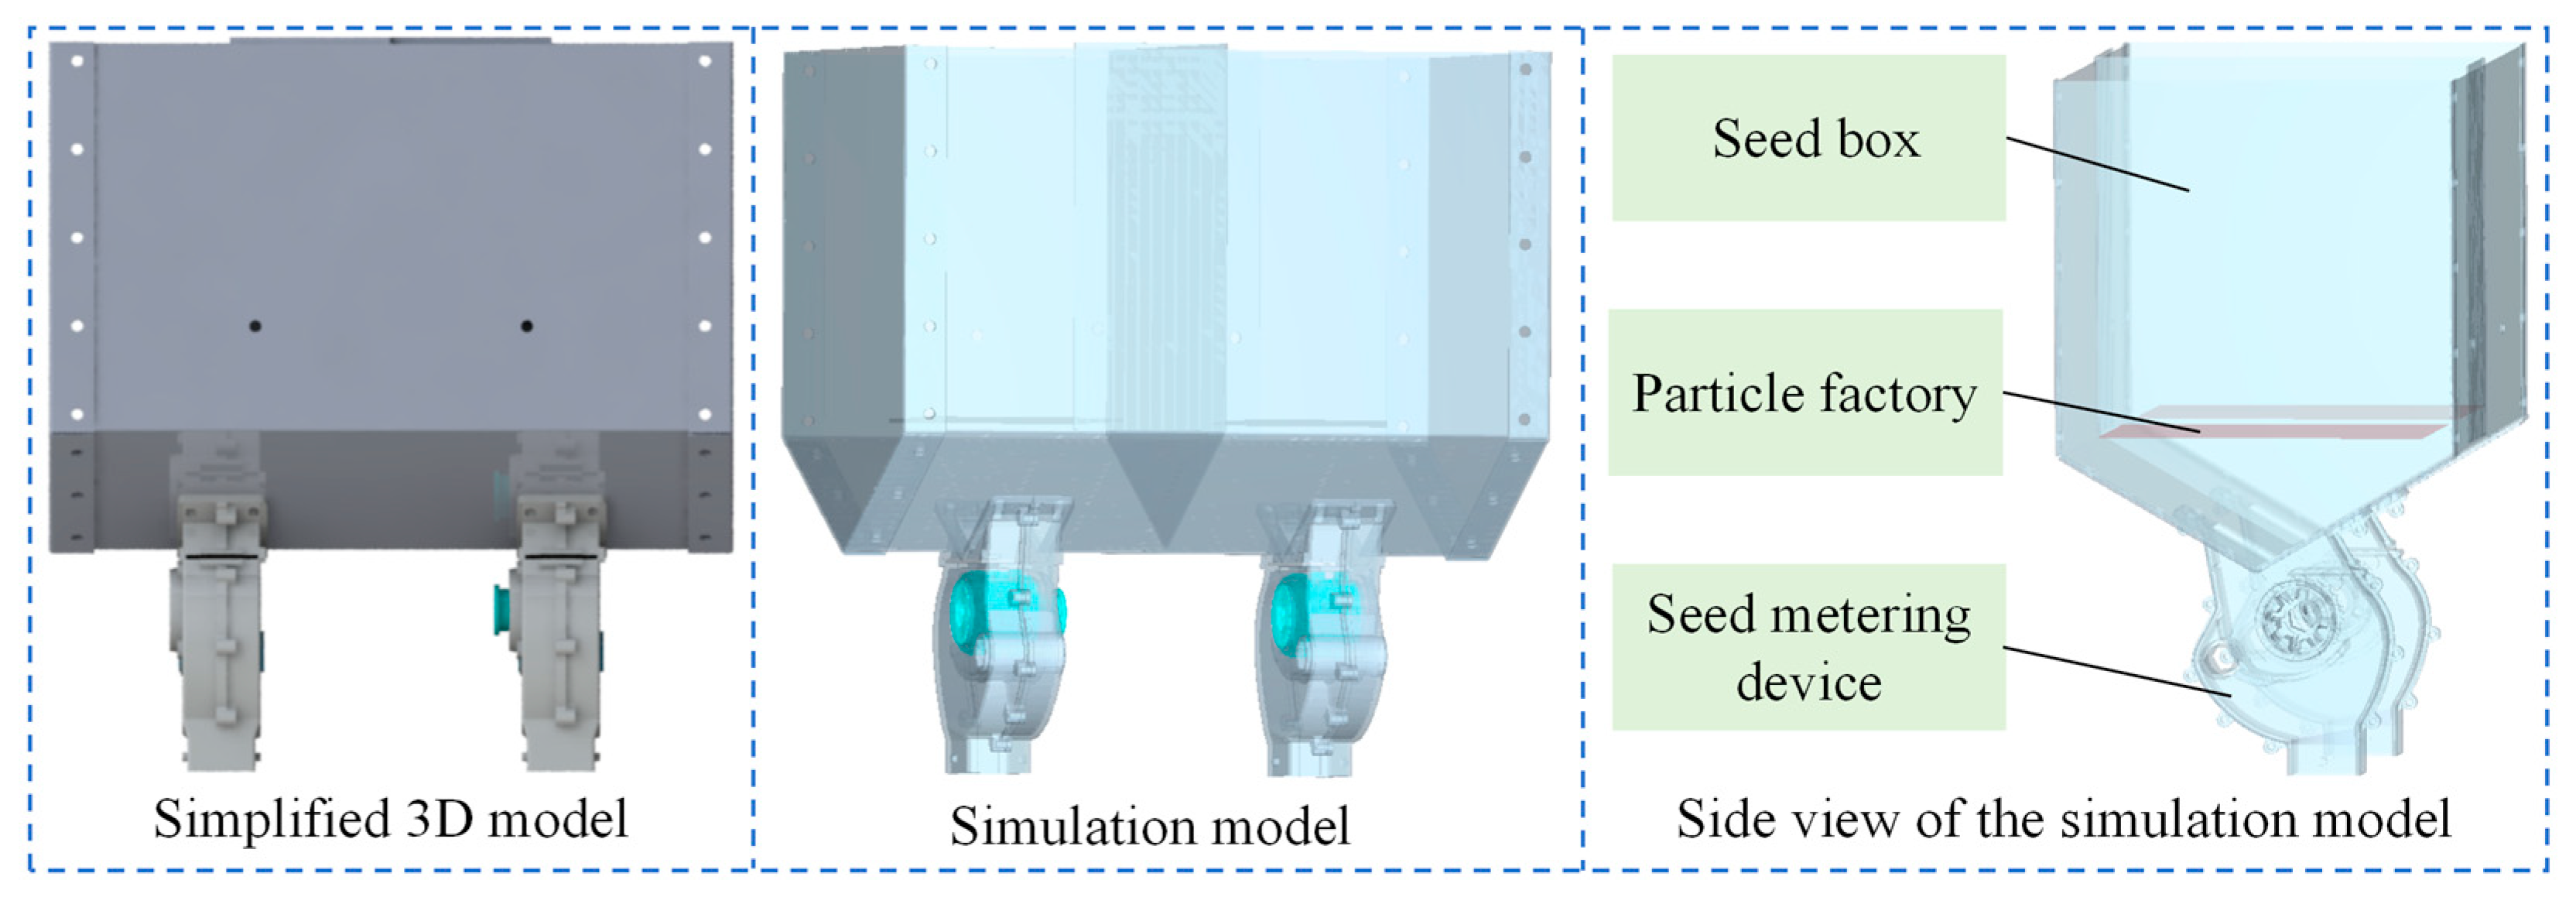
To reduce simulation time, the 3D model of the forage mixed-seeding seed metering device was simplified using SolidWorks 2018 software, retaining only the seed box and seed metering device for simulation. Using the aforementioned method, the model was imported into the EDEM 2020 simulation software, and the particle factory was set up at the upper end of the seed inlet of the seed metering device, as shown in Figure 7.

2.4.2. Simulation Parameter Settings

The simulation parameters for this study were determined based on prior studies [30,31,32,33] and the previous experimental results of the research group. Since the contact parameters between different types of seeds are similar, it is assumed that the contact parameters for each type of seed are the same, as shown in Table 1. The particle factory generates a total of 1 kg of seeds, with 0.04 kg of Leymus chinensis seeds, 0.22 kg of Agropyron cristatum seeds, 0.06 kg of oat seeds, 0.12 kg of Lespedeza davurica seeds, 0.2 kg of alfalfa seeds, 0.12 kg of sadarwan seeds, 0.09 kg of caragana seeds, and 0.15 kg of hedysarum leave seeds. The total simulation time is 5 s, with data recorded every 0.01 s.

2.4.3. One-Factor Experiment

Through theoretical analysis, it is known that the structural parameters of the seed metering wheel nails directly affect the force on the seeds, which in turn impacts the seeding rate. Therefore, this study takes the three structures of the seed metering wheel—nail wheel type (a), gear wheel type (b), and nail–tooth combination type (c)—as experimental factors, with seed dynamic performance (average speed and average pressure) as the experimental indicators, to conduct simulation tests. The accuracy of the simulation results is verified through physical validation experiments, which also help determine the structural form with the best working performance.
Based on the optimal seed metering wheel structure determined from the experiment, one-factor simulation tests are conducted. The metering shaft speed directly affects the average seed speed, thereby influencing the seeding rate. The seed inlet width directly affects the number of seeds in the seed metering tongue; an excessive number of seeds can lead to a higher average seed pressure, causing blockages, while too few seeds can cause large fluctuations in the contact force between the seed metering wheel and the seeds, affecting seeding quality. The seed outlet height directly impacts the contact force between the seed metering wheel and the seeds, thus influencing seeding quality. Therefore, this study uses metering shaft speed, seed inlet width, and seed outlet height as experimental factors to conduct one-factor experiments, as shown in Table 2.

2.5. Bench Test

2.5.1. Test Method

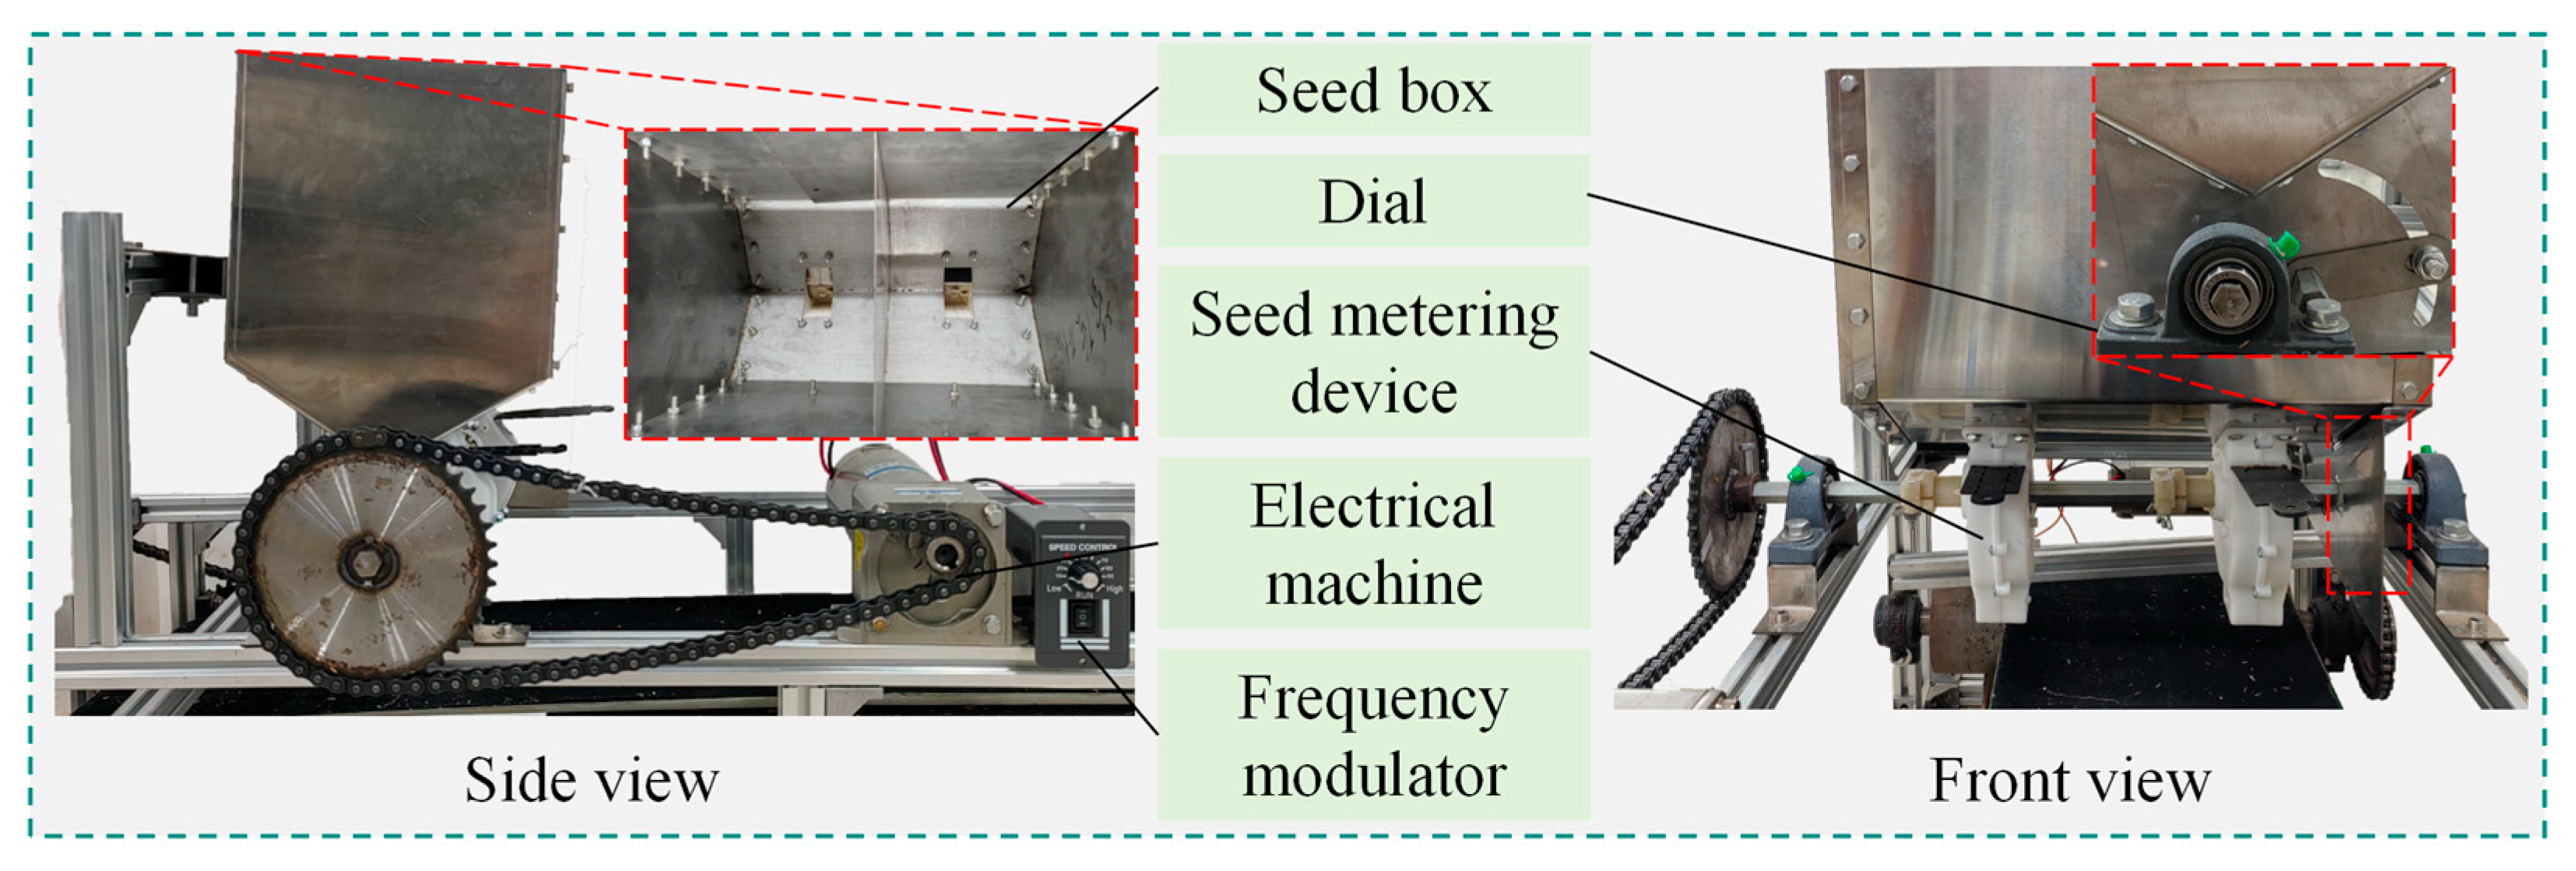
The test was conducted from 10 April 2025 to 30 April 2025 at the Seed Metering Performance Laboratory of the College of Mechanical and Electrical Engineering, Inner Mongolia Agricultural University. The bench test was carried out using the experimental platform built by the research group, as shown in Figure 8. The coefficient of variation (CV) of seeding consistency was used as the evaluation index. During the test, the seed mass for each seed metering device was recorded every 60 s, and the CV was calculated using the following formula:
x ¯ = n i x n i S = 1 n 1 X x ¯ 2 C V = S x ¯ × 100 %
where x ¯ 1 is the seed mass within each time interval, kg; S1 is the standard deviation; ni is the number of occurrences of the given x1 value, counts; and n1 is the total number of samples.

2.5.2. Test Design

To verify the accuracy of the simulation results, physical tests are conducted with metering shaft speed, seed inlet width, and seed outlet height as the single-factor experimental variables. To further investigate whether there are interactive effects among these three factors and how their interactions affect the seed metering device’s seeding performance, a response surface experiment is conducted using metering shaft speed, seed inlet width, and seed outlet height as the experimental factors. The factor coding is shown in Table 3.

2.6. Field Test

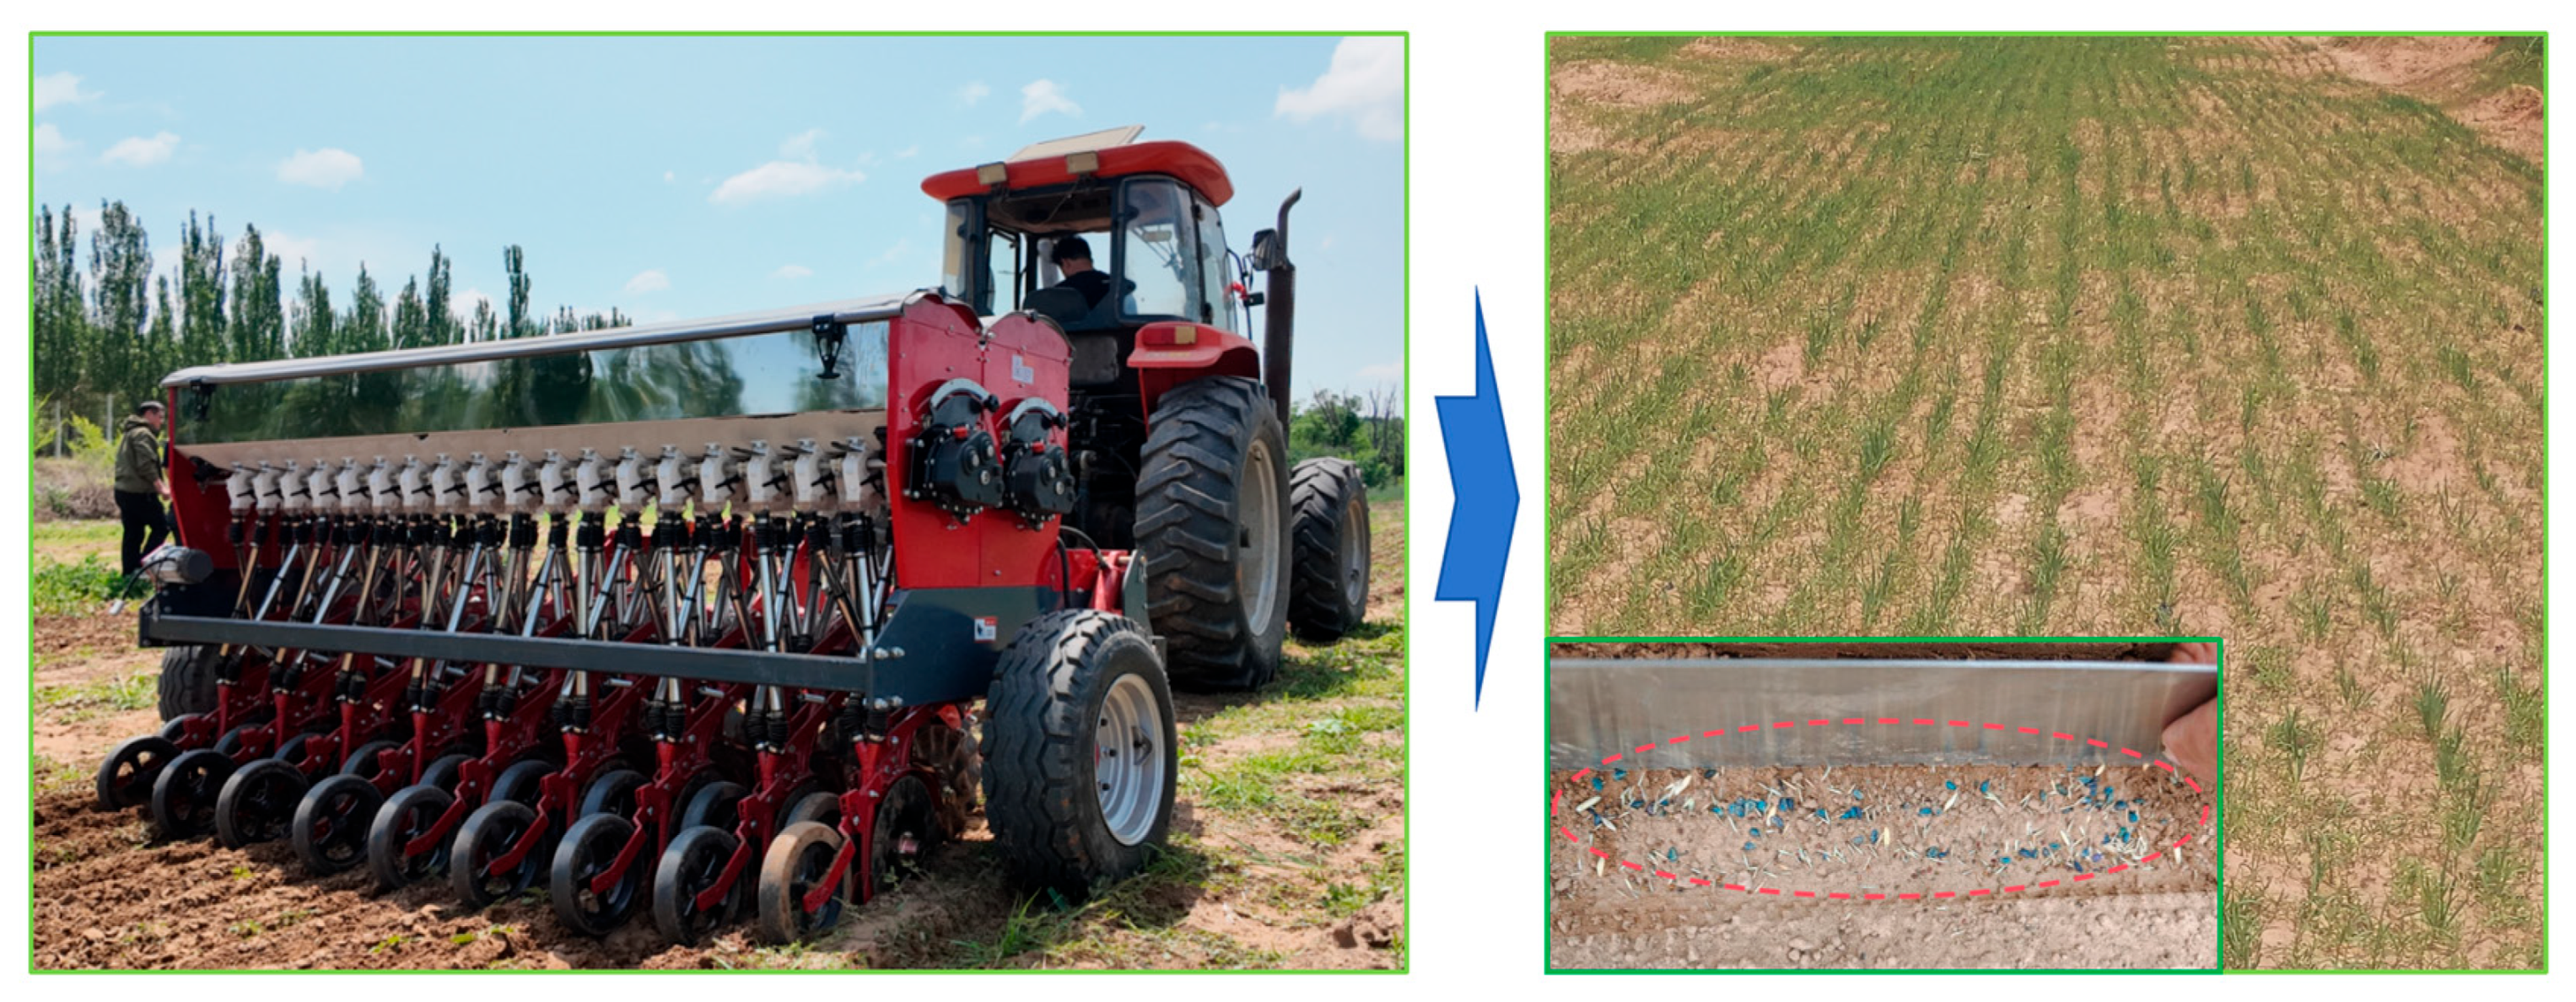
The test was conducted on 20 May 2025, in the degraded and desertified grassland areas of Hohhot City and Helinger County, Inner Mongolia Autonomous Region, as shown in Figure 9. The power required for the seeder should be greater than 73.55 kw. The test was performed in the stable working area of the seeder, with a total of 5 sets of experimental data recorded. The CV of the first kind of seed and second kind of seed was calculated. Based on the results of the response surface experiment, the field test was carried out under the conditions of a metering shaft speed of 18.9 r/min, a seed inlet width of 9.3 mm, and a seed outlet height of 14.4 mm, as shown in Figure 10.

3. Results and Discussion

3.1. Seed Metering Device Movement Process

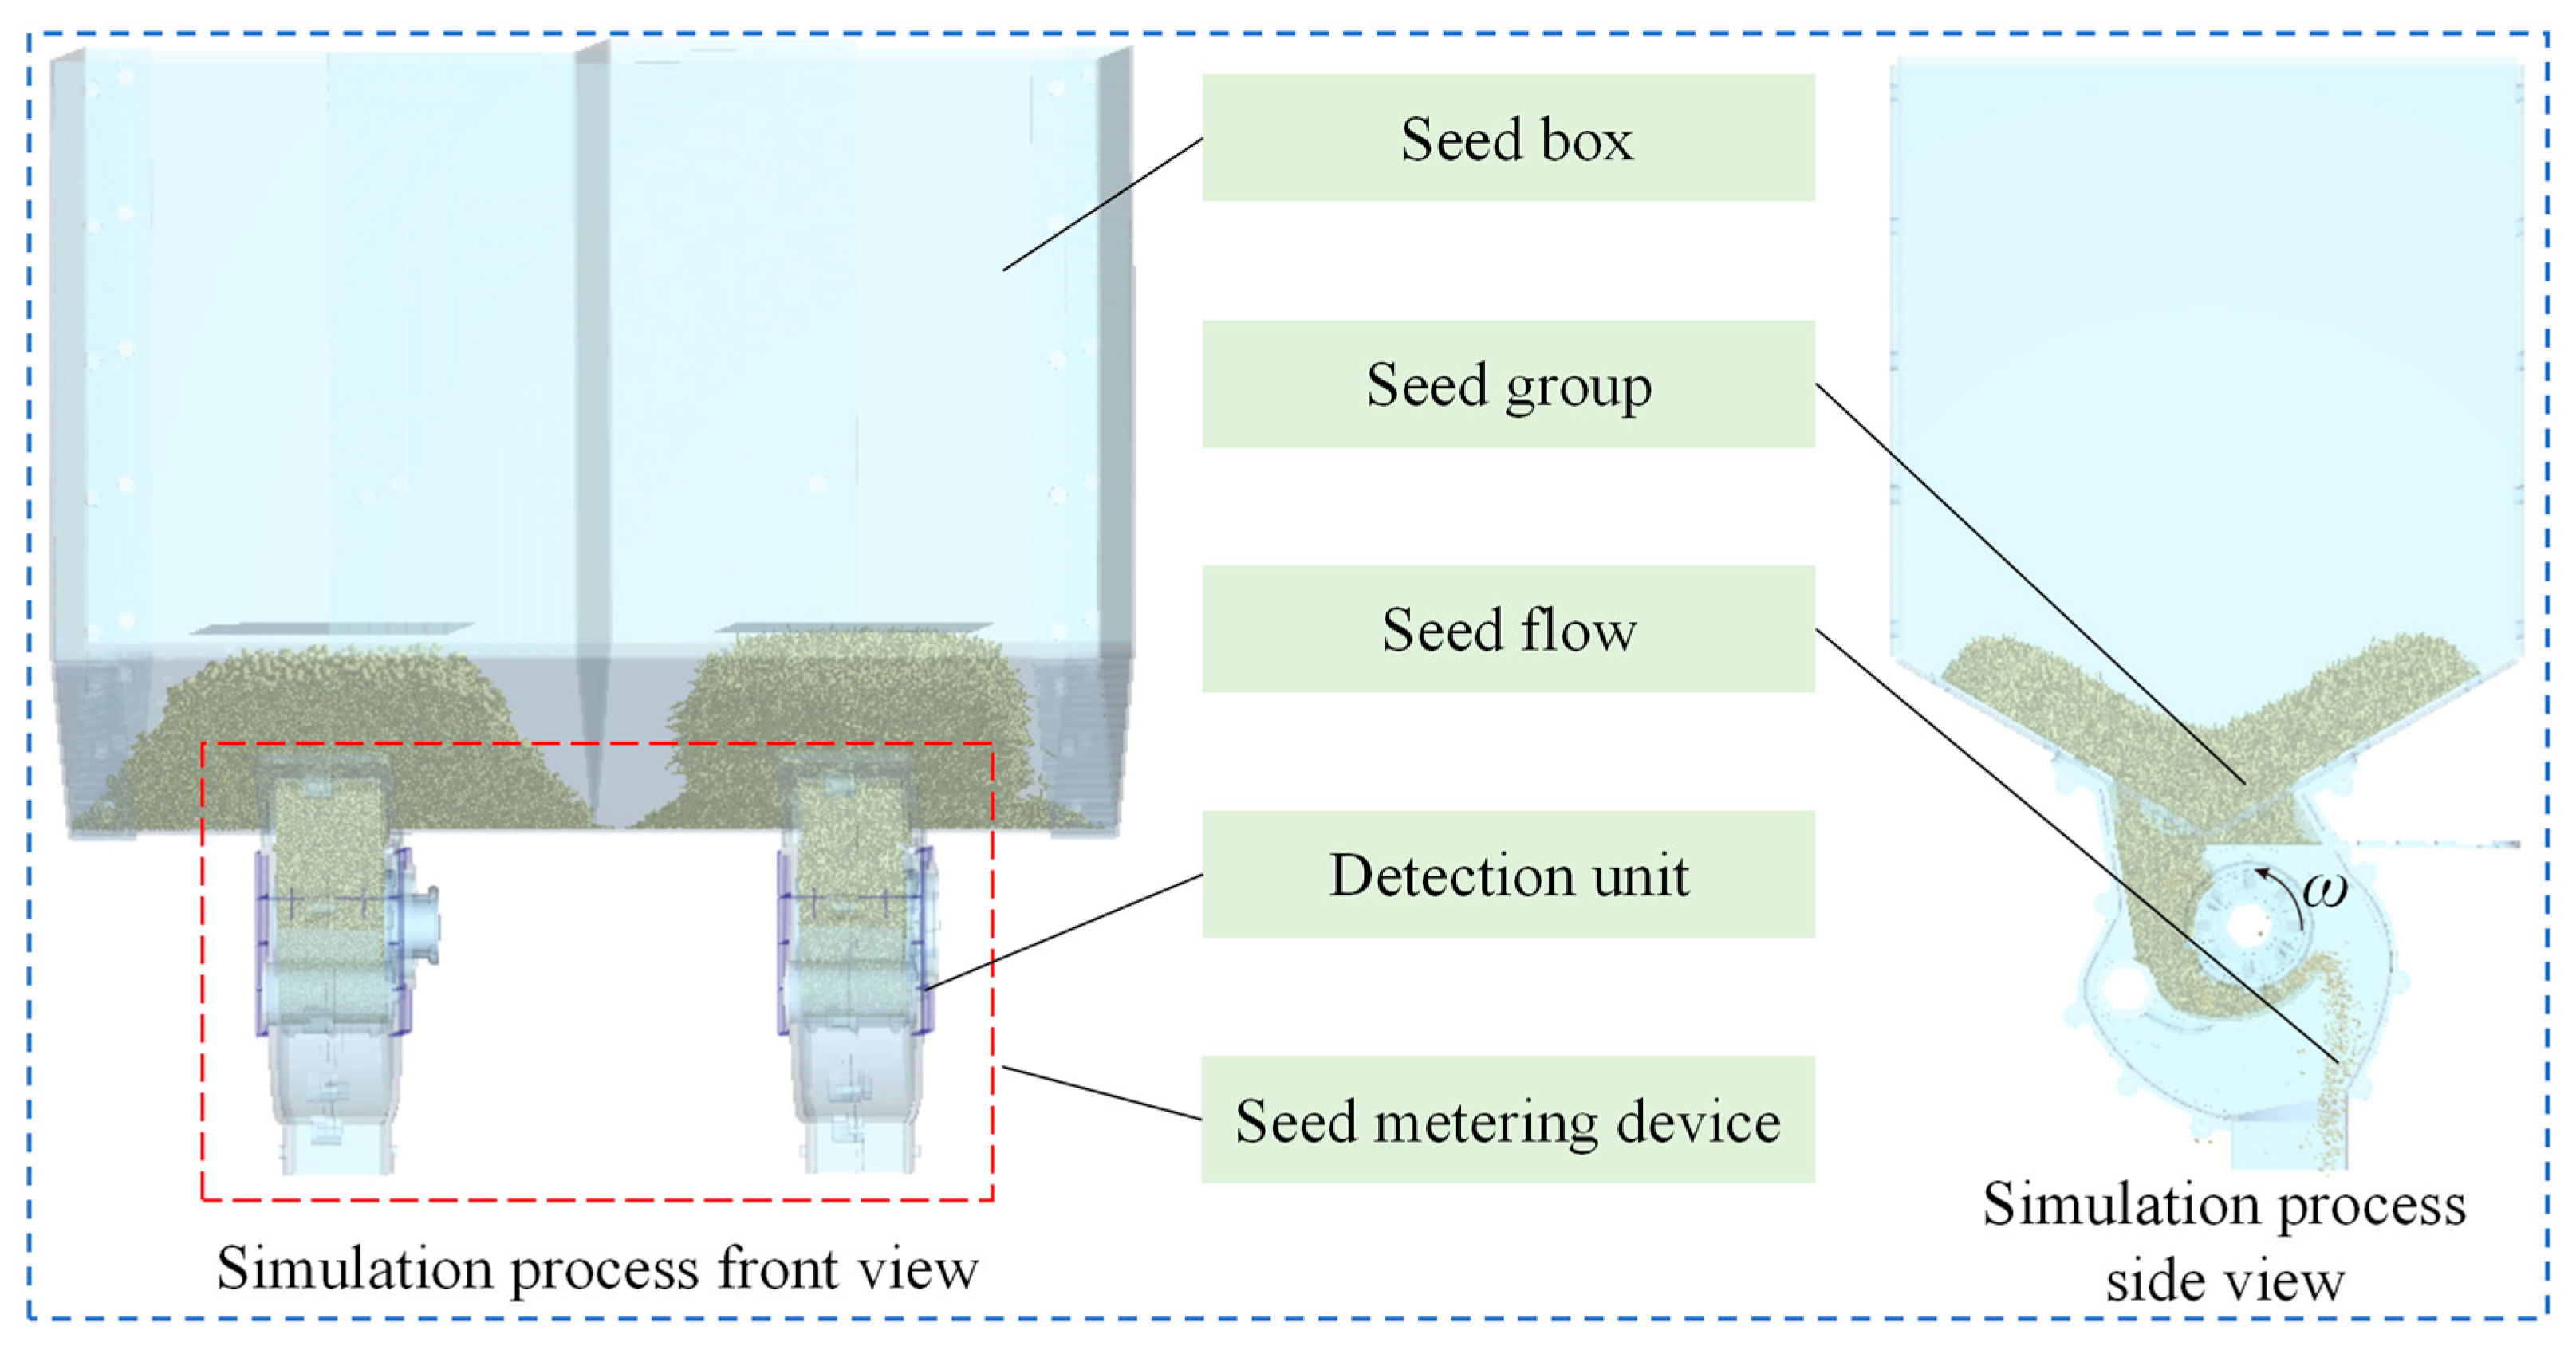
During the operation of the seed metering device, seeds fall from the seed box into the seed metering tongue under the influence of gravity and are displaced for seeding by the movement of the metering shaft. The simulation process is shown in Figure 10.

3.1.1. The Impact of the Seed Metering Wheel Structure on the Average Contact Force of the Seeds

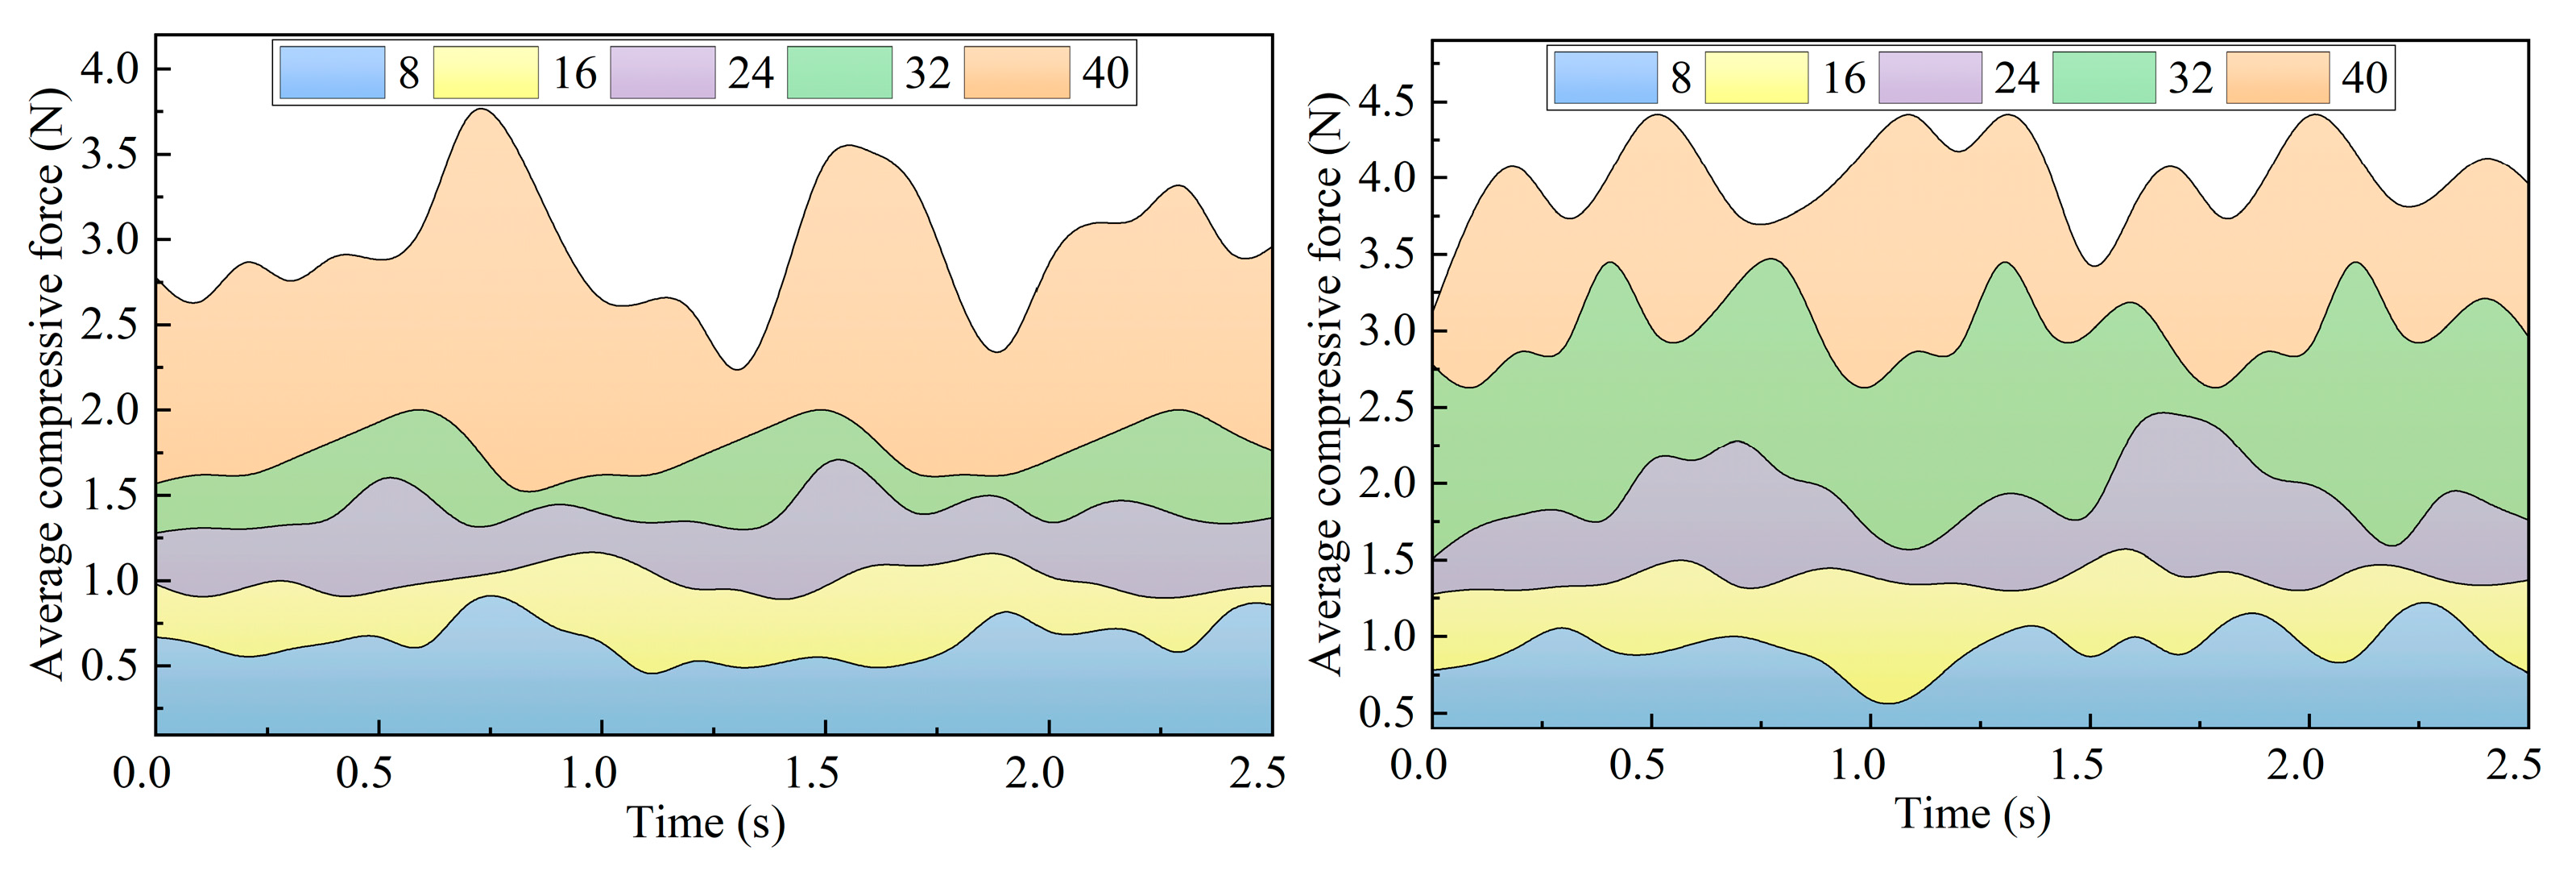
Figure 11 shows the average contact force of the seeds under different seed metering wheel structures. The average contact force of the first kind of seed is smaller than that of the second kind of seed, but the impact of different seed metering wheel structures on the contact force follows a similar pattern. The type a nail wheel structure has a smaller contact area with the seeds, resulting in a smaller average contact force on the seeds, which leads to a smaller seeding rate. The type b gear structure has a larger contact area with the seeds, resulting in a greater average contact force on the seeds, which leads to a larger seeding rate. The average contact force of the seeds in the type a nail wheel structure and type c nail–tooth combination structure fluctuates less, and the CV remains at a lower level. The average contact force of the seeds in the type b structure fluctuates more, leading to a larger CV. Therefore, it can be preliminarily concluded that the type c nail–tooth combination structure provides the best seeding performance for the seed metering device.

3.1.2. The Impact of the Metering Shaft Speed on the Movement State of the Seed Group

Figure 12 shows the average seed group speed at different metering shaft speeds. Due to the differences in the shape and contact parameters between the first kind of seed and the second kind of seed, the average speed of the first kind of seed is lower than that of the second kind of seed at the same metering shaft speed, but the overall trend is similar. The seeds’ average speed increases with the increase in metering shaft speed. When the metering shaft speed is low, the seed discharge rate is low, which increases the number of seeds in the seed metering tongue and disrupts the orderly contact between the seed metering wheel and the seeds, resulting in greater fluctuations in the average seed speed. When the metering shaft speed is high, some seeds that are not in full contact with the seed metering wheel are also carried out of the seed metering tongue. Due to the randomness of this situation, the average seed speed fluctuates more. When the metering shaft speed is 15 r/min, the seed population’s average speed fluctuates relatively less. The fluctuation in seeds’ average speed directly affects the CV. Therefore, it can be seen that selecting a sensible metering shaft speed can improve the stability of seeds in the seed metering tongue and, in turn, improve the seeding performance.

3.1.3. The Impact of the Seed Inlet Width on the Inter-Seed Compressive Force

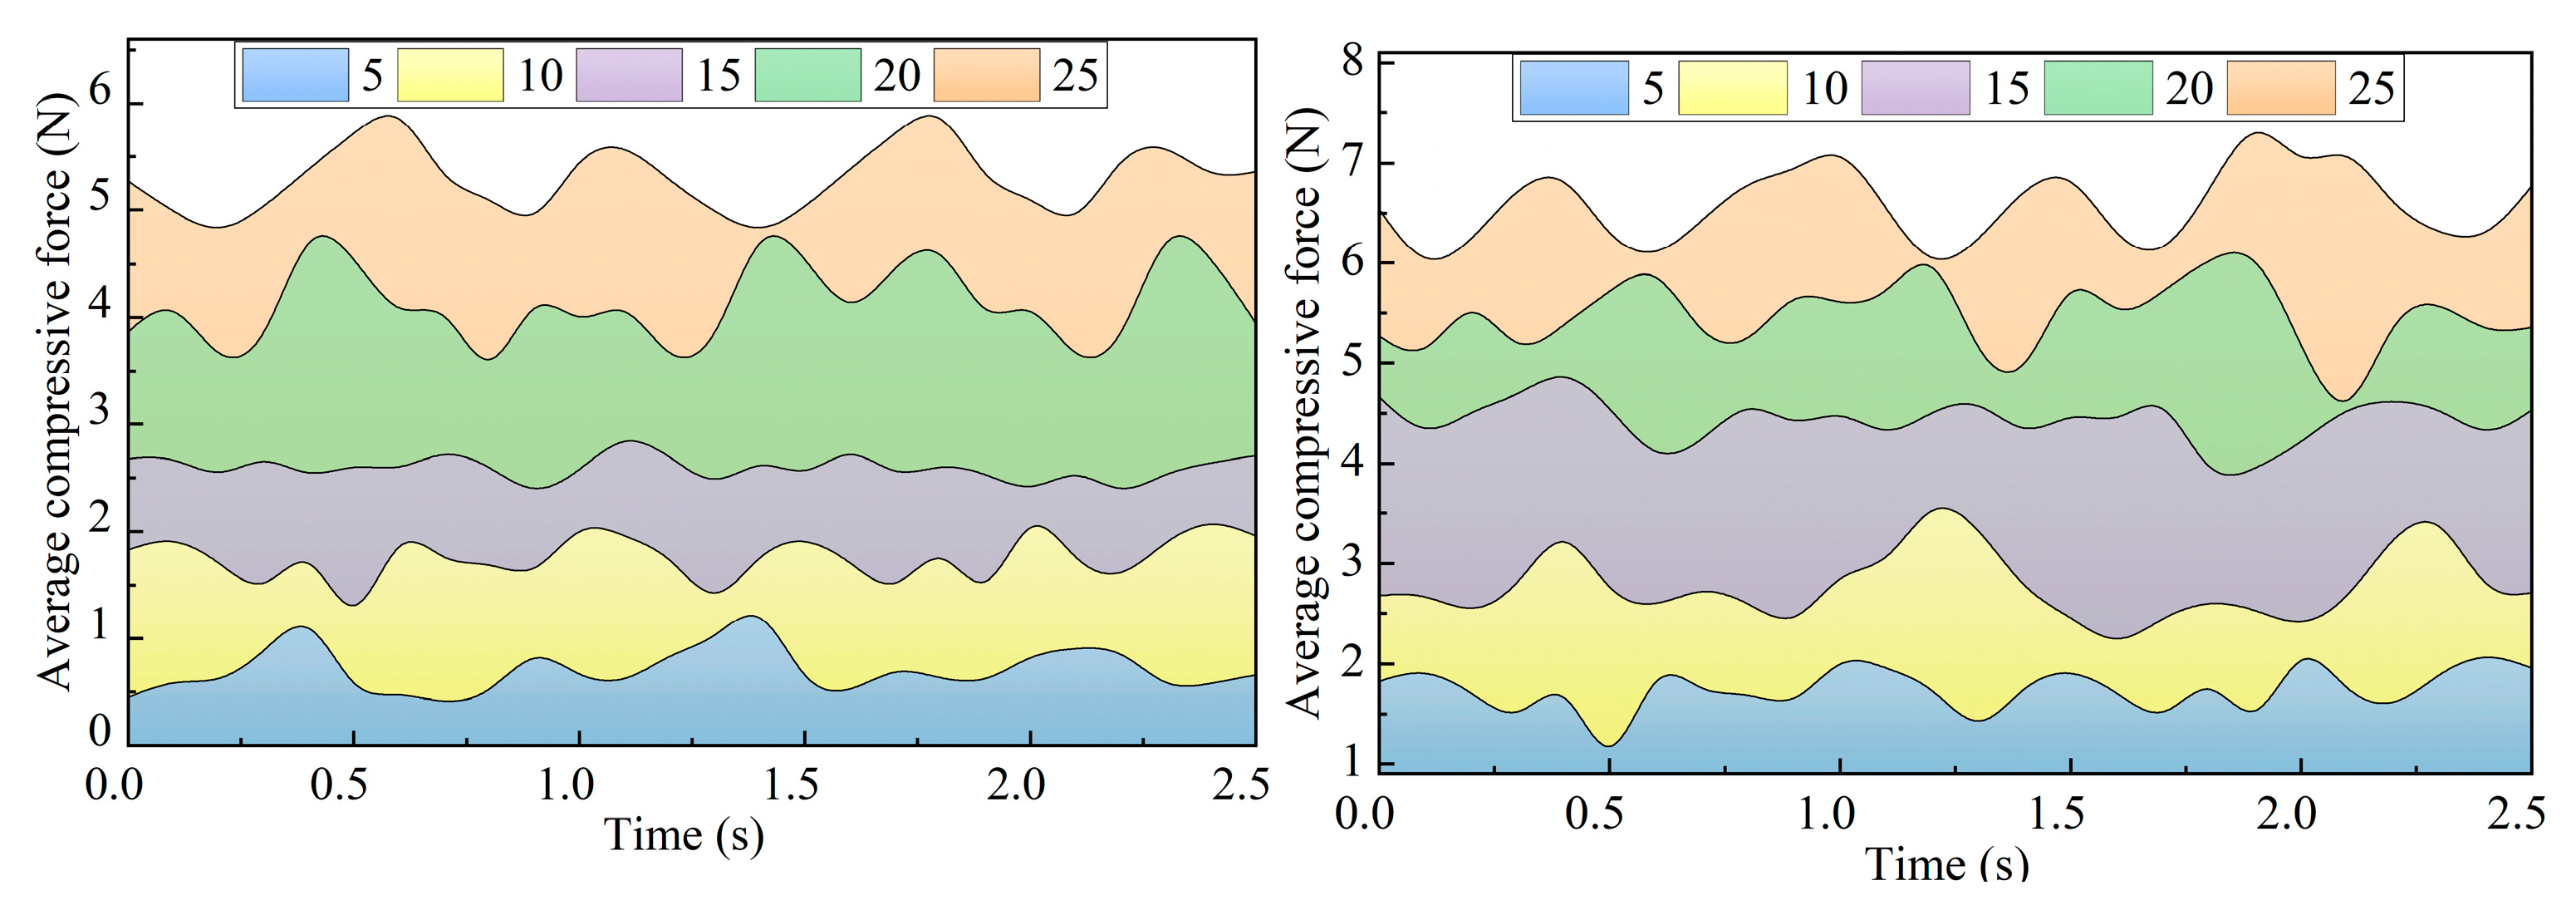
Figure 13 shows the inter-seed compressive force at different seed inlet widths. Due to the differences in shape and contact parameters between the first kind of seed and the second kind of seed, the inter-seed average compressive force for the first kind of seed is smaller than that for the second kind of seed under the same conditions, but the overall trend is similar. The inter-seed average compressive force increases with the increase in seed inlet width. When the seed inlet width is small, the seed supply rate is lower, which results in insufficient contact between the seeds and the seed metering wheel in the seed metering tongue, leading to intermittent seeding and a larger CV. When the seed inlet width is large, the number of seeds in the seed metering tongue increases, and the inter-seed compressive force becomes larger, causing seeds in contact with the seed metering wheel to be blocked by other seeds. This leads to significant fluctuations in both the inter-seed compressive force and seed discharge quantity, increasing the CV. Therefore, selecting an appropriate seed inlet width can help improve the force distribution on the seeds in the seed metering tongue and, in turn, affect the seeding performance.

3.1.4. The Impact of the Seed Outlet Height on the Inter-Seed Contact Force

Figure 14 shows the inter-seed compressive force at different seed outlet heights. The inter-seed average compressive force increases with the increase in seed outlet height. When the seed outlet height is small, the space for storing seeds in the seed metering tongue is limited, and the smaller number of seeds results in a lower inter-seed compressive force. When the seed outlet height is large, the space for storing seeds in the seed metering tongue increases, and the larger number of seeds results in a higher inter-seed compressive force. When the seed storage space in the seed metering tongue is larger, it can lead to insufficient contact between the seed metering wheel and the seeds, and the seed metering wheel can only displace the seeds for seeding once a certain height is reached. This directly affects the fluctuations in the inter-seed compressive force, increasing the CV. Therefore, selecting an appropriate seed outlet height can help improve the force distribution on the seeds in the seed metering tongue, thereby influencing seeding performance.

3.2. Results of the Verification Test

Since discrete element method (DEM) simulation can accurately obtain the motion and force information for seeds during the seeding process, an increasing number of scholars are using simulation to model the seeding process [34,35]. Therefore, this study uses DEM simulation to examine the working process of the forage mixed-seeding seed metering device and analyzes the impact of parameter changes on seed dynamic performance. To verify the accuracy of the simulation results, physical validation tests were conducted. The seeding rate and CV were recorded every 60 s after the seed metering device stabilized, and the average of 10 test results was taken. The validation test results are shown in Table 4. Under the same conditions for other parameters, the seeding rate of the type c seed metering wheel had the smallest error compared to the theoretical seeding rate, and the CV was relatively low. This is consistent with the simulation analysis results, further proving the feasibility of using DEM simulation for modeling the seeding process and confirming the accuracy of the discrete element method simulation. Additionally, it was determined that the type c structure is more suitable for the forage mixed-seeding seed metering device.

3.3. Results of the One-Way Test

Figure 15a shows the seeding performance curve at different metering shaft speeds. The CV of the first kind of seed decreases initially and then increases with the increase in metering shaft speed. The CV of the second kind of seed decreases slowly at first and then increases with the increase in metering shaft speed. When the metering shaft speed is low, the seed discharge is smaller within the same time. Since the seed inlet is a fixed value, the number of seeds in the seed metering tongue gradually increases. This causes occasional sudden increases in the seeding rate during seed metering, followed by lower seeding amounts, directly increasing the CV. When the metering shaft speed is high, the opposite situation occurs, and it also increases the seed population’s average speed, causing some seeds that were not in full contact with the seed metering wheel, as well as seeds moved by inter-seed friction, to be discharged, increasing the CV. Therefore, determining an appropriate range for the metering shaft speed is crucial for improving seeding performance, with the optimal range being 10–20 r/min.
Figure 15b shows the seeding performance curve at different seed inlet widths. The CV of the first kind of seed decreases initially and then increases with the increase in seed inlet width. The CV of the second kind of seed decreases initially, then increases, and then decreases again with the increase in seed inlet width. When the seed inlet width is small, the number of seeds entering the seed metering tongue is relatively low. Insufficient seed supply leads to idle rotation of the seed metering wheel, which cannot displace the seeds for seeding, resulting in an increase in CV. When the seed inlet width is large, the number of seeds in the seed metering tongue increases, leading to a larger inter-seed compressive force, making it more difficult for the seeds to move with the seed metering wheel, which also causes an increase in CV. Therefore, selecting an appropriate seed inlet width to control the seed supply can improve seeding performance. The optimal range for the seed inlet width is determined to be 8–24 mm.
Figure 15c shows the seeding performance curve at different seed outlet heights. The CV of the first kind of seed decreases initially and then increases with the increase in seed outlet height. The CV of the second kind of seed decreases initially and then increases slowly with the increase in seed outlet height. When the seed outlet height is too small, the distance between the seed metering wheel and the seed metering tongue is small, compressing the seed storage space and increasing the inter-seed compressive force, which is unfavorable for seeding. When the seed outlet height is too large, the distance between the seed metering wheel and the seed metering tongue becomes too large, resulting in insufficient contact between the seed metering wheel and the seeds, leading to an increase in CV. Therefore, selecting an appropriate seed outlet height can improve the contact between the seed metering wheel and the seeds, thereby enhancing seeding performance. The optimal range for seed outlet height is determined to be 10–20 mm.

3.4. Response Surface Test Results

The results of the response surface tests are shown in Table 5.
The results of the response surface tests were analyzed by regression, as shown in Table 6. The regression model fit for the three test metrics was highly significant, and the misfit term was not significant at p > 0.05. This indicates that there are no other factors affecting the evaluation indicators.
The regression equation is
Y 1 = 3.92 0.38 A + 0.83 B + 1.15 C + 2.83 A B 1.33 A C 0.53 B C + 2.43 A 2 + 1.98 B 2 + 3.58 C 2
Y 1 = 4.08 1.51 A 0.61 B + 1.15 C + 3.18 A B 1.60 A C 1.05 B C + 2.77 A 2 + 1.87 B 2 + 2.30 C 2
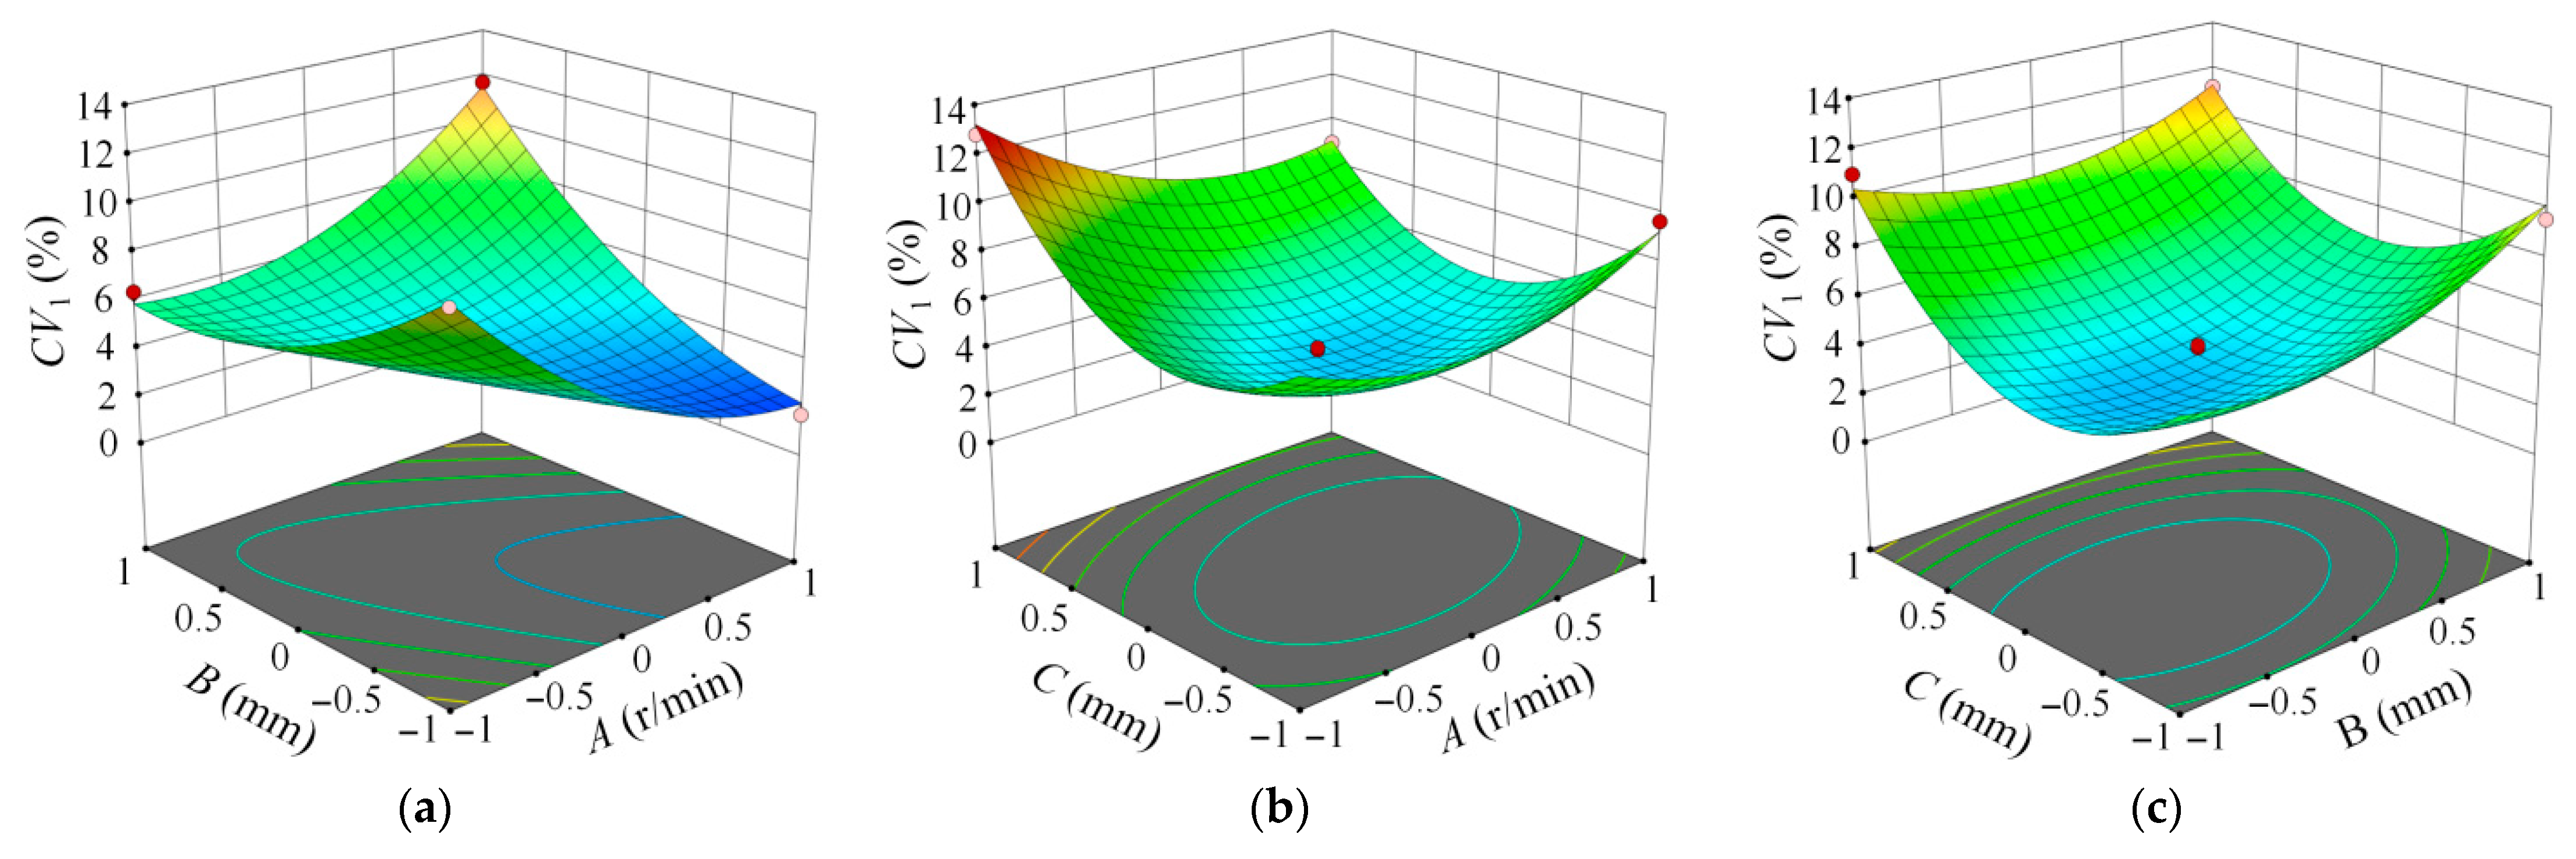
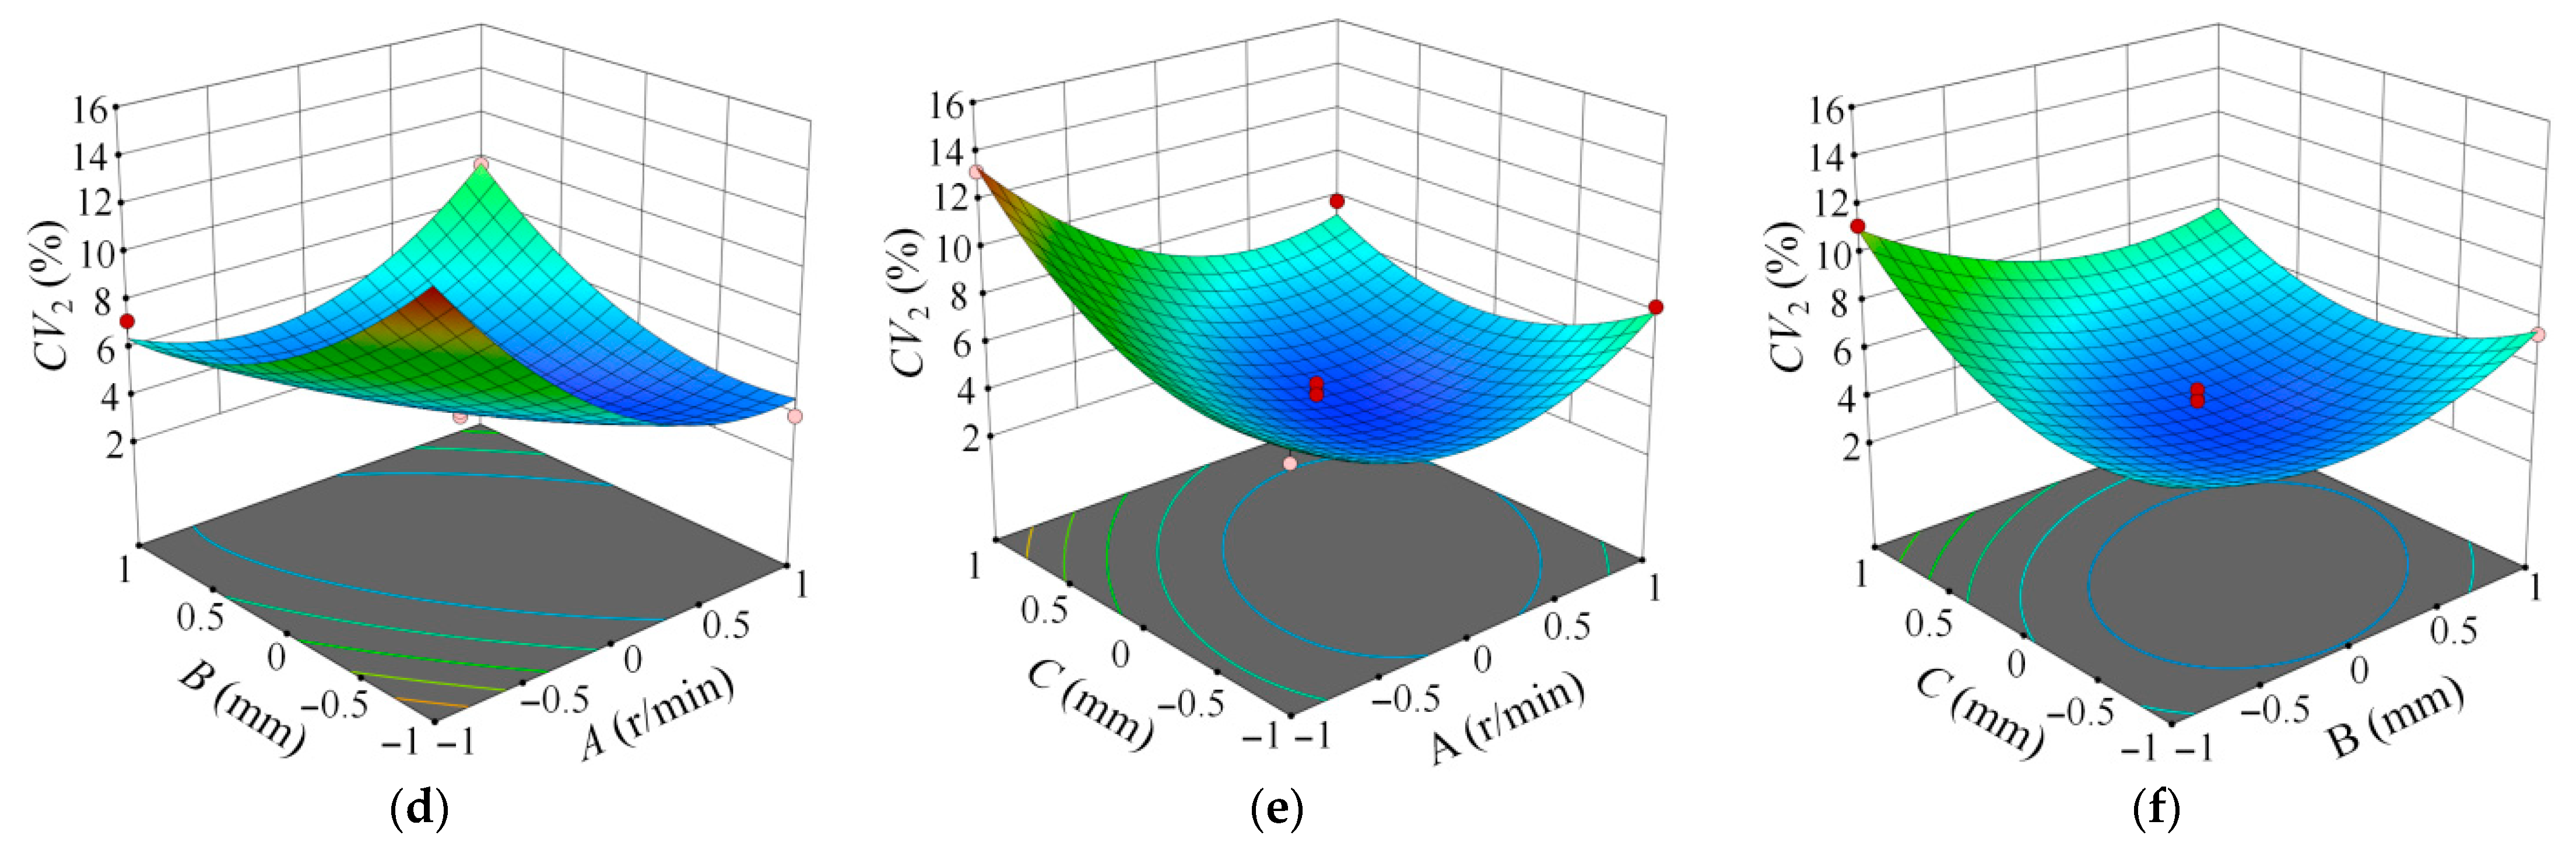
Through the regression coefficient test, it was found that the factors influencing CV1 in order of significance are C, B, and A, while the factors influencing CV2 in order of significance are A, C, and B. Based on the regression equation, surface plots were created to show the influence of the significantly interacting factors on the evaluation indicators, as shown in Figure 16. From Figure 16a,d, it can be seen that the interaction between metering shaft speed and seed inlet width significantly affects CV1 and CV2. When the metering shaft speed is low, CV1 and CV2 decrease with the increase in seed inlet width. When the metering shaft speed is high, CV1 and CV2 increase with the increase in seed inlet width. When the seed inlet width is small, CV1 and CV2 initially decrease and then increase with the increase in metering shaft speed. When the seed inlet width is large, CV1 and CV2 first decrease and then stabilize with the increase in metering shaft speed. From Figure 16b,e, the interaction between metering shaft speed and seed outlet height has a highly significant effect on CV1 and CV2. As the metering shaft speed and seed outlet height increase, CV1 and CV2 first decrease and then increase. From Figure 16c,f, it can be seen that the interaction between seed inlet width and seed outlet height significantly affects CV1 and CV2. As the seed inlet width and seed outlet height increase, CV1 and CV2 first decrease and then increase.
The key to improving seeding performance is achieving a reasonable match between the parameters. Therefore, the quadratic regression model established is optimized for multiple factors, taking into account the boundary conditions. The objective function and constraint conditions are as follows:
min Y 1 = ( A , B , C ) min Y 2 = ( A , B , C ) s . t . 10   r / min A 20   r / min 8   mm B 24   mm 10   mm C 20   mm
The solution shows that the seeding device achieves optimal performance when the metering shaft speed is 18.9 r/min, the seed inlet width is 9.3 mm, and the seed outlet height is 14.4 mm. A bench test was conducted using this optimal parameter combination, where CV1 was 4.2% and CV2 was 2.5%

3.5. Field Validation Test Results

Based on the results of the response surface experiment, a field test was conducted under the conditions of a metering shaft speed of 18.9 r/min, a seed inlet width of 9.3 mm, and a seed outlet height of 14.4 mm. The field test results are shown in Table 7. The actual seeding rate in the field test had an error of −4.0% and −0.7% compared to the theoretical seeding rate. The errors in the field test CV and the optimized analysis CV were −0.04% and 0.48%, respectively. The errors were small, further verifying the accuracy of the optimization results. It can be concluded that the multi-variety forage mixed-seeding device meets the agronomic requirements for forage seeding. This seeding device has the advantages of a simple structure, easy adjustment, and low cost. It is suitable for use in the grasslands of Inner Mongolia, China, and can further promote the mechanization of forage seeding technology.

4. Conclusions

In this study, a multi-variety forage mixed-seeding device was designed according to the requirements of forage mixed seeding. To address the issue of differences in the physical properties of different forage seeds, a dual-bin seeding approach was proposed. The eight types of forage seeds were divided into two categories, and each category was seeded by a separate seed metering device, ultimately achieving uniform mixed seeding of the forage.
The working process of the seed metering device was simulated using the discrete element method (DEM). The effects of three types of seed metering wheel structures and various factors on the working process of the seed metering device were analyzed. Based on the results of the single-factor experiment, the optimal ranges for the seed metering device’s performance were determined as follows: the optimal range for metering shaft speed is 10–20 r/min, the optimal range for seed inlet width is 8–24 mm, and the optimal range for seed outlet height is 10–20 mm.
The impact of metering shaft speed, seed inlet width, and seed outlet height on the seeding performance of the seed metering device was analyzed through a response surface experiment. The results show that the optimal parameter combination is as follows: a metering shaft speed of 18.9 r/min, a seed inlet width of 9.3 mm, and a seed outlet height of 14.4 mm.
Field tests were conducted using the optimal parameters obtained from the response surface experiment. The errors between the actual seeding rate and the theoretical seeding rate in the field test were −4.0% and −0.7%, respectively. The errors between the field test CV and the optimized analysis CV were −0.04% and 0.48%, respectively. The errors were small, further verifying the accuracy of the optimization results while also meeting the requirements for forage mixed seeding.
When the seeder operates in the field, vibrations from the machine affect the uniform distribution of seeds inside the seed box. Therefore, in the next phase of research, we will focus on studying the impact of seeder vibrations on seed stratification within the seed box to further improve the machine’s performance.

Author Contributions

Conceptualization, W.D.; methodology, W.D.; software, W.D.; validation, A.Z.; formal analysis, A.Z.; investigation, A.Z. and Y.Q.; resources, F.L. and Q.W.; data curation, W.D. and Y.R.; writing—original draft preparation, W.D.; writing—review and editing, Q.W.; visualization, W.D. and Y.W.; funding acquisition, Q.W. All authors have read and agreed to the published version of the manuscript.

Funding

This research was funded by the Inner Mongolia Autonomous Region Science and Technology Plan Project (2023YFDZ0024), Inner Mongolia Autonomous Region Science and Technology Plan Project (2025YFHH0133), and Inner Mongolia Natural Science Foundation (2023MS03013).

Institutional Review Board Statement

Not applicable.

Data Availability Statement

The original contributions presented in this study are included in the article. Further inquiries can be directed to the corresponding author(s).

Acknowledgments

We would like to thank Dong Wenjie, a postdoctoral researcher at the Institute of Geodesy and Geophysics, Chinese Academy of Sciences, for providing technical support for this study.

Conflicts of Interest

The authors declare no conflict of interest.

References

  1. Wang, D.W.; You, Y.; Zhang, X.N.; Wang, X.F.; Wang, D.C. Review of the improvement techniques and equipment development fordegraded grassland. Trans. Chin. Soc. Agric. Eng. 2024, 40, 17–33. [Google Scholar] [CrossRef]
  2. Sun, L.L.; Meng, X.; Xie, K.Y.; Yan, A.; Liu, W.; Yang, L.; Cui, H.T.; Zhao, Y.; Chu, H.Q. Effect of different mixed sowing patterns on yield and nutritional value of grass in sowing year. Acta Agrestia Sin. 2024, 32, 340–348. [Google Scholar] [CrossRef]
  3. Li, Y.M.; Li, D.N.; Wang, B.; Li, X.Y.; Shen, X.T.; Cao, L.J.; Ni, W.; Wang, T.F.; Lan, J. The effect of mixed sowing and sowing rate of different alfalfa varieties on the yield and quality of forage. Acta Agrestia Sin. 2022, 31, 61–75. [Google Scholar] [CrossRef]
  4. Zhu, Y.Q.; Guan, Z.X.; Zhen, W.; Wang, X. Effect of species diversity and community structure on nitrogen use efficiency of mixed legume grass pastures. Acta Agrestia Sin. 2018, 27, 1–14. [Google Scholar] [CrossRef]
  5. Yang, H.Y.; Tian, S.N.; Pan, Z.H.; Zhang, L.; Yu, H.Y. Development Status of Grassland Agricultural Machinery. J. Agric. Mech. Res. 2025, 47, 1–8+17. [Google Scholar] [CrossRef]
  6. Yu, C.Y.; Chen, Z.; Chen, L.Q. Design and Test of Electronic Control Seeding System for Wheat Plot Drill. Trans. Chin. Soc. Agric. Mach. 2023, 54, 75–83. [Google Scholar] [CrossRef]
  7. Cheng, X.P.; Li, H.W.; Lu, C.Y.; He, J.; Wang, Q.J.; Wang, C.; Yu, C.C.; Wei, Z.C.; Wang, C.L. Parameter optimization and experiment of centrifugal seed dispenser in wheat plot drill. Trans. Chin. Soc. Agric. Eng. 2019, 35, 1–9. [Google Scholar] [CrossRef]
  8. Shang, S.Q.; Wu, X.F.; Yang, R.B.; Li, G.Y.; Yang, X.L.; Chen, B.Q. Research Status and Prospect of Plot-sowing Equipment and Technology. Trans. Chin. Soc. Agric. Mach. 2021, 52, 1–20. [Google Scholar] [CrossRef]
  9. Zhao, L.T.; Xian, Y.Y.; Liu, G.M.; Jiang, H.X.; Liao, P.Q.; Zhao, C.; Wang, W.L.; Huo, Z.Y. Effects of different mechanized tillage and sowing modes on the seedling quality and yield of winter wheat. Trans. Chin. Soc. Agric. Eng. 2021, 37, 31–38. [Google Scholar] [CrossRef]
  10. Zhang, Y.P.; Du, R.C.; Diao, P.S.; Yang, S.D.; Wang, Z.W. Design and experiment of wide band seeding rice seeder with reversed stubble cleaning and anti-blocking. Trans. Chin. Soc. Agric. Eng. 2017, 33, 7–13. [Google Scholar] [CrossRef]
  11. Yu, Y.C.; Li, M.Z.; Liu, X.W. Improvement of composition of the outer groove-wheel seed meter. J. Henan Agric. Univ. 2002, 36, 85–88+95. [Google Scholar]
  12. Li, M.S.; Ye, J.; Li, D.; Yang, S.; Zeng, B.G.; Liu, J. Design and test of a seed metering device for buckwheat seeder based on the discrete element method. J. Southwest Univ. 2019, 41, 78–85. [Google Scholar] [CrossRef]
  13. Yin, W.Q.; Zhao, L.; Li, H.; Hu, F.; Yu, H.M. Design and Experiment on Suction Nozzle Type Hole of Pneumatic-sheave Combined Vegetable Precision Metering Device. Trans. Chin. Soc. Agric. Mach. 2019, 50, 68–76. [Google Scholar] [CrossRef]
  14. Zhen, J.; Lai, H.Y.; Li, T.; Li, T.Y.; Liao, Q.X.; Liao, Y.T. Design and Test of Precision Seed Metering Device for Wheat Wide Seedling Belt with Air Suction. Trans. Chin. Soc. Agric. Mach. 2024, 55, 165–176. [Google Scholar] [CrossRef]
  15. Zheng, Z.H. Design and Experiment of the Precision Metering Device with Staggered Convex Teeth and Wide Seedling Belt for Wheat. Master’s Thesis, Hei Fei Anhui Agric University, Hefei, China, 2023. [Google Scholar] [CrossRef]
  16. Zhang, C.L.; Liu, T.; Zheng, Z.H.; Fang, J.; Xie, X.D.; Chen, L.Q. Design and test of the precision seeding dispenser with the staggered convex teeth for wheat sowing with wide seedling belt. Trans. Chin. Soc. Agric. Eng. 2024, 40, 47–59. [Google Scholar] [CrossRef]
  17. Zhang, R.F.; Jiao, W.; Zhou, J.L.; Qi, B.; Liu, H.; Xia, Q.Q. Parameter Calibration and Experiment of Rice Seeds Discrete Element Model with Different Filling Particle Radius. Trans. Chin. Soc. Agric. Mach. 2020, 51, 227–235. [Google Scholar] [CrossRef]
  18. Horabik, J.; Wiacek, J.; Parafiniuk, P.; Banda, M.; Kobylka, R.; Stasiak, M.; Molenda, M. Calibration of discrete-element-method model parameters of bulk wheat for storage. Biosyst. Eng. 2020, 200, 298–314. [Google Scholar] [CrossRef]
  19. Sun, K.; Yu, J.Q.; Liang, L.S.; Wang, Y.; Yan, D.X.; Zhou, L.; Yu, Y.J. A DEM-based general modelling method and experimental verification for wheat seeds. Powder Technol. 2022, 401, 117353. [Google Scholar] [CrossRef]
  20. Dong, W.; Zhang, A.; Liu, F.; Zhao, X.; Ren, Y.; Bai, H.; Xuan, D.; Kong, X.; Yang, S.; Yang, X. Design and Performance Test of Variable-Capacity Spoon-Type Oat Precision Hill Seeder. Agriculture 2025, 15, 986. [Google Scholar] [CrossRef]
  21. Yu, Q.X.; Liu, Y.; Chen, X.B.; Sun, K.; Lai, Q.H. Simulation parameter calibration and experiment of Panax notoginseng seeds based on discrete element. Trans. Chin. Soc. Agric. Mach. 2020, 51, 123–132. [Google Scholar] [CrossRef]
  22. Wang, X.L.; Zhong, X.K.; Geng, Y.L.; Wei, Z.C.; Hu, H.; Geng, D.Y.; Zhang, X.C. Construction and parameter calibration of the nonlinear elastoplastic discrete element model for no-tillage soil compaction. Trans. Chin. Soc. Agric. Eng. 2021, 37, 100–107. [Google Scholar] [CrossRef]
  23. Yang, L.; Li, J.W.; Lai, Q.H.; Zhao, L.L.; Li, J.J.; Zeng, R.H.; Zhang, Z.H. Discrete element contact model and parameter calibration for clayey soil particles in the Southwest hill and mountain region. J. Terramechanics 2024, 111, 73–87. [Google Scholar] [CrossRef]
  24. Li, Z.; Zhong, J.; Gu, X.; Zhang, H.; Chen, Y.; Wang, W.; Zhang, T.; Chen, L. DEM Study of Seed Motion Model-Hole-Wheel Variable Seed Metering Device for Wheat. Agriculture 2023, 13, 23. [Google Scholar] [CrossRef]
  25. Wang, J.; Sun, W.; Simionescu, P.A.; Ju, Y. Optimization of the Fluted Force-Feed Seeder Meter with the Helical Roller Using the Discrete Element Method and Response Surface Analysis. Agriculture 2023, 13, 1400. [Google Scholar] [CrossRef]
  26. Dong, J.; Wu, J.; Zhu, Y.; Gao, X. Investigation on Seed-Filling Effect of Quantitative Precision Filling High-Speed Seed-Metering Device for Maize. Agriculture 2025, 15, 1517. [Google Scholar] [CrossRef]
  27. Dun, G.; Wei, Y.; Ji, X.; Gao, S.; Pei, Y.; He, Y.; Ma, C. Design and Test of the Outside-Filling Chinese Chive Adjustable-Capacity Precision Seed-Metering Device. Agronomy 2025, 15, 622. [Google Scholar] [CrossRef]
  28. Zheng, G.; Qi, B.; Zhang, W.; Shao, W.; Zhang, L.; Wang, Y.; Ding, Y. Engineering Discrete Element Method-Based Design and Optimization of the Key Components of a Spoon-Wheel Spinach Seed-Metering Device. Agronomy 2024, 14, 2096. [Google Scholar] [CrossRef]
  29. Zhu, H.; Zhang, S.; Wang, W.; Lv, H.; Chen, Y.; Zhou, L.; Li, M.; Zhao, J. Design and Testing of Soybean Double-Row Seed-Metering Device with Double-Beveled Seed Guide Groove. Agriculture 2024, 14, 1595. [Google Scholar] [CrossRef]
  30. Dong, W.X.; Li, N.; Liu, F.; Zhao, X.; Wang, L.H.; Xuan, D.Z.; Zhong, W.D.; Hu, H.T.; Meng, X.Y.; Li, M.Y.; et al. Study on vibration adsorption characteristics of small-particle-size seeds based on DEM. INMATEH-Agric. Eng. 2023, 71, 406–418. [Google Scholar] [CrossRef]
  31. Liu, M.; Hou, Z.F.; Ma, X.J.; Dai, N.Z.; Zhang, X.W. Discrete Element Method-based Simulation Parameter Calibration and Testing of Alfalfa Seeds. Jiangsu Agric. Sci. 2022, 50, 168–175. [Google Scholar] [CrossRef]
  32. Chen, S.; Li, Y.; Wei, B.; Shi, M.; Zou, X.; Huang, X. Establishment of a Discrete-Element Model and Verification of a Seeder Bench Experiment for Sesbania Seeds. Appl. Sci. 2025, 15, 4710. [Google Scholar] [CrossRef]
  33. Hu, M.; Xia, J.; Zhou, Y.; Luo, C.; Zhou, M.; Liu, Z. Measurement and Calibration of the Discrete Element Parameters of Coated Delinted Cotton Seeds. Agriculture 2022, 12, 286. [Google Scholar] [CrossRef]
  34. Tang, H.; Xu, F.D.; Xu, C.S.; Zhao, J.L.; Wang, Y.J. The influence of a seed drop tube of the inside-filling air-blowing precision seed-metering device on seeding quality. Comput. Electron. Agric. 2023, 204, 107555. [Google Scholar] [CrossRef]
  35. Luo, W.; Chen, X.; Guo, K.; Qin, M.; Wu, F.; Gu, F.; Hu, Z. Optimization and Accuracy Analysis of a Soil–Planter Model during the Sowing Period of Wheat after a Rice Stubble Based Discrete Element Method. Agriculture 2023, 13, 2036. [Google Scholar] [CrossRef]
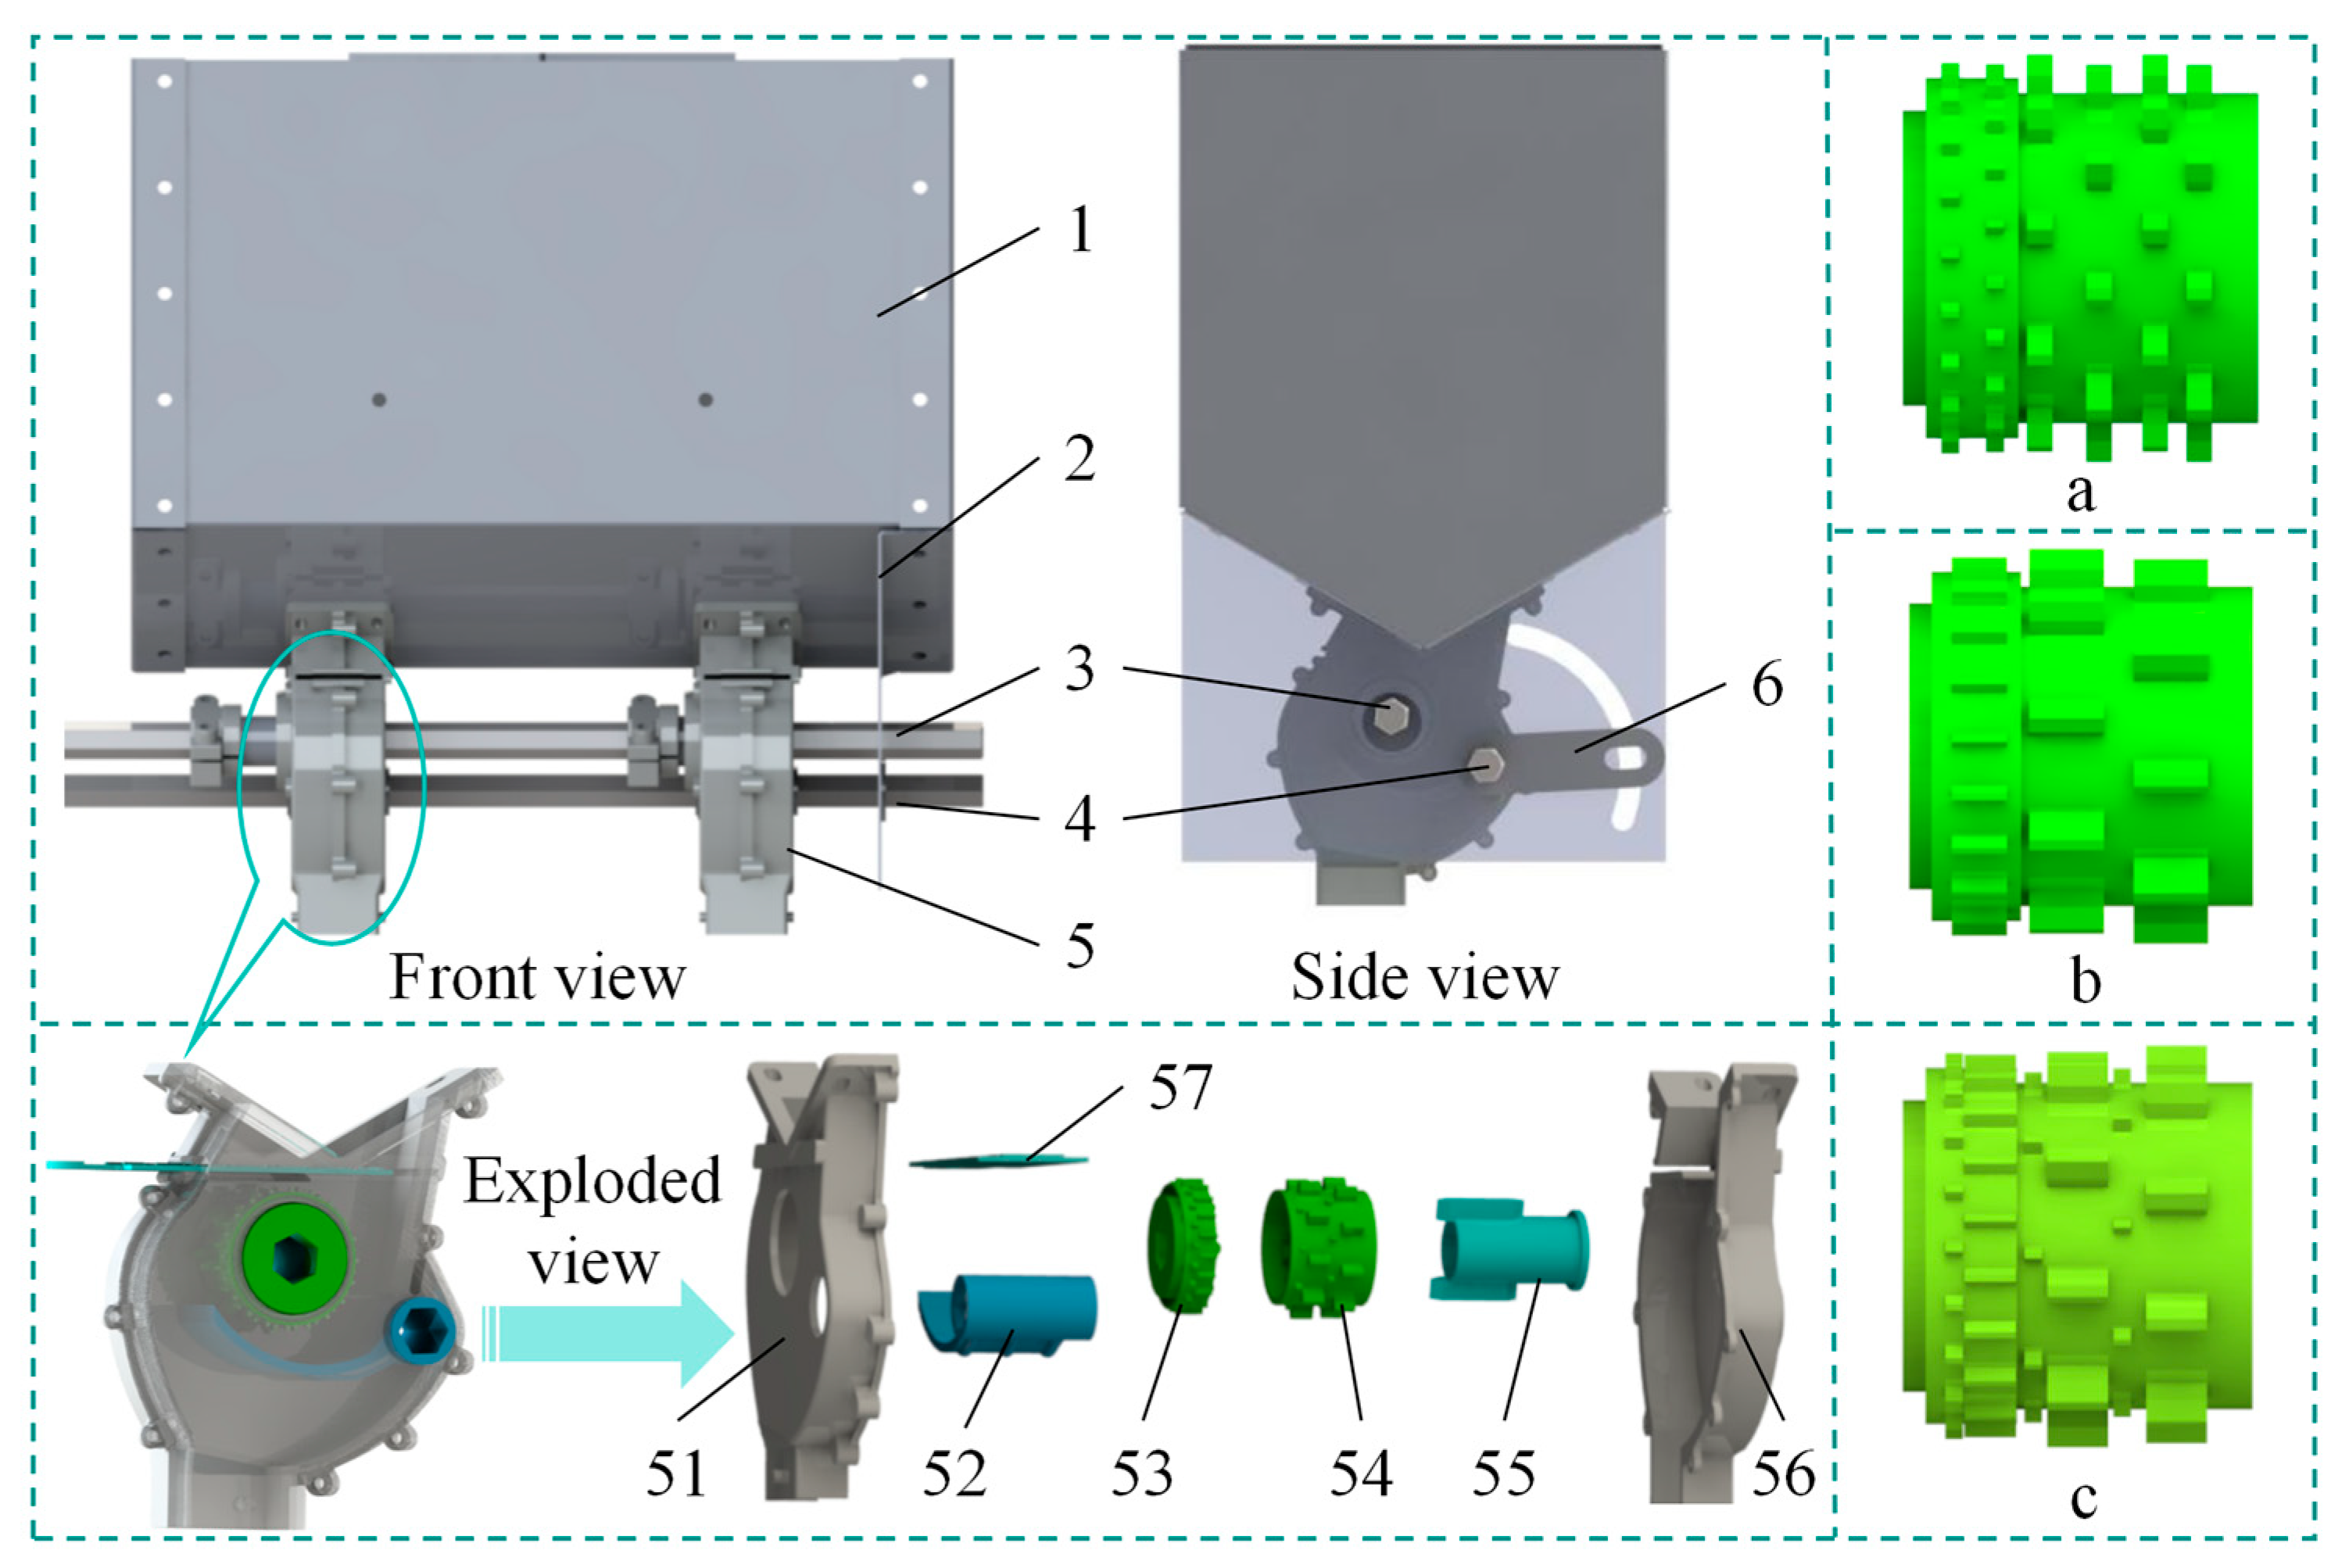
Figure 1. Structure diagram of mixed-seeding device: 1. seed box; 2. skirting plate; 3. seeding shaft 4. seeding tongue adjustment axis; 5. seed metering device; 6. dial; 51. front shell; 52. seed cup gate; 53. small seeding wheel; 54. big seeding wheel; 55. snubber; 56. back shell; 57. seeding baffles. a is a nail wheel structure, b is a gear structure, and c is a nail tooth combination structure.
Agriculture 15 01788 g001
Figure 2. Working schematic diagram of mixed-seeding device.
Agriculture 15 01788 g002
Figure 3. A schematic diagram of key structural parameters of seed metering device.
Agriculture 15 01788 g003
Figure 4. A schematic diagram of force analysis of nail tooth dial seed.
Agriculture 15 01788 g004
Figure 5. Modeling process for the first kind of seed.
Agriculture 15 01788 g005
Figure 6. Modeling process for the second kind of seed.
Agriculture 15 01788 g006
Figure 7. The process of establishing the seed metering device simulation model.
Agriculture 15 01788 g007
Figure 8. Seed metering performance test bench.
Agriculture 15 01788 g008
Figure 9. Field test process.
Agriculture 15 01788 g009
Figure 10. Seed metering device simulation process diagram.
Agriculture 15 01788 g010
Figure 11. Average contact force of the seeds.
Agriculture 15 01788 g011
Figure 12. Seed population’s average speed.
Agriculture 15 01788 g012
Figure 13. Inter-seed compressive force.
Agriculture 15 01788 g013
Figure 14. Inter-seed compressive force.
Agriculture 15 01788 g014
Figure 15. Results of the one-way test: (a) results of a one-factor test on metering shaft speed; (b) results of a one-way test on seed inlet width; (c) results of one-factor test on seed outlet height.
Agriculture 15 01788 g015
Figure 16. Interaction surface diagram: (a) the interaction between A and B on CV1; (b) the interaction between A and C on CV1; (c) the interaction between B and C on CV1; (d) the interaction between A and B on CV2; (e) the interaction between A and C on CV2; and (f) the interaction between B and C on CV2.
Agriculture 15 01788 g016aAgriculture 15 01788 g016b
Table 1. Simulation parameters.
ParametersNumerical ValueParametersNumerical Value
Poisson’s ratio for Leymus chinensis0.40Poisson’s ratio for hedysarum leave0.42
Shear modulus for Leymus chinensis/(Pa)5.1 × 107Shear modulus for hedysarum leave/(Pa)5.2 × 107
Density for Leymus chinensis/(g·cm−3)0.50Density for hedysarum leave/(g·cm−3)0.59
Poisson’s ratio for Agropyron cristatum0.35Poisson’s ratio for seed metering device0.46
Shear modulus for Agropyron cristatum/(Pa)4.7 × 107Shear modulus for seed metering device/(Pa)3.5 × 109
Density for Agropyron cristatum/(g·cm−3)0.46Density for seed metering device/(g·cm−3)2.56
Poisson’s ratio for oat0.20First kind of seed–seed metering device collision recovery coefficient0.38
Shear modulus for oat/(Pa)3.9 × 108First kind of seed–seed metering device coefficient of static friction0.30
Density for oat/(g·cm−3)0.87First kind of seed–seed metering device coefficient of rolling friction0.24
Poisson’s ratio for Lespedeza davurica0.50First kind of seed–first kind of seed collision recovery coefficient0.17
Shear modulus for Lespedeza davurica/(Pa)1.8 × 108First kind of seed–first kind of seed coefficient of static friction0.49
Density for Lespedeza davurica/(g·cm−3)1.14First kind of seed–first kind of seed coefficient of rolling friction0.37
Poisson’s ratio for alfalfa0.35First kind of seed–second kind of seed collision recovery coefficient0.25
Shear modulus for alfalfa/(Pa)2.9 × 108First kind of seed–second kind of seed coefficient of static friction0.47
Density for alfalfa/(g·cm−3)0.26First kind of seed–second kind of seed coefficient of rolling friction0.27
Poisson’s ratio for sadarwan0.50Second kind of seed–seed metering device collision recovery coefficient0.14
Shear modulus for sadarwan/(Pa)1.7 × 108Second kind of seed–seed metering device coefficient of static friction0.24
Density for sadarwan/(g·cm−3)1.07Second kind of seed–seed metering device coefficient of rolling friction0.22
Poisson’s ratio for caragana0.42Second kind of seed–second kind of seed collision recovery coefficient0.24
Shear modulus for caragana/(Pa)1.6 × 108Second kind of seed–second kind of seed coefficient of static friction0.46
Density for caragana/(g·cm−3)1.11Second kind of seed–second kind of seed coefficient of rolling friction0.40
Table 2. One-factor test factor table.
FactorLevel of Factors
12345
Metering shaft speed (r/min)510152025
Seed inlet width (mm)816243240
Seed outlet height (mm)69121518
Table 3. Test factors and coding.
EncodingsLevel of Factors
Metering Shaft Speed A (r/min)Seed Inlet Width B (mm)Seed Outlet Height C (mm)
110810
0151615
−1202420
Table 4. Results of the verification test.
TypeSeed TypeTheoretical Seeding Rate (kg)Actual Seeding Rate (kg)CV (%)
aFirst kind of seed0.00960.008310.8
Second kind of seed0.01440.01369.2
bFirst kind of seed0.00960.00947.6
Second kind of seed0.01440.01478.3
cFirst kind of seed0.00960.01329.4
Second kind of seed0.01440.01577.8
Table 5. Results of response surface test.
Test NumberTest FactorsTest Indicators
ABCCV1Y1 (%)CV2Y2 (%)
1−10112.813.2
20003.34.7
3−1−1010.614.1
4−1106.47.2
50003.93.7
6−10−18.27.3
710−19.78.3
80−1110.411.2
90−1−16.77.2
1011011.79.7
111019.07.8
121−104.63.9
1301111.27.2
140003.94.3
1501−19.67.4
160004.34.2
170004.23.5
Table 6. Variance analysis of response surface test.
Source of
Variance
Qualified Rate Y1 (%)
Sum of SquaresFreedomMean
Square
F-Valuep-ValueSignificance
Model162.60918.07100.93<0.0001**
A1.1311.136.280.0406*
B5.4415.4430.420.0009**
C10.58110.5859.110.0001**
AB31.92131.92178.34<0.0001**
AC7.0217.0239.230.0004**
BC1.1011.106.160.0421 **
A224.81124.81138.61<0.0001**
B216.47116.4791.98<0.0001**
C253.89153.89301.05<0.0001**
Residuals1.2570.1790
Fail to fit0.645030.21501.410.3619
Error0.608040.1520
Total163.8516
Source of
Variance
Multiple Rate Y2 (%)
Sum of
Squares
FreedomMean
Square
F-Valuep-ValueSignificance
Model164.08918.2336.25<0.0001**
A18.30118.3036.390.0005**
B3.0013.005.970.0446*
C10.58110.5821.040.0025**
AB40.32140.3280.18<0.0001**
AC10.24110.2420.360.0028**
BC4.4114.418.770.0211*
A232.37132.3764.35<0.0001**
B214.76114.7629.350.0010**
C222.23122.2344.190.0003**
Residuals3.5270.5029
Fail to fit2.5930.86423.720.1182
Error0.928040.2320
Total167.6016
Note: 0.05 < p < 0.1; ** indicates highly significant, p < 0.01; * indicates significant.
Table 7. Results of the field test.
NumberSeed TypeTheoretical Seeding Rate (kg)Actual Seeding Rate (kg)CV (%)
1First kind of seed0.00960.00794.1
Second kind of seed0.01440.01472.9
2First kind of seed0.00960.01024.7
Second kind of seed0.01440.01312.7
3First kind of seed0.00960.00813.8
Second kind of seed0.01440.01483.1
4First kind of seed0.00960.01084.5
Second kind of seed0.01440.01393.8
5First kind of seed0.00960.00893.7
Second kind of seed0.01440.01522.4
AverageFirst kind of seed0.00960.00924.16
Second kind of seed0.01440.01432.98
Disclaimer/Publisher’s Note: The statements, opinions and data contained in all publications are solely those of the individual author(s) and contributor(s) and not of MDPI and/or the editor(s). MDPI and/or the editor(s) disclaim responsibility for any injury to people or property resulting from any ideas, methods, instructions or products referred to in the content.