Article

Extraction of Cotton Cultivation Areas Based on Deep Learning and Sentinel-2 Image Data

1
College of Hydraulic and Civil Engineering, Xinjiang Agricultural University, Urumqi 830052, China
2
Xinjiang Key Laboratory of Hydraulic Engineering Security and Water Disasters Prevention, Urumqi 830052, China
3
Xinjiang Uygur Autonomous Region Ecological Water Resources Research Center, Academician and Expert Workstation of the Department of Water Resources of the Xinjiang Uygur Autonomous Region, Urumqi 830052, China
4
Changji Water Conservancy Management Station, Santunhe River Basin Management Office, Changji 831100, China
*
Author to whom correspondence should be addressed.
Agriculture 2025, 15(16), 1783; https://doi.org/10.3390/agriculture15161783
Submission received: 21 July 2025 / Revised: 18 August 2025 / Accepted: 19 August 2025 / Published: 20 August 2025

Abstract

Cotton is a crucial economic crop, and timely and accurate acquisition of its spatial distribution information is of great significance for yield prediction, as well as for the formulation and adjustment of agricultural policies. To accurately and efficiently extract cotton cultivation areas at a large scale, in this study, we focused on the Santun River Irrigation District in Xinjiang as the research area. Utilizing Sentinel-2 satellite imagery from 2019 to 2024, four cotton extraction models—U-Net, SegNet, DeepLabV3+, and CBAM-UNet—were constructed. The models were evaluated using metrics, including the mean intersection over union (mIoU), precision, recall, F1-score, and over accuracy (OA), to assess the models’ performances in cotton extraction. The results demonstrate that the CBAM-UNet model achieved the highest accuracy, with an mIoU, precision, recall, F1-score, and OA of 84.02%, 88.99%, 94.75%, 91.78%, and 95.56%, respectively. The absolute error of the extracted cotton areas from 2019 to 2024 ranged between 923.69 and 1445.46 hm2, with absolute percentage errors of less than 10%. The coefficient of determination (R2) between the extracted results and statistical data was 0.9817, indicating the best fit. The findings of this study provide technical support for rapid cotton identification and extraction in large- and medium-sized irrigation districts.

1. Introduction

Cotton is among the world’s most economically significant crops, serving not only as the most widely used natural fiber in the global textile industry but also as a vital oil crop and a key raw material for fine chemical production [1,2]. Xinjiang, as China’s largest cotton production base, plays a pivotal role in cotton cultivation, consumption, and trade. According to 2021 statistics, Xinjiang’s cotton planting area and total output reached 2.5062 million hectares and 5.129 million tons, accounting for 82.76% and 89.50% of China’s total, respectively, while also representing one-fifth of global cotton production [3]. Cotton has become a pillar of Xinjiang’s regional economy, making rapid and accurate acquisition of spatial distribution data crucial for sustainable development of the cotton industry and optimization of planting structures. Currently, a significant portion of agricultural statistics, including the crop planting area, are still obtained through field surveys and farmer interviews [4]. This traditional approach not only consumes substantial material and financial resources but is also susceptible to subjective human factors, which may compromise the reliability and accuracy of statistical results to some extent [5].
Remote sensing technology offers distinct advantages, including strong timeliness, abundant information, extensive coverage, and a low cost [6], making it feasible to acquire detailed information on crop planting and production processes at regional scales. Wei et al. [7] reconstructed cotton growth curves using Moderate Resolution Imaging Spectroradiometer (MODIS) normalized difference vegetation index (NDVI) data with double-logistic filtering to determine growth thresholds and used these data to extract cotton planting areas in Shihezi, Xinjiang. Zheng et al. [8] effectively monitored crop phenology at the county level in Shandong Province by accurately fusing Satellite pour l’Observation de la Terre (SPOT5) and MODIS images using the spatial and temporal adaptive reflectance fusion model (STARFM). Tatsumi et al. [9] generated enhanced vegetation index (EVI) time-series images from Landsat7 enhanced thematic mapper plus (ETM+) data and established a random forest-based classification model for eight crop types, including cotton, achieving an overall accuracy of 81%. Yu et al. [10] successfully obtained multi-year cropping structure data for Xinjiang’s Santun River Irrigation District by integrating long-term Sentinel-1 and Sentinel-2 imagery with multiple vegetation indices and polarimetric data and by employing random forest, decision tree, and support vector machine algorithms. Sertel et al. [11] applied an object-based classification method to high-resolution WorldView-2 imagery and achieved accurate identification of land cover types such as forests, croplands, and vineyards. Ayixiamu Mijiti et al. [12] fused Gaofen-2 (GF-2) multispectral and panchromatic imagery and combined it with random forest classification for cotton recognition, and they found that nearest neighbor diffusion pan sharpening (NNDpansharp) fused imagery yielded the highest overall accuracy and kappa coefficient. However, traditional supervised and unsupervised classification methods can only extract shallow features, such as texture and color structures, for crop classification and lack the capability to capture higher-level semantic features. Their robustness and accuracy remain limited, particularly when the sample size and diversity increase, making it challenging to achieve a satisfactory classification performance [13].
In recent years, deep learning has achieved significant breakthroughs in image processing, natural language processing, and data analysis due to its unique network architecture, strong robustness, and exceptional fitting capabilities [14,15], making it a research hotspot in agricultural remote sensing identification. Du et al. [16] trained a U-Net model using the cropland data layer (CDL) and Landsat time-series imagery to extract rice fields in Arkansas, demonstrating that U-Net outperformed random forests in most cases. Li et al. [17] employed a densely connected network (DenseNet) model for field-scale cotton recognition in China’s Wei-Ku region, confirming its superior performance over classical convolutional neural networks such as the residual network (ResNet) in identifying fine-scale cotton field structures. Wang et al. [18] utilized a fully convolutional network (FCN) model with Sentinel-1 synthetic aperture radar (SAR) time-series data for pixel-wise rice extraction, achieving a user’s accuracy of 82.4%. Zhang et al. [19] extracted soybean planting areas from GF-1 fused imagery using a U-Net model, attaining a mean intersection over union (mIoU) of 81.35%, which surpassed the performances of SegNet and DeepLabV3+. However, encoder–decoder networks such as U-Net rely on convolutional kernels for downsampling to extract low-resolution features before upsampling them back to the original resolution, and this alternating process of resolution conversion may compromise the accuracy of the original image information, leading to significant loss of critical details [20]. Attention mechanisms provide a solution by enabling models to learn and focus on important information, allowing them to concentrate on key regions or features in images, thereby improving the segmentation accuracy [21]. Yan et al. [22] enhanced the U-Net model by integrating an efficient channel attention (ECA) module, successfully identifying crops such as soybeans, corn, and rice in Majiaba Town, Mianyang City, Sichuan Province, and achieving an F1-score of 0.78. Chang et al. [23] incorporated the convolutional block attention module (CBAM) into the DeepLabV3+ model and accurately extracted wheat and rapeseed distributions from GF-2 remote sensing imagery, with an mIoU of 85.63%. Wan et al. [24] introduced a coordinate attention module to enhance the decoder of the original U-Net, emphasizing key regions and extracting more discriminative corn features, thereby precisely identifying different growth stages of corn in fields.
Therefore, in this study, we selected the Santun River Irrigation District in Xinjiang, China, as the study area and employed high-resolution Sentinel-2 multispectral imagery as the primary data source. Based on the PyTorch platform (v2.0.0), we constructed four deep learning network models, namely U-Net, SegNet, DeepLabV3+, and CBAM-UNet, for cotton cultivation area extraction. Through comparative analysis, we aimed to identify the most suitable model for high-precision cotton extraction, which is expected to provide a methodological reference for precise crop classification in large- and medium-sized irrigation districts.

2. Materials and Methods

2.1. Overview of the Study Area

The Santun River Irrigation District is located in the central section of the northern foothills of the Tianshan Mountains in Xinjiang, along the southern margin of the Junggar Basin (86°24′33″–87°37′ E, 43°6′30″–45°20′ N). The district spans approximately 260 km from north to south and 31 km from east to west, covering a total watershed area of 4466 km2. Situated in the hinterland of the Eurasian continent and far from oceanic influences, the Santun River Basin has a mid-temperate continental arid climate. The total irrigated area of the Santun River Irrigation District reaches 73,000 km2. Within this irrigation district, our study area is characterized by cultivated land as the predominant land use type, with cotton being one of the principal cash crops. The geographic location of the study area is shown in Figure 1.

2.2. Growth Cycles of Cotton in the Study Area

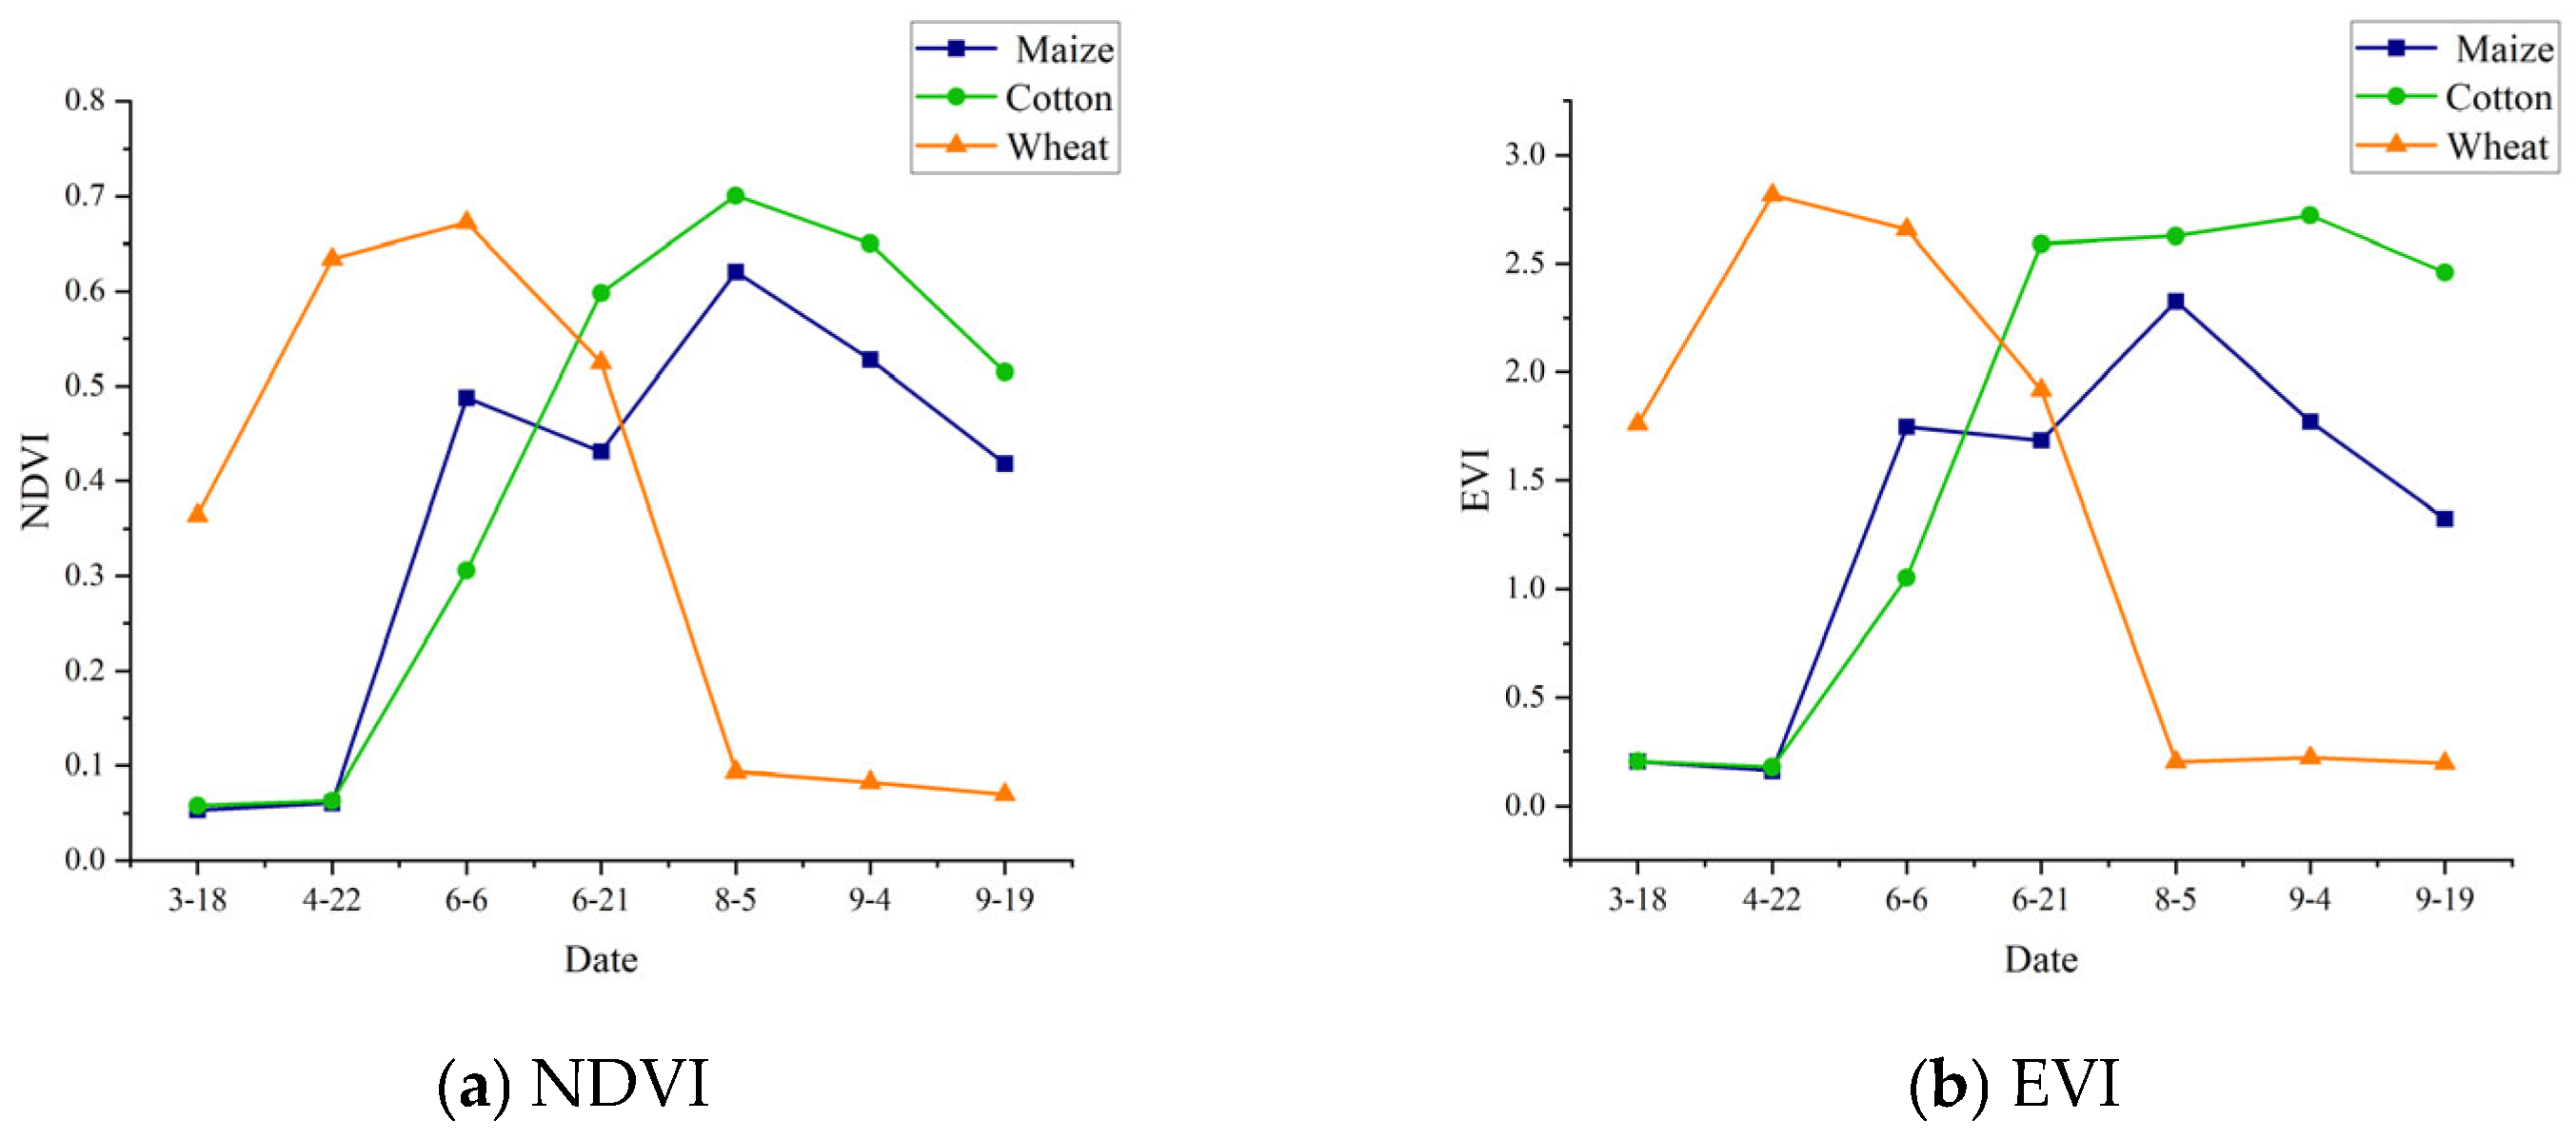
Based on field surveys and irrigation district documentation provided by the Santun River Basin Administration, we established the cotton growth phenological calendar for the study area. The cotton growth cycle can be divided into six distinct stages: sowing, seedling, squaring, flowering-boll, boll-opening, and maturation stages. This complete growth cycle extends from mid-April to early October each year. The details of the growth phases are presented in Table 1. Based on Sentinel-2 time-series data, the NDVI and EVI vegetation indices were calculated for major crops in the Santun River Irrigation District, with the results presented in Figure 2. The results demonstrate that cotton exhibited optimal growth vigor during the flowering-boll stage, with its spectral reflectance reaching the highest values. This phenological phase provides the maximum spectral differentiation between cotton and other land cover types, effectively minimizing classification errors caused by the phenomena of the same objects with different spectra and different objects with similar spectra. Consequently, the flowering-boll stage in mid-to-late July represents the optimal temporal window for high-precision cotton planting area extraction using satellite remote sensing imagery. This specific period was therefore selected for image acquisition to ensure accurate segmentation and classification of cotton fields.

2.3. Data Source and Preprocessing

2.3.1. Sentinel-2 Remote Sensing Image Data

In this study, we primarily utilized Sentinel-2 satellite remote sensing data. Sentinel-2 is a high-resolution multispectral imaging satellite with a 5-day revisit cycle, is equipped with a multispectral Instrument (MSI), and is comprised of two satellites (Sentinel-2A and Sentinel-2B). The system acquires Earth surface images in 13 spectral bands with spatial resolutions of 10, 20, and 60 m. In optical remote sensing applications, the three red-edge bands (B5, B6, and B7) of Sentinel-2 data significantly enhance the classification accuracy of vegetation features [25]. The primary advantages of Sentinel-2 data include a high spatial resolution, excellent temporal resolution, and the availability of red-edge spectral bands, making it the highest-resolution freely available satellite remote sensing data source currently existing. In this study, we employed Sentinel-2 Level-2A data products obtained from the European Space Agency’s data sharing platform (https://dataspace.copernicus.eu/, accessed on 13 March 2025). We downloaded cloud-free (<5% cloud cover) Sentinel-2 imagery acquired during July–August periods from 2019 to 2024. The specific acquisition dates are listed in Table 2.
The acquired Sentinel series imagery data were Level-2A products that had undergone preprocessing, including radiometric calibration, orthorectification, and atmospheric correction, ensuring good data quality. The processing workflow initially employed nearest neighbor resampling to standardize the 20 m resolution bands to 10 m resolution, subsequently performing band fusion across all ten spectral bands spanning both 10 m and 20 m native resolutions. Finally, the image data were clipped using the vector boundary of the study area to obtain 10 m resolution Sentinel-2A multispectral imagery of the Santun River Irrigation District.

2.3.2. Statistical Data

The statistical data on cotton cultivation areas in the Santun River Irrigation District from 2019 to 2024 were obtained from the Santunhe River Basin Management Office in Changji City. To ensure comprehensiveness and accuracy, the cotton cultivation area data were further verified against records provided by the Changji Hui Autonomous Prefecture People’s Government (https://www.cj.gov.cn/, accessed on 26 April 2025) and cross-referenced with statistical yearbooks from the Xinjiang Uygur Autonomous Region Bureau of Statistics (https://www.cj.gov.cn/p1/zfxxgknb.html, accessed on 26 April 2025).

2.4. Dataset Production

The training process of deep learning networks requires both image datasets and their corresponding labels. Based on field survey data, labels for respective land cover types were created through manual annotation. The dataset is typically partitioned into training, validation, and testing sets. The training set was used to establish the classification model by setting classifier parameters, the validation dataset was used to identify the optimal model parameters, and the testing set was employed to evaluate the classification performance of the model [26].
The dataset preparation procedure was systematically implemented using the following steps: Initially, the remote sensing imagery was processed using the ArcGIS software (v10.8), in which the original images were cropped using the study area mask file to generate training image data files. Subsequently, vector label files for the training regions were created. The class field values were modified, and the spatial reference system was aligned with the corresponding remote sensing imagery. Specifically, cotton fields were assigned a class value of 1, and non-cotton areas were assigned a value of 0. The vector label files were then converted to raster format using the software’s toolbox functionality. The processed training images and their corresponding label data were randomly cropped into 1086 image–label pairs composed of 256 × 256 pixels, and filename correspondence between the source imagery and label files was strictly maintained to ensure data integrity. To address the substantial data requirements inherent in deep learning model training, in this study, we implemented comprehensive data augmentation strategies, including symmetric transformation, rotation, and brightness adjustment [27]. These techniques effectively expanded the limited sample size, increased the training set variance, and enhanced the neural network performance. The visual effects of these augmentation methods are illustrated in Figure 3. The augmented dataset was ultimately comprised of 5430 image–label pairs (256 × 256 pixels), with image–label pairs from all years except 2023 partitioned into training and validation sets at a 9:1 ratio, while the 2023 image–label pairs were reserved as the test set.

3. Research Methods

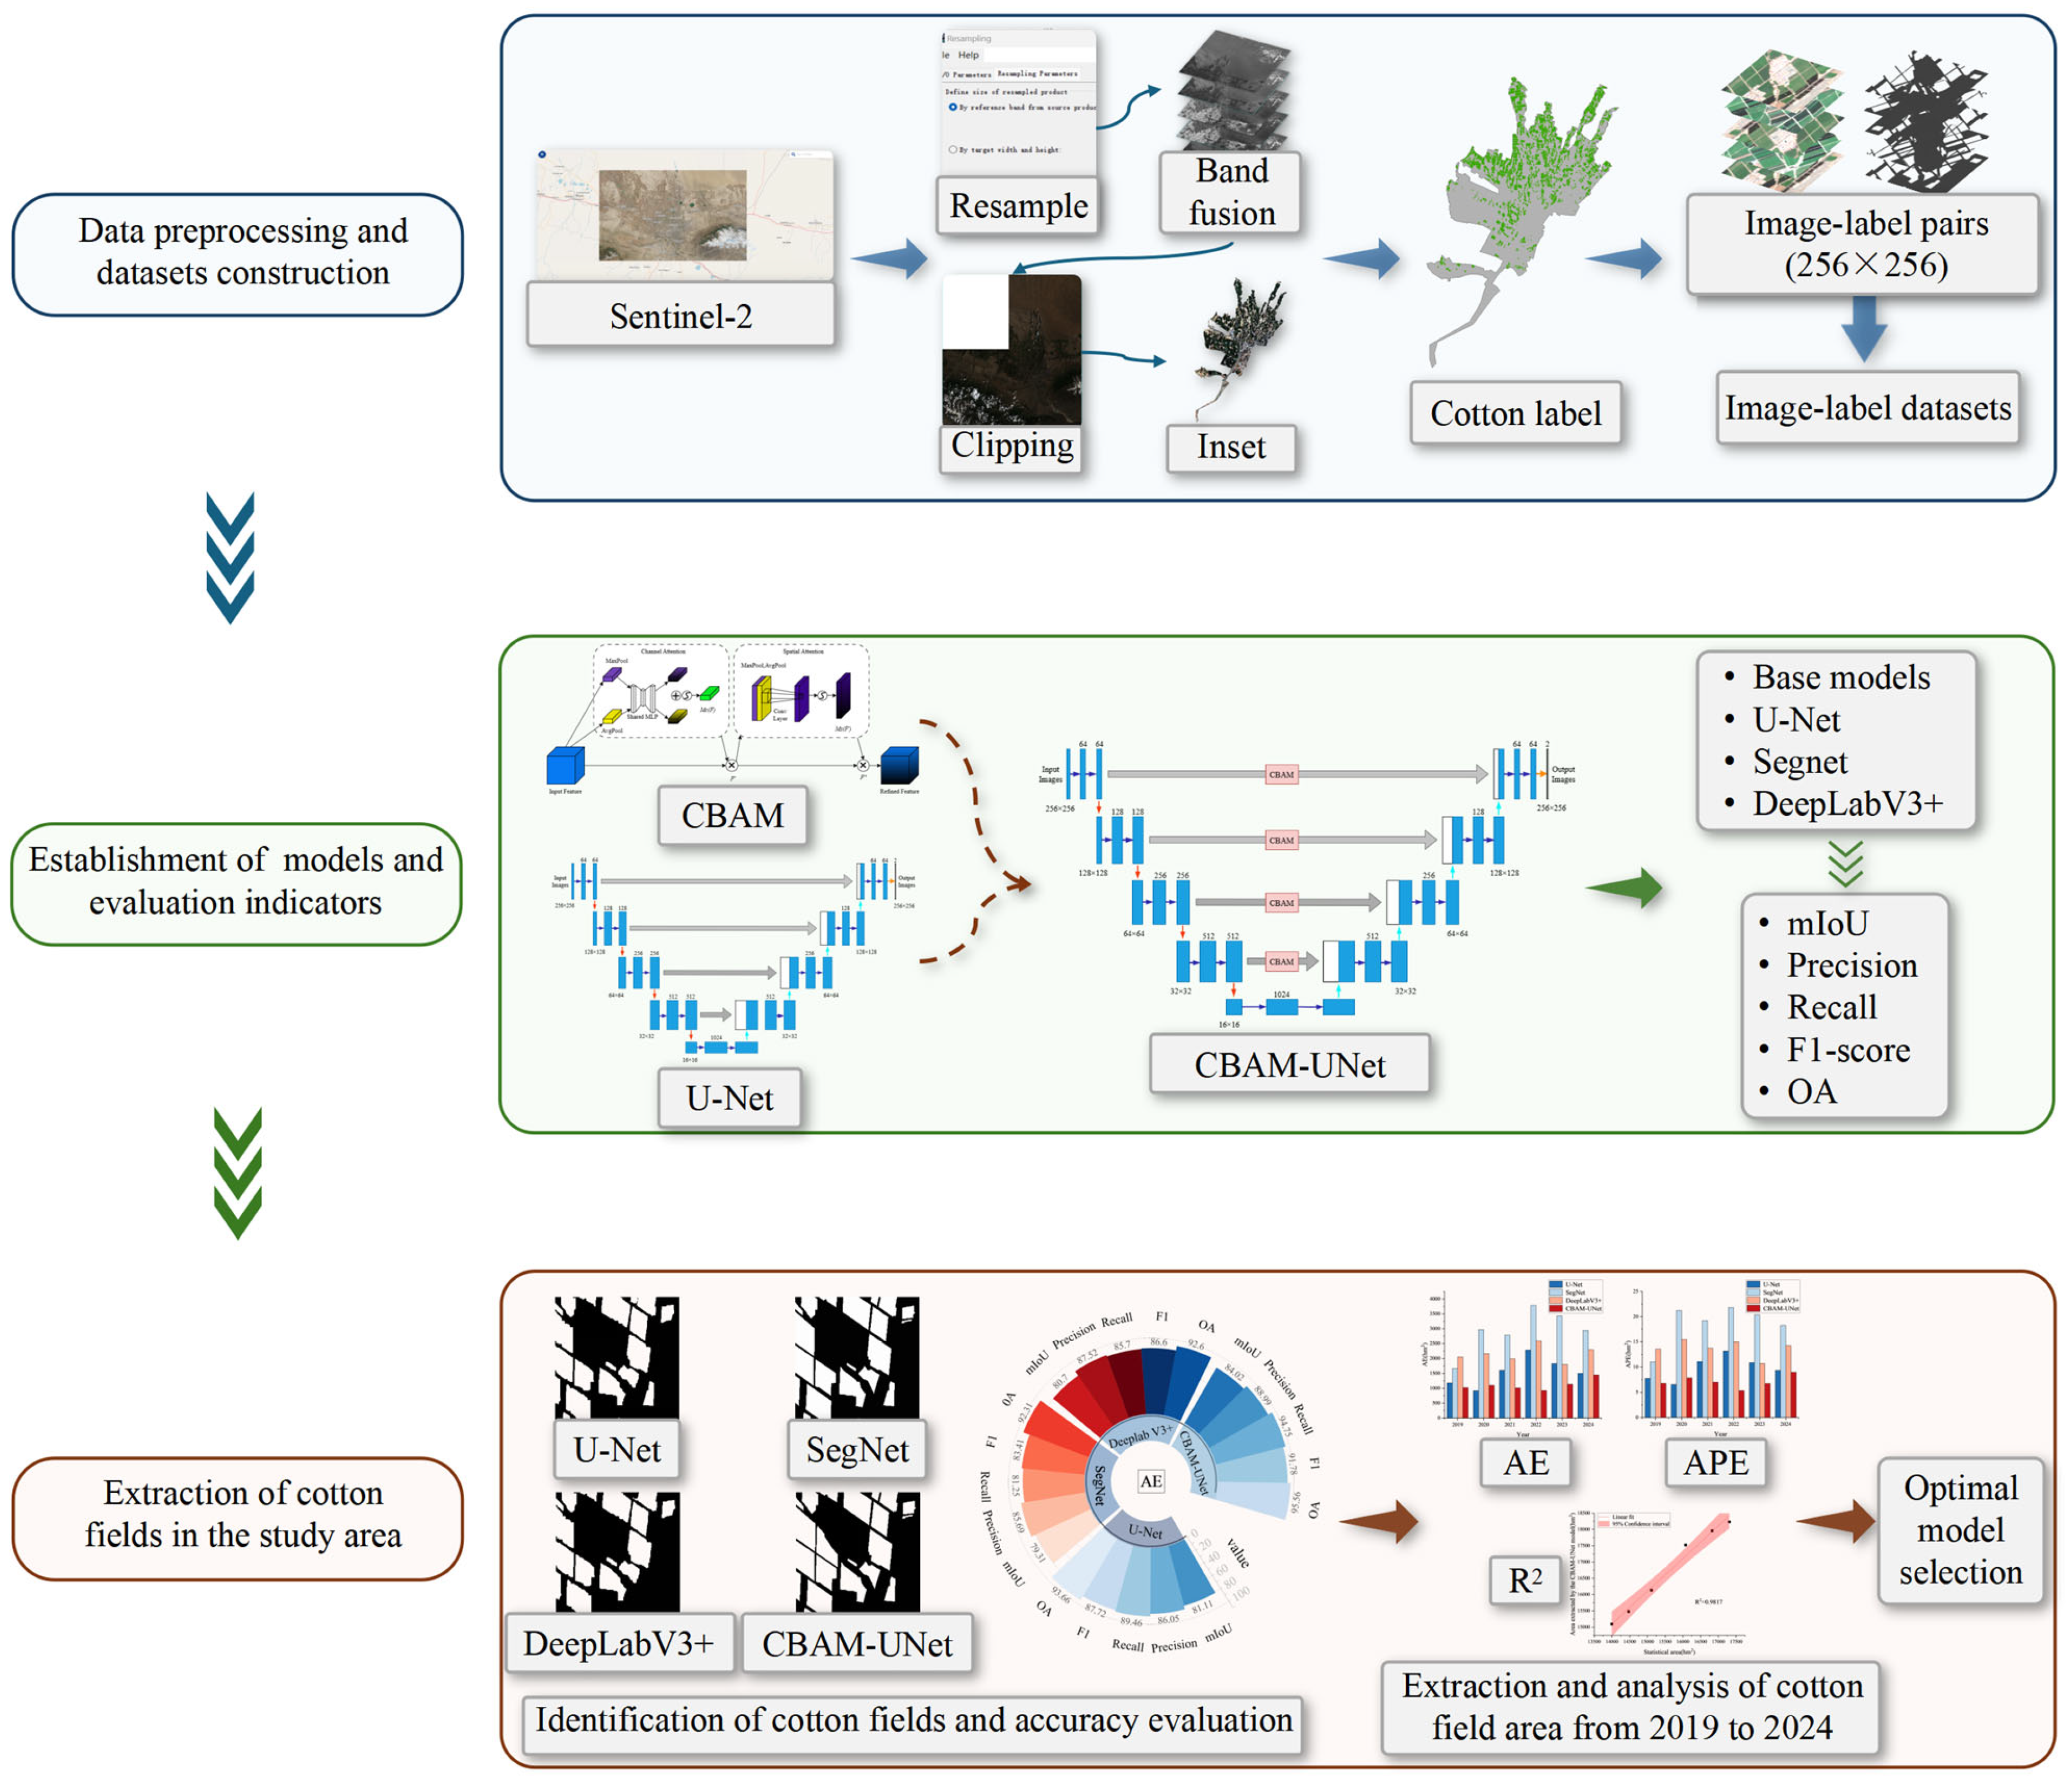
In this study, we utilized preprocessed Sentinel-2A multispectral imagery with a 10 m resolution to generate cotton classification labels through manual annotation. The completed image–label dataset was employed to develop four distinct deep learning models, namely U-Net, SegNet, DeepLabV3+, and CBAM-UNet models, for extracting and evaluating the spatial distribution patterns and classification accuracy of cotton cultivation in the Santun River Irrigation District from 2019 to 2024. The complete technical methodology is illustrated in Figure 4.

3.1. Establishment of the CBAM-UNet Model

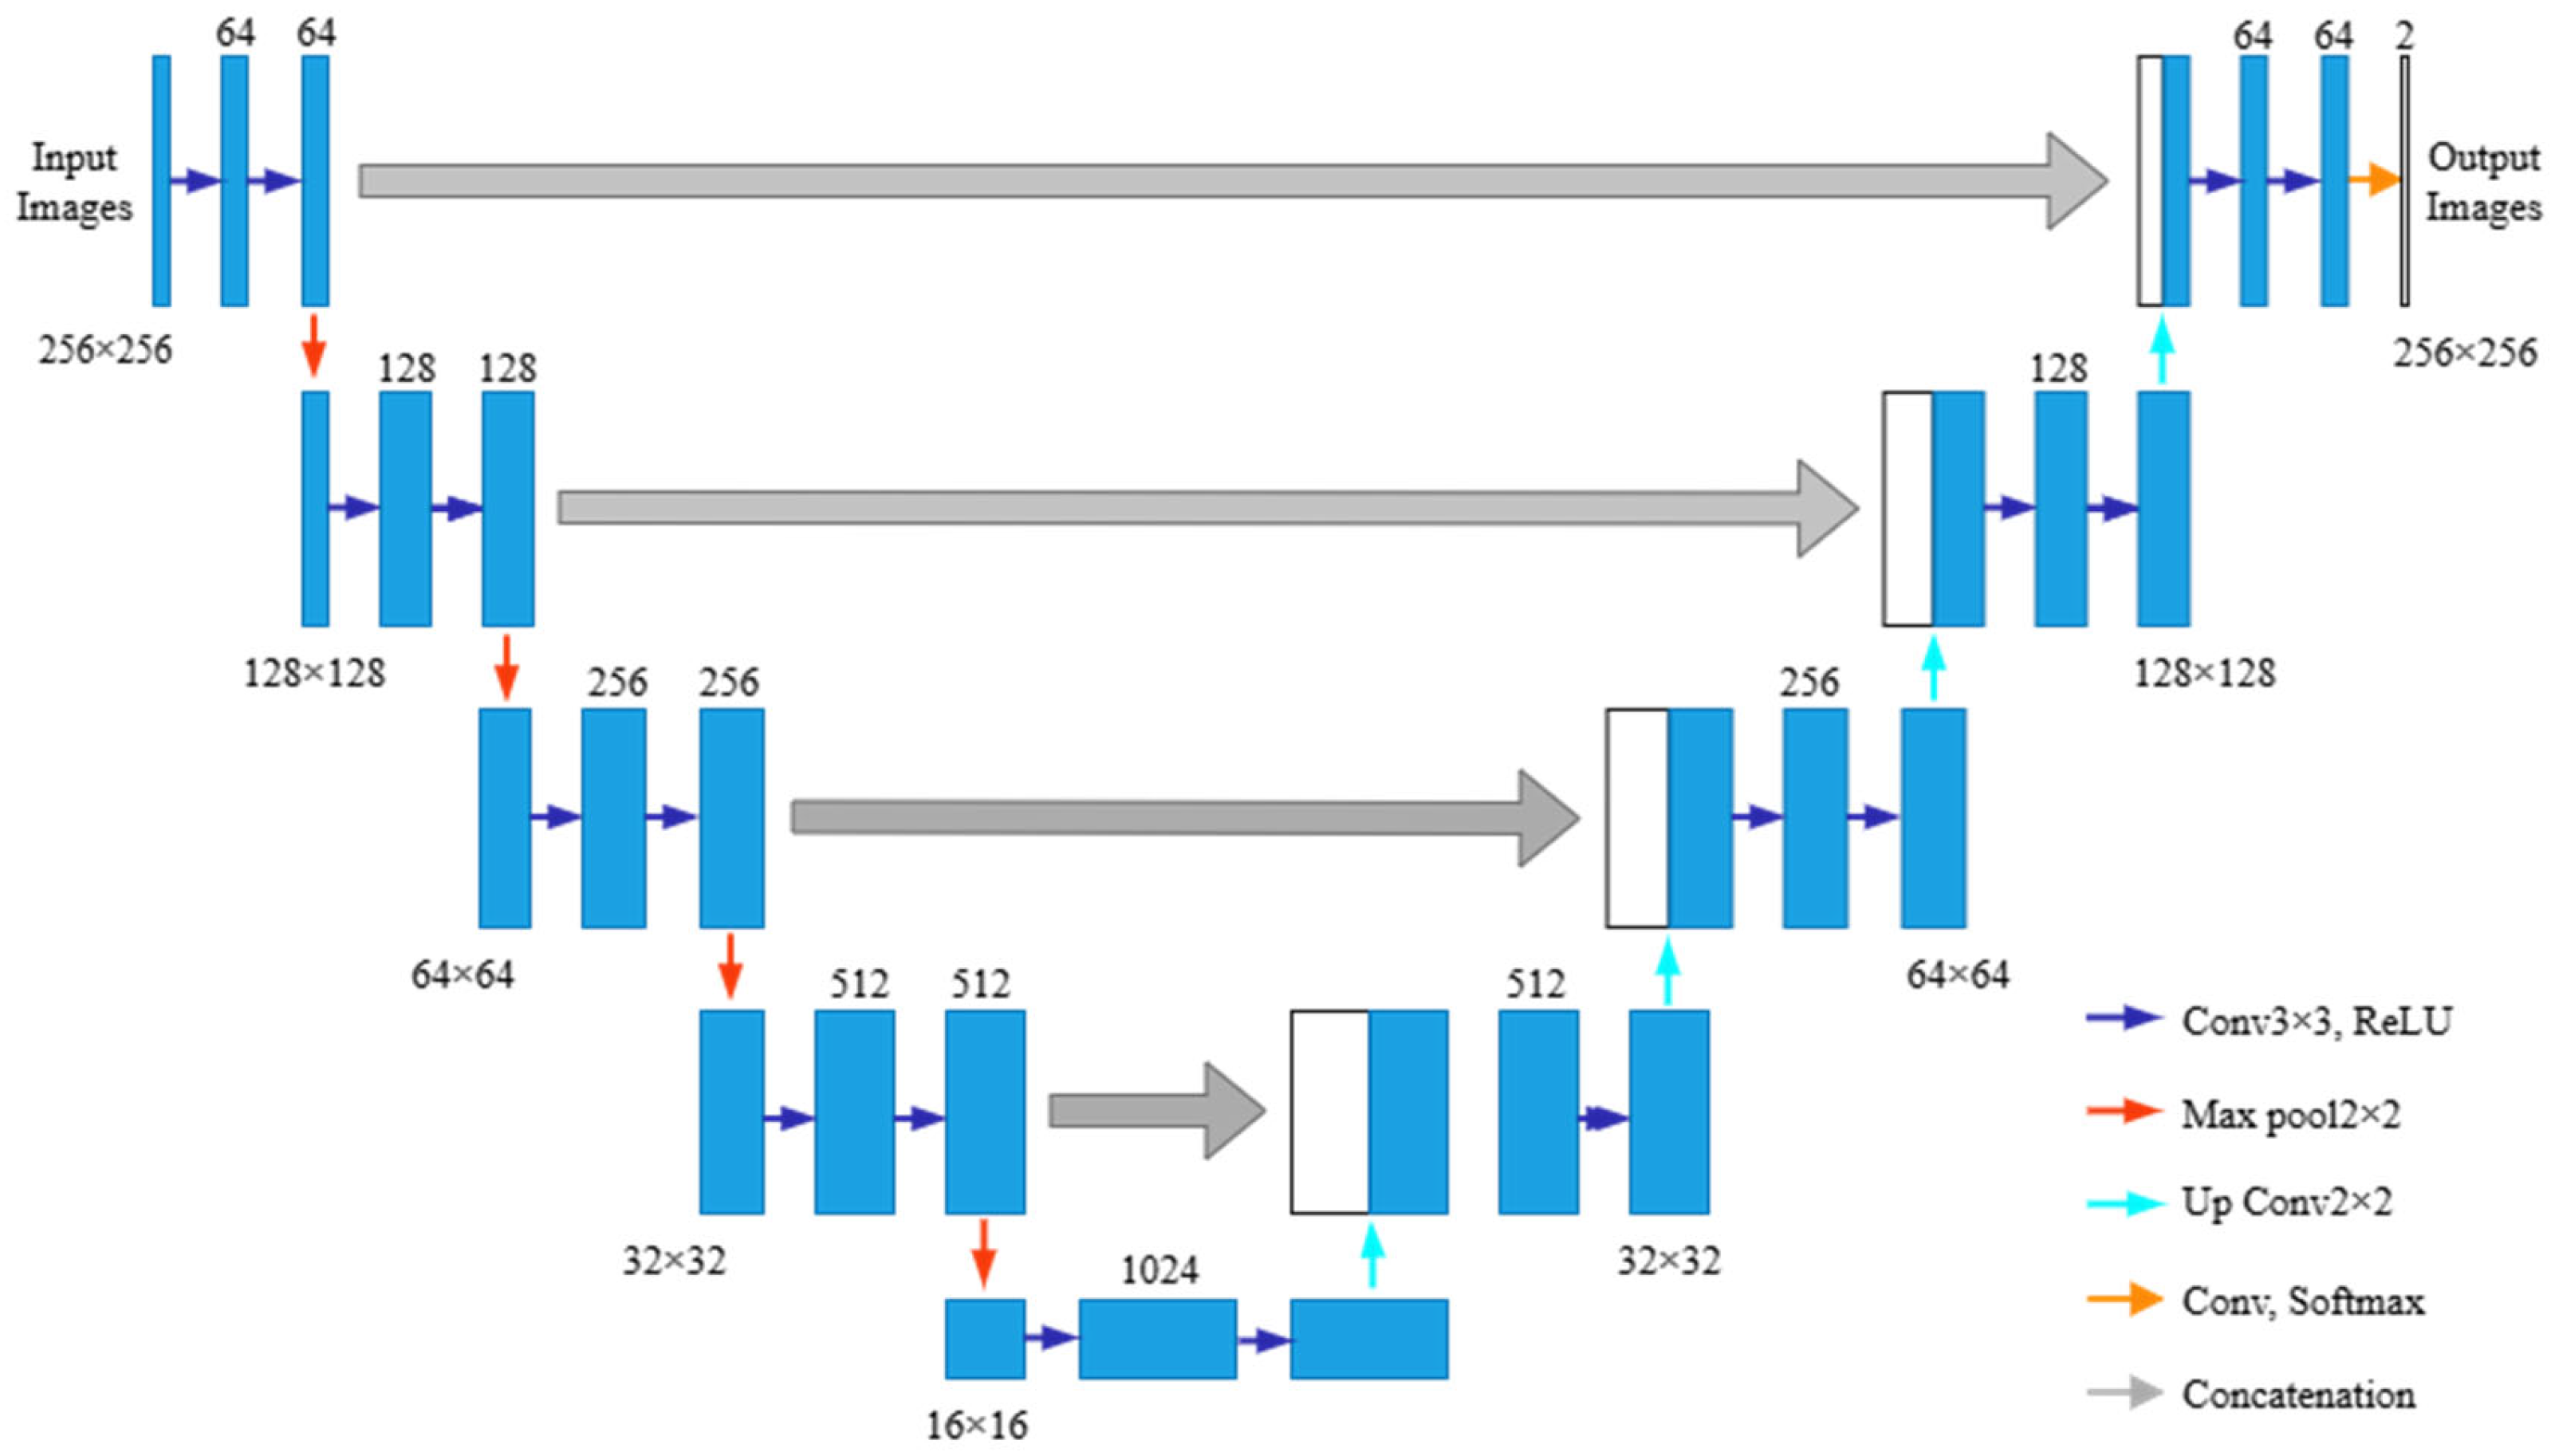
The U-Net architecture is a widely adopted segmentation network that has been demonstrated to have extensive applications in medical imaging [28]. As illustrated in Figure 5, this network employs a symmetrical encoder–decoder structure. When processing input images, the encoder performs two successive 3 × 3 convolutions to extract meaningful feature maps, followed by ReLU nonlinear activation and downsampling through 2 × 2 max pooling operations. This sequence of operations is repeated three times, resulting in four downsampling stages that ultimately yield five distinct feature hierarchies. The decoder initiates processing from the deepest feature layer, where upsampling generates new feature maps that are subsequently concatenated with corresponding encoder features from the fourth level. This feature fusion is followed by two 3 × 3 convolutions. The network progressively repeats this upsampling and concatenation process with third-level encoder features, with a total of four upsampling stages. The final output maintains spatial dimensions identical to those of the original input through a series of transformations: two additional 3 × 3 convolutions and then a 1 × 1 convolution that adjusts the channel dimensions to match the number of target classes, thereby producing the ultimate prediction output.
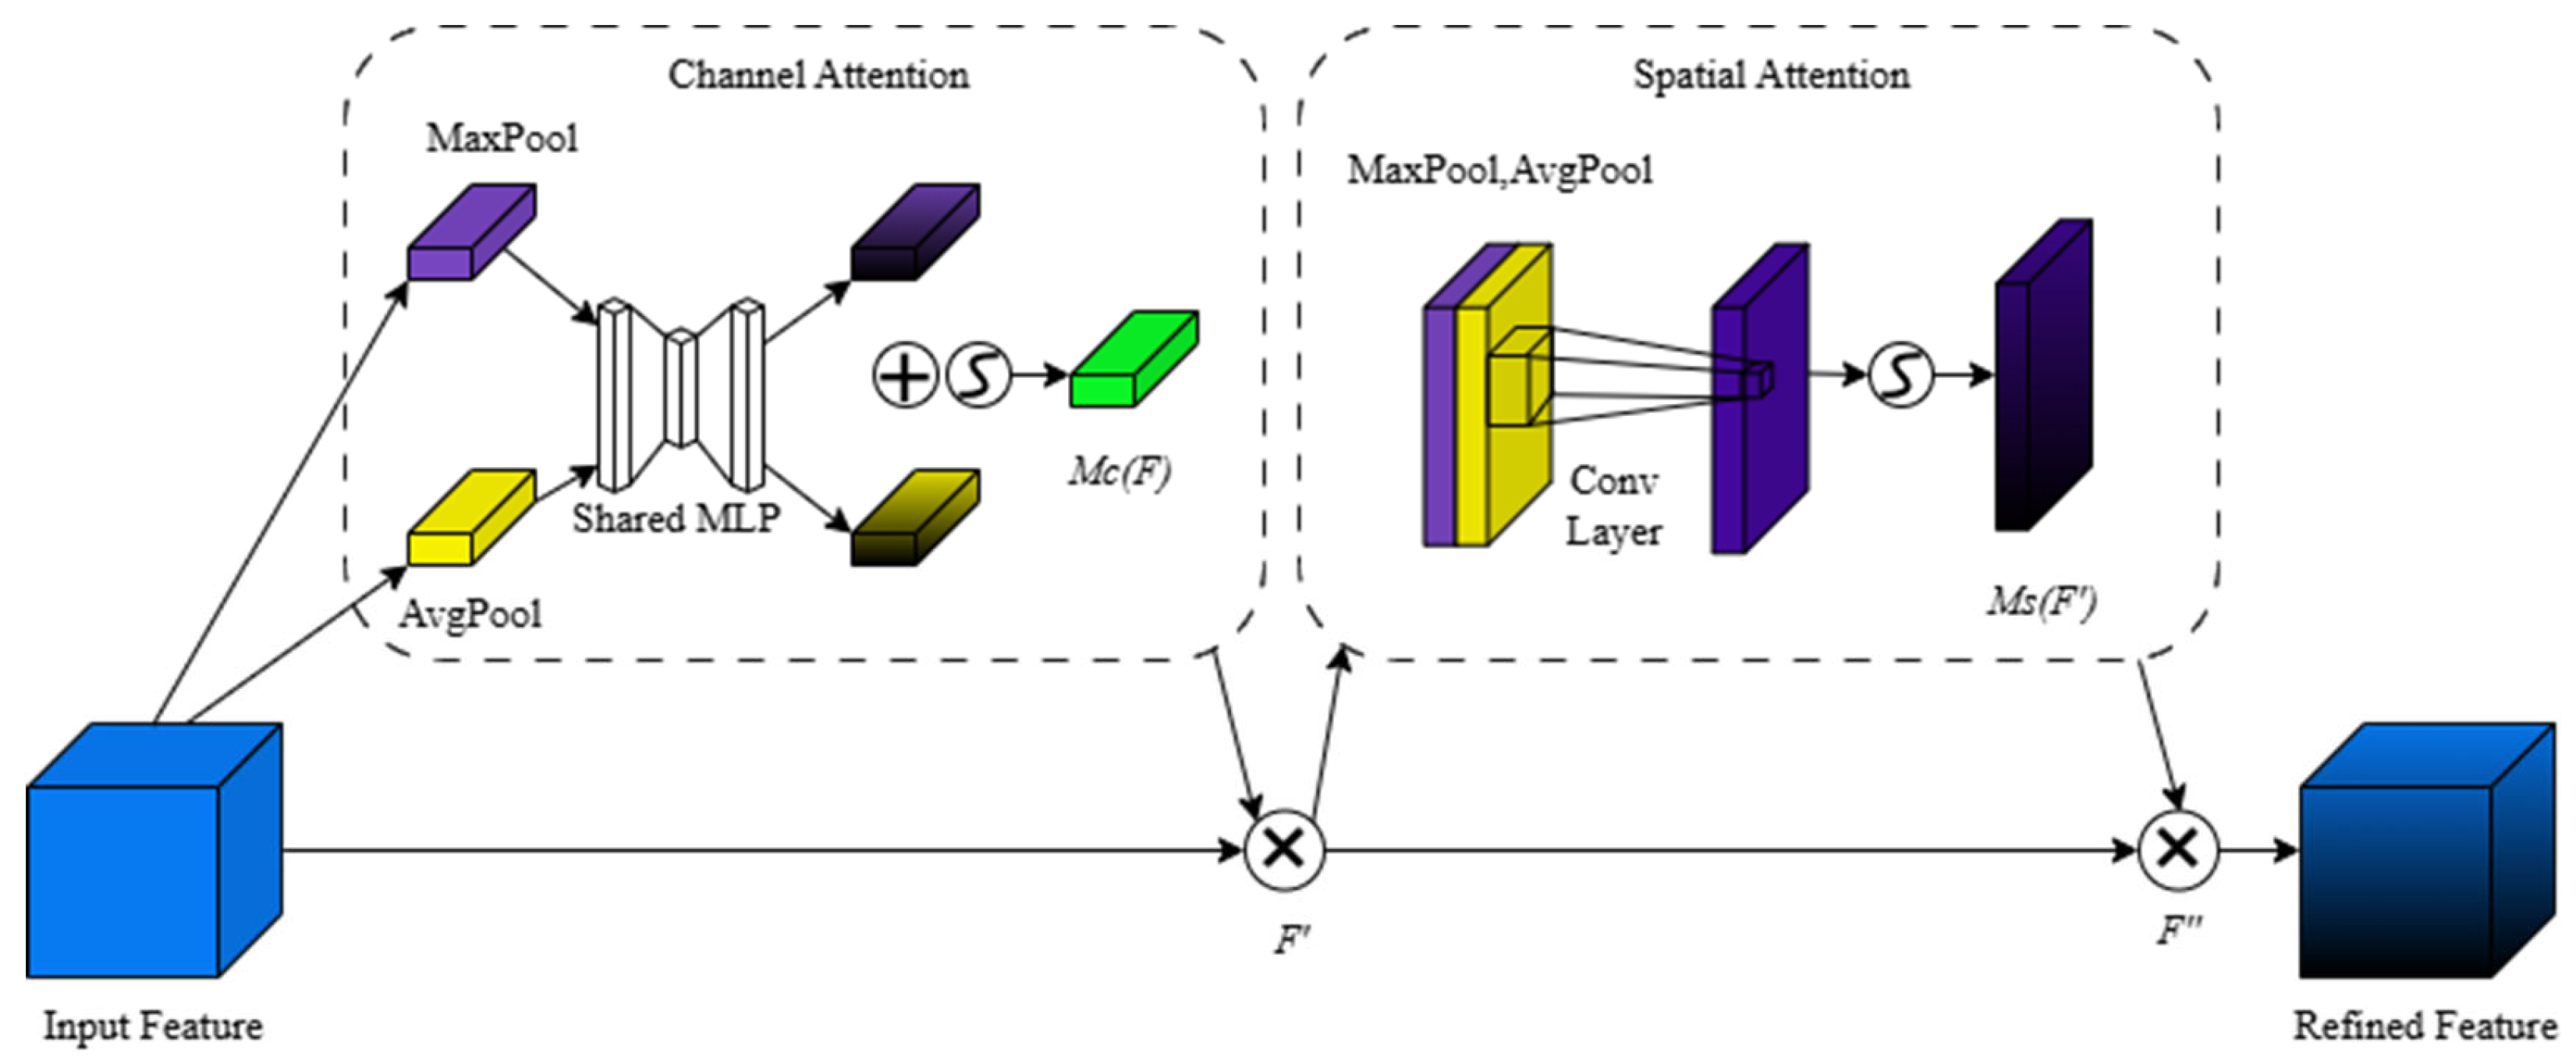
To achieve more accurate extraction of cotton cultivation areas, in this study, we incorporated the CBAM [29]. The CBAM consists of two sequential submodules: the channel attention (CA) module and the spatial attention (SA) module (Figure 6). The CA module generates channel attention feature maps by modeling the inter-channel relationships of features [30]. The CA mechanism processes input feature map F through parallel max-pooling and average-pooling operations to produce two distinct feature descriptors, thereby mitigating information loss inherent in single pooling approaches. These pooled features are subsequently fed into a shared multilayer perceptron (MLP) network that performs dimension reduction followed by expansion. The MLP outputs are then combined through element-wise summation and are processed by a sigmoid activation function to generate the final channel attention weights. The mathematical representation of the channel attention is as follows:
M C F = σ M L P A P F + M L P M P F .
The SA module generates spatial attention feature maps by modeling the spatial relationships among feature attributes [31]. In contrast to the CA module, the SA module emphasizes the positional information of meaningful features within the input feature maps. The SA mechanism processes the input features through parallel max-pooling and average-pooling operations along the channel axis, and then it concatenates the resulting features to highlight the positionally significant regions. This concatenated output is then processed by a convolutional network that reduces the dimensionality to a single channel, followed by sigmoid activation to produce the final spatial attention weights. The mathematical representation of the spatial attention is as follows:
M S F = σ f A P F , M P F .
The CBAM attention mechanism is sequentially applied to remote sensing images through channel and spatial dimensions. Specifically, the input feature map F is first multiplied element-wise by the channel attention feature map to produce intermediate features F. These refined features F are then multiplied element-wise by the spatial attention feature map, ultimately generating the final output features F:
F = M C F F .
F = M S F F .
The improved U-Net architecture incorporating the CBAM, designated as CBAM-UNet, is illustrated in Figure 7. In this enhanced network, the feature maps generated by the encoder branch are first processed through the CBAM before being fused with the corresponding features from the decoder branch. This design enables selective amplification of discriminative features critical for crop identification while suppressing less relevant features, thereby significantly improving the network’s precision in field boundary extraction and crop classification.

3.2. Model Training

The experimental environment for the deep learning models was established on a Windows 10 system with a PyTorch framework (v2.0.0), utilizing an Intel Xeon Gold 6142 central processing unit (CPU) and an NVIDIA GeForce RTX 3070 graphics processing unit (GPU). To ensure consistent experimental conditions, all of the models were configured with identical parameters: the Adam optimizer was employed for all of the architectures, and the cross-entropy function was used as the loss function for the model training. The initial learning rate was set to 0.0001, the batch size was set to 8, and the number of training iterations was set to 100 epochs. The model training procedure included six sequential steps.
(1)
Data preparation: organize and preprocess the dataset for model training.
(2)
Parameter initialization: assign random initial values to all of the weights and biases of the neurons within the model.
(3)
Forward propagation: feed the input images and their associated labels into the model, performing layer-wise computations from the input layer to the output layer.
(4)
Loss computation: compare the model’s predictions with the ground truth labels and compute the value of the loss function to quantify the prediction errors.
(5)
Backpropagation: propagate the error signals backward from the output layer to the input layer, updating the model’s weights and biases using the optimization algorithm to minimize the loss.
(6)
Iterative training: repeat the forward propagation, loss computation, and backpropagation steps until the loss function converges below a predefined threshold.

3.3. Accuracy Evaluation Indicators

The performances of the network models were quantitatively evaluated using four metrics: the mIoU, precision, recall, F1-score, and OA, for which higher values indicate a better segmentation performance [32].
The mIoU represents the average similarity between the predicted pixels and ground truth across all classes [33]:
m I o U = 1 k + 1 i = 0 k T P F N + T P + F P .
The precision is the average proportion of correctly classified pixels across all classes [34]:
P r e c i s i o n = T P T P + F P .
The recall represents the proportion of correctly classified pixels to all actual pixels [35]:
R e c a l l = T P T P + F N
The F1-score balances the precision and recall and performs well under imbalanced distributions [36]:
F 1 s c o r e = 2 × T P F N + 2 × T P + F P .
The over accuracy measures the ratio of the correctly classified samples to the total samples [37]:
O A = T P + T N T P + T N + F P + F N
where true positives (TP) is the number of pixels with both the true value and the predicted value being 1; false positive (FP) is the number of pixels with the true value being 0 but the predicted value being 1; true negatives (TN) is the number of pixels with both a true value and a predicted value of 0; false negatives (FN) is the number of pixels with a true value of 1 and a predicted value of 0.

4. Results and Analysis

4.1. Comparative Analysis of Cotton Extraction Results Across Different Models

In this study, we employed four models, namely U-Net, SegNet, DeepLabV3+, and CBAM-UNet, all of which were trained and tested using identical datasets. The models were evaluated using the MIoU, precision, recall, F1-score, and OA as performance metrics. The results are compared in Table 3. The evaluation revealed that the accuracies of the models exhibited the following order: CBAM-UNet > U-Net > DeepLabV3+ > SegNet. The CBAM-UNet model achieved the highest accuracy of 95.56%, indicating its superior performance in cotton cultivation area classification. These results confirm that deep learning enables pixel-level analysis with enhanced classification capabilities for target features. The CBAM-UNet model achieved mIoU, precision, and recall values of 85.02%, 94.75%, and 88.99%, respectively, representing improvements of 2.91%, 4.73%, and 3.32% in the mIoU; 2.94%, 3.30%, and 1.47% in precision; and 5.29%, 13.5%, and 9.05% in recall compared to U-Net, SegNet, and DeepLabV3+. Similarly, its F1-score of 91.78% exceeded those of U-Net, SegNet, and DeepLabV3+ by 4.06%, 8.38%, and 5.18%, respectively. Among all of the models evaluated, SegNet achieved the poorest performance across all of the metrics, while the attention-enhanced CBAM-UNet consistently achieved the best results for every evaluation criterion.
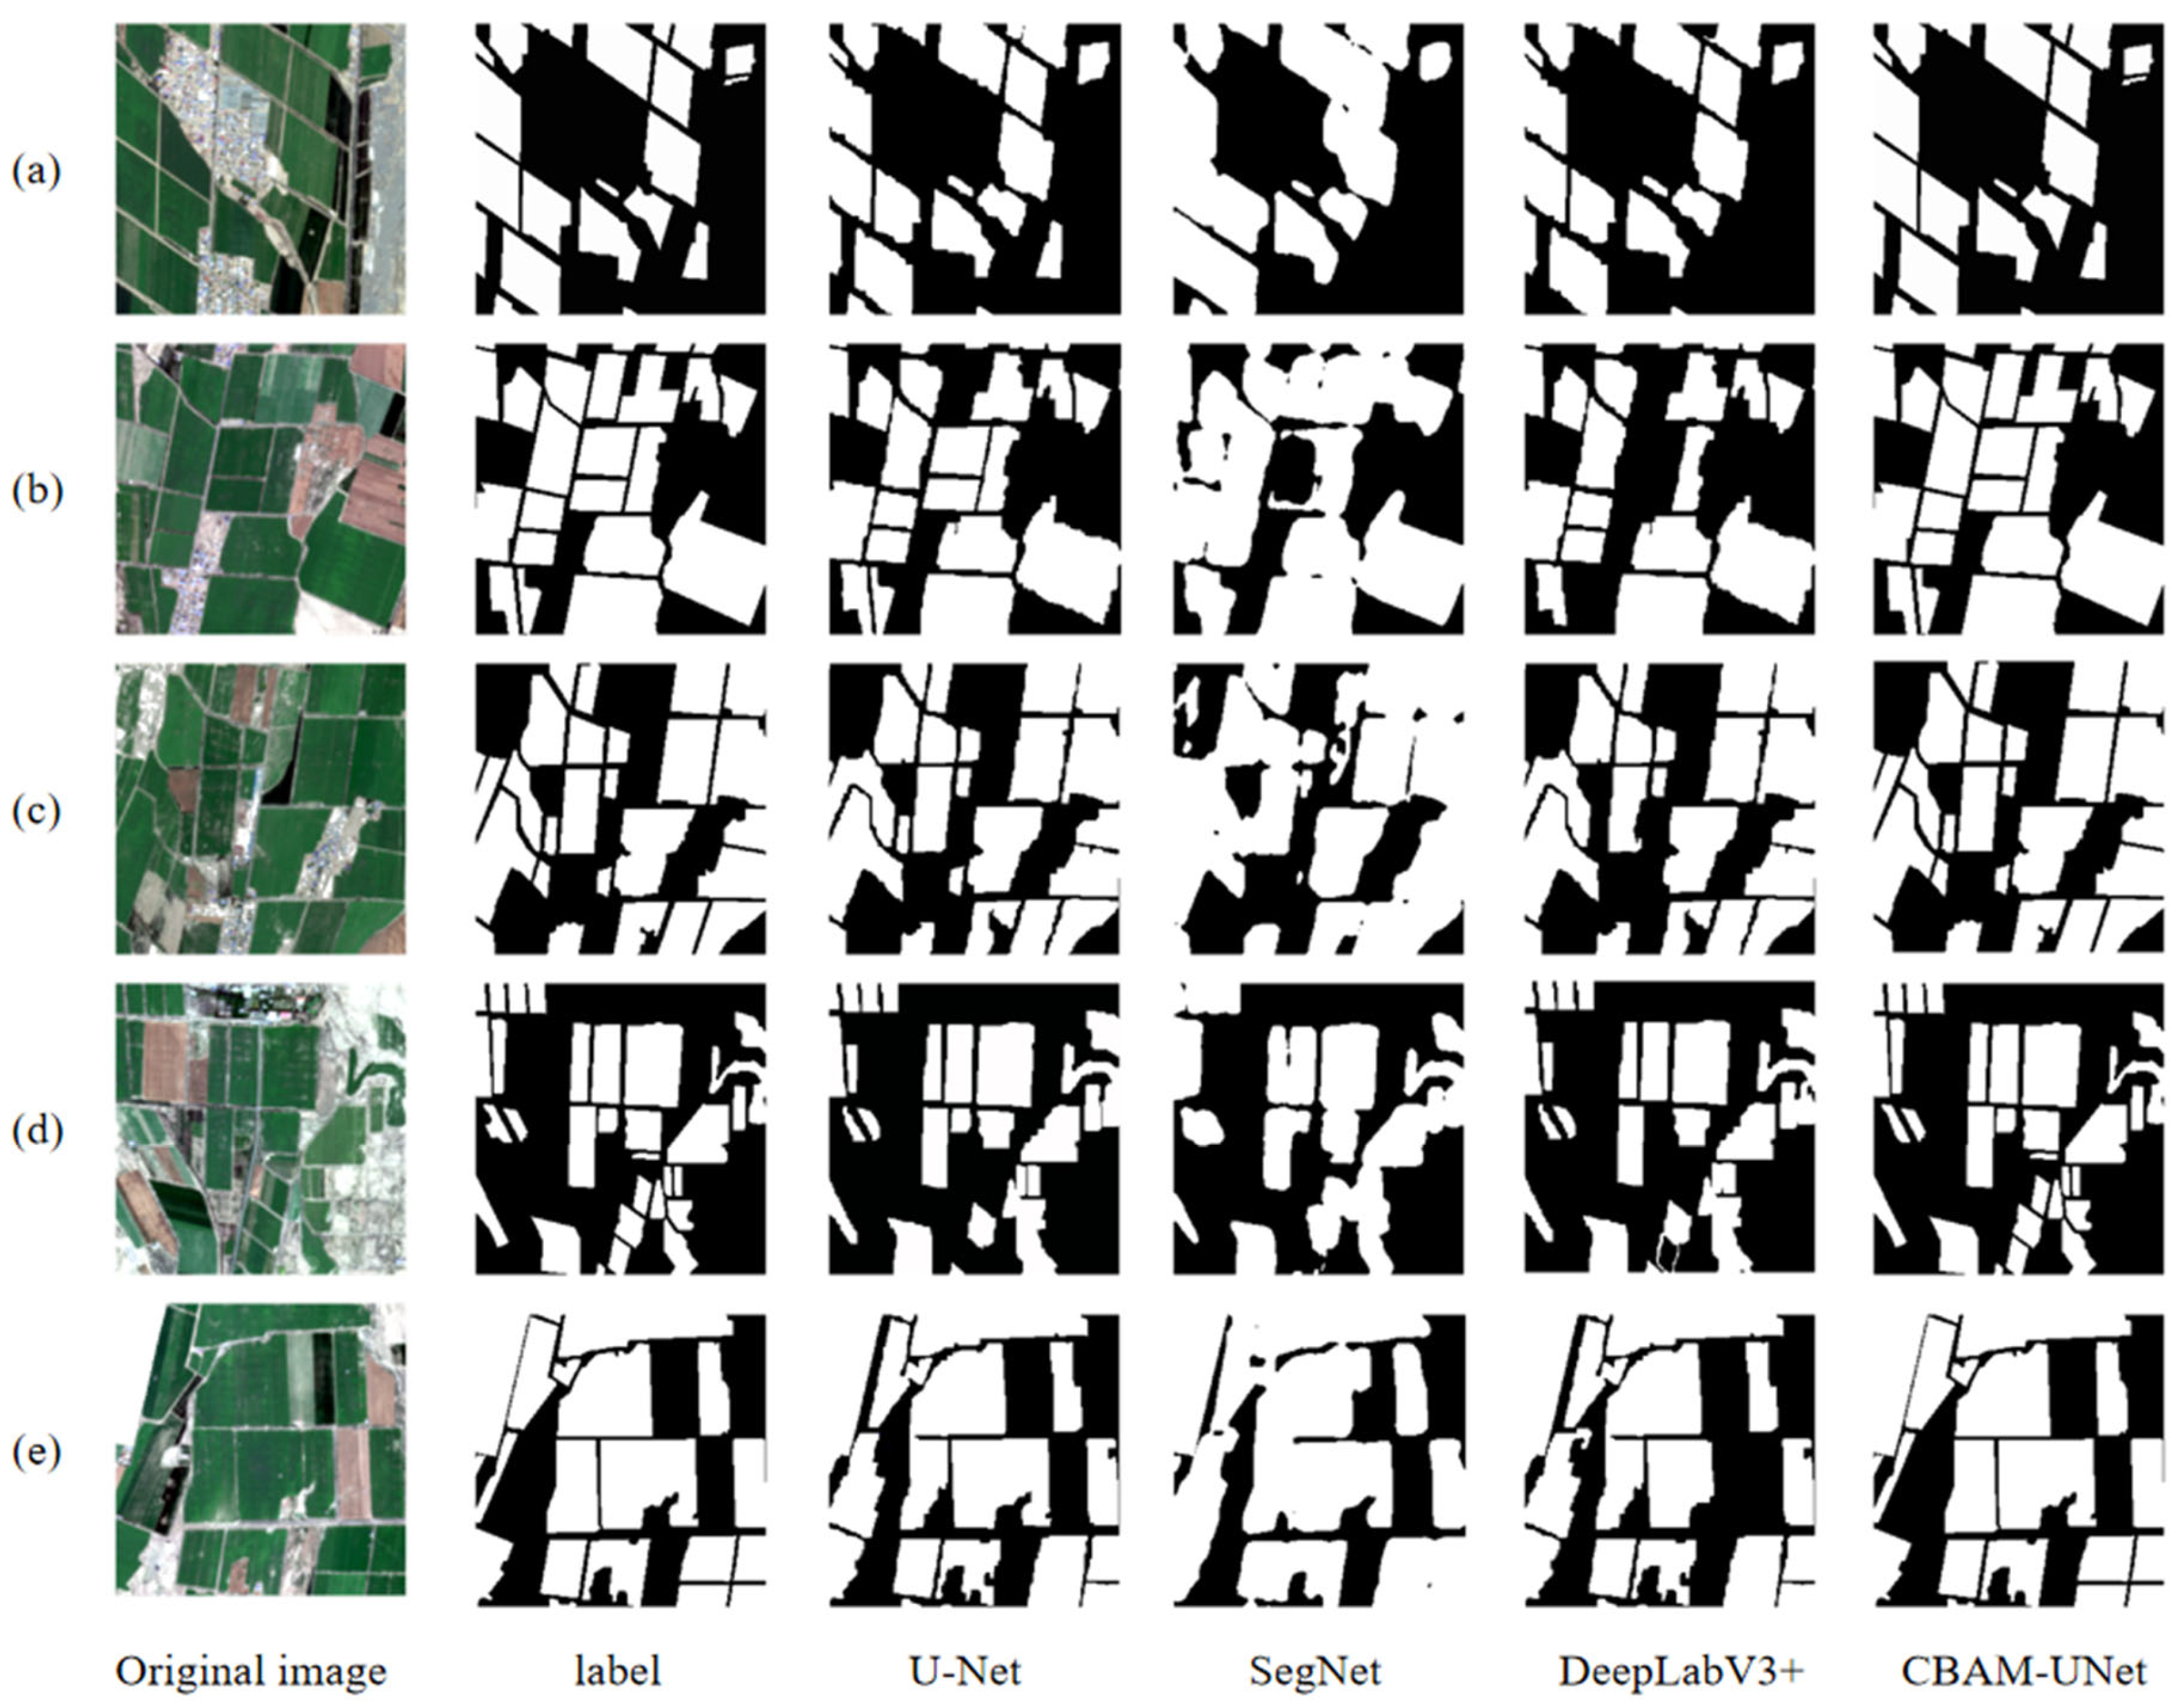
We used the experimental results to compare the accuracies of the cotton field extraction results obtained using different deep learning methods through five representative images (Figure 8). In Figure 8a,e, the classification results of the four networks exhibit minor variations, and all of the models, except SegNet, successfully segment the boundary information. Figure 8b reveals that SegNet and DeepLabV3+ failed to identify two cotton areas, while both U-Net and CBAM-UNet achieved correct classification, demonstrating the superior extraction performances of these two models. A similar scenario is observed in Figure 8d, where only the CBAM-UNet model achieved correct classification without any omission errors. Figure 8c shows that SegNet misclassified two non-cotton regions as cotton fields, whereas the remaining models correctly identified these areas.
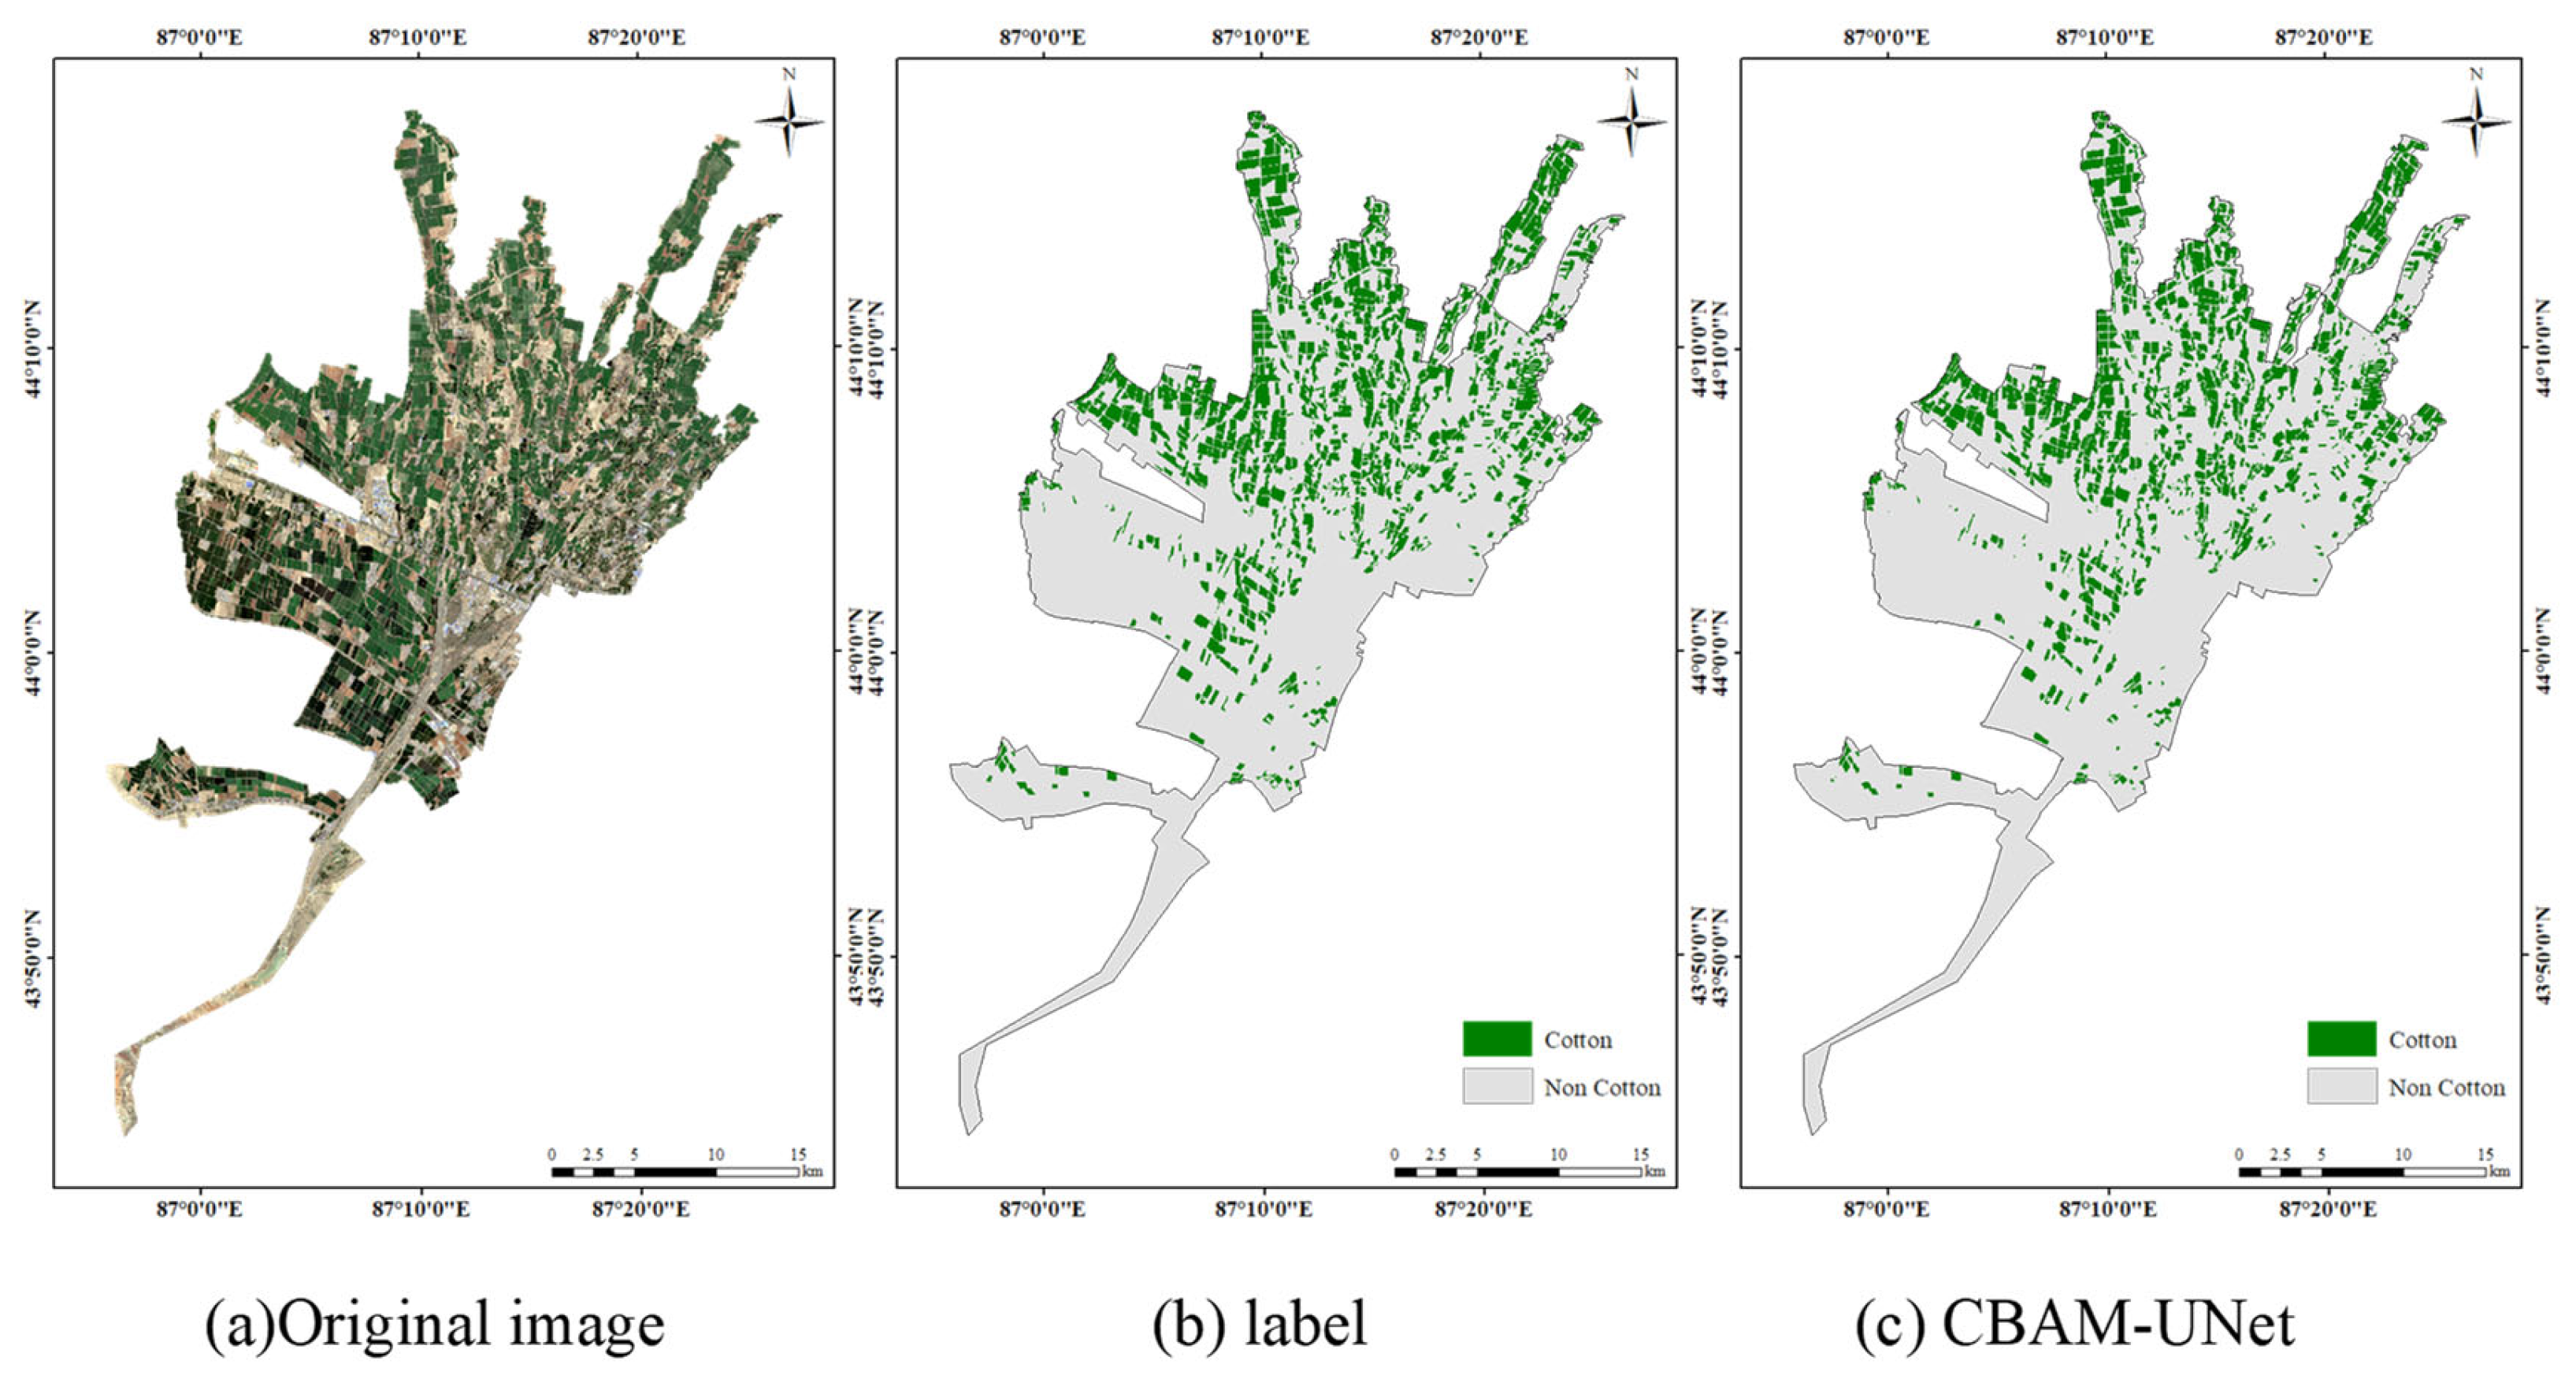
Overall, the U-Net model achieved a relatively good segmentation performance, though it still exhibited partial loss of edge information, particularly in scenarios involving small cotton fields or areas with extensive bare soil and other crops. The SegNet results exhibit noticeably smoother segmentation than the results obtained using the other methods, and the extracted cotton regions appeared as large connected patches that failed to accurately represent the actual angular boundaries of the cotton fields, demonstrating significant edge information loss and a suboptimal segmentation quality. The DeepLabV3+ approach resulted in evident misclassification issues, and its performance was slightly inferior to that of U-Net in terms of the segmentation accuracy. Through the incorporation of the CBAM module to enhance the key features, the CBAM-UNet model achieved marked improvement of the segmentation results. This enhanced architecture produced more complete cotton field extractions with clearer boundaries and effectively preserved the edge details of roads, buildings, and other features while mitigating under-segmentation and misclassification problems in complex environments. The spatial distribution of the cotton fields extracted by CBAM-UNet is presented in Figure 9, demonstrating its superior capability in maintaining geometric fidelity and boundary precision across varying landscape conditions.

4.2. Analysis of Cotton Cultivation Area Extraction in the Study Area from 2019 to 2024

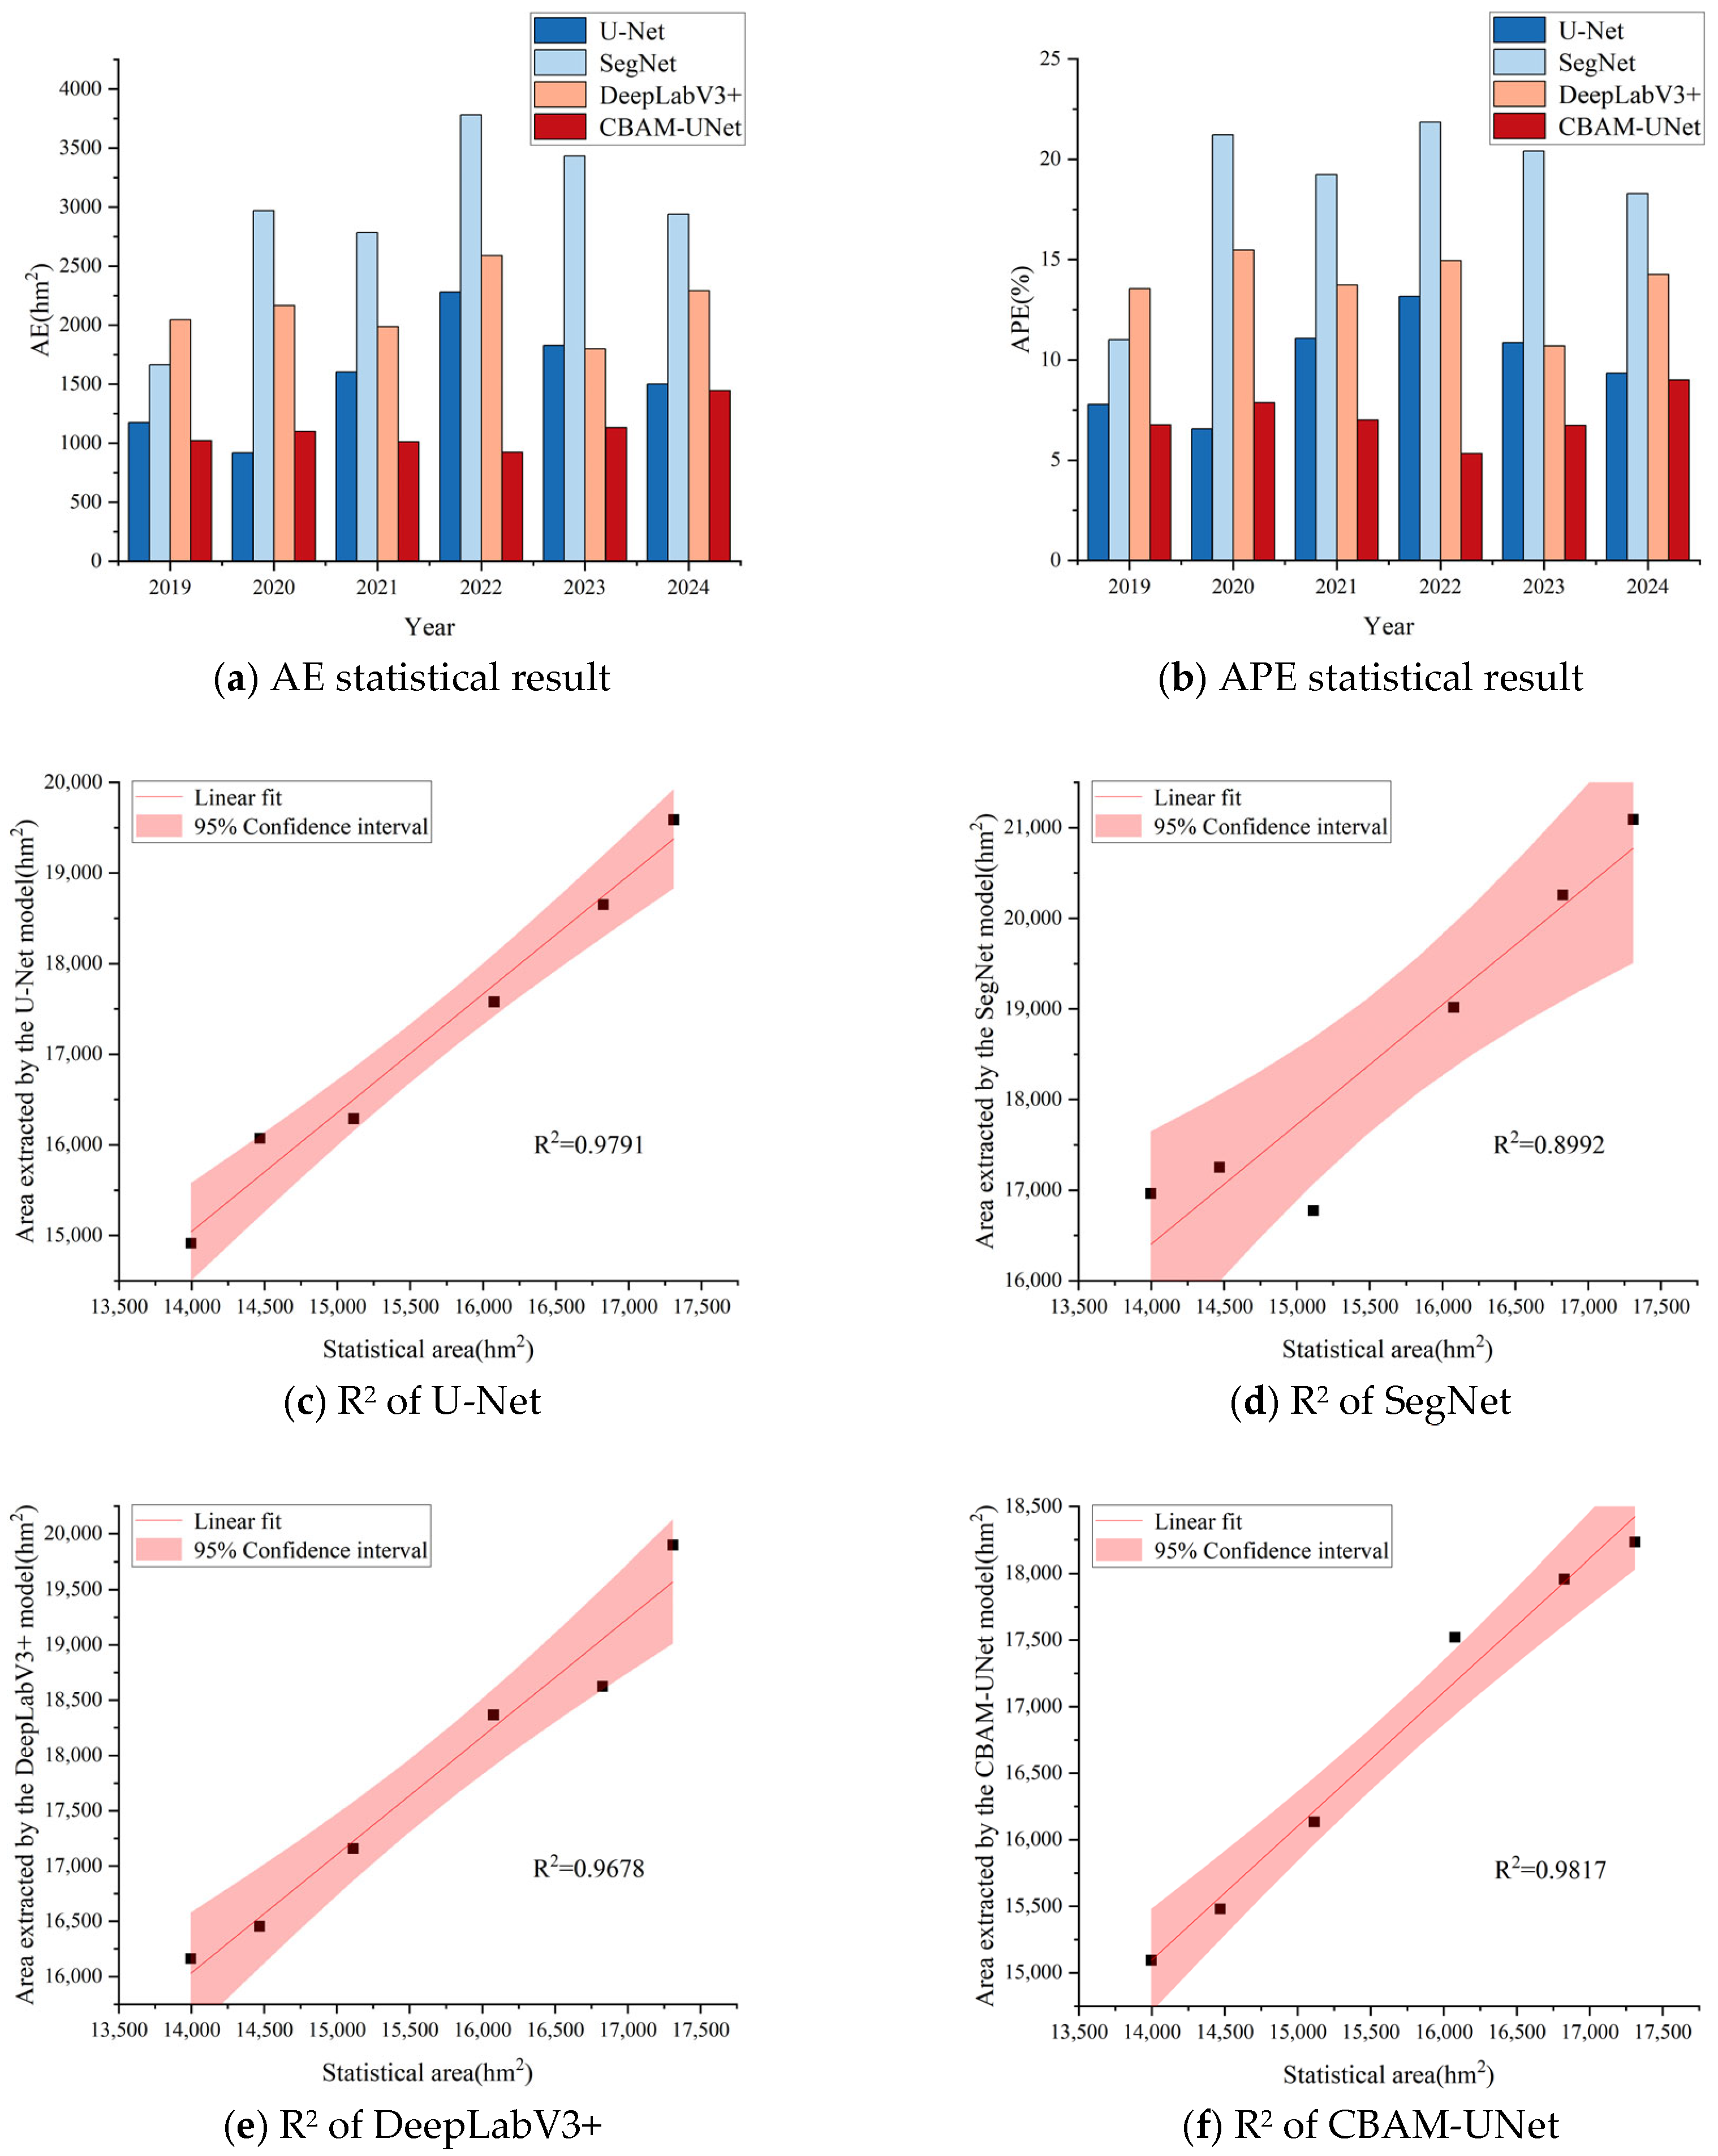
To further evaluate the performances of the four models, the cotton cultivation areas in the Santun River Irrigation District from 2019 to 2024 were extracted using the U-Net, SegNet, DeepLabV3+, and CBAM-UNet models. These results were compared with statistical data and assessed using the absolute error (AE), absolute percentage error (APE), and correlation coefficient for accuracy validation (Figure 10). Regarding the AE metric, the U-Net model yielded AE values ranging from 918.04 to 2278.54 hm2, while SegNet produced AE values ranging from 1663.67 to 3782.11 hm2. The DeepLabV3+ model yielded AE values between 1799.87 and 2588.55 hm2. In comparison, the CBAM-UNet model achieved a superior performance, with AE values confined to the narrower range of 923.69–1445.46 hm2. Regarding the APE evaluation, the U-Net model maintained the most annual APE values, ~10%, whereas SegNet maintained approximately 20% APE across most years. The DeepLabV3+ model had APE values between 10% and 15%, while the CBAM-UNet consistently achieved APEs of less than 10%, with the lowest value of 5.34% recorded in 2020.
Furthermore, correlation analysis between the model-extracted cotton areas and statistical data revealed that the CBAM-UNet achieved the highest correlation coefficient of 0.9817, followed by U-Net (0.9791), DeepLabV3+ (0.9678), and SegNet (0.8992). These results further confirm that the CBAM-UNet model attained the highest classification accuracy among all of the evaluated models.

5. Discussion

5.1. Comparison and Analysis of Different Models

In this study, we employed Sentinel-2A remote sensing data from 2019 to 2024 to conduct cotton extraction and compared the performances of four different models: U-Net, SegNet, DeepLabV3+, and CBAM-UNet. The U-Net model enhanced with attention mechanisms had a superior segmentation performance, achieving the highest values of the evaluation metrics, including mIoU (84.02%), precision (88.99%), recall (94.75%%), F1-score (91.78%), and OA (95.56%), among all of the models. Both U-Net and DeepLabV3+ achieved the second-best performances, with U-Net slightly outperforming DeepLabV3+, while SegNet yielded the poorest results across all of the metrics. These findings align with those of Zhao et al. [38], who achieved optimal segmentation performance using the CBAM-enhanced U-Net for winter wheat extraction in Zhengding County and Zengcun Town, Hebei Province; of Saadat et al. [39], who achieved improved segmentation performance using the CA module in multi-channel flow deep feature extraction models for rice mapping in Mazandaran Province, Iran; and of Zou et al. [40], who achieved the highest accuracy using DeepLabV3+ with a dissimilarity attention module (DAM) for cotton field identification in Shihezi Oasis, Xinjiang.
The superior performance can be attributed to the CBAM’s dual attention mechanism, which operates through both channel and spatial dimensions, establishing a hierarchical attention structure from channels to spatial features. The spatial attention mechanism enables the network to focus on pixel regions critical for classification tasks, while the channel attention adjusts the feature map channel allocation. By comprehensively considering both channel and spatial information to refine the feature maps, the CBAM allows more effective redistribution of weight resources and extraction of more discriminative features, thereby enhancing the model’s data interpretation and analysis capabilities [41]. In this study, the integration of the CBAM significantly improved the U-Net model’s precision in identifying and extracting cotton fields, particularly in complex backgrounds and when distinguishing cotton from similar vegetation types. Through meticulous adjustment of both the channel and spatial features, the network could better focus on the cotton-related characteristics in the imagery, consequently improving the classification and recognition accuracy.
CBAM-UNet has been employed in prior crop extraction studies [24,38], with our work focusing solely on regional adaptation and temporal testing of the model. Additionally, this study selected relatively fundamental models such as U-Net, SegNet, and DeepLabV3+ for cotton extraction due to their extensive application in pivotal crop extraction research [42,43]. The efficacy of these baseline models is well documented. While state-of-the-art models like vision transformer demonstrate remarkable capabilities, they typically require larger datasets and greater computational resources to outperform CNNs under conditions of limited labeled samples—a common challenge in remote sensing. Nevertheless, the potential of the vision transformer model in agricultural remote sensing cannot be overlooked. Future work will explore its application, along with other advanced models, for crop extraction when more labeled samples become available.

5.2. Analysis of the Causes of Changes in Cotton Cultivation Areas in the Study Area from 2019 to 2024

In this study, we employed four deep learning models, namely U-Net, SegNet, DeepLabV3+, and CBAM-UNet, to extract cotton cultivation areas in the Santun River Irrigation District from 2019 to 2024, with the aim of further evaluating their extraction accuracies. The results demonstrate that the CBAM-UNet model achieved the highest extraction precision. Figure 11 presents a comparison of the CBAM-UNet extracted cotton areas and statistical data. The model estimated cotton cultivation areas of 16,134.14 hm2 in 2019 and 17,521.94 hm2 in 2024. The overall trend from 2019 to 2024 exhibits an approximate 8.60% increase in the cotton cultivation area, which can be attributed to several key factors. First, the 2014 Central Document No. 1 explicitly proposed establishing an agricultural product target price system and implemented a pilot cotton target price reform policy in Xinjiang. This policy significantly enhanced cotton farmers’ production incentives and contributed to substantial development of Xinjiang’s cotton industry [44]. Statistical data reveal that during the temporary cotton reserve policy period (2011–2013), the average cotton planting area in Xinjiang was 1.83221 million hectares, while under the target price subsidy policy period (2014–2023), this figure increased to 2.34979 million hectares—representing a net expansion of 517,580 hectares [45]. Second, recent advancements in agricultural machinery technology and improved equipment capabilities through research and development have rapidly increased mechanization levels, reducing labor dependence. The statistical data indicate that Xinjiang’s comprehensive cotton mechanization rate reached 94.50% in 2024 [46], further supporting sustainable expansion of cultivation areas. Finally, the implementation of the 14th Five-Year Plan for large-scale irrigation district modernization and digital twin irrigation system construction in the Santun River Irrigation District in Changji City, Xinjiang, has improved the farmland water-use efficiency, thereby alleviating water resource constraints on cotton cultivation [47].

5.3. Limitations and Prospects

To begin with, we utilized Sentinel-2A satellite imagery as the primary data source. This imagery is susceptible to weather conditions such as clouds, rain, water vapor, and other atmospheric particles that can scatter and absorb the emitted or reflected light waves, thereby reducing the image contrast and clarity and ultimately affecting the model performance. Additionally, the 10 m spatial resolution still imposes certain limitations in high-precision cotton extraction. Compared to high-altitude satellite remote sensing imagery, unmanned aerial vehicle (UAV) photography offers several advantages, including real-time data acquisition, less atmospheric interference, and a higher imaging resolution, and has exhibited significant potential for crop growth monitoring and early-stage pest/disease identification [48,49]. Future research could incorporate UAV imagery to further improve the accuracy of cotton field extraction. Furthermore, the deep learning-based fully supervised semantic segmentation approach employed in this study requires substantial pixel-level annotated training data, which incurs considerable annotation costs and consequently limits its practical applications. Future research could explore semi-supervised or weakly supervised semantic segmentation methodologies to achieve cost-effective pixel-level crop prediction while maintaining satisfactory accuracy. Ultimately, we focused solely on cotton extraction in Xinjiang’s Santun River Irrigation District. Future work could expand the focus to include other crops, such as corn, wheat, and tomatoes, and could conduct additional trials in different regions to enhance the model’s stability and generalization capability while maintaining its performance.

6. Conclusions

In this study, we comprehensively considered the accuracy of large-scale cotton field information extraction and constructed four cotton planting area extraction models—U-Net, SegNet, DeepLabV3+, and CBAM-UNet—based on Sentinel-2 remote sensing imagery, and annotated cotton regions were used as the labeled dataset. The extracted cotton areas from 2019 to 2024 were compared with statistical data to identify the most suitable model for high-precision cotton extraction. The key findings of this study are summarized below.
The cotton extraction accuracies of the four models followed the order CBAM-UNet > U-Net > DeepLabV3+ > SegNet. The CBAM-UNet model achieved an mIoU of 84.02%, which was 2.91%, 4.73%, and 3.32% higher than those of U-Net, SegNet, and DeepLabV3+, respectively. Its precision reached 88.99%, surpassing those of the U-Net, SegNet, and DeepLabV3+ by 2.94%, 3.30%, and 1.47%, respectively. Its recall reached 94.75%, surpassing those of the U-Net, SegNet, and DeepLabV3+ by 5.29%, 13.5%, and 9.05%, respectively. Additionally, the F1-score of the CBAM-UNet was 91.78%, exceeding those of the U-Net, SegNet, and DeepLabV3+ by 4.06%, 8.38%, and 5.18%, respectively.
The CBAM-UNet model yielded a cotton extraction area with AEs ranging from 923.69 to 1445.46 hm2 compared to statistical data, exhibiting relatively small and concentrated variations. The APEs were all less than 10%. The correlation coefficient between the extracted cotton area and statistical data reached a maximum value of 0.9817, indicating a high level of consistency. Moreover, from 2019 to 2024, the cotton planting area exhibited an overall increasing trend, with an approximate increase of 8.60%.

Author Contributions

Writing—original draft, L.L.; writing—review and editing, L.L.; funding acquisition, H.T.; project administration, H.T.; validation, H.T.; visualization, Q.L.; formal analysis, Q.L. and L.Y.; data curation, H.X.; resources, H.X. Investigation, Y.X.; methodology, Y.X.; software, Y.J. All authors have read and agreed to the published version of the manuscript.

Funding

This study was financially supported by the Major Science and Technology Special Project of Xinjiang Uygur Autonomous Region (2023A02002-1, 2024A03007-4) and the Xinjiang Key Laboratory of Water Conservancy Engineering Safety and Water Disaster Prevention Open Project (ZDSYS-YJS-2024-23).

Institutional Review Board Statement

Not applicable.

Data Availability Statement

The Sentinel-2 data used in the present study were downloaded from https://dataspace.copernicus.eu/explore-data/data-collections/sentinel-data/sentinel-2 (accessed on 13 March 2025).

Conflicts of Interest

The authors declare no conflicts of interest.

References

  1. Akter, T.; Islam, A.K.M.A.; Rasul, M.G.; Kundu, S.; Khalequzzaman, A.J. Evaluation of genetic diversity in short duration cotton (Gossypium hirsutum L.). Cotton Res. 2019, 2, 1. [Google Scholar] [CrossRef]
  2. Chen, Z.J.; Scheffler, B.E.; Dennis, E.; Triplett, B.A.; Zhang, T.; Guo, W.; Chen, X.; Stelly, D.M.; Rabinowicz, P.D.; Christopher, D.T.; et al. Toward sequencing cotton (Gossypium) genomes. Plant Physiol. 2007, 145, 1303–1310. [Google Scholar] [CrossRef]
  3. Zhang, Z.G.; Li, Y.M.; Yuan, Z.; Liu, X.H.; Shu, X.Y.; Liu, J.Y.; Guo, C.F. Cotton production pattern and contribution factors in Xinjiang from 1988 to 2020. J. Agric. Resour. Environ. 2024, 41, 1192–1200. [Google Scholar]
  4. Wang, D.; Zhong, G.J.; Zhang, Y.; Tian, T.; Zeng, Y. Effects of spatial autocorrelation on spatial sampling efficiencies of winter wheat planting areas. Trans. Chin. Soc. Agric. Eng. 2021, 37, 188–197. [Google Scholar]
  5. Jin, N.; Sun, L.; Zhang, Y.D.; Zhang, X.; Li, Y.; Yao, N. Classification of Cotton Planting Area Using CBAM-U-HRNet Model and Sentinel-2 Data. Trans. Chin. Soc. Agric. Mach. 2023, 54, 159–168. [Google Scholar]
  6. Zhang, J.H.; You, S.C.; Liu, A.X.; Xie, L.J.; Huang, C.H.; Han, X.; Li, P.H.; Wu, Y.X.; Deng, J.S. Winter Wheat Mapping Method Based on Pseudo-Labels and U-Net Model for Training Sample Shortage. Remote Sens. 2024, 16, 2553. [Google Scholar] [CrossRef]
  7. Wei, R.Q.; Li, L.F.; Lin, W.; Shao, H.Y.; Wang, D. Extracting Cotton Cultivation Regions of Xinjiang Shihezi Utilizing the TIMESAT and Satellite Time-Series Images. Hubei Agric. Sci. 2018, 57, 105–112. [Google Scholar]
  8. Zheng, Y.; Wu, B.F.; Zhang, M.; Zeng, H.W. Crop Phenology Detection Using High Spatio-Temporal Resolution Data Fused from SPOT5 and MODIS Products. Sensors 2016, 16, 2099. [Google Scholar] [CrossRef]
  9. Tatsumi, K.; Yamashiki, Y.; Torres, M.A.C.; Taipe, C.L.R. Crop classification of upland fields using Random forest of time-series Landsat 7 ETM+ data. Comput. Electron. Agric. 2015, 115, 171–179. [Google Scholar] [CrossRef]
  10. Yu, L.X.R.; Tao, H.F.; Li, Q.; Xie, H.; Xu, Y.; Mahemujiang, A.; Jiang, Y.W. Research on Machine Learning-Based Extraction and Classification of Crop Planting Information in Arid Irrigated Areas Using Sentinel-1 and Sentinel-2 Time-Series Data. Agriculture 2025, 15, 1196. [Google Scholar] [CrossRef]
  11. Sertel, E.; Yay, I. Vineyard parcel identification from Worldview-2 images using object-based classification model. J. Appl. Remote Sens. 2014, 8, 83535. [Google Scholar] [CrossRef]
  12. Ayixiemu, M.; Maimaiti, S. Study on Cotton Growing Area Extraction Based on GF-2 Image Fusion Method. Geomat. Spat. Inf. Technol. 2023, 46, 81–84+88. [Google Scholar]
  13. Zhao, J.L.; Zhan, Y.Y.; Wang, J.; Huang, L.S. SE-UNet-Based Extraction of Winter Wheat Planting Areas. Trans. Chin. Soc. Agric. Mach. 2022, 53, 189–196. [Google Scholar]
  14. Peng, J.L.; Zhao, Y.L.; Wang, L.M. Research on Video Abnormal Behavior Detection Based on Deep Learning. Laser Optoelectron. Prog. 2021, 58, 51–61. [Google Scholar] [CrossRef]
  15. Deng, C.; Li, H.W.; Zhang, B.; Xu, Z.B.; Xiao, Z.Y. Research on key frame image processing of semantic SLAM based on deep learning. Acta Geod. Cartogr. Sin. 2021, 50, 1605–1616. [Google Scholar]
  16. Du, M.; Huang, J.F.; Wei, P.L.; Yang, L.B.; Chai, D.F.; Peng, D.L.; Sha, J.M.; Sun, W.W.; Huang, R. Dynamic Mapping of Paddy Rice Using Multi-Temporal Landsat Data Based on a Deep Semantic Segmentation Model. Agronomy 2022, 12, 1583. [Google Scholar] [CrossRef]
  17. Li, H.L.; Wang, G.J.; Dong, Z.; Wei, X.K.; Wu, M.J.; Song, H.H.; Amankwah, S.O.Y. Identifying Cotton Fields from Remote Sensing Images Using Multiple Deep Learning Networks. Agronomy 2021, 11, 174. [Google Scholar] [CrossRef]
  18. Wang, M.; Wang, J.; Cui, Y.P.; Liu, J.; Chen, L. Agricultural Field Boundary Delineation with Satellite Image Segmentation for High-Resolution Crop Mapping: A Case Study of Rice Paddy. Agronomy 2022, 12, 2342. [Google Scholar] [CrossRef]
  19. Zhang, S.J.; Ban, X.Y.; Xiao, T.; Huang, L.S.; Zhao, J.L.; Huang, W.J.; Liang, D. Identification of Soybean Planting Areas Combining Fused Gaofen-1 Image Data and U-Net Model. Agronomy 2023, 13, 863. [Google Scholar] [CrossRef]
  20. Hu, H.; Niu, X.W.; Zuo, H.; Jin, C.Y. Application Study of Image Semantic Segmentation Algorithm Based on Improved HRNet Architecture. SmartTech Innov. 2022, 28, 23–29. [Google Scholar]
  21. Fu, T.Y.; Tian, S.F.; Ge, J. R-UNet: A Deep Learning Model for Rice Extraction in Rio Grande Do Sul, Brazil. Remote Sens. 2023, 15, 4021. [Google Scholar] [CrossRef]
  22. Yan, H.J.; Liu, G.; Li, Z.; Li, Z.; He, J. SCECA U-Net crop classification for UAV remote sensing image. Clust. Comput. 2024, 28, 23. [Google Scholar] [CrossRef]
  23. Chang, Z.; Li, H.; Chen, D.H.; Liu, Y.F.; Zou, C.; Chen, J.; Han, W.J.; Liu, S.S.; Zhang, N.M. Crop type identification using high-resolution remote sensing images based on an improved DeepLabv3+ network. Remote Sens. 2023, 15, 5088. [Google Scholar] [CrossRef]
  24. Wan, T.Y.; Rao, Y.; Jin, X.; Wang, F.Y.; Zhang, T.; Shu, Y.L.; Li, S.W. Improved U-Net for Growth Stage Recognition of In-Field Maize. Agronomy 2023, 13, 1523. [Google Scholar] [CrossRef]
  25. Delegido, J.; Verrelst, J.; Alonso, L.; Moreno, J. Evaluation of Sentinel-2 red-edge bands for empirical estimation of green LAI and chlorophyll content. Sensors 2011, 11, 7063–7081. [Google Scholar] [CrossRef]
  26. Yang, S.T.; Gu, L.J.; Li, X.F.; Jiang, T.; Ren, R.Z. Crop classification method based on optimal feature selection and hybrid CNN-RF networks for multi-temporal remote sensing imagery. Remote Sens. 2020, 12, 3119. [Google Scholar] [CrossRef]
  27. Fan, X.P.; Zhou, J.P.; Xu, Y.; Li, K.J.; Wen, D.S. Identification and Localization of Weeds Based onOptimized Faster R-CNN in Cotton Seedling Stage. Trans. Chin. Soc. Agric. Mach. 2021, 52, 26–34. [Google Scholar]
  28. Yin, X.H.; Wang, Y.C.; Li, D.Y. Suvery of Medical Image Segmentation Technology Based on U-Net Structure Improvement. J. Softw. 2021, 32, 519–550. [Google Scholar]
  29. Woo, S.; Park, J.; Lee, J.Y.; Kweno, I.S. CBAM: Convolutional block attention module. In Proceedings of the European Conference on Computer Vision (ECCV), Munich, Germany, 8–14 September 2018; pp. 3–19. [Google Scholar]
  30. Huang, G.H.; Zhu, J.W.; Li, J.J.; Wang, Z.W.; Cheng, L.L.; Liu, L.Z.; Li, H.J.; Zhou, J. Channel-attention U-Net: Channel attention mechanism for semantic segmentation of esophagus and esophageal cancer. IEEE Access 2020, 8, 122798–122810. [Google Scholar] [CrossRef]
  31. Li, H.F.; Qiu, K.J.; Chen, L.; Mei, X.M.; Hong, L.; Tao, C. SCAttNet: Semantic segmentation network with spatial and channel attention mechanism for high-resolution remote sensing images. IEEE Geosci. Remote Sens. Lett. 2020, 18, 905–909. [Google Scholar] [CrossRef]
  32. Liu, X.F.; Liu, X.D.; Wang, Z.H.; Huang, G.H.; Shu, R. Classification of laser footprint based on random forest in mountainous area using GLAS full-waveform features. IEEE J. Sel. Top. Appl. Earth Obs. Remote Sens. 2022, 15, 2284–2297. [Google Scholar] [CrossRef]
  33. De Bem, P.P.; De Carvalho Júnior, O.A.; De Carvalho, O.L.F.; Gomes, R.A.T.; Guimarāes, R.F.; Pimentel, C.M.M. Irrigated Rice Crop Identification in Southern Brazil Using Convolutional Neural Networks and Sentinel-1 Time Series. Remote Sens. 2021, 24, 100627. [Google Scholar]
  34. Onojeghuo, A.O.; Miao, Y.X.; Blackburn, G.A. Deep ResU-Net Convolutional Neural Networks Segmentation for Smallholder Paddy Rice Mapping Using Sentinel 1 SAR and Sentinel 2 Optical Imagery. Remote Sens. 2023, 15, 1517. [Google Scholar] [CrossRef]
  35. Li, Y.; Liu, W.J.; Ge, Y.; Yuan, S.; Zhang, T.X.; Liu, X.H. Extracting Citrus-Growing Regions by Multiscale UNet Using Sentinel-2 Satellite Imagery. Remote Sens. 2024, 16, 36. [Google Scholar] [CrossRef]
  36. Xia, L.; Zhao, F.; Chen, J.; Yu, L.; Lu, M.; Yu, Q.Y.; Liang, S.F.; Fan, L.L.; Sun, X.; Wu, X.R.; et al. A Full Resolution Deep Learning Network for Paddy Rice Mapping Using Landsat Data. Remote Sens. 2022, 194, 91–107. [Google Scholar] [CrossRef]
  37. Lu, H.; Liu, C.; Li, N.W.; Fu, X.; Li, L.G. Optimal segmentation scale selection and evaluation of cultivated land objects based on high-resolution remote sensing images with spectral and texture features. Environ. Sci. Pollut. Res. 2021, 28, 27067–27083. [Google Scholar] [CrossRef]
  38. Zhao, J.L.; Wang, J.; Qian, H.M.; Zhan, Y.Y.; Lei, Y. Extraction of winter-wheat planting areas using a combination of U-Net and CBAM. Agronomy 2022, 12, 2965. [Google Scholar] [CrossRef]
  39. Saadat, M.; Seydi, S.T.; Hasanlou, M.; Homayouni, S. A convolutional neural network method for rice mapping using time-series of Sentinel-1 and Sentinel-2 imagery. Agriculture 2022, 12, 2083. [Google Scholar] [CrossRef]
  40. Zou, C.; Chen, D.H.; Chang, Z.; Fan, J.W.; Zheng, J.; Zhao, H.P.; Wang, Z.; Li, H. Early Identification of Cotton Fields Based on Gf-6 Images in Arid and Semiarid Regions (China). Remote Sens. 2023, 15, 5326. [Google Scholar] [CrossRef]
  41. Kang, R.; Huang, J.X.; Zhou, X.H.; Ren, N.; Sun, S.P. Toward real scenery: A lightweight tomato growth inspection algorithm for leaf disease detection and fruit counting. Plant Phenomics 2024, 6, 174. [Google Scholar] [CrossRef]
  42. Yu, X.; Yin, D.M.; Nie, C.W.; Ming, B.; Xu, H.G.; Liu, Y.; Bai, Y.; Shao, M.C.; Cheng, M.H.; Liu, Y.D.; et al. Maize tassel area dynamic monitoring based on near-ground and UAV RGB images by U-Net model. Comput. Electron. Agric. 2022, 203, 107477. [Google Scholar] [CrossRef]
  43. Kang, J.; Liu, L.T.; Zhang, F.C.; Shen, C.; Wang, N.; Shao, L.M. Semantic segmentation model of cotton roots in-situ image based on attention mechanism. Comput. Electron. Agric. 2021, 189, 106370. [Google Scholar] [CrossRef]
  44. Wang, L.R.; Rui, L.L. Analyzing the Impact of Target Price Subsidy Policy on Cotton Production—Based on PSM-DID Method. Chin. J. Agric. Resour. Reg. Plan. 2021, 42, 228–236. [Google Scholar]
  45. Xin, Y.Y.; Xiao, H.F. Analysis of the Impact of the Target Price Subsidy Policy on Cotton Production in Xinjiang. Shanxi Agric. Econ. 2024, 24, 91–95. [Google Scholar]
  46. Tian, L.W.; Lou, S.W.; Zhang, P.Z.; Du, M.W.; Luo, H.H.; Li, J.; Paerhati, M.; Ma, T.F.; Zhang, L.Z. Analysis of Problems and Pathways for Increasing Cotton Yield per Unit Area in Xinjiang Under Green and Efficient Production Mode. Sci. Agric. Sin. 2025, 58, 1102–1115. [Google Scholar]
  47. Zhang, Y.; Bian, X.N.; Zhang, H.L.; Li, N.; Gao, Q.; Zhang, B.Q. Research on the Application Prospect of Digital Twin in Large Irrigation Area. J. Irrig. Drain. 2022, 41, 71–76. [Google Scholar]
  48. Zhang, N.N.; Zhang, X.; Bai, T.C.; Yuan, X.T.; Ma, R.; Li, L. Field Scale Cotton Land Feature Recognition Based on UAV Visible Light Images in Xinjiang. Trans. Chin. Soc. Agric. Mach. 2023, 54, 199–205. [Google Scholar]
  49. Liu, J.W. Forestry Engineering Based on UAV Remote Sensing Technology. New Farmers 2025, 19, 82–84. [Google Scholar]
Figure 1. Overview map of the study area.
Agriculture 15 01783 g001
Figure 2. Time-series plots of vegetation indexes for each crop: (a) NDVI; (b) EVI.
Agriculture 15 01783 g002
Figure 3. Visual effects of the data augmentation: (a) Original image; (b) Rotated 90°; (c) Rotated 180°; (d) Rotated 270°; (e) Adjusting brightness.
Agriculture 15 01783 g003
Figure 4. Technical framework.
Agriculture 15 01783 g004
Figure 5. Structural diagram of the U-Net network.
Agriculture 15 01783 g005
Figure 6. Structural diagram of the convolutional block attention module.
Agriculture 15 01783 g006
Figure 7. Structural diagram of the CBAM-UNet network.
Agriculture 15 01783 g007
Figure 8. Detailed comparison of the cotton extraction results based on different models (ae).
Agriculture 15 01783 g008
Figure 9. Extraction results of cotton based on the CBAM-UNet model: (a) Original image; (b) label; (c) CBAM-UNet.
Agriculture 15 01783 g009
Figure 10. Extraction accuracy evaluation for different models based on statistical data: (a) AE statistical result; (b) APE statistical result; (c) R2 of U-Net; (d) R2 of SegNet; (e) R2 of DeepLabV3+; (f) R2 of CBAM-UNet.
Agriculture 15 01783 g010
Figure 11. Extraction of cotton cultivation areas and statistical trend analysis based on the CBAM-UNet model from 2019 to 2024.
Agriculture 15 01783 g011
Table 1. Cotton growth cycles in the study area.
Growth CycleTimePhotoGrowth CycleTimePhoto
SowingMid-AprilAgriculture 15 01783 i001SeedlingLate April to early JuneAgriculture 15 01783 i002
SquaringMid-June to mid-JulyAgriculture 15 01783 i003Flowering-bollLate July to late AugustAgriculture 15 01783 i004
Boll-openingEarly to late SeptemberAgriculture 15 01783 i005MaturationEarly OctoberAgriculture 15 01783 i006
Table 2. Sentinel-2 image acquisition dates.
Serial NumberDateName
128 July 2019S2B_MSIL2A_20190728T050659_N9999_R019_T45TVJ_20230512T183636
S2B_MSIL2A_20190728T050659_N9999_R019_T45TWJ_20230512T183649
S2B_MSIL2A_20190728T050659_N9999_R019_T45TWK_20230512T184055
217 July 2020S2A_MSIL2A_20200717T050701_N0500_R019_T45TVJ_20230424T021048
S2A_MSIL2A_20200717T050701_N0500_R019_T45TWJ_20230424T021048
S2A_MSIL2A_20200717T050701_N0500_R019_T45TWK_20230424T021048
32 July 2021S2A_MSIL2A_20210702T050701_N0500_R019_T45TVJ_20230130T233224
S2A_MSIL2A_20210702T050701_N0500_R019_T45TWJ_20230130T233224
S2A_MSIL2A_20210702T050701_N0500_R019_T45TWK_20230130T233224
422 July 2022S2B_MSIL2A_20220722T050659_N0400_R019_T45TVJ_20220722T080424
S2B_MSIL2A_20220722T050659_N0400_R019_T45TWJ_20220722T080424
S2B_MSIL2A_20220722T050659_N0400_R019_T45TWK_20220722T080424
512 July 2023S2A_MSIL2A_20230712T050701_N0509_R019_T45TVJ_20230712T091055
S2A_MSIL2A_20230712T050701_N0509_R019_T45TWJ_20230712T091055
S2A_MSIL2A_20230712T050701_N0509_R019_T45TWK_20230712T091055
65 August 2024S2A_MSIL2A_20240805T050651_N0511_R019_T45TVJ_20240805T110647
S2A_MSIL2A_20240805T050651_N0511_R019_T45TWJ_20240805T110647
S2A_MSIL2A_20240805T050651_N0511_R019_T45TWK_20240805T110647
Table 3. Extraction accuracy of cotton cultivation areas.
ModelmIoU/%Precision/%Recall/%F1-Score/%OA/%
U-Net81.1186.0589.4687.7293.66
SegNet79.3185.6981.2583.4192.31
DeepLabV3+80.7087.5285.7086.6092.60
CBAM-UNet84.0288.9994.7591.7895.56
Disclaimer/Publisher’s Note: The statements, opinions and data contained in all publications are solely those of the individual author(s) and contributor(s) and not of MDPI and/or the editor(s). MDPI and/or the editor(s) disclaim responsibility for any injury to people or property resulting from any ideas, methods, instructions or products referred to in the content.