Article

Soil Nitrification Rate Is Affected by Plant Species and Nitrogen Levels

1
Institute for Agriculture and Forestry Systems in the Mediterranean, National Research Council, P.le E. Fermi 1, 80055 Portici, Italy
2
Institute for the Animal Production System in the Mediterranean Environment, National Research Council, P.le E. Fermi 1, 80055 Portici, Italy
3
CEBAS-CSIC, Plant Nutrition Department, Campus Universitario de Espinardo, Espinardo, 30100 Murcia, Spain
4
Research Division Portici, Institute of Biosciences and Bioresources, National Research Council, Via Università 133, 80055 Portici, Italy
*
Author to whom correspondence should be addressed.
Agriculture 2025, 15(16), 1740; https://doi.org/10.3390/agriculture15161740 (registering DOI)
Submission received: 4 July 2025 / Revised: 5 August 2025 / Accepted: 12 August 2025 / Published: 14 August 2025
(This article belongs to the Section Agricultural Soils)

Abstract

The soil nitrification rate is significantly affected by plant species, and it is also modulated by different nitrogen levels in the soil. There are a wide range of plant species with the capacity to produce biological nitrification inhibitors (hereafter referred to as BNI species). The preliminary results of this study report the influence of three different plant species on the nitrification rates under soil supply with three (0 mM, 3.5 mM, and 7.0 mM) nitrogen levels. The aim was to evaluate the potential of hemp, ryegrass, and sorghum in mitigating nitrification, in order to define a sustainable strategy for improving the nitrogen use efficiency by crops and to limit the nitrogen loss from agroecosystems. Leaf gas exchange measurements were also carried out in this study. Photosynthesis was only affected by nitrogen supply in hemp, resulting in a reduction in CO2 assimilation at nitrogen doses higher than the plant’s requirements. Ryegrass devotes more reductive power towards leaf nitrogen assimilation than sorghum and hemp do. The greatest variation in nitrification rate in response to N was observed in soil cultivated with hemp (which also showed the highest potential nitrification rate), followed by sorghum and ryegrass. We speculate that this occurred because the greater seed sowing density for ryegrass ensured a greater quantity in the soil of molecules acting on nitrification compared to sorghum and hemp, with these latter being sown at lower densities. Our results suggest that sorghum and ryegrass might directly affect nitrification by BNI molecules, whereas hemp might indirectly mitigate nitrification through the nitrogen uptake. However, further research is needed to evaluate the effects exerted by the studied plant species on nitrification rates.

1. Introduction

Nitrification consists of a two-step process: in the first step ammonia is oxidized to nitrite by ammonia-oxidizing bacteria (AOB) and archaea (AOA), while in the second step nitrite is oxidized to nitrate by nitrite-oxidizing bacteria (NOB). This biological process is affected by abiotic and biotic factors. Among the abiotic soil factors, temperature, O2 levels, and nitrogen availability represent the main drivers for NH4+ oxidation [1], although soil pH, water content, and C/N also regulate the nitrification process in soils.
Reducing nitrification in arable soils is beneficial, because it can improve the nitrogen use efficiency of crops, reduce agricultural production costs and environmental pollution, and mitigate climate change impacts. In fact, nitrification contributes to nitrogen losses through nitrate leaching and nitrous oxide production, which are both detrimental to the environment. Different solutions have been adopted to reduce nitrogen losses by inhibiting nitrification; in this regard the use of fertilizers containing synthetic nitrification inhibitors (NIs) has been widely demonstrated to be a valid solution. Some agronomic species such as sorghum, ryegrass, rice, maize, and wheat produce molecules which are released by roots as exudates, acting as natural nitrification inhibitors [2,3]. These molecules, acting in an antagonistic or synergic way against nitrifying microbes, inhibit both the ammonia monooxygenase (AMO) pathway—which is involved in ammonia-to-hydroxylamine conversion, and the hydroxylamine oxidoreductase (HAO) pathway—which catalyzes the oxidation of hydroxylamine to nitrite [4]. In ammonia-oxidizing bacteria, AMO consists of a trimeric protein of three subunits, amoA, amoB, and amoC, with amoA serving as the active site, whereas the ammonia-oxidizing archaea contains only amoA [5]. HAO consists of three identical subunits that are codified by the hao gene [6]. The target of biological NIs is different for the two ammonia-oxidizing microbes, inhibiting the AMO pathway in AOA and AOB and the HAO pathway only in AOB [7].
The peculiarity of certain species producing biological nitrification inhibitors (BNIs) could be used to plan a sustainable strategy to limit nitrification rates in soils and prevent or limit nitrogen losses from cultivated sites. This strategy could be achieved through a plant consociation between target crops and BNI species, with the latter releasing compounds from roots that inhibit the activity of nitrifying bacteria, preventing the conversion of ammonia into nitrate and thereby reducing nitrogen losses, improving the nitrogen uptake by crops, and minimizing environmental pollution. This is also important in light of recent discoveries on possible antagonistic and synergic effects involving BNI metabolites in the rhizosphere, resulting in growth inhibition of nitrifiers and suppression of soil nitrification [8].
The aim of this study was to evaluate (1) the physiological response of sorghum, ryegrass, and hemp grown under different nitrogen levels and (2) the effectiveness of those plant species in reducing the nitrification rates in the soil, either through direct or indirect effects. Sorghum and ryegrass are notoriously known to produce BNI, so they could act directly on soil nitrification, suppressing it by secreting different active molecules into the rhizosphere. In contrast, no evidence is reported on the ability of hemp to secrete nitrification-inhibiting molecules. Thus, we hypothesize that hemp could act indirectly on nitrification by subtracting N to nitrifiers. Overall, the information thus obtained will be useful for planning new sustainable agro-strategies to limit nitrogen loss from arable soils, as well as reducing chemical fertilizers.

2. Materials and Methods

Seeds of sorghum (Sorghum bicolor L. cv Crystal), ryegrass (Lolium perenne L. cv Evening), and hemp (Cannabis sativa L. cv Felina 32) were sown in 6 L pots (one seed for sorghum, several seeds for ryegrass, and one seed for hemp) filled with a sandy loam soil (Table 1) from an experimental farm located in Acerra (Naples, Italy). On 1 November 2023, pots were allocated in a greenhouse (daily Tmean: 19 ± 2 °C; daily RHaverage: 65 ± 8%) of the CNR-IBBR (Portici, Italy) and left on site for 4 months until the end of 29 February 2024. The experiment consisted of three nitrogen levels, 0, 3.5, and 7.0 mM (0, 98, and 196 mg L−1 of N, respectively), provided twice a month to plants as urea solution, whereas all pots received the same irrigation water weekly. Each treatment was replicated 4 times (Table 2). Plant biomass was not monitored.

2.1. Physiological Measures

Leaf gas exchange and chlorophyll fluorescence measures, performed before the plant harvest, were carried out on mature expanded leaves by using the LI-6400 (Li-Cor, Lincoln, NE, USA), integrated with a LI-6400-40 leaf chamber fluorometer. Measurements were performed at 25 °C, 400 μmol (CO2) mol−1, 50% air relative humidity, and irradiance of 500 μmol (photons) m−2 s−1. For ryegrass, due to the reduced leaf width, two leaves were used to cover the spot of the measuring chamber, whereas for sorghum and hemp, only one leaf was used. At the steady state, net photosynthesis (AN), stomatal conductance (gs), transpiration (E), efficient quantum yield of PSII photochemistry for the light-adapted state (ΦPSII), electron transport rate (ETR), photochemical quenching (qP), and non-photochemical quenching (NPQT) were measured. Leaf gas exchange was calculated according to Von Caemmerer and Farquhar [9], whereas the fluorescence parameters were calculated following Maxwell and Johnson [10] and Tietz et al. [11]. The apparent carboxylation efficiency (CE = AN/Ci), water use efficiency (WUE = AN/E), and assimilatory quotient (AQF = AN/(ETR/4)) were derived from the above-mentioned parameters. AQF, expressed following Searles and Bloom [12], was used to assess foliar NO3 assimilation [13,14].
Chlorophylls, flavonols, and anthocyanins, as well as the nitrogen–flavonol index (chlorophyll/flavonol ratio), assessed on the same leaves that were used for the leaf gas exchange, were estimated by using the MPM-100 Multi Pigment Meter (ADC, BioScientific Ltd., Hoddesdon, UK). Therefore, the reported values only represent an index. Plant nitrogen uptake was not directly assessed. We used the NFI to evaluate the plant nitrogen status, since this parameter directly correlated with the massic nitrogen content.

2.2. Soil Sampling and Nitrification Rate Determination

At harvesting, plant biomass was collected, and soil was air-dried and sieved (2 mm). Soil samples, kept separate for treatments and replicates, were used to assess the potential nitrification rate (PNR) according to O’Sullivan et al. [15], with some modifications. A total of 7.5 g of dry, homogenized soil was placed in pre-perforated Falcon tubes, to which 30 mL of a 100 mM (NH4)2SO4 solution (substrate for nitrification) was added, maintaining 60% of the soil’s field capacity. The Falcon tubes were sealed, and two holes were made to allow for gas exchange, forming the experimental units. Incubation was carried out for 5 days at 26 °C and 50% relative humidity (Isotemp incubator, Fisher Scientific) with shaking at 100 rpm. During this period, pH was monitored, but no significant changes were recorded. Every 24 h, 2 mL of the soil + (NH4)2SO4 solution was sampled. Samples were collected at 24, 48, 72, 96, and 144 h. They were then filtered and centrifuged at 10,000 rpm for 5 min. For each sampling time, three technical replicates were used. Tubes were stored at 4 °C until the end of the assay. Once all five sampling times were completed, samples were analyzed using established spectrometric protocols for nitrate determination in soil samples and determining the NO3 concentration using a spectrophotometer. The potential nitrification rate (PNR) was expressed as µg NO3 100 g−1 soil d−1 and calculated by subtracting the initial NO3 concentration (NO3I) from the accumulated NO3 concentration (NO3F), normalized to soil weight (Sw) and incubation time (T).
PNR = (NO3F-NO3I)/(Sw * T)

2.3. Statistical Analysis

Two-way ANOVA (SigmaPlot Software version 12) was performed on both physiological and soil nitrification data to assay differences among treatments using nitrogen levels and specimens as the main factors, also evaluating their interaction. Tukey’s test was performed on separate means if the differences were significant (p ≤ 0.05).

3. Results

3.1. Plant Physiology

Leaf gas exchange was affected by plant species (p < 0.001) and nitrogen level (p < 0.001), and the interaction between the two main factors (species × N) was also significant (p < 0.001). Sorghum has the highest net photosynthesis (AN), whereas ryegrass has the lowest one, but both species were unaffected by the N level (Figure 1A). In contrast, hemp grown with an N supply increased itsr photosynthetic capacity, with the optimum N level being observed at 3.5 mM. Stomatal conductance (gs) mirrored the trend of AN for sorghum and hemp (Figure 1B). In contrast, in ryegrass gs was unaffected by N up to 3.5 mM of urea solution and decreased significantly for a higher N (Figure 1B). The apparent carbonylation efficiency (CE) was lowest in ryegrass and hemp, while it was highest in sorghum, since the latter is a C4 species (Figure 1C). In sorghum and ryegrass, CE results were unaffected by the N, whereas in hemp, CE increased upon nitrogen supply (Figure 1C), becoming higher than that of ryegrass. As for photosynthesis, a reduction in CE was observed in hemp at the highest N level, even if it was not significant. Water use efficiency (WUE) was the highest in sorghum (Figure 1D) and was unaffected by N in all species under study.
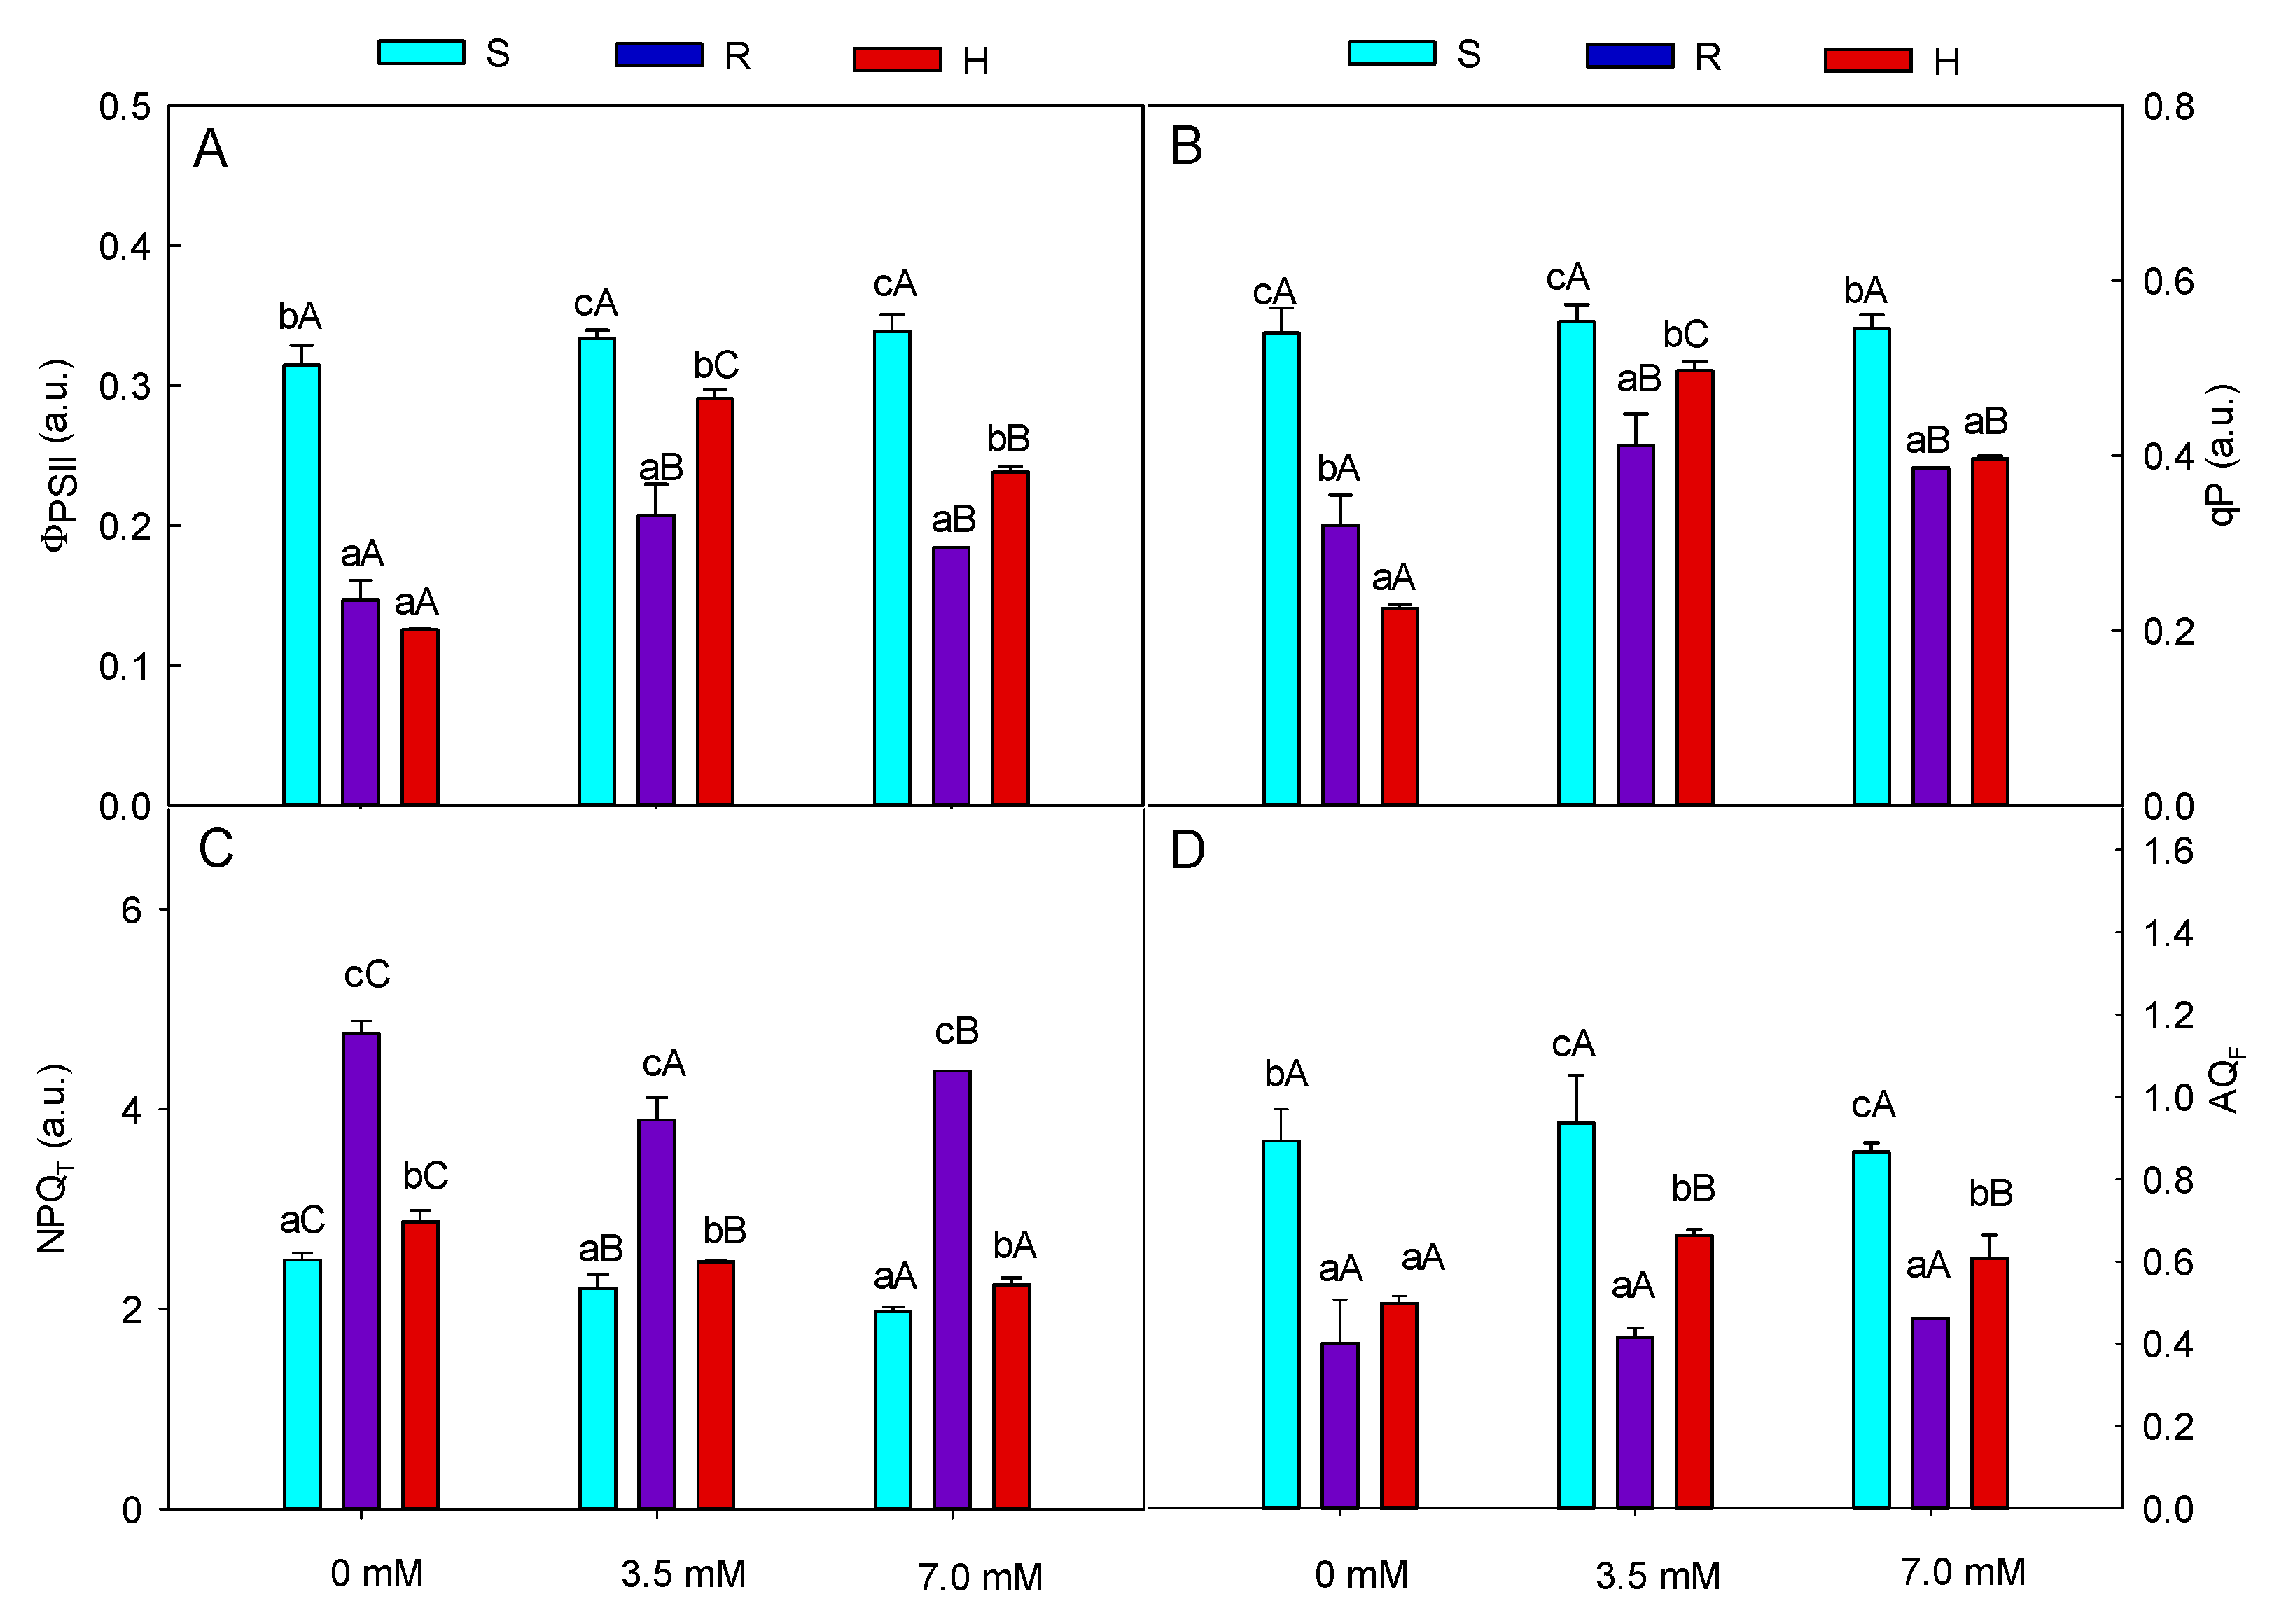
As for the leaf gas exchange, the response of the fluorescence parameters depended on the plant species (p < 0.001) and nitrogen level (p < 0.001), and their interaction was also significant (p < 0.001). The efficient quantum yield of PSII (ΦPSII) and photochemical quenching (qP) showed similar trends (Figure 2A,B), and they were found to be the highest in sorghum compared to ryegrass and hemp (Figure 2A). In sorghum, ΦPSII and qP were unaffected by N levels, whereas significant increases in both parameters were observed in hemp. In this species, the highest ΦPSII and qP values were measured at 3.5 mM, whereas they decreased at the greatest N level tested (Figure 2A,B). A positive response of ΦPSII and qP to N was also observed for ryegrass plants (Figure 2A,B). Non-photochemical quenching (NPQT) was low in sorghum and hemp, whereas the highest values were measured in ryegrass at all N levels (Figure 2C). In sorghum and hemp, a progressive reduction in NPQT with increasing N levels was recorded. In ryegrass, the highest and the lowest NPQT values were measured at 0 mM and 3.5 mM, respectively (Figure 2C). The assimilatory quotient (AQF), indicative of leaf nitrogen assimilation, was in the highest in sorghum and the lowest in ryegrass (Figure 2D) and was unaffected by the N in these two species. In contrast, it increased significantly in hemp as the nitrogen was supplied to the plants, resulting in the values for 3.5 mM and 7.0 mM being comparable (Figure 2D).
Concerning the leaf pigments, a significant (p < 0.001) effect of species was found for chlorophyll and anthocyanin pigments, whereas for flavonols and the nitrogen–flavonol index (NFI), a significant dependence on species (p < 0.01) and nitrogen level (p < 0.005), and their interaction (p < 0.001), was also found. The estimated pigments were only affected by N in ryegrass and hemp but not in sorghum (Table 3). In ryegrass, a significant reduction in flavonols was observed when N was supplied to the growing medium compared to 0 mM, and this led to an increase in the nitrogen–flavonol index (NFI). In contrast, the N positively affected the chlorophyll content in hemp, which enhanced its photosynthetic pigments (Table 3).

3.2. Nitrification

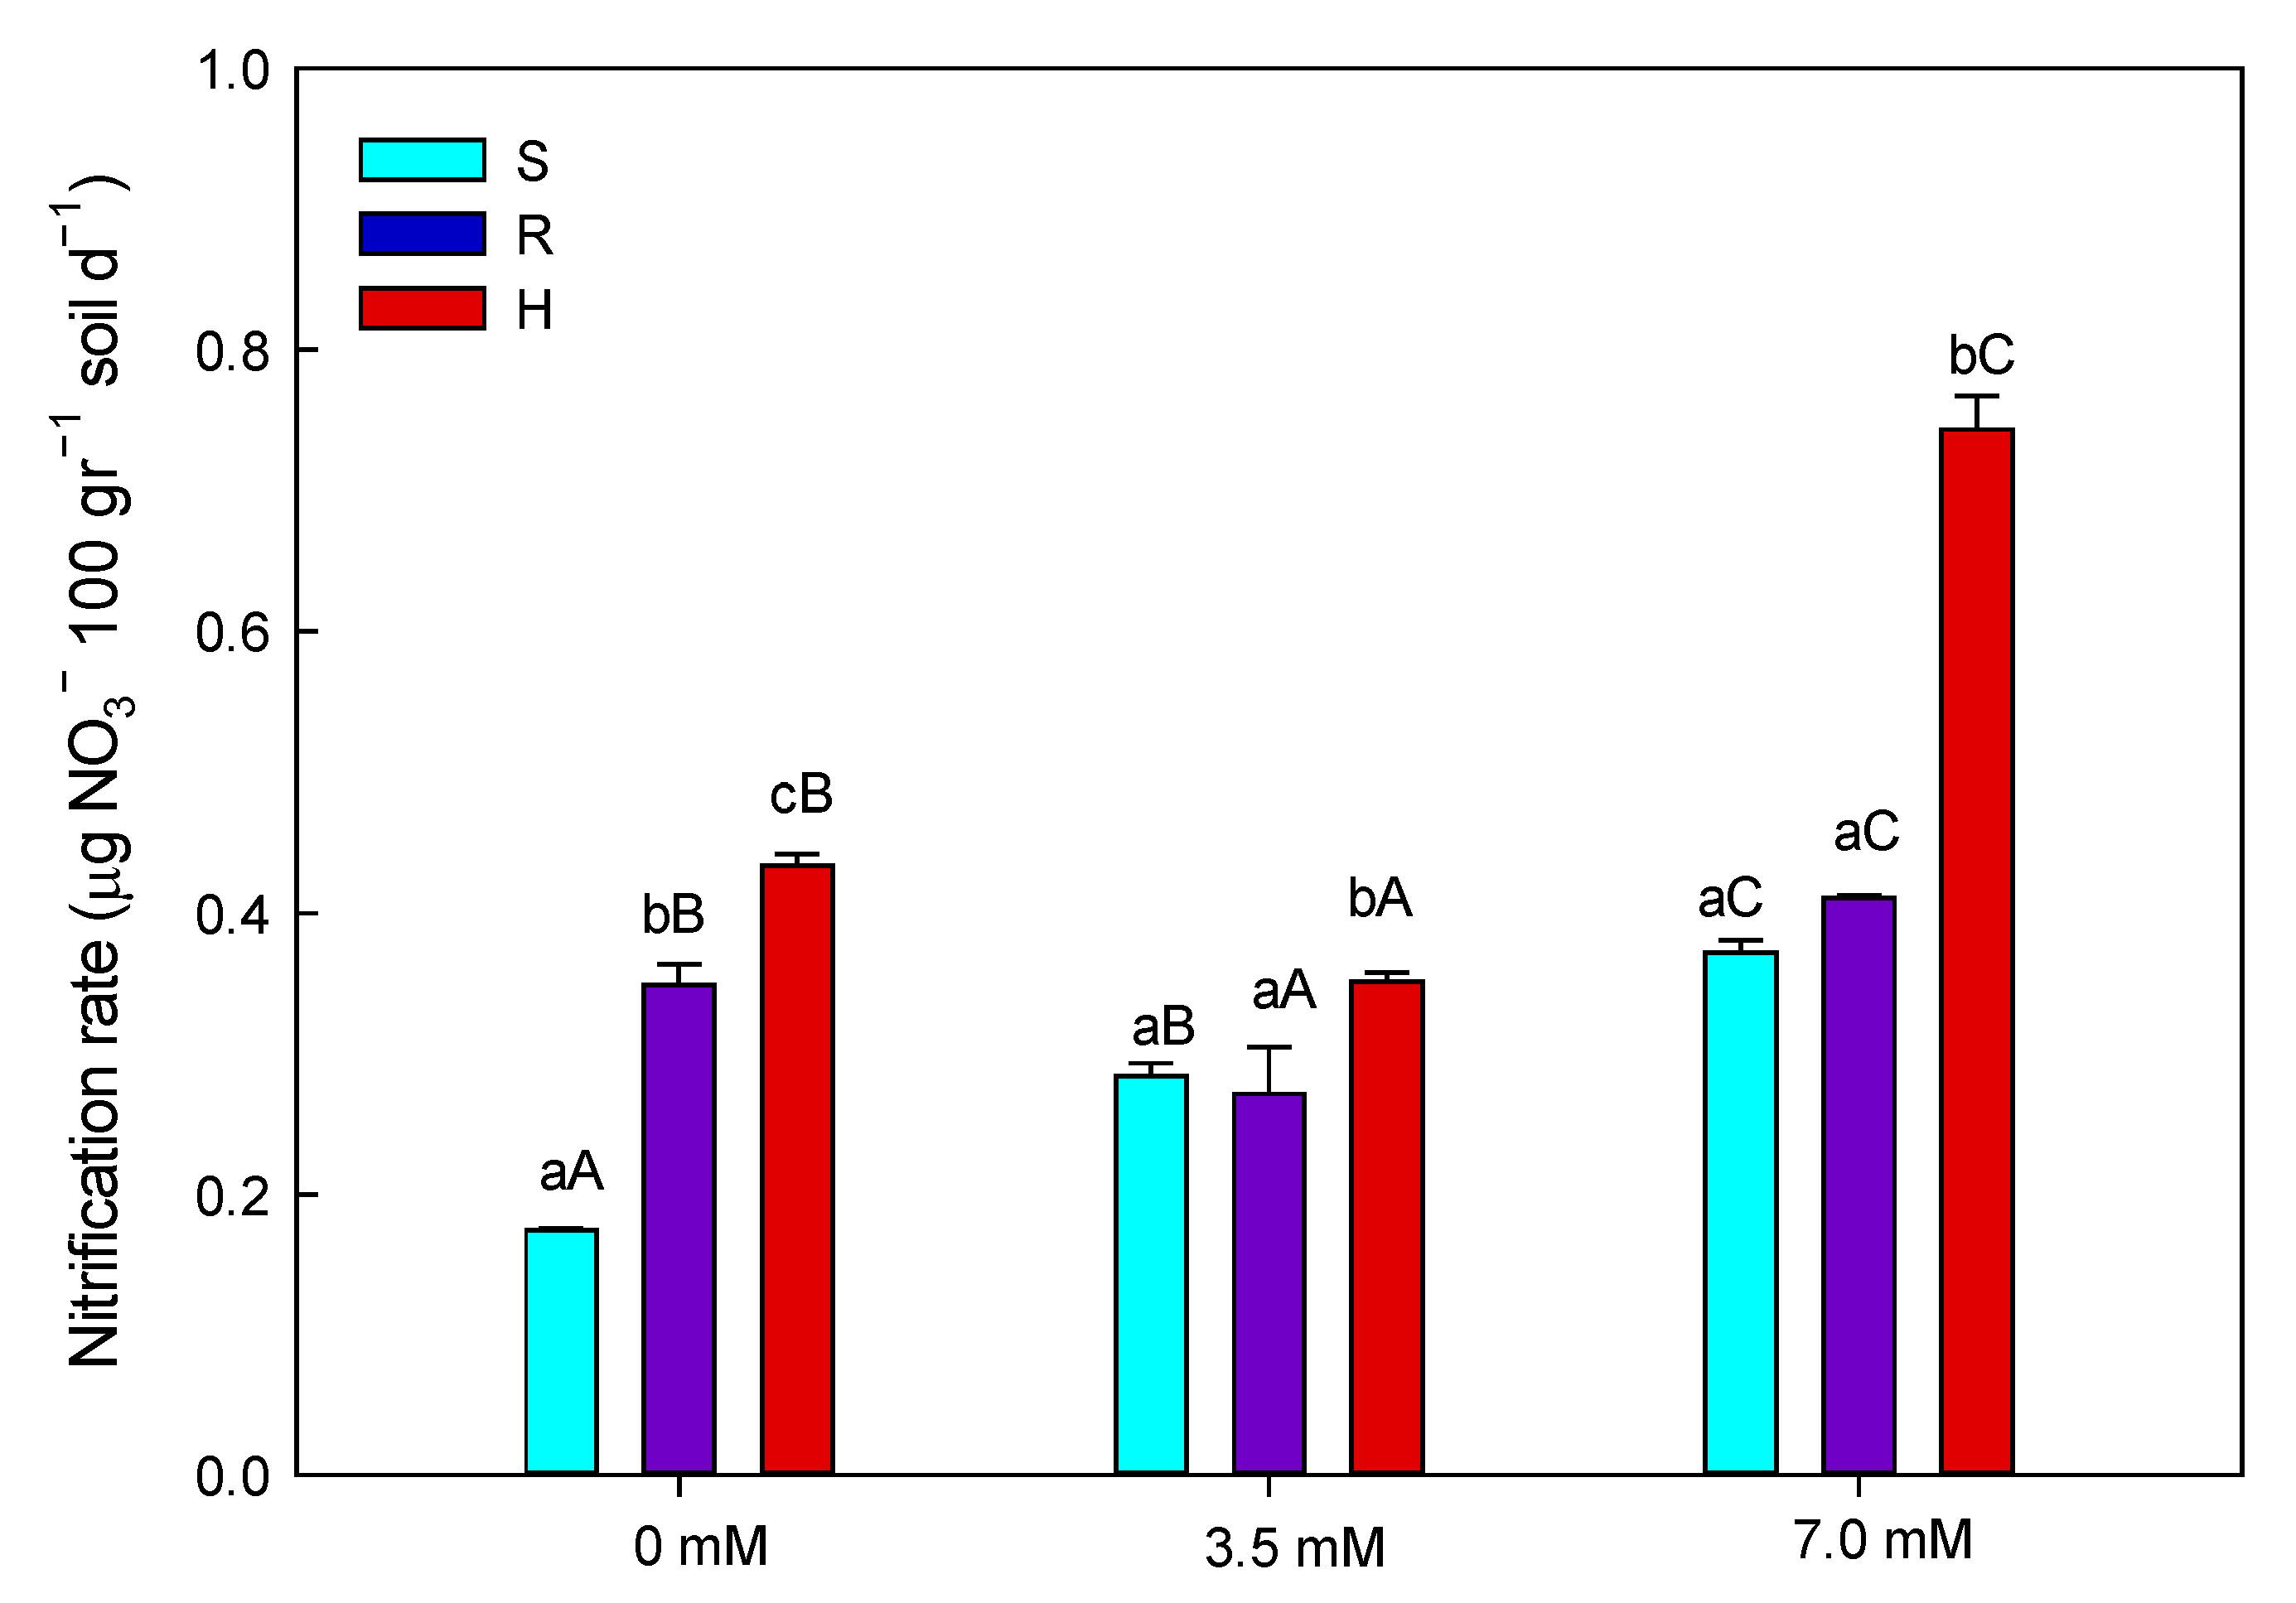
The potential nitrification rate (PNR) was affected by the plant species (p < 0.001) and nitrogen level (p < 0.001), while the species × N level interaction was significant (p < 0.001) too. The highest PNR for each nitrogen level was observed in the soil where hemp was grown (Figure 3). In soil cultivated with sorghum, the PNR progressively increased as N increased, whereas in soil cultivated with ryegrass or hemp, the PNR decreased significantly at 3.5 mM compared to 0 mM and reached the highest value at the 7.0 mM of N level. At 0 mM, the soil cultivated with sorghum showed the lowest NR values, whereas the highest PNR values were observed for hemp. At 3.5 and 7.0 mM, no significant difference was found between sorghum and ryegrass, whereas the soil with hemp exhibited the highest PNR.

4. Discussion

4.1. Plant Physiology

Nitrogen (N) nutrition is one of the major abiotic parameters affecting plant growth and physiology, as well as the microbial processes in the soil. As the N supply affects plants’ metabolism, in the present work we examined the physiological response to crescent nitrogen doses of three species different in the photosynthetic metabolism, i.e., sorghum, ryegrass, and hemp, and the influence of these species on soil nitrification rates. The results reveal a significant sensitivity of hemp to the tested nitrogen doses, whereas both sorghum and ryegrass appear unaffected by the nitrogen supply. Data concerning sorghum and ryegrass appear to be in contrast with the literature, because both C3 and C4 plants, as ryegrass and sorghum are, respectively, are affected by limited nitrogen supply in the biochemical and physiological traits of their leaves. In this context, Makino and Ueno [16] report an increase in photosynthetic rates and chlorophyll contents in sorghum grown under increasing nitrogen levels. Similar results were previously reported by Zhao and colleagues [17], who attributed the effects of N limitation on photosynthesis to stomatal limitations rather than to biochemical limitations. The absence of a positive response to nitrogen that was observed in the present work might not be a symptom of stress induced by N for the sorghum, likely because the amount that we added into the soil of this essential element could meet the plants’ N requirements (total N 0.2%; N-NO3 0.011 g kg−1; N-NH4 0.012 g kg−1). This assumption appears to be corroborated by the data on leaf pigments and NF index, which did not appear to be affected by N. Generally, a N deficiency in a plant causes an increased secondary metabolism to the detriment of the primary metabolism, leading to a decrease in chlorophyll synthesis in favor of flavonols and, in turn, to a reduction in the NFI.
In our study, carbon assimilation was also unaffected by N in ryegrass, a C3 species which should respond positively to nitrogen, since its physiology is affected by nitrogen limitation [18], with common symptoms being a reduced photosynthetic content and crude proteins, which leads to reduced photosynthesis [19]. Considering that the ryegrass plants diverted more energy in primary metabolism rather than secondary ones (i.e., reduced flavonols and enhanced NFI), we hypothesize that ryegrass allocates more energy than the other plant species in leaf nitrogen assimilation (lowest AQF), a condition that increases the photochemical activity without any positive effect on photosynthesis, as previously reported by Arena et al. [14]. In this context, we assume that ryegrass’s increased nitrate assimilation was also supported by greater photorespiration rates, which sustain a higher electron flow—as indicated by the increase in ΦPSII—thus providing reducing equivalents as substrates for the nitrate reductase [20]. However, stress conditions for ryegrass’ photosynthetic apparatus, such as resource limitation or light-induced energy imbalance, might occur under the tested growth conditions (high planting density), as indicated by the high NPQT. On the other hand, hemp’s photosynthesis was clearly limited by the nitrogen availability, increasing with the N supply, although a high ammonium supply could impair hemp photosynthesis, which occurred with the 7.0 mM of urea solution. Some studies found that supplying N above the optimum range (about 160 mg L−1) reduces the photosynthetic rates, stomatal conductance, and transpiration [21,22]. In our study, the excessive N availability led to reduced stomatal conductance, which limited the CO2 uptake and, in turn, hemp photosynthesis, because neither the apparent carboxylation efficiency nor the water use efficiency were impaired.

4.2. Nitrification

The potential nitrification rate (PNR) was evaluated in soil with sorghum, ryegrass, and hemp growing under three different N concentrations. Although the soil cultivated with sorghum exhibits lower nitrification rates compared to soil cultivated with ryegrass and hemp, suggesting a better performance of root exudates produced by sorghum in nitrification mitigation, our opinion is that both ryegrass and hemp might be better at limiting an increase in the nitrification rate than sorghum, and this might occur through different mechanisms, depending on the species. In soil with ryegrass, the potential NR changed little with the increasing N levels supplied by fertilizer, evidencing a greater ability for ryegrass to inhibit nitrification compared to sorghum and hemp, likely due to a greater amount of nitrification inhibiting molecules released into the soil because of the greater seed sowing density. We speculate that the high plant density increased the competition for nutrients, mainly N, triggering greater BNI release from plant roots as they strive to optimize nitrogen uptake. On the other hand, hemp growth under the optimal N supply reduces PNR by subtracting nitrogen to nitrification, whereas this latter is enhanced under circumstances that limit photosynthesis, as occurred at the highest N dose. Therefore, our data support the hypothesis that hemp could not be a BNI-secreting plant and that this species might affect nitrification by an indirect influence.
Our results also seem to suggest indirectly that the seed sowing density might be important for obtaining an adequate amount of nitrification-inhibiting molecules in the soil. In fact, although it is well documented that sorghum releases hydrophobic (not soluble in water) and hydrophilic (soluble in water) BNI compounds from its roots [23], whose performance is mainly affected by the NH4+ availability into the soil [23,24], the worse performance of sorghum compared to ryegrass in mitigating nitrification might be due to the lower seed sowing density used for sorghum (one seed per pot) compared to ryegrass (more seeds per pot). The data presented here represents preliminary results that need further investigation to better understand the direct and indirect influence of tested species on nitrification. We believe that additional determinations, such as the ammonium-oxidizing microbes’ activity and root exudates acting as BNI molecules, are essential to fully understand the influence of the three species on ammonia oxidation.

5. Conclusions

Plant species and the available nitrogen level in the soil significantly impacted the nitrification rates. Among the species studied, only hemp’s photosynthesis was affected by the nitrogen supply, whereas ryegrass species seem better at limiting nitrification compared to the other two species. This was likely due to the higher planting density, which allows for a greater amount in the soil of molecules acting to inhibit nitrification. Further research is needed to evaluate the presence in the soil of specific root exudates secreted by the studied species and their effect on ammonia-oxidizing microbes, as well as the effect of plant density on the nitrification rate.

Author Contributions

Conceptualization, L.V. and A.T.; formal analysis, A.T., G.M., F.G.-S., L.Y., M.R., A.M., and L.O.; investigation, L.V., A.T., G.M., F.G.-S., L.Y., M.R., L.O., B.D.M., and R.N.; data curation, L.V. and A.T.; writing—original draft preparation, L.V.; writing—review and editing, L.V., A.T., G.M., F.G.-S., L.Y., M.R., A.M., and L.O.; supervision, L.V. and A.T.; funding acquisition, A.T. All authors have read and agreed to the published version of the manuscript.

Funding

This study was carried out within the TeleNitro project, part of PRIMA Programme supported by the European Union’s Horizon 2020 research and innovation programme (ID project: 1847), funded by the Italian Ministry of University and Research (MUR).

Data Availability Statement

The raw data supporting the conclusions of this article will be made available by the authors, without undue reservation.

Acknowledgments

The authors thank Fulvia Stanzione (CNR-IBBR), Luisa Russo (CNR-ISAFOM), and Loredana Di Pierno (CNR-ISPAAM) for their support in the administrative management of TeleNitro project.

Conflicts of Interest

The authors declare no conflict of interest.

References

  1. Manco, A.; Giaccone, M.; Zenone, T.; Onofri, A.; Tei, F.; Farneselli, M.; Gabbrielli, M.; Allegrezza, M.; Perego, A.; Magliulo, V.; et al. An Overview of N2O Emissions from Cropping Systems and Current Strategies to Improve Nitrogen Use Efficiency. Horticulturae 2024, 10, 754. [Google Scholar] [CrossRef]
  2. Lata, J.C.; Guillaume, K.; Degrange, V.; Abbadie, L.; Lensi, R. Relationships between root density of the African grass Hyparrhenia diplandra and nitrification at the decimetric scale, an inhibition-stimulation balance hypothesis. Proc. Biol. Sci. 2000, 267, 595–600. [Google Scholar] [CrossRef]
  3. Subbarao, G.V.; Yoshihashi, T.; Worthington, M.; Nakahara, K.; Ando, Y.; Sahrawat, K.L.; Rao, I.M.; Lata, J.C.; Kishii, M.; Braun, H.J. Suppression of soil nitrification by plants. Plant Sci. 2015, 233, 155–164. [Google Scholar] [CrossRef]
  4. Campos, J.L.; Garrido-Fernández, J.M.; Méndez, R.; Lema, J.M. Nitrification at high ammonia loading rates in an activated sludge unit. Bioresour. Technol. 1999, 68, 141–148. [Google Scholar]
  5. Norton, J.M.; Alzerreca, J.J.; Suwa, Y.; Klotz, M.G. Diversity of ammonia monooxygenase operon in autotrophic ammonia-oxidizing bacteria. Arch. Microbiol. 2002, 177, 139–149. [Google Scholar] [CrossRef]
  6. Hommes, N.G.; Sayavedra-Soto, L.A.; Arp, D.J. The roles of the three gene copies encoding hydroxylamine oxidoreductase in Nitrosomonas europaea. Arch. Microbiol. 2002, 178, 471–476. [Google Scholar] [CrossRef]
  7. Qin, F.; Su, H.; Sun, L.; Li, Y. Research Progress Related to Sorghum Biological Nitrification Inhibitors. Agronomy 2024, 14, 1576. [Google Scholar] [CrossRef]
  8. Issifu, S.; Acharya, P.; Kaur-Bhambra, J.; Gubry-Rangin, C.; Rasche, F. Biological Nitrification Inhibitors with Antagonistic and Synergistic Effects on Growth of Ammonia Oxidisers and Soil Nitrification. Microb. Ecol. 2024, 87, 143. [Google Scholar] [CrossRef]
  9. Von Caemmerer, S.; Farquhar, G.D. Some relationships between the biochemistry of photosynthesis and the gas exchange of leaves. Planta 1981, 153, 376–387. [Google Scholar] [CrossRef]
  10. Maxwell, K.; Johnson, G.N. Chlorophyll fluorescence—A practical guide. J. Exp. Bot. 2000, 51, 659–668. [Google Scholar] [CrossRef]
  11. Tietz, S.; Hall, C.C.; Cruz, J.A.; Kramer, D.M. NPQ (T): A chlorophyll fluorescence parameter for rapid estimation and imaging of non-photochemical quenching of excitons in photosystem-II-associated antenna complexes. Plant Cell Environ. 2017, 40, 1243–1255. [Google Scholar] [CrossRef]
  12. Searles, P.S.; Bloom, A.J. Nitrate photo-assimilation in tomato leaves under short-term exposure to elevated carbon dioxide and low oxygen. Plant Cell Environ. 2003, 26, 1247–1255. [Google Scholar] [CrossRef]
  13. Bloom, A.J.; Smart, D.R.; Nguyen, D.T.; Searles, P.S. Nitrogen assimilation and growth of wheat under elevated carbon dioxide. Proc. Natl. Acad. Sci. USA 2002, 99, 1730–1735. [Google Scholar] [CrossRef]
  14. Arena, C.; Vitale, L.; Virzo De Santo, A. Photosynthetic response of Quercus ilex L. plants grown on compost and exposed to increasing photon flux densities and elevated CO2. Photosynthetica 2005, 43, 615–619. [Google Scholar] [CrossRef]
  15. O’Sullivan, C.A.; Duncan, E.G.; Roper, M.M.; Richardson, A.E.; Kirkegaard, J.A.; Peoples, M.P. Root Exudates From Canola Exhibit Biological Nitrification Inhibition And Are Effective In Inhibiting Ammonia Oxidation In Soil. Front. Agr. Sci. Eng. 2022, 9, 177–186. [Google Scholar]
  16. Makino, Y.; Ueno, O. Structural and physiological responses of the C4 grass Sorghum bicolor to nitrogen limitation. Plant Prod. Sci. 2018, 21, 39–50. [Google Scholar] [CrossRef]
  17. Zhao, D.; Reddy, K.R.; Kakani, V.K.; Reddy, V.R. Nitrogen deficiency effects on plant growth, leaf photosynthesis, and hyperspectral reflectance properties of sorghum. Eur. J. Agron. 2005, 22, 391–403. [Google Scholar] [CrossRef]
  18. Peng, J.; Feng, Y.; Wang, X.; Li, J.; Xu, G.; Phonenasay, S.; Luo, Q.; Han, Z.; Lu, W. Effects of nitrogen application rate on the photosynthetic pigment, leaf fluorescence characteristics, and yield of indica hybrid rice and their interrelations. Sci. Rep. 2021, 11, 7485. [Google Scholar] [CrossRef]
  19. Yao, Y.Y.; Zhang, C.K.; Camberato, J.J.; Jiang, Y.W. Nitrogen and carbon contents, nitrogen use efficiency, and antioxidant responses of perennial ryegrass accessions to nitrogen deficiency. J. Plant Nutr. 2019, 42, 2092–2101. [Google Scholar] [CrossRef]
  20. Krämer, K.; Brock, J.; Heyr, A.G. Interaction of Nitrate Assimilation and Photorespiration at Elevated CO2. Front. Plant Sci. 2022, 13, 897924. [Google Scholar] [CrossRef]
  21. Saloner, A.; Bernstein, N. Response of medical cannabis (Cannabis sativa L.) to nitrogen supply under long photoperiod. Front. Plant Sci. 2020, 11, 572293. [Google Scholar] [CrossRef]
  22. Yang, Y.; Zha, W.; Tang, K.; Deng, G.; Du, G.; Liu, F. Effect of nitrogen supply on growth and nitrogen utilization in hemp (Cannabis sativa L.). Agronomy 2021, 11, 2310. [Google Scholar] [CrossRef]
  23. Subbarao, G.V.; Nakahara, K.; Ishikawa, T.; Ono, H.; Yoshida, M.; Yoshihashi, T.; Zhu, Y.; Zakir, H.A.K.M.; Deshpande, S.P.; Hash, C.T.; et al. Biological nitrification inhibition (BNI) activity in sorghum and its characterization. Plant Soil. 2013, 366, 243–259. [Google Scholar] [CrossRef]
  24. Zhu, Y.; Zeng, H.; Shen, Q.; Ishikawa, T.; Subbarao, G.V. Interplay among NH uptake, rhizosphere pH and plasma membrane H + 4+-ATPase determine the release of BNIs in sorghum roots-possible mechanisms and underling hypothesis. Plant Soil. 2012, 358, 131–141. [Google Scholar] [CrossRef]
Figure 1. AN, net photosynthesis (A); gs, stomatal conductance (B); CE, apparent carboxylation efficiency (C); WUE, water use efficiency (D) in plants of sorghum (S), ryegrass (R), and hemp (H) grown under three nitrogen (N) levels (0 mM, 3.5 mM, and 7.0 mM). Data are means ± SE (n = 4). Small letters denote differences among species within each N level. Capital letters denote differences among N levels within the same species.
Agriculture 15 01740 g001
Figure 2. ΦPSII, efficient quantum yield of PSII photochemistry (A); qP, photochemical quenching (B); NPQT, non-photochemical quenching (C); AQF, assimilatory quotient (D) in plants of sorghum (S), ryegrass (R), and hemp (H) grown under three nitrogen (N) levels (0 mM, 3.5 mM, and 7.0 mM). Data are means ± SE (n = 4). Small letters denote differences among species within each N level. Capital letters denote differences among N levels within the same species.
Agriculture 15 01740 g002
Figure 3. Potential nitrification rates in soil grown with sorghum (S), ryegrass (R), or hemp (H) under three nitrogen levels (0 mM, 3.5 mM, and 7.0 mM). Data are means ± SE (n = 4). Small letters denote differences among species within each N level. Capital letters denote differences among N levels within the same species.
Agriculture 15 01740 g003
Table 1. Physical–chemical characteristics of soil at 0–0.30 m depth.
ParameterValue
Soil typeSandy loam
Texture (%):
clay15
silt25
sand60
Bulk density (g cm−3)1.10
pHH2O7.4
CaCO3 (%)2.1
C/N8.0
Organic matter (%)2.8
Organic carbon (%) 1.6
P (g kg−1)0.088
K (g kg−1)1.4
Total N (%)0.2
N-NO3 (g kg−1)0.011
N-NH4 (g kg−1)0.012
Table 2. Experimental trial with species, nitrogen levels, and replicates.
SpeciesN LevelsReplicates
Sorghum0 mM3.5 mM7.0 mM4
Ryegrass0 mM3.5 mM7.0 mM4
Hemp0 mM3.5 mM7.0 mM4
Table 3. Chlorophyll, flavonol, and anthocyanin indexes and the nitrogen–flavonol index (NFI) in plants of sorghum, ryegrass, and hemp grown under three nitrogen (N) levels (0 mM, 3.5 mM, and 7.0 mM).
SorghumRyegrassHemp
0 mM3.5 mM7.0 mM0 mM3.5 mM7.0 mM0 mM3.5 mM7.0 mM
Chlorophylls0.60 ± 0.03 aA0.61 ± 0.05 aA0.59 ± 0.05 aA0.84 ± 0.13 bA0.87 ± 0.15 bA1.10 ± 0.13 bA0.39 ± 0.02 cA0.52 ± 0.01 aB0.55 ± 0.02 aB
Flavonols0.25 ± 0.02 aA0.13 ± 0.03 aA0.27 ± 0.05 aA0.36 ± 0.03 bA0.13 ± 0.03 aB0.10 ± 0.02 bB0.28 ± 0.03 cA0.31 ± 0.03 bA0.25 ± 0.02 aA
Anthocyanins0.022 ± 0.0045 aA0.027 ± 0.0046 aA0.031 ± 0.0068 aA0.062 ± 0.0011 bA0.031 ± 0.0079 aA0.037 ± 0.010 aA0.022 ± 0.0051 aA0.0044 ± 0.00015 bB0.016 ± 0.0029 bA
NFI2.86 ± 0.51 aA3.86 ± 0.7 6aA2.92 ± 0.60 aA2.45 ± 0.38 aA7.02 ± 1.29 bB10.58 ± 2.12 bB1.55 ± 0.16 bA1.85 ± 0.20 cA2.28 ± 0.18 aA
Data are means ± SE (n = 4). Small letters denote differences among species within each N level. Capital letters denote differences among N levels within the same species.
Disclaimer/Publisher’s Note: The statements, opinions and data contained in all publications are solely those of the individual author(s) and contributor(s) and not of MDPI and/or the editor(s). MDPI and/or the editor(s) disclaim responsibility for any injury to people or property resulting from any ideas, methods, instructions or products referred to in the content.