Article

Study and Testing of a Front-Blowing and Rear-Suction Enhanced Cleaning Technology for Grain Combine Harvesters

School of Agricultural Engineering and Food Science, Shandong University of Technology, Zibo 255000, China
*
Author to whom correspondence should be addressed.
Agriculture 2025, 15(16), 1722; https://doi.org/10.3390/agriculture15161722
Submission received: 11 July 2025 / Revised: 3 August 2025 / Accepted: 8 August 2025 / Published: 9 August 2025
(This article belongs to the Section Agricultural Technology)

Abstract

To address the issue in high-throughput longitudinal axial-flow grain combine harvester cleaning systems, in which the extended length of the cleaning chamber results in airflow velocity attenuation and makes it difficult to efficiently and rapidly remove light impurities, a front-blowing and rear-suction enhanced cleaning technology and device was developed. Based on the investigation of the movement characteristics of the cleaning airflow within the cleaning chamber, a theoretical model was established to describe the velocity variation of the front-blowing and rear-suction enhanced cleaning airflow. CFD simulation software was employed to conduct a comparative analysis of the airflow field structure before and after improvement, aiming to identify the influence patterns of key structural parameters on the airflow field distribution. An orthogonal experiment with three factors and three levels was conducted on the improved cleaning system, focusing on the suction fan speed, vertical installation height of the suction fan, and horizontal distance between the suction fan and the sieve surface. The influence of each factor on the airflow field was analyzed, and the optimal parameter combination was obtained. When the suction fan speed was 2275 r/min, the vertical installation height was 72.5 mm, the horizontal distance to the sieve surface was 385 mm, and the airflow non-uniformity coefficient at the rear part of the screen surface was 11.17%, with a relative error of 4.39% compared to the optimization result. Finally, bench tests were conducted to verify the accuracy of the simulation results. Compared to that before improvement, the airflow non-uniformity coefficient at the rear part of the screen surface in the cleaning chamber was reduced by 59.43%, significantly improving the uniformity of airflow distribution. These findings provide both theoretical and technical support for improving the cleaning efficiency and operational performance of high-throughput grain combine harvesters.

1. Introduction

The cleaning system of a grain combine harvester is primarily responsible for separating grains from the threshed materials and is often referred to as the “digestive system” of the machine [1]. Its performance directly influences both the cleaning efficiency and the overall operational quality of the harvester. In high-throughput longitudinal axial-flow combine harvesters, the length of the cleaning chamber has been continuously extended to reduce the cleaning load per unit area [2]. However, this structural adaptation leads to excessive attenuation of the longitudinal airflow velocity, resulting in a higher impurity content and increased cleaning losses, which ultimately degrade the machine’s overall working quality [3]. Therefore, there is an urgent need to develop a novel cleaning system suitable for high-throughput operating conditions, in which the airflow velocity remains constant at the front of the sieve and is increased at the rear. This design aims to mitigate the problem of severe airflow attenuation at the rear of the cleaning chamber, which hampers the transport and discharge of light impurities, thereby enhancing the impurity removal capacity and improving the overall cleaning efficiency [4].
Currently, leading agricultural machinery manufacturers, such as CLAAS, John Deere, and Yanmar, have adopted a variety of cleaning system configurations aimed at improving airflow performance in high-throughput harvesting conditions. For example, CLAAS employs axial-flow fan systems in combination with extended sieves in its LEXION series, while John Deere integrates cross-flow fans with adjustable ducting in the S-series models to enhance air distribution across the sieve surface. Yanmar, a major Japanese manufacturer, utilizes serial multi-fan arrangements to address airflow uniformity issues. Despite these industrial advancements, challenges, such as airflow velocity attenuation, especially at the rear of elongated cleaning chambers, continue to hamper impurity discharge performance and reduce the overall cleaning efficiency. These limitations highlight the need for further structural innovation and airflow control strategies.
In response to the issue of reduced light impurity transport and discharge efficiency caused by airflow attenuation in the cleaning systems of high-throughput combine harvesters, researchers both in China and abroad have conducted extensive investigations from multiple perspectives [5]. Professor Zhenwei Liang from Jiangsu University proposed a dual-inlet, multi-channel cleaning system, which enhances the transport and discharge of light impurities by increasing the initial longitudinal velocity of airflow at the front of the cleaning chamber (i.e., in front of the sieve) to raise the terminal airflow velocity at the rear of the cleaning chamber (i.e., at the end of the sieve) [6]. Gebrehiwot addressed the problem of airflow velocity imbalance at the central front area of the sieve, which was caused by the limited inlet area of the cleaning fan, by adding a transverse air inlet channel in front of the fan [7,8]. This modification effectively improved the consistency of airflow velocity along the width of the sieve surface. Badretdinov reduced the airflow velocity variation across the sieve surface by adding deflector plates within the air duct, thereby enhancing the transport and discharge capacity of light impurities [9]. To mitigate the adverse effects of airflow attenuation in the cleaning chamber on the discharge of light impurities, Yanmar (Japan) developed a serial configuration of three fans positioned at the front, middle, and rear of the system. This configuration significantly enhanced the transport and discharge capacity of light impurities and notably improved the overall cleaning performance.
In research on airflow field simulation within the cleaning chamber, with the application of computational fluid dynamics (CFD) software (ANSYS Fluent 2021 R1, ANSYS Inc., Canonsburg, PA, USA), the studies on airflow regulation methods and configuration patterns in cleaning systems have become more accurate and convenient [10]. Professor XU Lizhang, aiming to improve the uniformity of the airflow in front of the sieve in the multi-duct cleaning system of rice combine harvesters, adopted a method combining CFD simulation with measured airflow velocity [11]. The study demonstrated that increasing the number of fan outlets and optimizing their positions are effective in improving the transverse distribution of airflow velocity in front of the sieve. Zhou Quan employed CFD simulation to analyze the airflow distribution characteristics in the air-sieve combined cleaning device and identified the influence patterns of factors, such as the outlet position and sieve surface structure, on the airflow distribution [12]. In addition, XU Lizhang utilized CFD simulation to optimize the structural parameters of the fan impeller, which significantly improved the uniformity of airflow velocity distribution in front of the sieve [13,14]. Liao Qingxi conducted a simulation study on the airflow distribution of the rapeseed combine harvester’s cleaning device using computational fluid dynamics (CFD) technology. The influence of the inlet and outlet airflow velocities of the fan on the separation performance was analyzed, and a mathematical model was established to improve the airflow distribution structure [15].
In summary, to address the issue of excessive airflow velocity attenuation in the cleaning chamber of high-throughput grain combine harvesters, which negatively affects the discharge of impurities, a “front-blowing and rear-suction” air-sieve combined cleaning technology was proposed. In this configuration, the front centrifugal fan blows air across the sieve surface, while a rear induced draft fan extracts air outward, forming a coordinated airflow distribution that improves both velocity and uniformity in the cleaning chamber. Using CFD simulation methods, the structural and motion parameters for enhancing the airflow velocity at the rear of the sieve were analyzed and optimized, and the influence patterns of different parameters on airflow attenuation delay and airflow uniformity improvement at the rear were determined. On this basis, a “front-blowing and rear-suction” air-sieve combined cleaning test platform was constructed to experimentally validate the performance of the optimized cleaning system. The results showed that this technology can effectively mitigate airflow velocity attenuation, enhance the transport and discharge capability of light impurities, and significantly improve the cleaning efficiency and operational quality under high-throughput conditions. Accordingly, this study aims to (1) evaluate the effects of key structural parameters on rear airflow uniformity via CFD and experiments and (2) develop an optimized front-blowing and rear-suction configuration to address airflow limitations. These objectives help close the knowledge gap in airflow regulation and support subsequent methodological development.

2. Materials and Methods

2.1. Operating Principle of the Cleaning System

Based on the requirements of high-efficiency and low-loss cleaning in grain combine harvesters, a “front-blowing and rear-suction” air-sieve combined cleaning test platform was constructed (Table 1), as shown in Figure 1. The system mainly consists of a centrifugal fan, a cleaning chamber, a fish-scale sieve, a perforated sieve, and an induced draft fan. During operation, when the threshed mixture falls evenly from the feeding hopper into the cleaning chamber, the centrifugal airflow at the front separates light impurities from the oversized materials. The mixture containing grains falls onto the fish-scale sieve, where, assisted by the mechanical action of the vibrating sieve, long straws and fine impurities are separated from the grains. Meanwhile, the light impurities are conveyed rearward by the airflow in the cleaning chamber. Considering that the airflow carrying light impurities gradually decelerates due to the load of impurities and other factors during its rearward movement—potentially reducing the transport and discharge efficiency of light impurities—a rear induced draft fan is added at the end of the sieve to enhance the airflow velocity at the rear of the cleaning chamber. This configuration prevents light impurities from settling onto the sieve surface under gravity, which would otherwise compromise grain sieving and impurity discharge efficiency.

2.2. Construction of the Airflow Velocity Model in the Cleaning Chamber

2.2.1. Investigation into the Flow Behavior of Cleaning Airflow

The airflow in the cleaning chamber primarily assists the vibrating sieve in fluidizing the oversized materials and in entraining and discharging the light impurities from the threshed mixture [16]. To facilitate analysis and description, the following assumptions were made for the research conditions:
(1)
The light impurities are entrained and transported by the airflow, and their velocity is assumed to be equal to the airflow velocity within the cleaning chamber.
(2)
The vertical and horizontal components of the airflow velocity are assumed to be independent, and the airflow at the rear of the cleaning chamber is considered to be in a laminar flow state.
(3)
The density and pressure of the airflow in the cleaning chamber are assumed to remain constant. The density is equal to that of air under standard atmospheric conditions, and the static pressure is considered to be zero.
(4)
The light impurities are assumed to be uniform spherical particles with a diameter of d (i.e., a radius of r ), and the windward area is π r 2 .
(5)
The threshed materials falling from the concave screen onto the cleaning sieve are assumed to be uniformly distributed within the cleaning chamber, with an average windward area denoted as A .
Based on the above assumptions, let the airflow velocity be v , and the drag force F acting on the light impurity in the flow field can be expressed as:
F = k ρ A v 2 = k ρ π r 2 v 2
Ignoring the gravitational force component of the light impurity in the direction of the airflow, and assuming that its initial horizontal velocity is zero, the light impurity is subjected only to the drag force from the airflow in this direction. Therefore, its acceleration can be expressed as:
a = F m = k ρ π r 2 v 2 ρ 0 4 3 π r 3 = 3 k ρ v 2 4 ρ 0 r
where k is the drag coefficient of the light impurity, ρ is the density of the airflow, v is the airflow velocity, ρ 0 is the density of the light impurity, and r is the radius of the light impurity. The negative sign indicates that the light impurity is subjected to a decelerating force due to the airflow drag, resulting in a gradual reduction in its velocity.
According to the above equation, the acceleration of the light impurity in the airflow field is proportional to the square of its velocity. This indicates that the airflow carrying the impurities decelerates rapidly in the front section of the sieve. Once the airflow velocity drops below the suspension velocity of the light impurities, there is a risk that the impurities will settle onto the sieve surface, obstructing the grain penetration and failing to be discharged directly, thereby increasing the risk of cleaning losses.
Furthermore, based on the acceleration equation a = d v d t , we have:
a = d v d t = 3 k ρ v 2 4 ρ 0 r
By integrating the equation, we obtain:
d v 3 k ρ v 2 = d t 4 ρ 0 r
v 0 v d v 3 k ρ v 2 = 0 t d t 4 ρ 0 r
1 3 k ρ v v 0 v = t 4 ρ 0 r 0 t
By simplifying the equation, we obtain:
1 v = 1 v 0 + 3 k ρ 4 ρ 0 r t
To simplify the equation, considering that the characteristic parameters of the airflow and the light impurities are constants, let C = 3 k ρ 4 ρ 0 r , then:
v = v 0 C v 0 t + 1
Accordingly, the velocity v s s of the light impurity can be expressed as:
v x ( s ) = v 0 C v 0 t + 1 ( 0 s S )
where s represents the horizontal distance along the cleaning chamber, C is a constant parameter that comprehensively reflects airflow resistance and material properties, and S denotes the total length of the cleaning chamber.
According to the theoretical model, the airflow velocity decreases with increasing distance (i.e., as time t progresses), thereby limiting the maximum effective transport distance of light impurities within the cleaning chamber. Although increasing the initial airflow velocity can enhance the transport distance of light impurities, the initial acceleration of high-speed airflow is also greater (as indicated in Equation (3), where acceleration is proportional to the square of velocity), resulting in a rapid reduction in airflow velocity. This leads to a sharp decline in the capacity to carry light impurities, increases the cleaning load on the sieve surface, and ultimately restricts improvements in cleaning efficiency. Therefore, enhancing the airflow velocity at the rear of the sieve is critical for extending the transport distance of light impurities and ensuring their stable discharge. Based on this consideration, this study proposes a “front-blowing and rear-suction” air-sieve combined cleaning technique, wherein an induced draft fan is added at the rear of the cleaning chamber to effectively delay or maintain the airflow velocity behind the sieve and thus improve the transport and discharge performance for light impurities.

2.2.2. Study on the Airflow Velocity Variation Model of the “Front-Blowing and Rear-Suction” Air-Sieve Combined Cleaning Technology

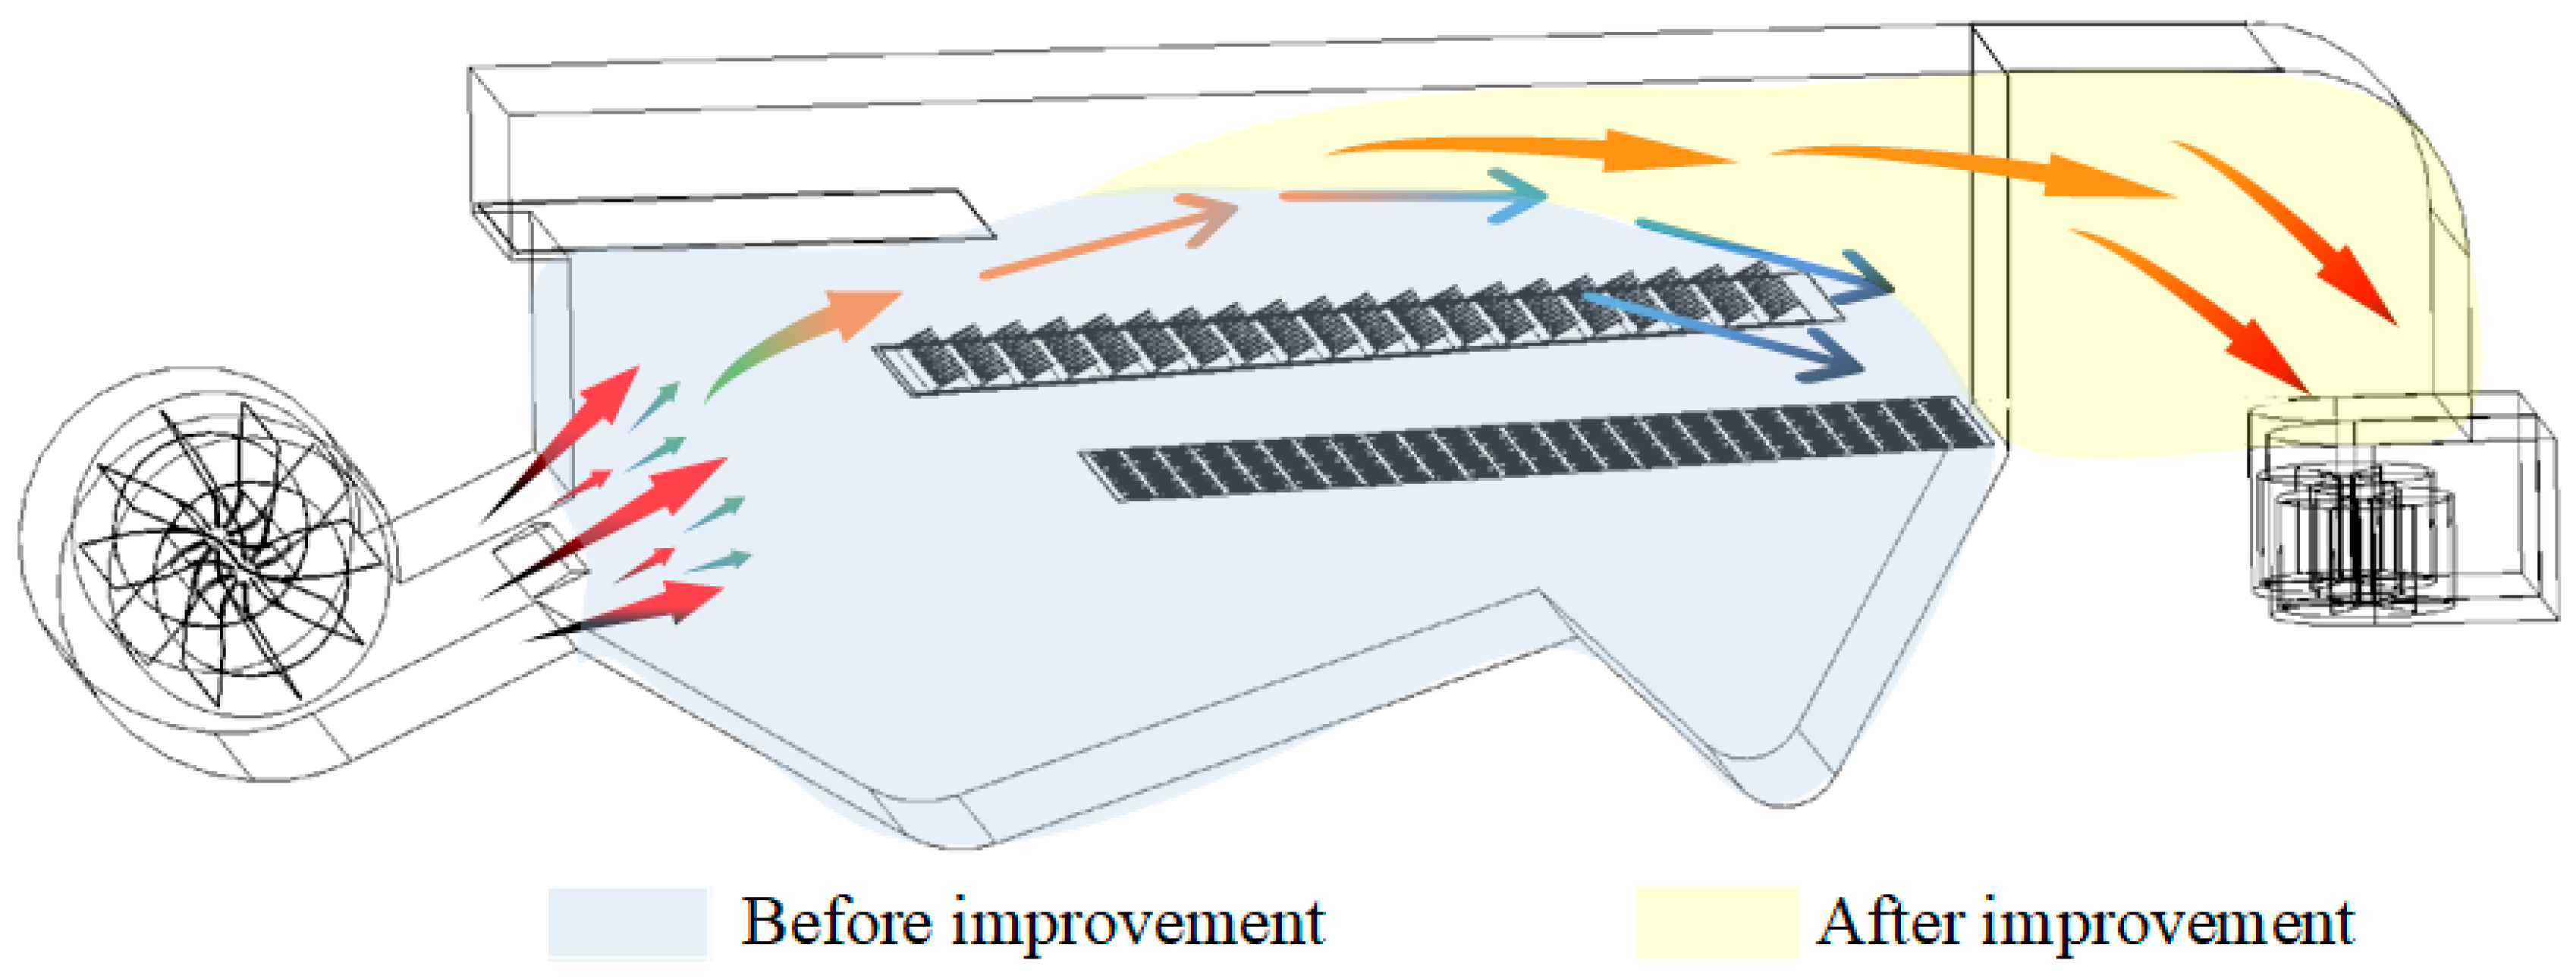
To address the problem of excessively rapid airflow velocity attenuation in conventional cleaning systems, which compromises cleaning performance, this study incorporates an induced draft fan at the rear end of the cleaning chamber (as shown in Figure 2). By utilizing the suction force of the induced draft fan, the airflow within the cleaning chamber gains additional velocity before significant attenuation occurs. This enhancement improves the airflow velocity at the rear end of the chamber and optimizes the structure of the airflow field in that region, thereby strengthening the capability of the airflow to entrain and discharge light impurities. Clearly, determining the position at which airflow attenuation begins under the action of the front-blowing fan is critical to this study. This position is assumed to be located at a distance s 0 from the outlet of the front-blowing fan. Secondly, an appropriate induced draft fan is selected so that its airflow action position coincides with this position in order to delay the attenuation of airflow in the cleaning chamber. It is assumed that this position is at a distance of s from the inlet of the induced draft fan, so the total length of the cleaning chamber is s 0 + s . That is, in the range ( 0 s s 0 ) , the airflow velocity is mainly dominated by the front-blowing fan, and the airflow velocity distribution maintains the traditional cleaning structure. In the range s 0 s s 0 + Δ s , the airflow velocity is jointly affected by the front-blowing fan and the rear-suction fan. That is, on the basis of the original airflow velocity v x , a second horizontal airflow velocity v α is added, thereby allowing the piecewise velocity model to be expressed as:
v x ( s ) = v 0 C v 0 t + 1 0 s s 0 v s 0 + v α C ( v s 0 + v α ) t + 1 s 0 < s s 0 + Δ s
According to this piecewise velocity model, the airflow undergoes a secondary acceleration in the rear region, enabling the light impurities to maintain a relatively high horizontal conveying velocity in the rear section of the cleaning chamber. As a result, the effective cleaning length is extended from S to S + Δ S , while ensuring sufficient airflow velocity at the chamber’s end. This guarantees the efficient discharge of light impurities, dust, and other contaminants, thereby meeting the cleaning performance requirements of high-throughput grain combine harvesters.

2.3. Construction of the Airflow Field Simulation Model for the Cleaning Device

The CFD model was developed based on a wind-sieve type cleaning test bench independently designed by the research group. The front blower was set to operate at 1050 r/min, with a sieve width of 500 mm and an effective length of 1200 mm. The air inlet was positioned 580 mm above the sieve surface. The model retained key geometric features and fan layout, enabling a realistic representation of airflow distribution characteristics and providing a reliable basis for subsequent structural optimization.
To verify the improvement effect of the front-blowing and rear-suction combined cleaning system on the airflow field distribution in the cleaning chamber, Fluent was employed to perform a simulation analysis of the airflow structure [17,18]. First, based on the actual structural parameters of the cleaning chamber, a model of the front-blowing and rear-suction cleaning test platform was established, and relevant simulation parameters were configured. Second, an unstructured hybrid mesh was adopted for grid generation, and local mesh refinement was applied to critical regions, such as the fan outlets, guide vanes, sieves, and induced draft fan, to accurately capture airflow details. The inlet and outlet boundaries were defined as pressure inlet and pressure outlet, respectively, while the chamber walls were treated as no-slip boundaries. The realizable k ε turbulence model was selected due to its high accuracy and adaptability in simulating complex internal flow fields [19]. The fan speed was set in the range of 1800–2400 r/min, determined according to the structural characteristics of the unit and preliminary prototype test conditions. Data transfer between different zones of the airflow field in the cleaning chamber was achieved using interface contact surfaces [20]. Finally, numerical calculations were performed using the SIMPLEC algorithm, with a residual convergence criterion of 0.00001. The simulation results eventually converged, meeting the required level of computational accuracy.

2.4. Design of Simulation Experiments for Airflow Field Structure

In order to investigate the influence of the induced draft fan structure on the cleaning airflow distribution, two test conditions were designed: “front-blowing fan” and “front-blowing and rear-suction combined structure”, so as to compare the simulation results of the airflow field structure in the cleaning chamber before and after improvement. The 3D structure of the cleaning chamber was established using SolidWorks software, with fan boundary areas set separately, and the model was simplified and partitioned using SpaceClaim software [21,22]. Then, the 3D model of the cleaning chamber was imported into ANSYS Fluent, and CFD simulation was conducted using the steady-state k ε turbulence model [23,24]. The boundary conditions were set as pressure inlet and pressure outlet, and the rotation speed of the front-blowing fan was set to 1050 r/min. In order to ensure the comparability of simulation results, the two conditions maintained consistency in mesh division and boundary condition settings, with only the fan layout adjusted so as to conduct comparative analysis of the simulation results under the two working conditions.
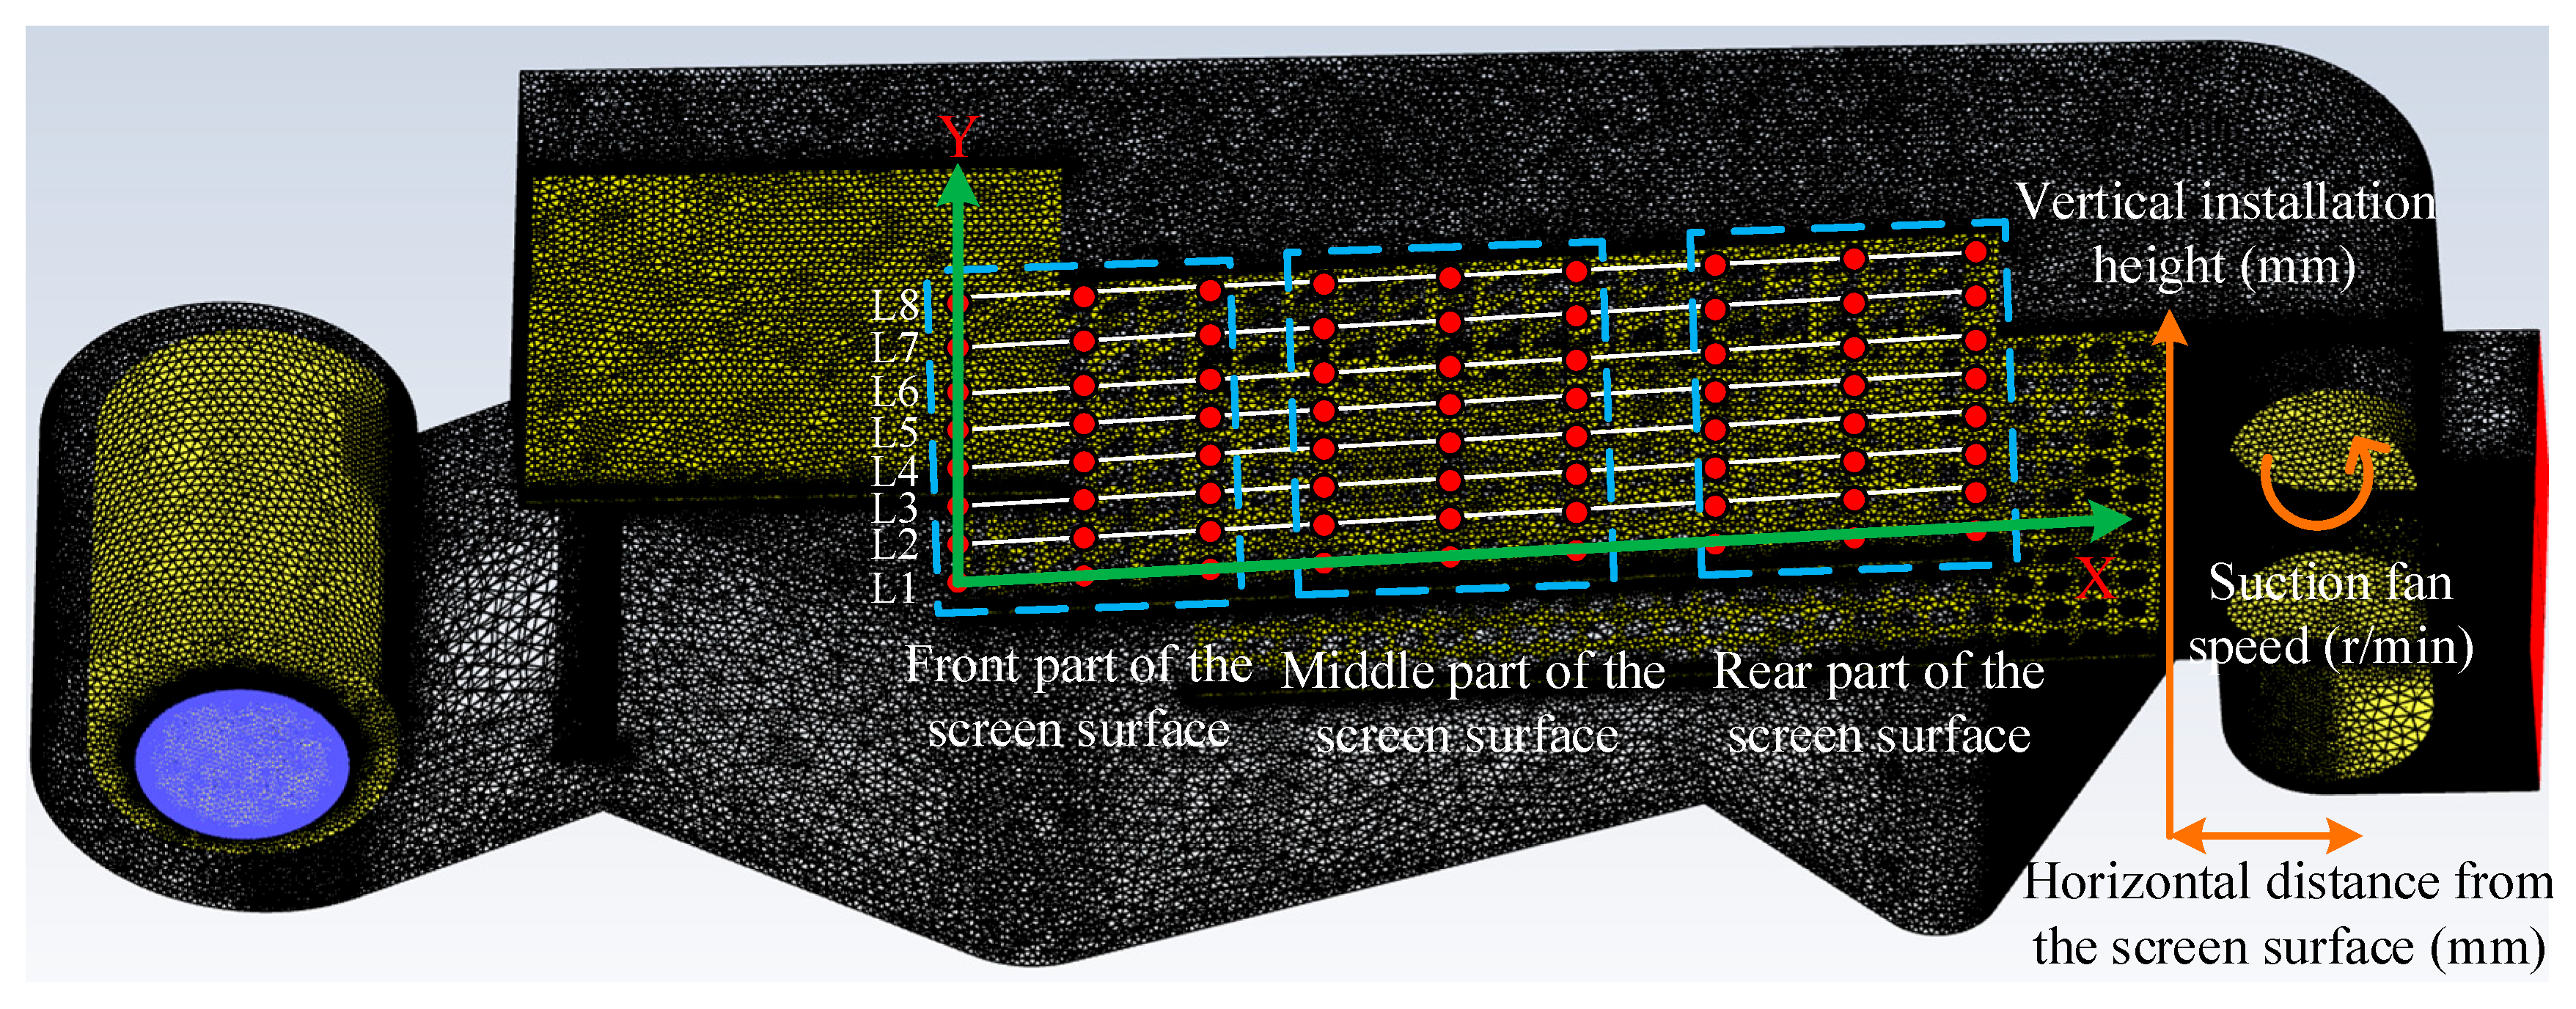
To better investigate the airflow field distribution structure in the cleaning chamber under different conditions, and in consideration of the installation space requirements of the detection device under actual working conditions, an observation (data acquisition) plane was set 120 mm above the fish-scale sieve [25]. A coordinate system was established, with the front-leftmost point of the sieve surface as the origin, the width direction of the sieve surface defined as the Y-axis, and the length direction defined as the X-axis. Considering that the horizontal velocity of the airflow continuously attenuates due to the influence of factors, such as the composition of threshed materials, the structure of light impurities, and the transport distance of light impurities, the observation plane was divided into three regions: front, middle, and rear. A total of 72 measurement points (arranged in 8 rows and 9 columns) were evenly distributed across the plane to measure the airflow velocity, as shown in Figure 3. To ensure the repeatability of the experimental results, each test condition was measured three times under identical setup and environmental conditions, and the average values were used for analysis. To validate the simulation results, the predicted airflow velocity distributions were compared with experimental measurements obtained at 72 observation points on the measurement plane. The comparison showed good agreement in both velocity magnitude and spatial distribution, confirming the accuracy and reliability of the CFD model.

2.5. Evaluation Indicators for Airflow Field Structure

To evaluate the uniformity of the airflow velocity distribution in the cleaning chamber, the airflow velocity difference and the airflow velocity non-uniformity coefficient were selected as the evaluation indicators. The airflow velocity difference represents the magnitude of velocity attenuation after the airflow passes through the cleaning chamber; obviously, a larger value indicates more severe attenuation, resulting in a lower efficiency for transporting and discharging light impurities. The airflow velocity non-uniformity coefficient reflects the degree of inconsistency in the airflow velocity at the rear of the sieve; a smaller value indicates a more stable capability for carrying and expelling light impurities.
To comprehensively understand the overall distribution structure of the airflow field in the cleaning chamber, a total of 72 measurement points across the front, middle, and rear regions of the observation plane were tested to ensure the accuracy of the airflow distribution evaluation [26].
The calculation methods for the airflow velocity difference and the airflow velocity non-uniformity coefficient are as follows:
V d = V max V min
U v = σ v v ¯ × 100 % = ( v i v ¯ ) 2 / n v ¯
where V d represents the maximum difference in airflow velocity between the front and rear of the sieve, V max is the maximum airflow velocity at the front of the sieve, and V min is the minimum airflow velocity at the rear. Evidently, the larger this value, the more significant the velocity attenuation during the transport of light impurities through the cleaning chamber, which adversely affects the discharge of light impurities and the passage of grains through the sieve. U v denotes the airflow velocity non-uniformity coefficient in the width direction of the sieve at the rear; σ v is the root mean square deviation of the airflow velocity; v ¯ is the average airflow velocity; v i is the airflow velocity at the i-th monitoring point at the rear of the sieve; and n is the total number of monitoring points along the width direction at the rear of the sieve.

3. Results and Discussion

3.1. Analysis of the Airflow Field Distribution in the Cleaning Chamber Before and After Improvement

3.1.1. Analysis of the Airflow Field Structure in the Cleaning Chamber Before Improvement

Based on the CFD simulation setup described in Section 2.3, the airflow field distribution prior to structural modification was analyzed to establish a baseline for comparison.
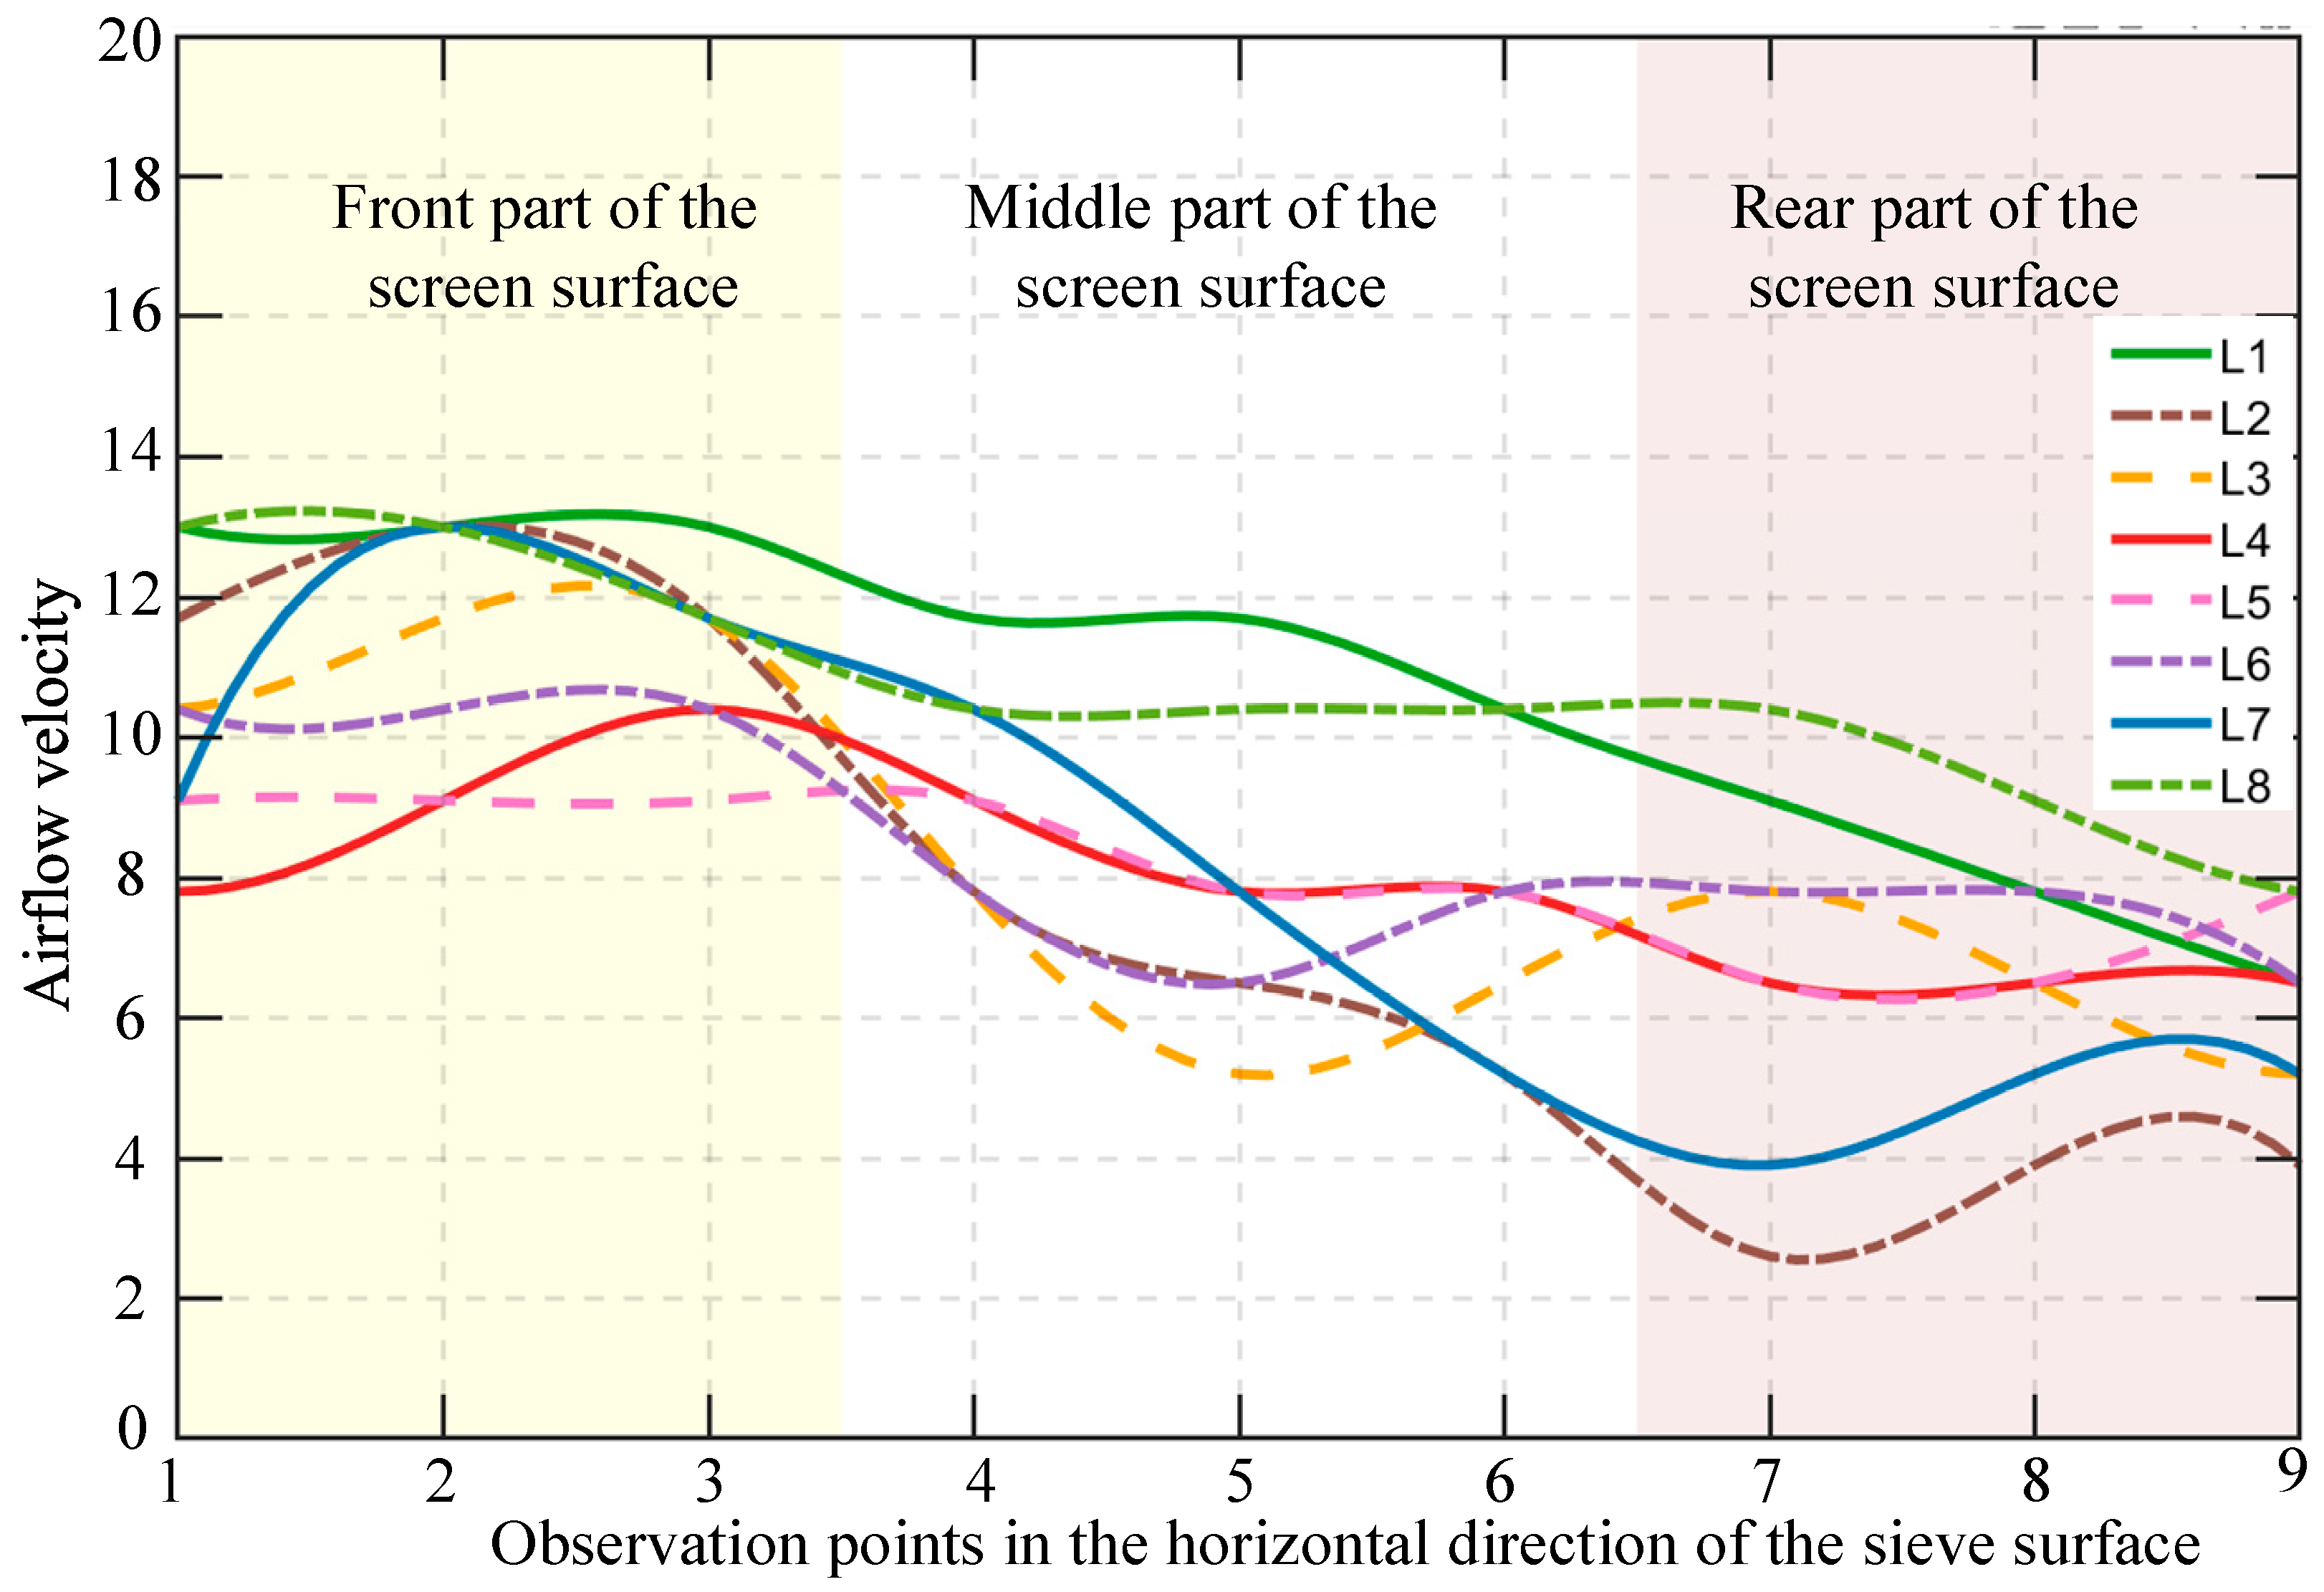
To investigate the improvement effect of this study on the airflow field structure, a simulation test was first carried out on the airflow distribution structure before improvement. In the CFD simulation, eight longitudinal measurement lines (L1 to L8) were arranged along the width of the sieve surface to extract airflow velocity data in each region. The distribution of the measurement points is shown in Figure 3. Figure 4 shows the variation of airflow velocity at each measurement point in the cleaning chamber before improvement. It can be seen from Figure 4 that the airflow velocity differences between the front and rear of the sieve along streamlines L1 to L8 are quite large, indicating that the longitudinal distribution of the airflow field in the cleaning chamber is highly non-uniform, especially with significant velocity attenuation observed at the rear of the sieve. Taking the L2 streamline, which exhibits the largest velocity difference between the front and rear of the sieve, as an example, the airflow velocity before the sieve was 13.6 m/s, while it dropped to 2.84 m/s after the sieve, resulting in an attenuation rate of 79.1%. This intuitively reflects the uneven longitudinal distribution of airflow and the trend of velocity decay. Moreover, as the length of the cleaning chamber increases, the attenuation of airflow velocity becomes more severe, which is consistent with the results of the previous theoretical analysis. As the airflow velocity decreases, the risks of light impurities falling onto the sieve surface, obstructing grain passage, and the difficulty in discharging light impurities are inevitably increased. Secondly, there was a significant difference between the average airflow velocities before and after the sieve. The average airflow velocity before the sieve was 8.14 m/s, while it decreased to 6.55 m/s after the sieve—an attenuation of approximately 20%. This indicates a noticeable decline in the overall capability of the airflow to carry light impurities (in fact, the amount of light impurities at the rear end increased considerably compared to the front), which is detrimental to impurity discharge and severely hinders the improvement of cleaning quality. This finding is consistent with the common occurrence of light impurity accumulation at the tail sieve in practical operations. From the perspective of lateral distribution, the non-uniformity coefficient of the airflow velocity before the sieve was 36.91%, while that after the sieve was 27.74%. Although the non-uniformity coefficient of the airflow velocity appears to have improved, the significant velocity attenuation after the sieve has markedly reduced the overall capacity of the airflow field to carry light impurities, thereby degrading the cleaning performance of the system and leading to an increase in the impurity content of the grains and the cleaning loss rate.

3.1.2. Analysis of the Airflow Field Structure in the Cleaning Chamber After Improvement

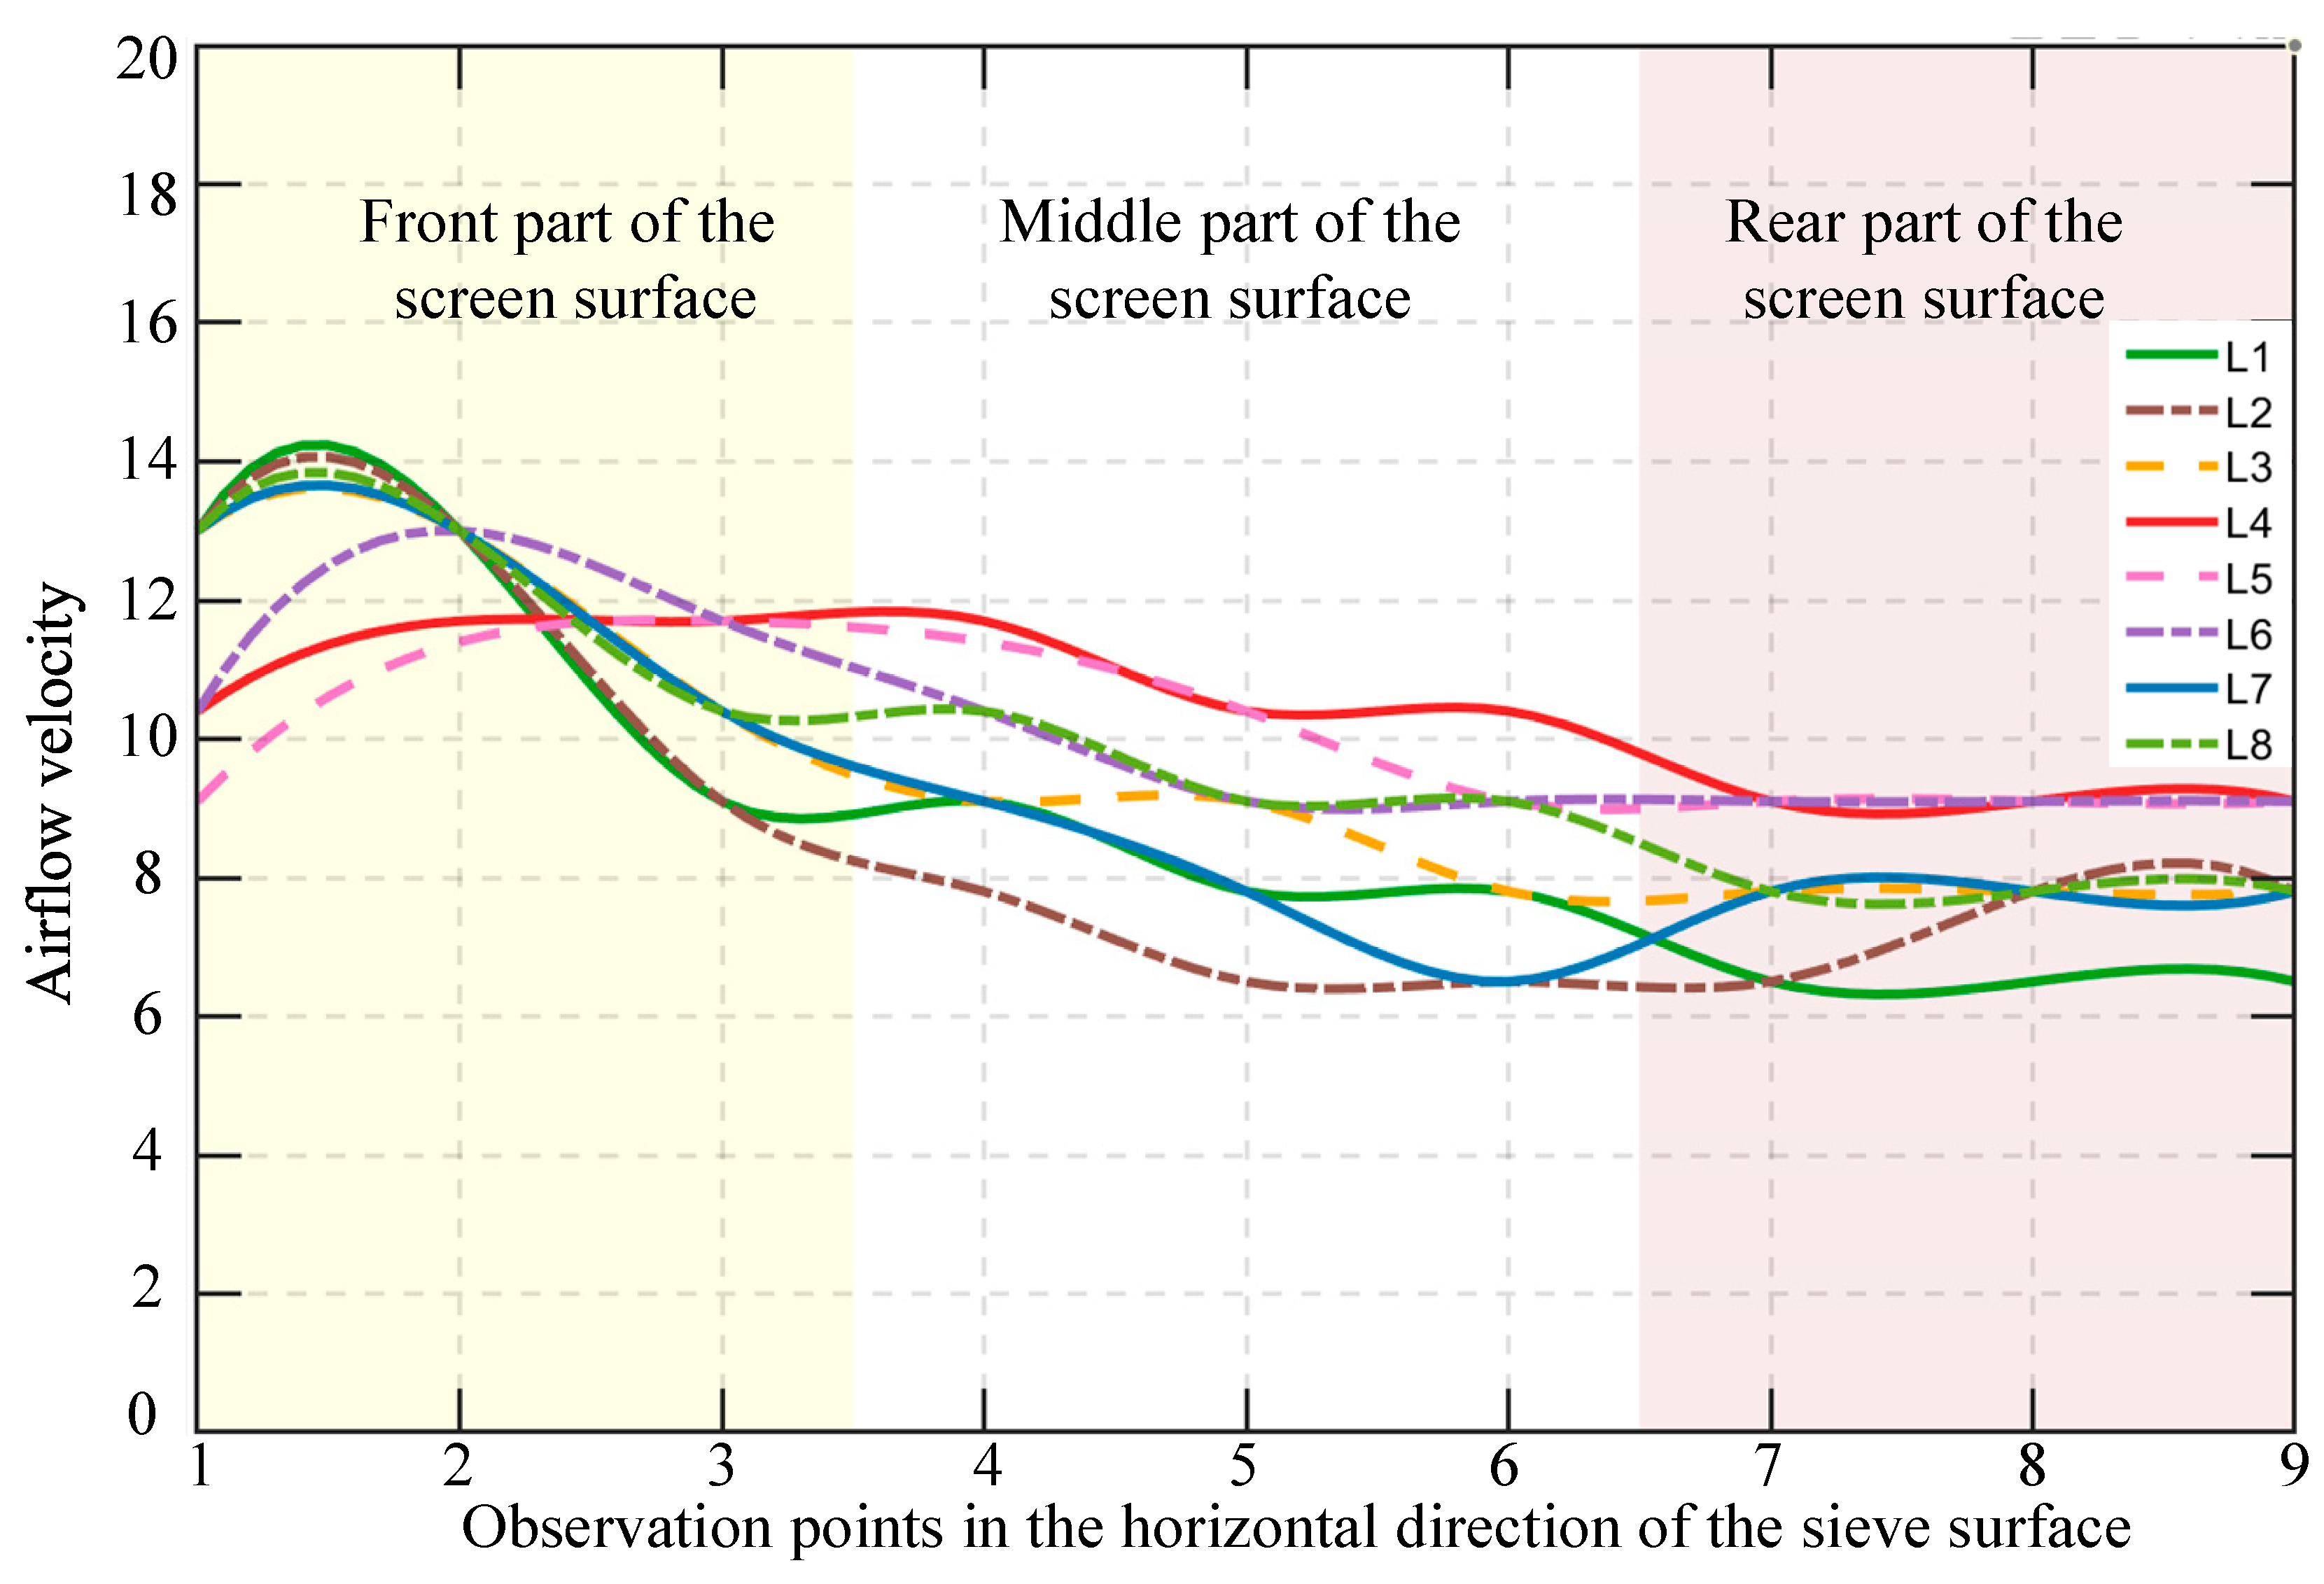
Based on the CFD simulation setup described in Section 2.3, the airflow field in the “front-blowing and rear-suction” cleaning chamber was simulated. In this configuration, the front fan parameters remained unchanged, while a rear induced draft fan operating at 2000 r/min was added to enhance the airflow at the rear of the chamber. The simulation results are shown in Figure 5. As shown in Figure 5, first, the airflow velocity differences among streamlines L1 to L8 decreased, indicating that the addition of the induced draft fan significantly increased the airflow velocity at the rear of the sieve, which is consistent with the previous theoretical findings, namely, that adding an induced draft fan at the rear of the cleaning chamber can slow down airflow attenuation. Taking streamline L2 as an example, after adding the induced draft fan, the airflow velocity at the rear of the sieve increased from 2.84 m/s to 6.45 m/s, and the attenuation ratio decreased from 79.1% to 54.3%, significantly mitigating the airflow velocity attenuation at the rear of the sieve. Second, in terms of the average airflow velocity before and after the cleaning chamber, the average airflow velocity at the front of the sieve increased after the improvement, reaching 9.06 m/s, which is more conducive to fluidizing the movement of the threshed mixture, enhancing the separation of light impurities from the mixture and their entrainment by the airflow, thereby reducing the risk of light impurities falling onto the sieve surface and increasing the probability of grain passing through the sieve in the front section. The average airflow velocity at the rear of the sieve was 8.07 m/s, which is clearly higher than the 6.55 m/s before the improvement, indicating that the longitudinal attenuation of airflow along the cleaning sieve was slowed down, thus enhancing its ability to transport and discharge light impurities. Finally, the airflow velocity at the rear of the sieve decreased by approximately 10.9% compared to the front, which is nearly half of the 20% attenuation observed before the improvement, demonstrating the effectiveness of the improved structure. Moreover, in terms of the transverse airflow velocity distribution, the non-uniformity coefficient of airflow velocity before the sieve was 27.86%, a significant improvement from the 36.91% before the improvement, while the coefficient after the sieve was 11.37%, which also showed a substantial improvement from the 27.74% before the improvement, indicating that the longitudinal attenuation of airflow in the cleaning chamber was significantly mitigated, greatly improving the overall uniformity of the airflow field structure in the cleaning chamber. In addition, the simulation results revealed that for the front airflow, the maximum airflow velocity difference was 6.13 m/s before the improvement and 5.21 m/s after the improvement; for the rear airflow, the maximum velocity difference was 6.85 m/s before the improvement and 2.6 m/s after the improvement, indicating that the airflow velocity consistency was not only improved at the rear, but also at the front section of the sieve.
In conclusion, the improvement showed outstanding results. The airflow velocity before the sieve increased, and its uniformity was improved. This not only helped the threshed materials to become fluidized and loosened but also enhanced the separation of light impurities from the threshed materials. Moreover, due to the increased airflow velocity, the capacity to carry and transport light impurities was improved. The uniformity of airflow velocity in the middle section was significantly improved, ensuring the stability of light impurity transport and reducing the risk of light impurities falling onto the sieve surface and hindering grain separation; the airflow velocity at the rear section was increased, and its uniformity was also significantly improved, enhancing the ability to carry and discharge light impurities, which contributed to the improvement of cleaning quality.

3.2. Simulation and Optimization Analysis of Induced Draft Fan

Based on the verified effectiveness of the system improvement, single-factor tests were conducted to examine the influence of induced draft fan speed and horizontal/vertical installation positions on airflow uniformity within the cleaning chamber, aiming to determine the optimal parameter configuration for the front-blowing and rear-suction combined cleaning system.

3.2.1. Effect of Induced Draft Fan Speed on the Airflow Field in the Cleaning Chamber

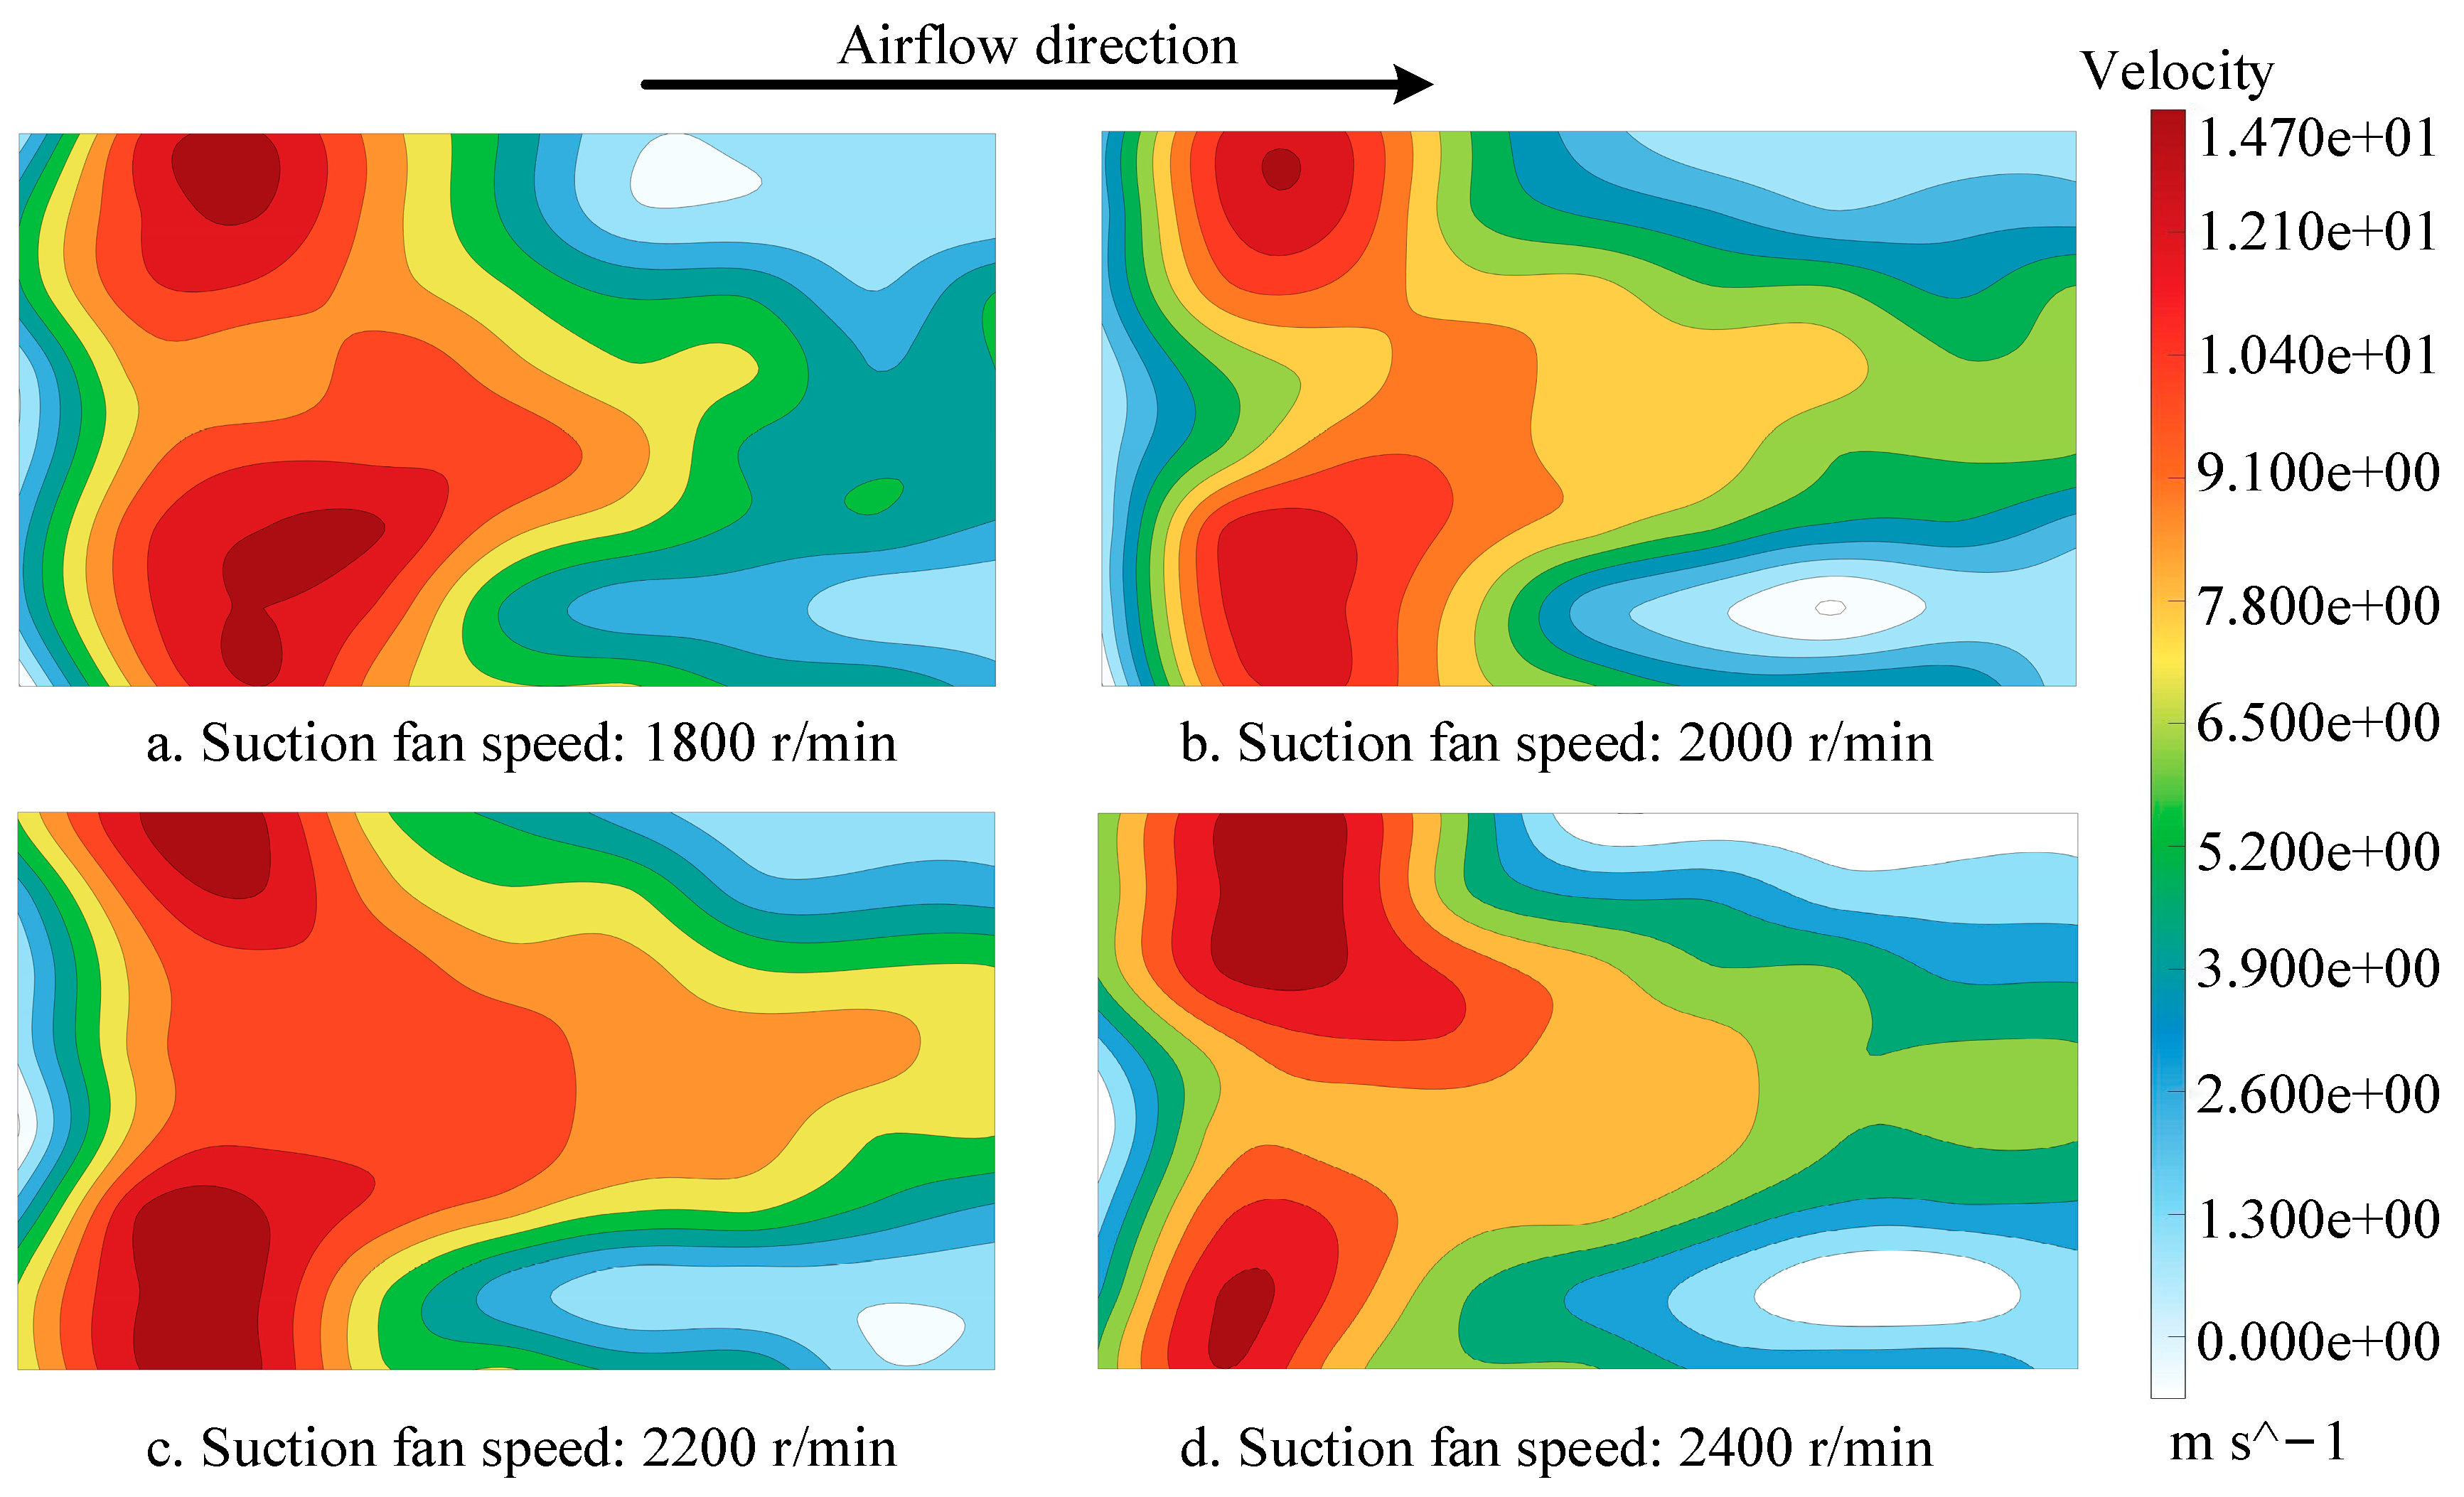
In order to investigate the influence of the induced draft fan speed on the airflow field structure in the cleaning chamber after structural improvement, a simulation test was conducted under varying rotational speeds of the induced draft fan. The test conditions were as follows: the speed of the front centrifugal fan and the vertical and horizontal installation positions were kept constant, with the front fan speed set at 1050 r/min, the vertical installation height at 50 mm, and the horizontal installation distance at 250 mm. The rotational speed of the induced draft fan was set to 1800 r/min, 2000 r/min, 2200 r/min, and 2400 r/min, respectively. For each selected speed, CFD numerical simulations of the airflow field were performed. The airflow distribution cloud diagrams are shown in Figure 6 and Figure 7.
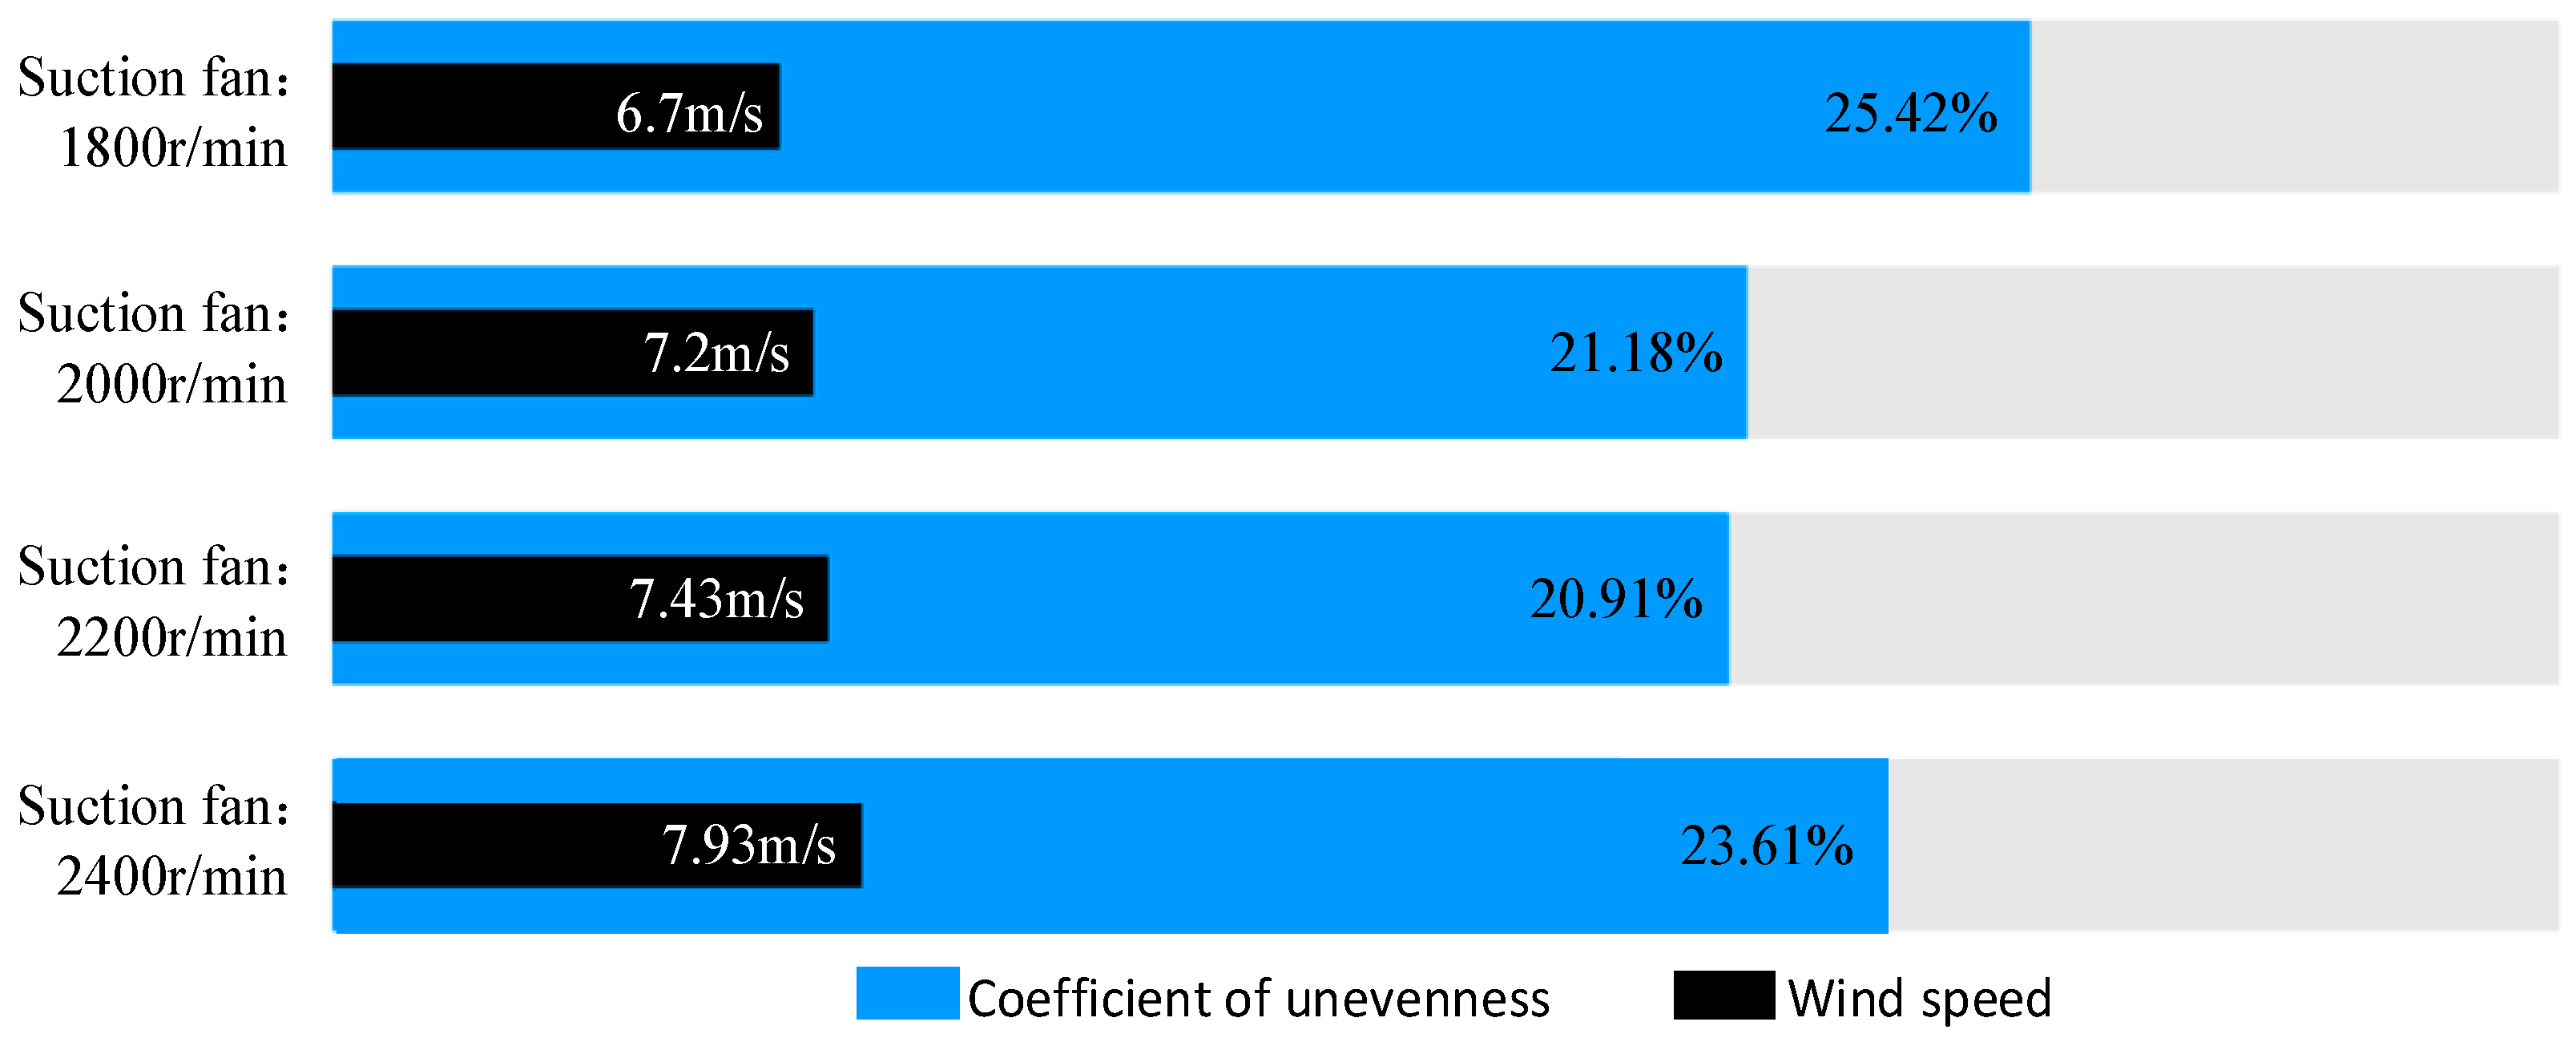
As shown in Figure 6a, when the induced draft fan operates at a speed of 1800 r/min, the airflow velocity in the front region of the sieve is the highest in the entire airflow field, which is favorable for separating and transporting light impurities from the threshed mixture. However, due to the longitudinal attenuation of airflow, the airflow velocity at the rear of the sieve significantly decreases. According to Figure 7, the average airflow velocity behind the sieve is only 6.7 m/s, and the airflow non-uniformity coefficient reaches 25.42%, indicating that the airflow has a limited capacity to carry and discharge light impurities.
As shown in Figure 6b,c, when the induced draft fan operates at speeds of 2000 r/min and 2200 r/min, the airflow velocity at the front of the sieve remains the highest in the entire airflow field, which is favorable for separating and transporting light impurities from the threshed mixture. However, due to the influence of the rear induced airflow, the airflow velocity in the central region along the width of the cleaning chamber is significantly increased, meeting the cleaning requirements of the central sieve area where the load is concentrated during operation. Moreover, the increased airflow velocity in the middle section improves the overall velocity uniformity of the airflow field in the cleaning chamber. In particular, the non-uniformity coefficients of the airflow velocity behind the sieve are reduced to 21.18% and 20.91%, respectively (see Figure 7), which is beneficial for the transport and discharge of light impurities.
According to Figure 6d, when the induced draft fan speed is 2400 r/min, the airflow velocity in the front and middle parts of the sieve surface is still high, which is conducive to the separation of materials in the front and the entrainment of light impurities, but a low-velocity region appears in the rear part of the sieve, where the local wind speed is relatively low, causing the non-uniformity coefficient of airflow velocity to rise to 23.61%. Local turbulence and velocity fluctuation reduce the stability of airflow in the rear part of the sieve, thus weakening the smooth transportation and discharge capacity of impurities in the rear region.
In summary, the rotational speed of the induced draft fan improves both the airflow attenuation at the rear of the cleaning chamber and the non-uniformity coefficient of airflow velocity. However, when the speed reaches 2400 r/min, the non-uniformity coefficient increases. Therefore, the preliminary selection for the induced draft fan speed is 2000–2400 r/min, which can achieve the goal of delaying airflow attenuation and reducing the non-uniformity coefficient of airflow velocity at the rear of the sieve.

3.2.2. Influence of the Vertical Installation Position of the Induced Draft Fan on the Airflow Field in the Cleaning Chamber

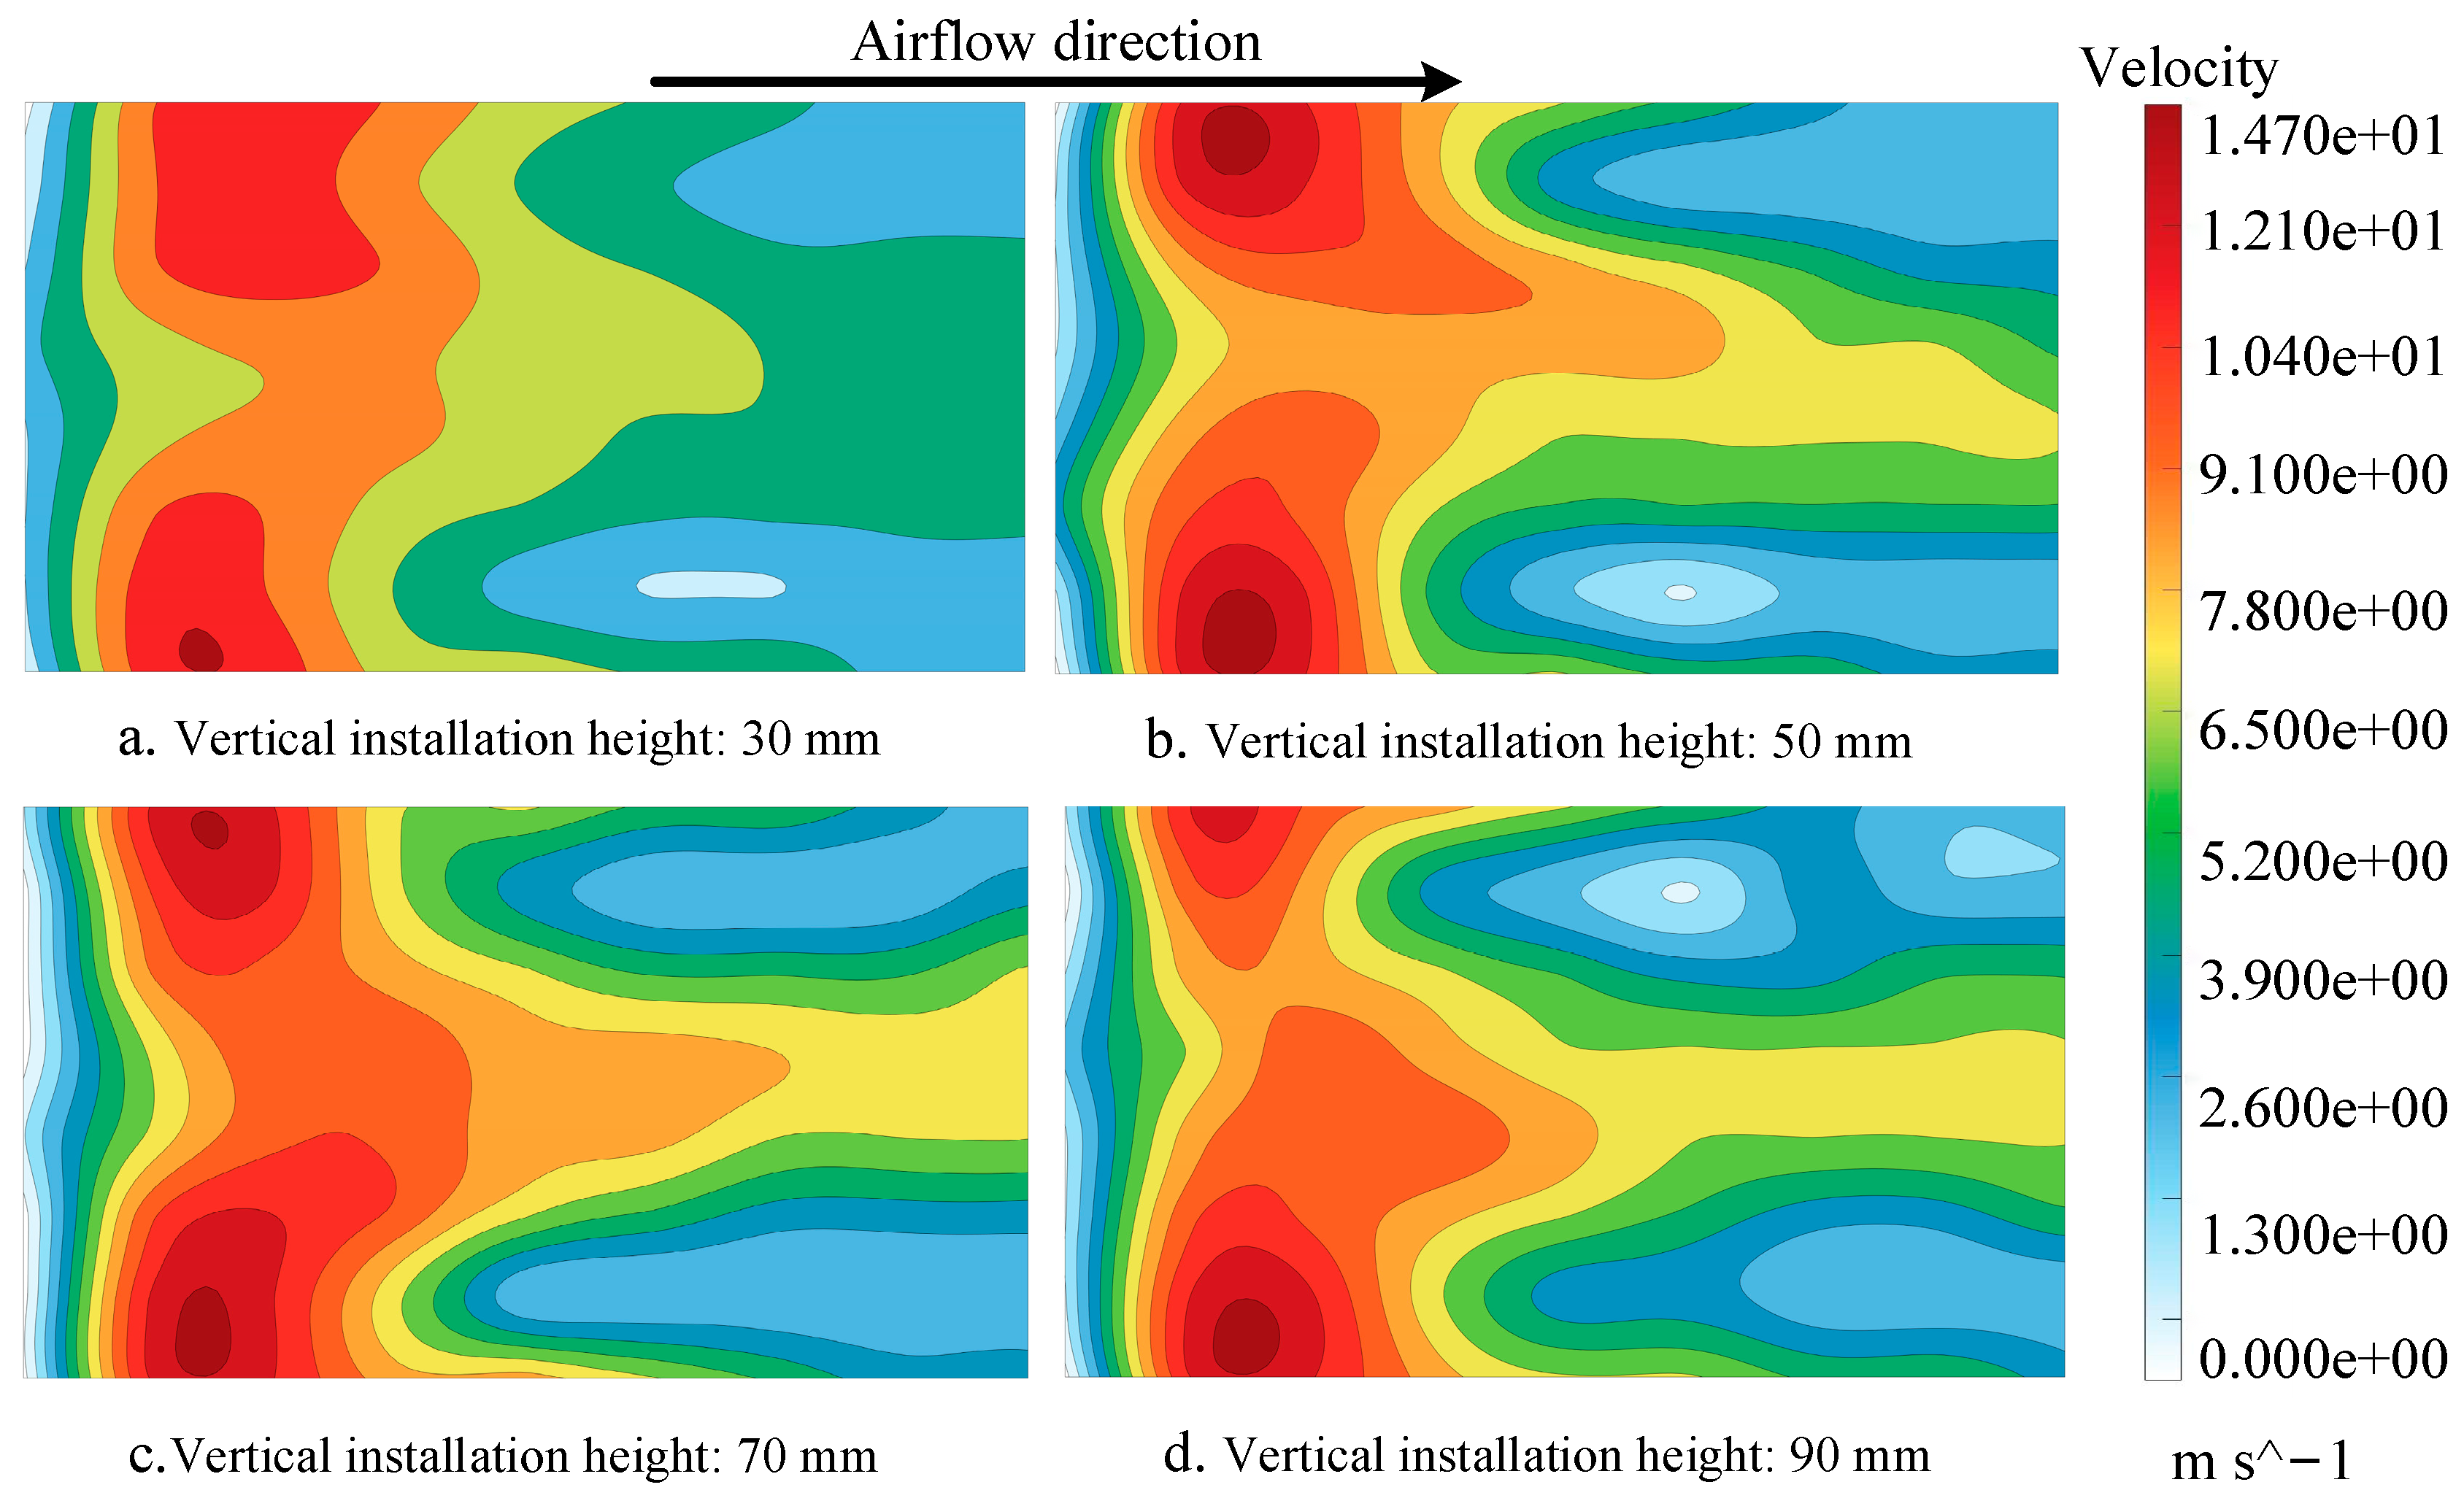
To investigate the effect of the installation position of the induced draft fan on the airflow velocity distribution, tests were conducted to analyze the influence of the fan’s vertical installation position on the airflow uniformity in the cleaning chamber. Under the condition that the parameters of the front fan remained unchanged, the vertical installation position of the rear fan was adjusted to 30 mm, 50 mm, 70 mm, and 90 mm, while all other operating parameters were kept constant. The results are shown in Figure 8 and Figure 9.
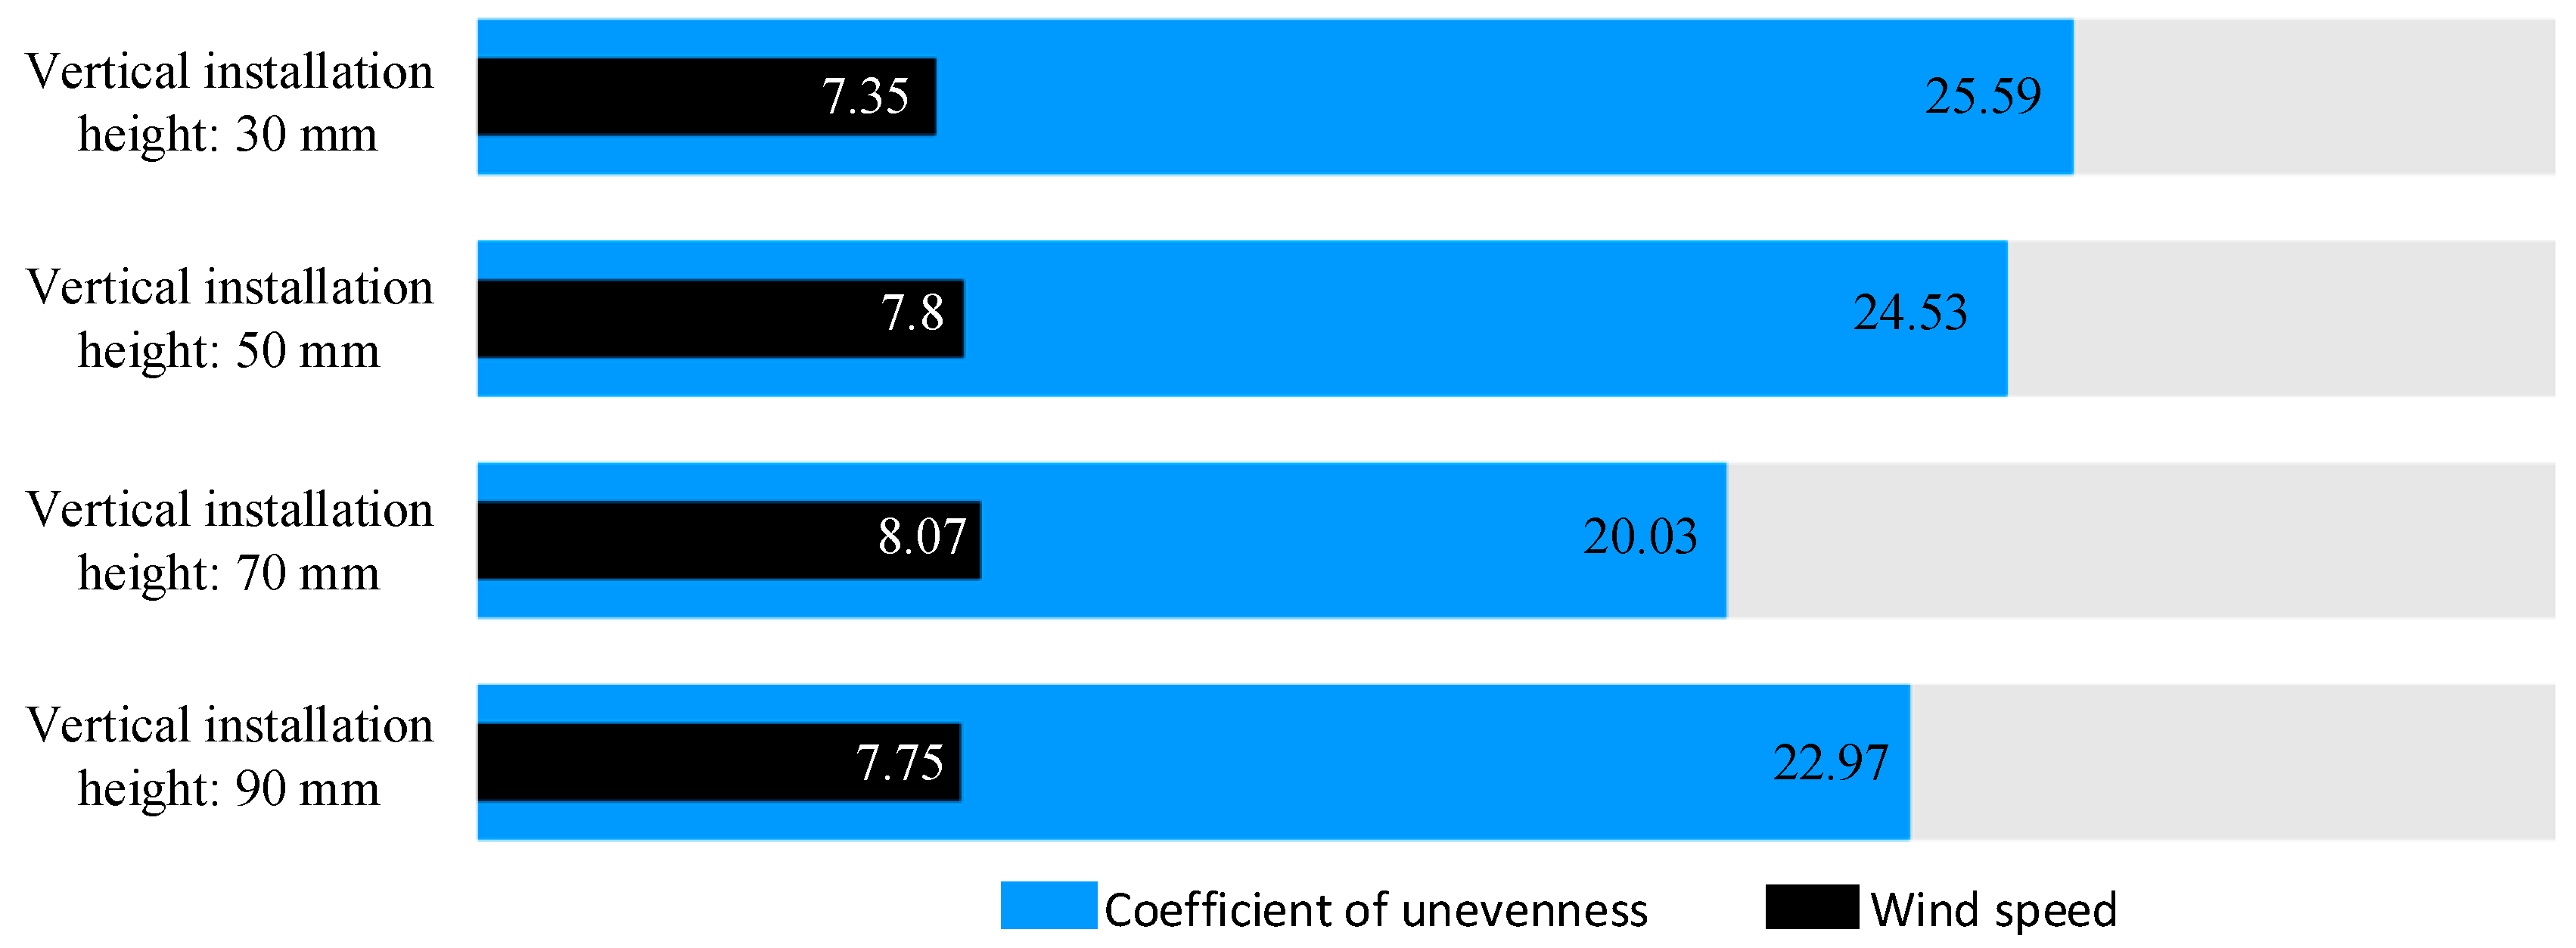
As shown in Figure 8a, when the vertical installation position of the induced draft fan is 30 mm, the high-speed airflow region is concentrated near the inlet, with limited extension toward the middle and rear sections. Low-speed regions are widely distributed in the middle and rear parts, resulting in a distinct velocity gradient. At this time, the average airflow velocity at the rear of the sieve is 7.35 m/s, and the airflow non-uniformity coefficient is 25.59% (Figure 9). The airflow is overly concentrated, which is unfavorable for forming a stable and effective airflow field for the discharge of light impurities at the rear sieve section.
As shown in Figure 8b, when the vertical installation position of the induced draft fan is 50 mm, the airflow velocity coverage in the middle and front regions of the cleaning chamber is enhanced, and the high-speed area slightly shifts forward, reducing the airflow difference between the front and rear sections. At this point, the average airflow velocity at the rear of the sieve is 7.80 m/s, and the non-uniformity coefficient decreases to 24.53% (Figure 9), indicating that the airflow field structure has been somewhat optimized, which is conducive to forming a stable and effective airflow field for light impurity discharge at the rear sieve section.
As shown in Figure 8c, when the vertical installation position of the induced draft fan is 70 mm, the overall airflow velocity within the cleaning chamber increases, and the coverage of the high-speed zone expands further. The airflow velocity distribution across the front, middle, and rear regions of the sieve becomes more uniform. At this point, the average airflow velocity at the rear of the sieve reaches 8.07 m/s, and the non-uniformity coefficient decreases to 20.03% (Figure 9), indicating that the airflow field structure is further improved, which facilitates the formation of a stable and effective airflow structure for discharging light impurities at the rear sieve section.
As shown in Figure 8d, when the vertical installation position of the induced draft fan is 90 mm, the airflow velocity in some local areas at the rear end of the cleaning chamber slightly decreases, with low-velocity zones emerging. The high-speed airflow region shifts upward, resulting in slightly insufficient suction at the front part. At this time, the average airflow velocity at the rear of the sieve is 7.75 m/s, and the non-uniformity coefficient is 22.97% (Figure 9). Although the overall airflow field still maintains a certain level of uniformity, the distribution trend shows intensified local fluctuations, which is unfavorable for forming a stable and effective airflow structure for discharging light impurities at the rear sieve section.
In summary, the vertical installation height of the induced draft fan has a significant impact on the airflow velocity distribution and uniformity within the cleaning chamber. Appropriately increasing the installation height can enhance airflow coverage in the front and middle regions, improving both the extension and uniformity of airflow. However, when the vertical position is increased to 90 mm, the airflow velocity in the rear sieve region weakens slightly, and the stability of the airflow field decreases. Therefore, the vertical installation height of the induced draft fan should be controlled within the range of 50–90 mm to ensure overall airflow velocity while effectively improving airflow field uniformity, thereby meeting the cleaning operation’s requirements for separating and discharging light impurities.

3.2.3. Influence of the Horizontal Distance Between the Induced Draft Fan and the Sieve Surface on the Airflow Field in the Cleaning Chamber

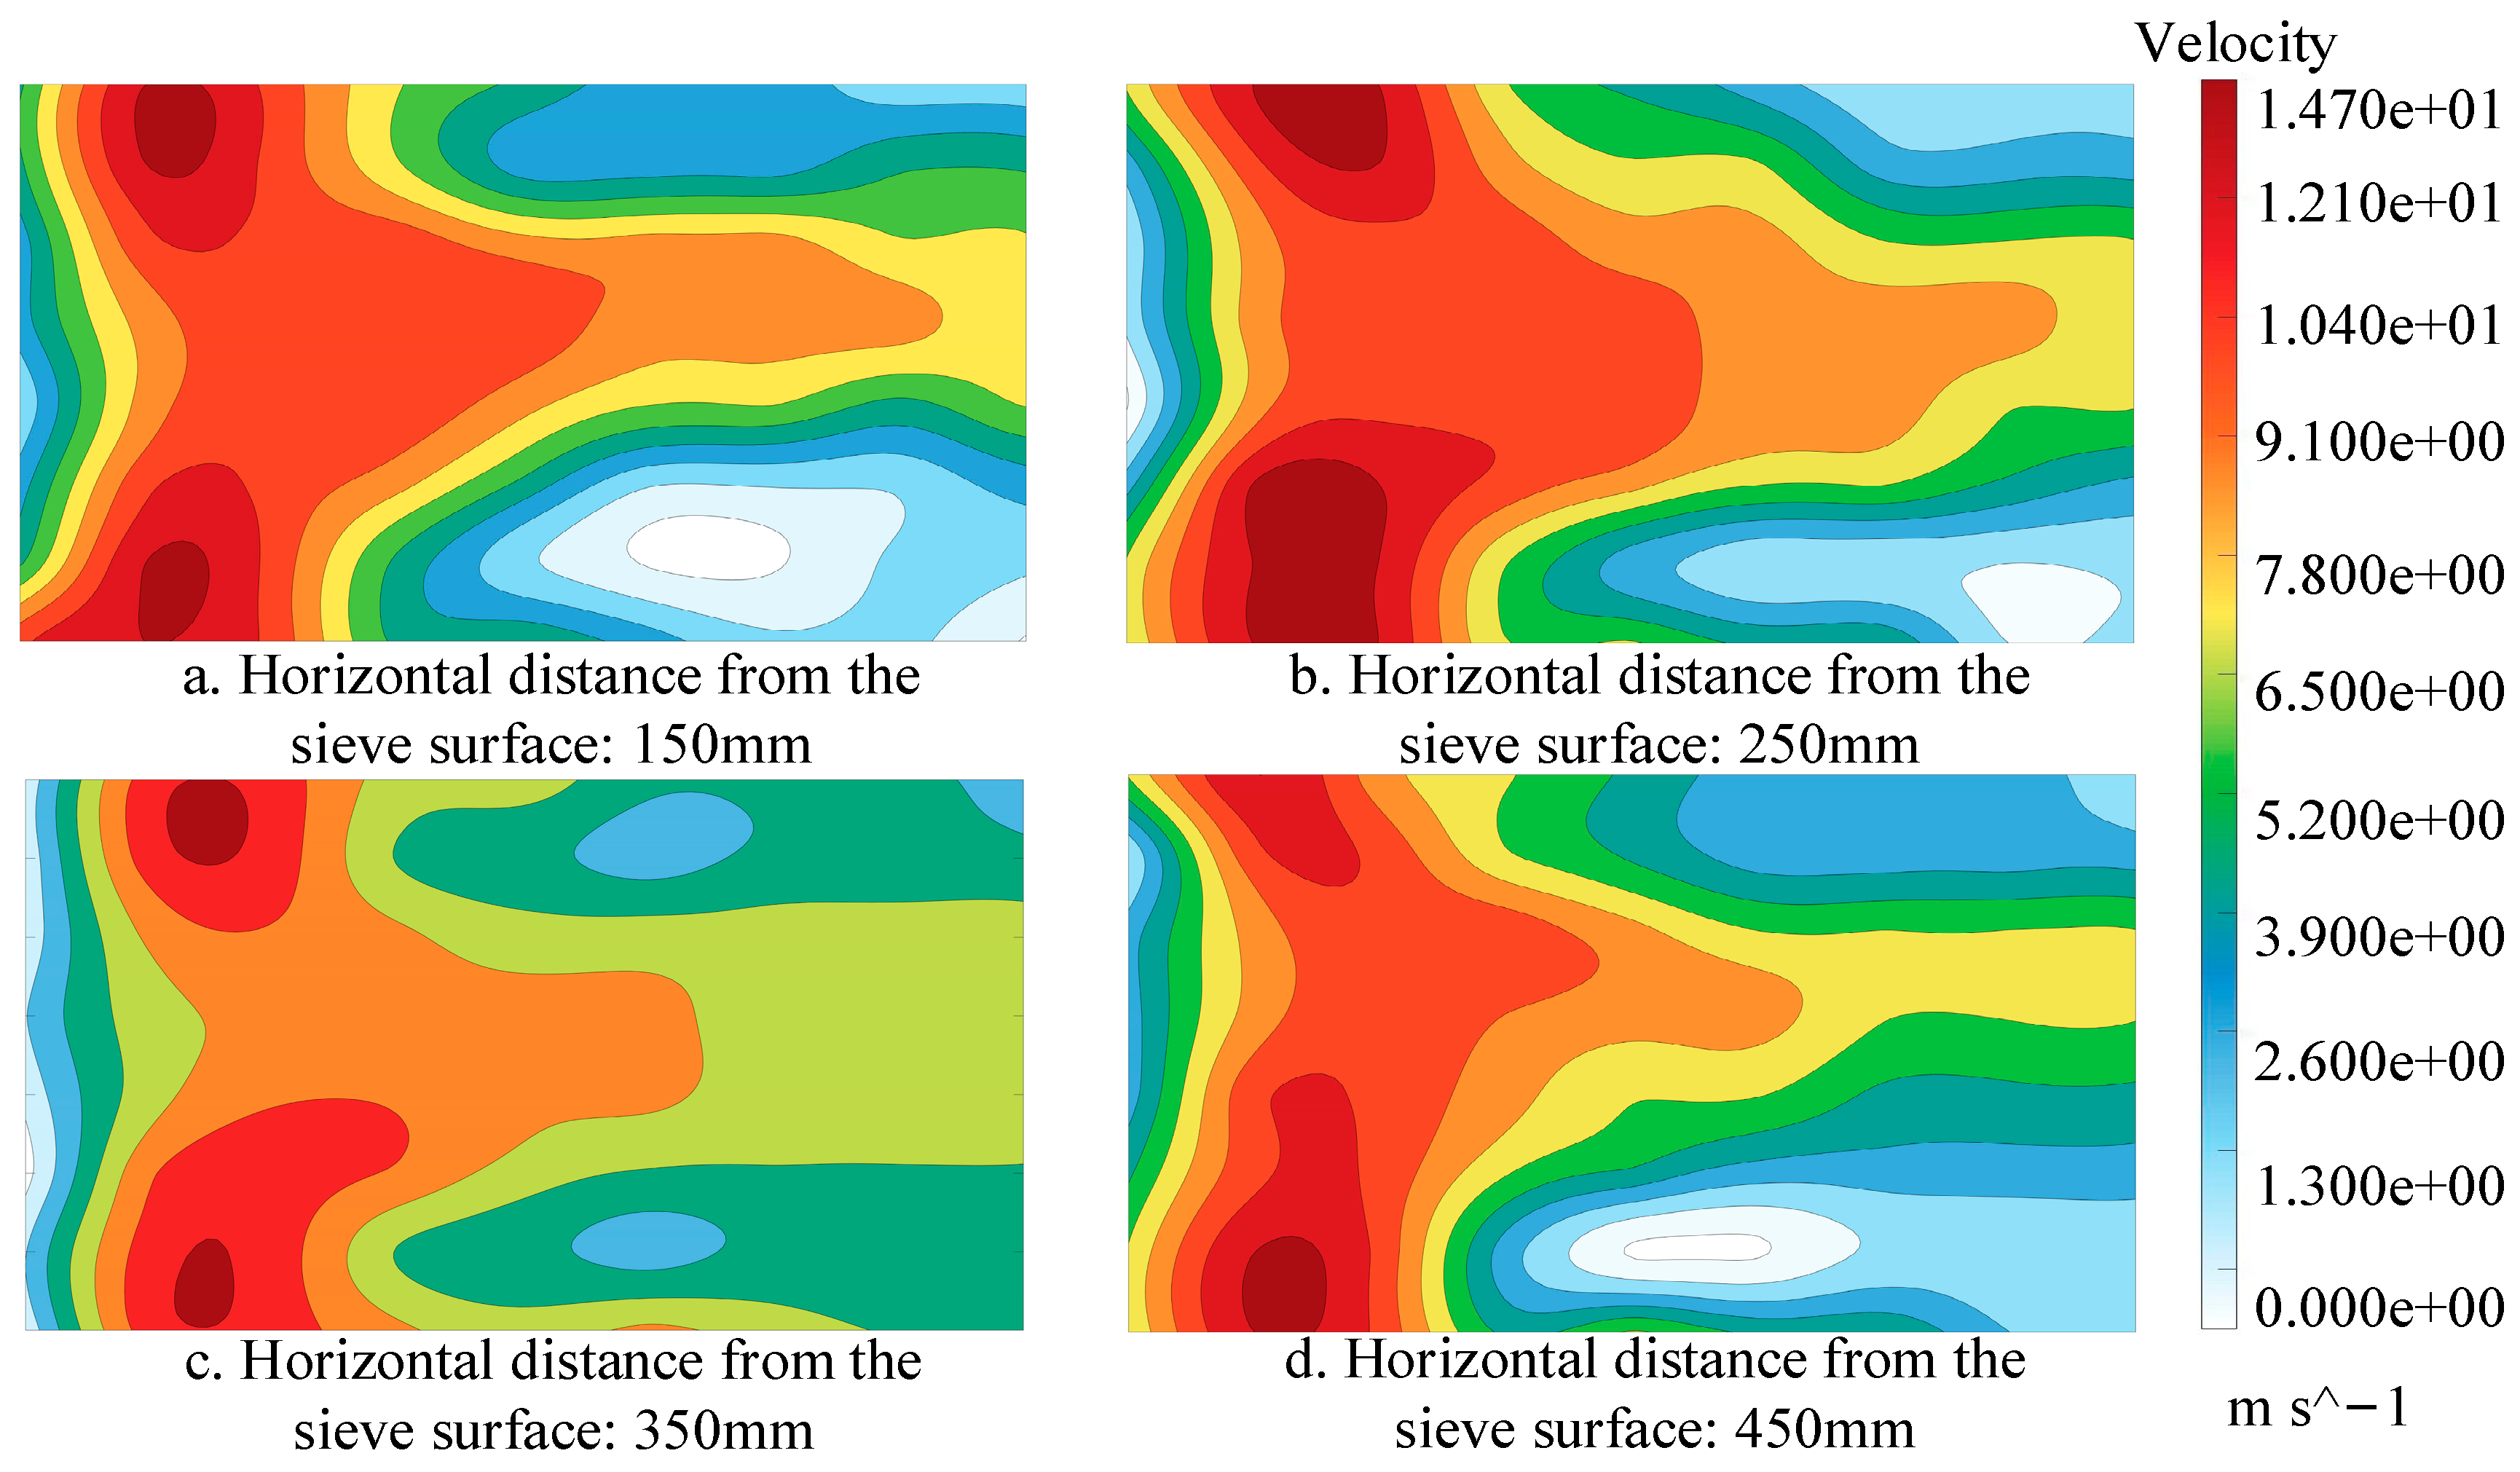
Considering that the horizontal distance between the induced draft fan and the sieve surface significantly affects the suction airflow distribution in the rear region of the cleaning chamber and the discharge capacity of light impurities, in order to minimize the interference of the horizontal position of the induced draft fan on the stability of the airflow field, a simulation test was carried out on the airflow distribution law in the cleaning chamber under different horizontal installation distances of the induced draft fan. In this test, the parameters of the front-blowing fan were kept unchanged, and the horizontal installation distances were set to 150 mm, 250 mm, 350 mm, and 450 mm, while other operating parameters remained the same. The simulation results are shown in Figure 10 and Figure 11.
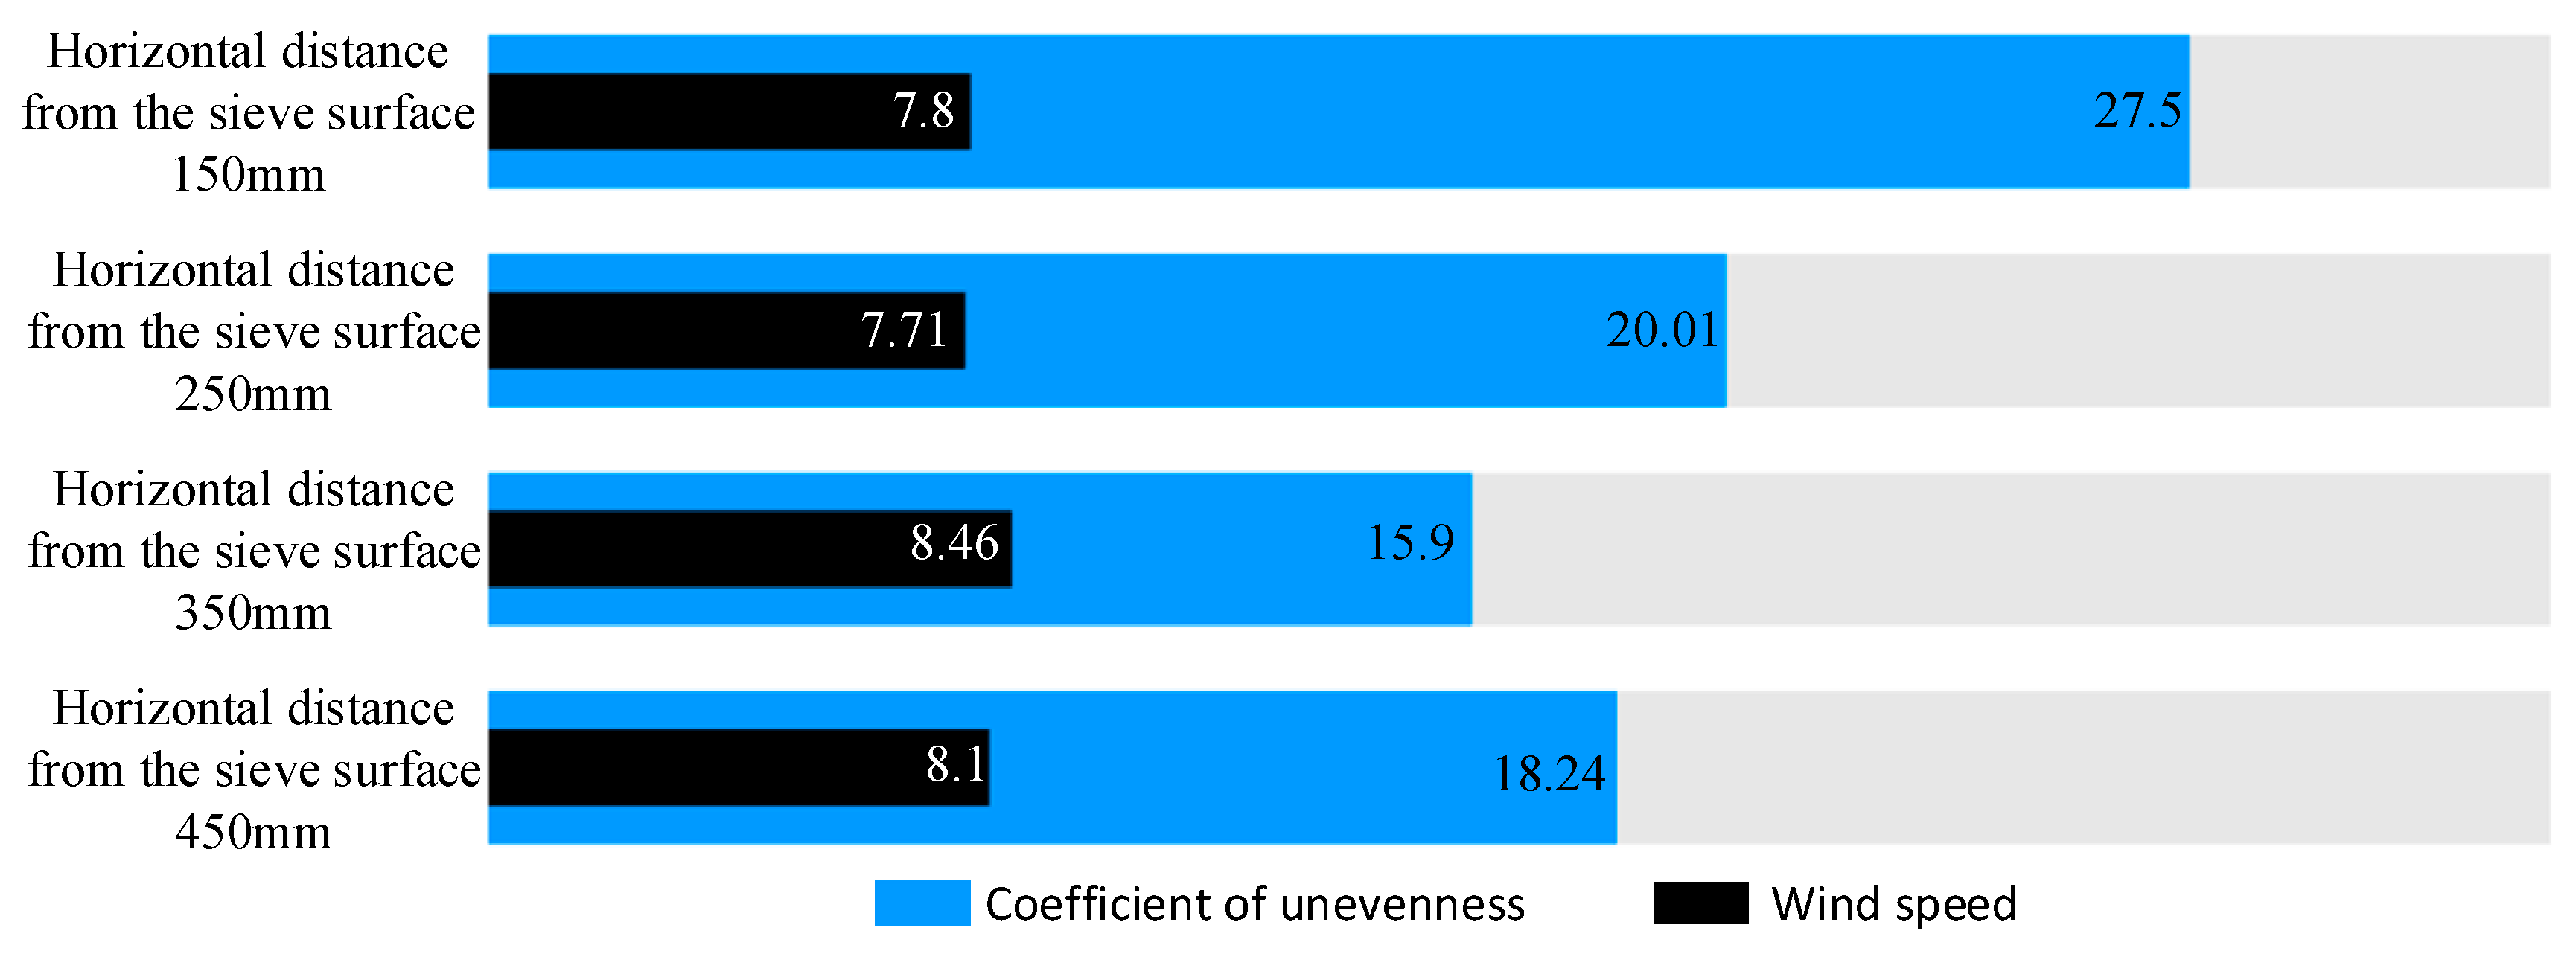
As shown in Figure 10a, when the horizontal installation distance of the induced draft fan is 150 mm, the airflow velocity distribution behind the sieve is significantly uneven, with large low-speed regions present on both sides of the sieve surface. The overall airflow exhibits a pronounced “convergence” characteristic. At this point, the average airflow velocity at the rear of the sieve surface is 7.8 m/s, and the non-uniformity coefficient reaches as high as 27.5% (Figure 11), indicating that the fan is too close to the sieve surface. This results in a limited effective suction range behind the sieve, making it difficult to form a continuous and stable airflow channel, which is unfavorable for the consistent conveyance and discharge of light impurities at the rear.
As shown in Figure 10b, when the horizontal installation distance of the induced draft fan is increased to 250 mm, the airflow velocity distribution behind the sieve is significantly improved compared to the 150 mm condition. The low-velocity zones are reduced, and the coverage area of the stable airflow region is expanded. At this point, the average airflow velocity behind the sieve is 7.71 m/s, and the non-uniformity coefficient decreases to 20.01% (Figure 11), indicating that appropriately increasing the horizontal installation distance helps expand the suction effect area behind the sieve, improves airflow continuity and stability, and is beneficial for the consistent conveyance and discharge of light impurities at the rear.
As shown in Figure 10c, when the horizontal installation distance of the induced draft fan is increased to 350 mm, the airflow velocity distribution behind the sieve is further optimized. The high-velocity region is significantly expanded, low-velocity zones are virtually eliminated, and the velocity transition is smooth, resulting in the most uniform airflow field. At this point, the average airflow velocity behind the sieve reaches 8.46 m/s (Figure 11), the highest among the four test conditions, and the non-uniformity coefficient is also the lowest, at only 15.9%. This indicates that this installation position forms a strong and uniform suction region in the area behind the sieve, making it most favorable for the transport and discharge of light impurities.
As shown in Figure 10d, when the horizontal installation distance of the induced draft fan increases to 450 mm, the airflow field behind the sieve still maintains relatively good uniformity overall; however, the high-velocity region shows a tendency to shrink, and low-velocity zones appear in some edge areas. At this point, the average airflow velocity behind the sieve is 8.10 m/s, and the non-uniformity coefficient rises to 18.24% (Figure 11). This indicates that when the horizontal installation distance becomes too large, although the suction coverage area behind the sieve remains wide, the suction distribution tends to diverge, which may reduce the ability to carry and discharge light impurities.
In summary, the horizontal installation distance of the induced draft fan has a significant impact on the airflow distribution characteristics behind the sieve in the cleaning chamber. As the installation distance increases, the airflow distribution tends to become more uniform, and the airflow velocity increases steadily. When the distance exceeds 350 mm and continues to increase to 450 mm, the overall airflow coverage remains good; however, slight velocity fluctuations appear in some rear regions, resulting in a slight decline in uniformity. Considering both the suction capacity behind the sieve and the requirements for the non-uniformity coefficient, the horizontal installation distance of the induced draft fan should be maintained within the range of 250–450 mm to ensure airflow field stability and improve the effective discharge capacity of light impurities.

3.3. Structural Parameter Optimization of the Induced Draft Fan Cleaning Device

3.3.1. Experimental Design

To address the influence of multiple parameters of the induced draft fan on the airflow uniformity behind the sieve in the cleaning chamber, and based on the results of the single-factor experiments described above, a three-factor three-level orthogonal optimization test for the front-blowing and rear-suction combined cleaning technology was designed using Design-Expert 13 software. The test factors were the rotational speed of the induced draft fan (A), the vertical installation position of the induced draft fan (B), and the horizontal installation distance of the induced draft fan (C), with the level codes of each factor shown in Table 2. The airflow non-uniformity coefficient at the rear section (Y) was selected as the evaluation index. The test scheme and results are shown in Table 3. Each test was repeated three times, and the average value was taken as the final result.

3.3.2. Analysis of Experimental Results

According to the experimental results in Table 3, a regression equation was established between the airflow non-uniformity coefficient at the rear of the screen and each factor.
Y = 292.26563 0.189024 A 0.821612 B 13.87375 C + 0.028750 B C + 0.000039 A 2 + 0.003170 B 2 + 0.928000 C 2
The significance test of the regression model was conducted, and the results are shown in Table 4. As seen in Table 4, the P-value of the model for the airflow non-uniformity coefficient at the rear of the sieve surface was less than 0.001, indicating that the regression model was highly significant. The coefficient of determination ( R 2 ) was 0.9845, indicating that the variation in the response value could be well explained by the model Y . The p-value of the lack-of-fit was 0.9018, which is greater than 0.05, suggesting that the experimental error was very small and the model was reasonable. Therefore, the model Y can be used to predict the variation trend of the airflow non-uniformity coefficient at the rear of the sieve surface.
According to the F-values, the influence of the induced draft fan operating parameters on the airflow non-uniformity coefficient at the rear part of the sieve surface can be determined. The order of the factors affecting the airflow non-uniformity coefficient at the rear part of the sieve surface is as follows: fan speed > vertical installation position of the induced draft fan > horizontal distance from the sieve surface.

3.3.3. Parameter Optimization and Experimental Verification

Based on the established response surface regression model, a mathematical relationship was derived between the airflow non-uniformity coefficient at the rear section of the screen surface and the selected influencing parameters. The model was statistically validated through analysis of variance, and the results confirmed a high degree of fit and strong predictive reliability. Subsequently, multi-objective optimization was performed with the goal of minimizing the airflow non-uniformity coefficient. The optimal combination of parameters was determined as follows: an induced draft fan rotational speed of 2275 r/min, a vertical installation height of 72.5 mm, and a horizontal installation distance of 385 mm from the screen surface. Under this configuration, the airflow non-uniformity coefficient in the rear region of the screen surface was reduced to 10.7%, indicating a significant improvement in the uniformity and stability of the airflow field.
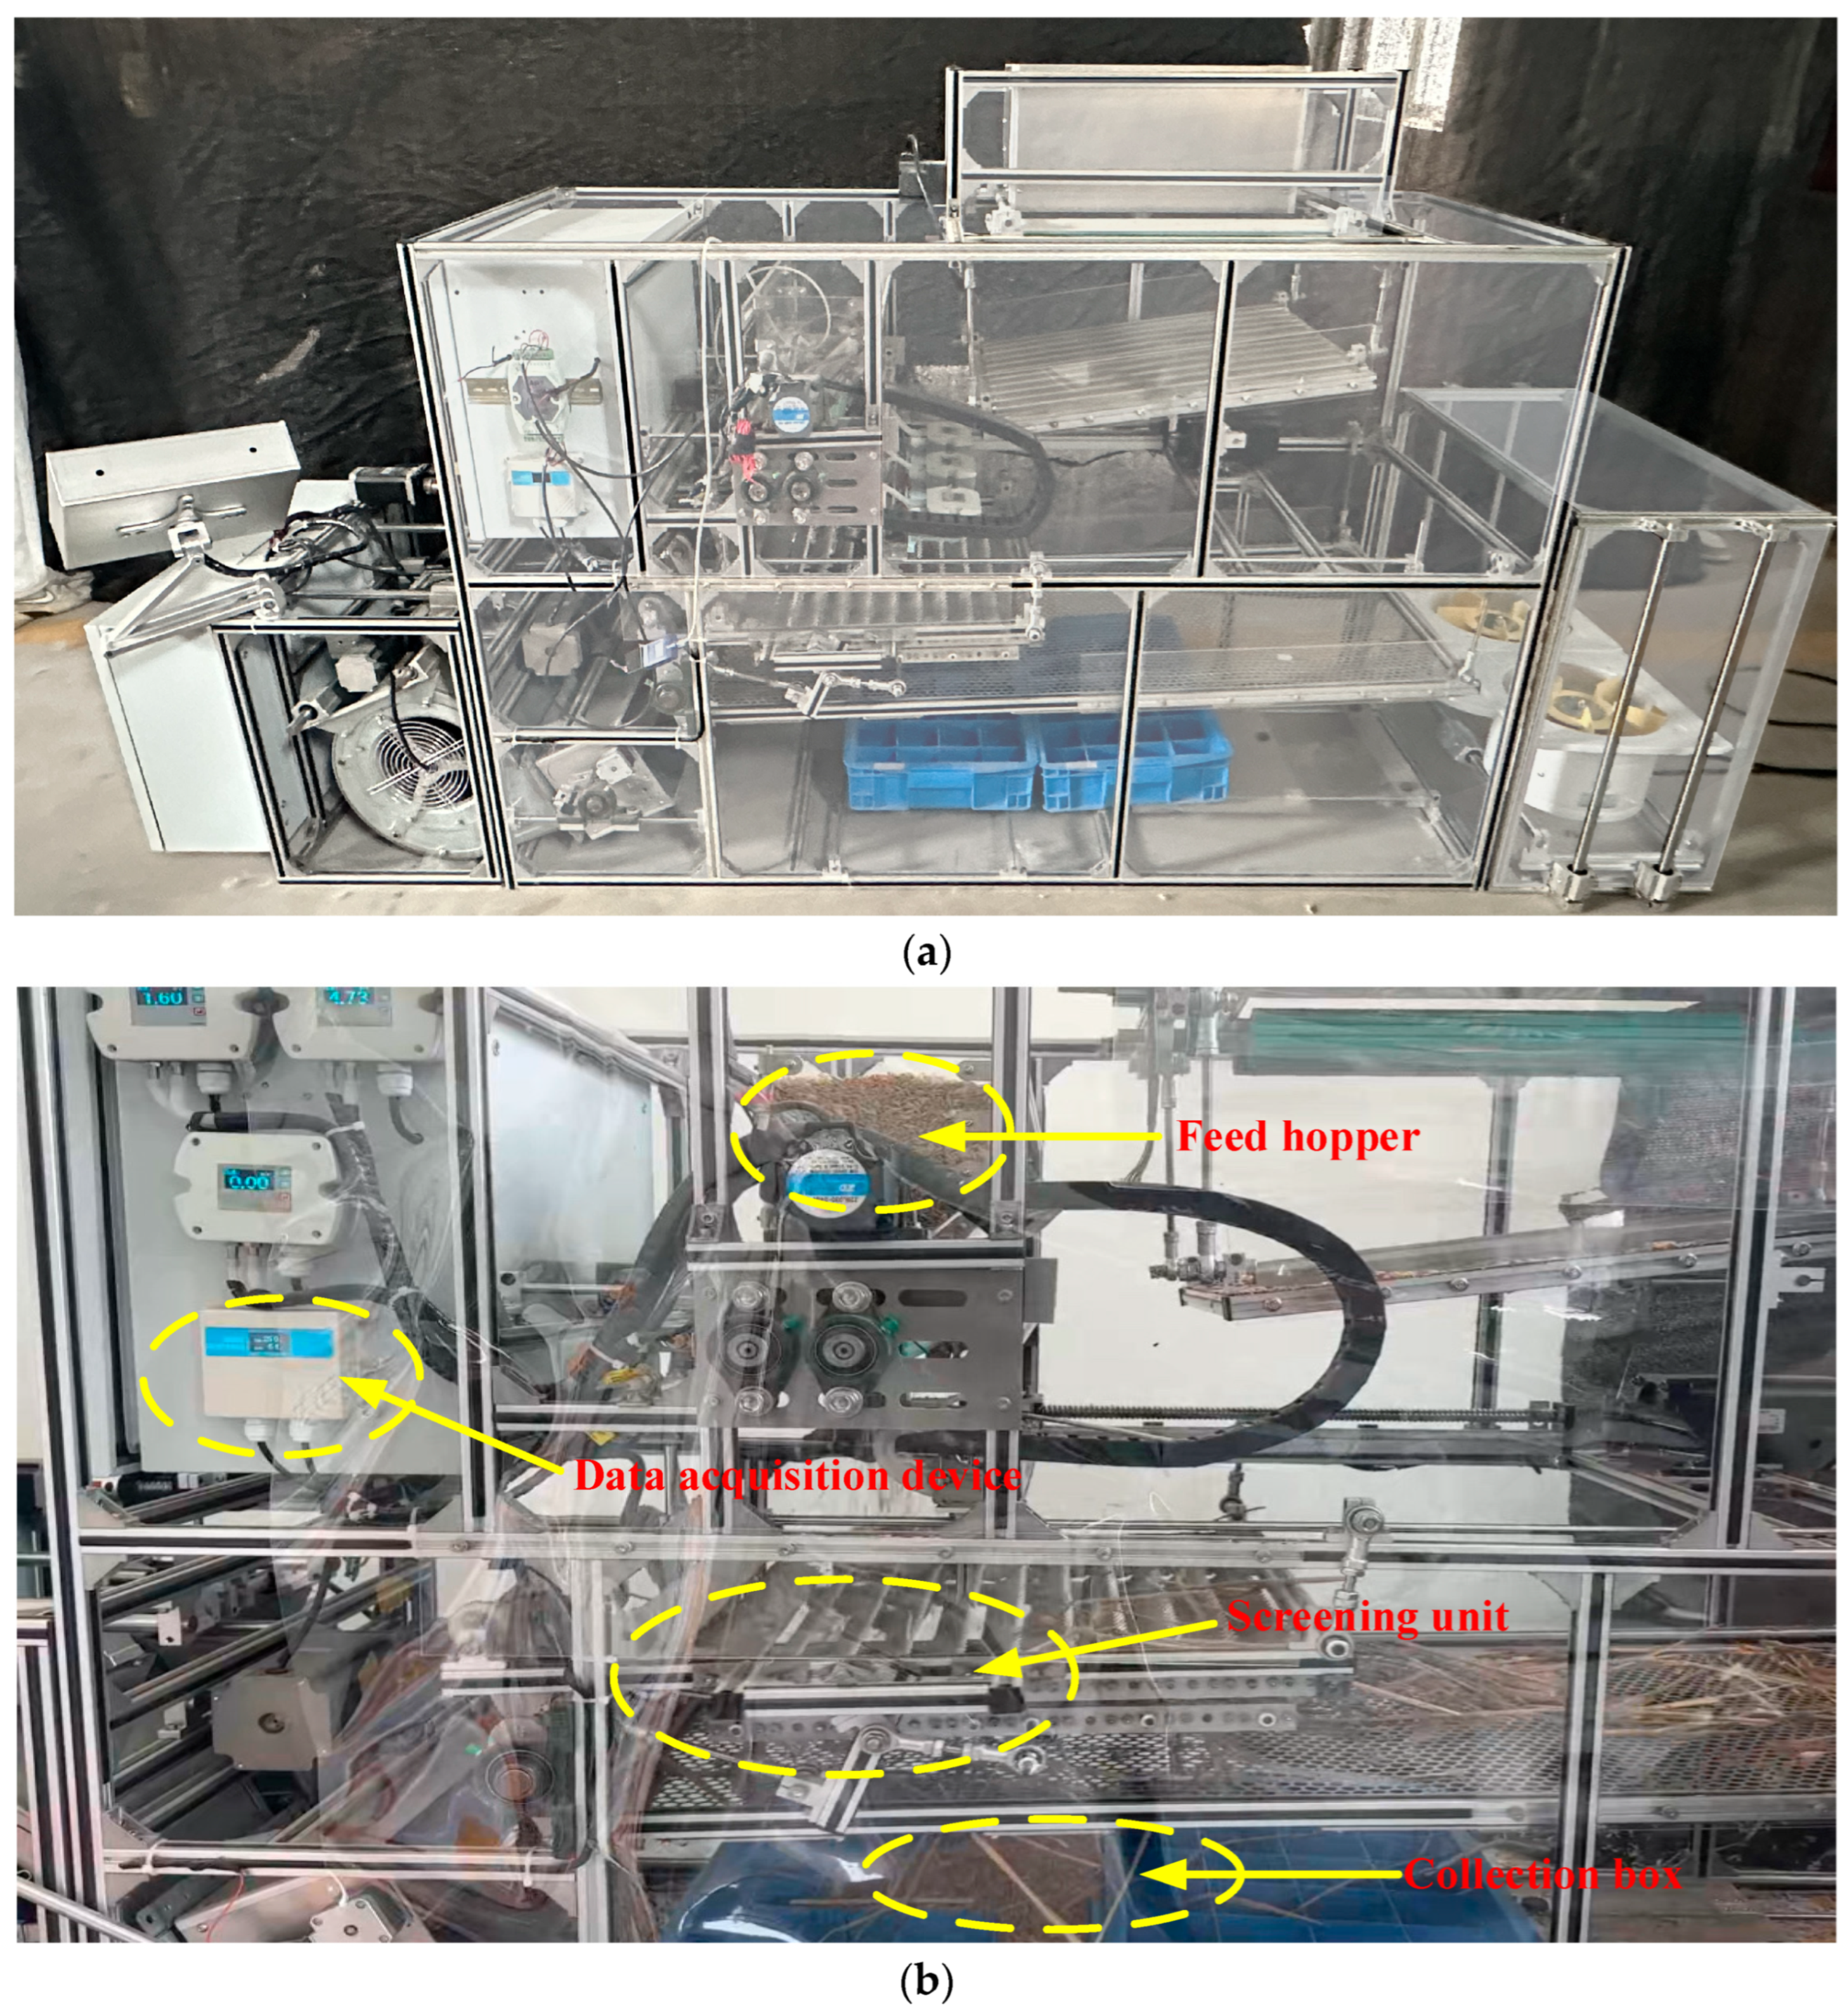
To verify the accuracy of the optimization test results, tests were conducted under the optimal parameter combination using the wind-screen combined cleaning test bench developed by the research team, as shown in Figure 12. During the test, the front fan speed was set at 1050 r/min, and each test was repeated three times, with the average value taken. Upon completion, the airflow non-uniformity coefficient at the rear of the screen surface was measured to be 11.17%, with a relative error of 4.39% compared to the optimized result, indicating that the optimization model is reliable.

4. Conclusions

Traditional cleaning systems in high-throughput grain combine harvesters face persistent issues with airflow decay and light impurity accumulation in the rear sieve region, which have not been adequately resolved in existing structural designs. To address the problem of rapid airflow attenuation at the rear of the screen surface and the difficulty in effectively discharging light impurities in the cleaning system of high-throughput grain combine harvesters, this paper proposes a “front-blowing and rear-suction” combined cleaning technology. By analyzing the internal airflow attenuation characteristics of the cleaning chamber, an airflow attenuation model was established, revealing the airflow variation along the screen surface. A theoretical system for high-efficiency cleaning under high-throughput conditions suitable for the front-blowing and rear-suction configuration was constructed, providing theoretical support for the structural optimization and performance improvement of the cleaning system under complex working conditions.
On this basis, single-factor simulation tests affecting the performance of the combined cleaning structure were carried out to analyze the variation pattern of the airflow field structure in the cleaning chamber before and after improvement. The results showed that the front-blowing and rear-suction combined structure significantly improved the airflow distribution at the rear of the screen surface, increasing the average airflow velocity in the rear region from 6.50 m/s to 8.07 m/s, with an increase of 24.2%; the airflow non-uniformity coefficient decreased from 27.74% to 11.37%, with an improvement rate of 59.43%. The airflow velocity distribution became significantly more uniform, the velocity gradient in the rear region of the screen was notably reduced, effectively alleviating the issue of local low-speed zones and fundamentally enhancing the airflow conveying capacity and the stability of the cleaning operation. This structural innovation, which has not been previously reported in grain combine harvester cleaning systems, opens a new pathway for airflow field optimization under high-throughput conditions.
To further validate the simulation results and clarify the influence of each structural parameter on airflow performance, single-factor tests were conducted under bench conditions. The results showed that the induced draft fan speed, horizontal distance from the screen surface, and vertical installation position had significant effects on the airflow velocity and uniformity over the screen surface. The experimental results were consistent with the simulation trends, providing data support for subsequent parameter optimization and offering a basis for reasonable determination of key parameters in structural design.
On the basis of single-factor analysis, a three-factor and three-level orthogonal experiment was further designed and implemented, with the induced draft fan speed, horizontal distance, and vertical position as the influencing factors, to optimize and obtain the optimal parameter configuration of the front-blowing and rear-suction combined structure. The subsequent bench tests showed that this structure could effectively improve the airflow performance behind the screen, significantly enhance airflow uniformity, and improve the operational stability of the cleaning system. The research results verified the effectiveness of the front-blowing and rear-suction combined structure, providing a theoretical foundation and practical support for the structural improvement and performance enhancement of the cleaning system in combine harvesters and demonstrating good potential for practical application and promotion. These findings lay a solid foundation for future optimization and field validation efforts under practical operating conditions, and further verification across diverse crops and field scenarios will be an important focus of subsequent research.

Author Contributions

Conceptualization, J.Y. and Y.C.; methodology, J.Y.; software, J.Y.; validation, J.Y., Y.C., and Z.Z.; formal analysis, J.Y.; investigation, Z.Z.; resources, Q.Y.; data curation, P.G.; writing—original draft preparation, J.Y.; writing—review and editing, D.G.; visualization, Y.W.; supervision, D.G.; project administration, X.W.; funding acquisition, D.G. All authors have read and agreed to the published version of the manuscript.

Funding

This research was supported by the Modern Agricultural Industrial System of Shandong Province (SDAIT-02-12), the National Key Research and Development Plan (2021YFD20000502), and the Pilot Project for the Integration of Agricultural Machinery R&D, Manufacturing, Promotion, and Application in Shandong Province (Project No. NJYTHSD-202319).

Institutional Review Board Statement

Not applicable.

Data Availability Statement

Data are contained within the article.

Conflicts of Interest

The authors declare no conflicts of interest.

References

  1. Liu, W.; Zeng, S.; Chen, X. Design and experiment of spiral step cleaning device for ratooning rice based on CFD-DEM coupling. Comput. Electron. Agric. 2024, 224, 109207. [Google Scholar] [CrossRef]
  2. Chai, X.; Zhou, Y.; Xu, L.; Li, Y.; Li, Y.; Lv, L. Effect of guide strips on the distribution of threshed outputs and cleaning losses for a tangential-longitudinal flow rice combine harvester. Biosyst. Eng. 2020, 198, 223–234. [Google Scholar] [CrossRef]
  3. Shao, W.; Feng, J.; Zhang, F.; Wang, S.; Li, Y.; Lv, J. Aerodynamic performance optimization of centrifugal fan blade for air system of self-propelled cotton-picking machine. Agriculture 2023, 13, 1579. [Google Scholar] [CrossRef]
  4. Liang, Y.; Tang, Z.; Zhang, H.; Li, Y.; Ding, Z.; Su, Z. Cross-flow fan on multi-dimensional airflow field of air screen cleaning system for rice grain. Int. J. Agric. Biol. Eng. 2022, 15, 223–235. [Google Scholar] [CrossRef]
  5. Dai, F.; Xu, P.; Yuan, Z.; Shi, R.; Zhao, Y.; Song, X.; Zhao, W. Simulation and optimization experiment: Working process of a cleaning device for flax combine harvester. Agriculture 2023, 13, 2123. [Google Scholar] [CrossRef]
  6. Liang, Z.; Li, D.; Li, J.; Tian, K. Effects of fan volute structure on airflow characteristics in rice combine harvesters. Span. J. Agric. Res. 2021, 18, e0209. [Google Scholar] [CrossRef]
  7. Gebrehiwot, M.G.; De Baerdemaeker, J.; Baelmans, M. Numerical and experimental study of a cross-flow fan for combine cleaning shoes. Biosyst. Eng. 2010, 106, 448–457. [Google Scholar] [CrossRef]
  8. Gebrehiwot, M.G.; De Baerdemaeker, J.; Baelmans, M. Effect of a cross-flow opening on the performance of a centrifugal fan in a combine harvester: Computational and experimental study. Biosyst. Eng. 2010, 105, 247–256. [Google Scholar] [CrossRef]
  9. Badretdinov, I.; Mudarisov, S.; Khasanov, E.; Nasyrov, R.; Tuktarov, M. Operation technological process research in the cleaning system of the grain combine. J. Agric. Eng. 2021, 52. [Google Scholar] [CrossRef]
  10. Ma, X.; Zhao, L.; Guo, B.; Dang, H. Simulation and experiment of rice cleaning in air-separation device based on DEM-CFD coupling method. Int. J. Agric. Biol. Eng. 2020, 13, 226–233. [Google Scholar] [CrossRef]
  11. Liang, Z.; Xu, L.; De Baerdemaeker, J.; Li, Y.; Saeys, W. Optimisation of a multi-duct cleaning device for rice combine harvesters utilising CFD and experiments. Biosyst. Eng. 2020, 190, 25–40. [Google Scholar] [CrossRef]
  12. Zhang, C.; Geng, D.; Xu, H.; Li, X.; Ming, J.; Li, D.; Wang, Q. Experimental study on the influence of working parameters of centrifugal fan on airflow field in cleaning room. Agriculture 2023, 13, 1368. [Google Scholar] [CrossRef]
  13. Chai, X.; Xu, L.; Sun, Y.; Liang, Z.; Lu, E.; Li, Y. Development of a cleaning fan for a rice combine harvester using computational fluid dynamics and response surface methodology to optimise outlet airflow distribution. Biosyst. Eng. 2020, 192, 232–244. [Google Scholar] [CrossRef]
  14. Xu, L.; Hansen, A.C.; Li, Y.; Liang, Z.; Yu, L. Numerical and experimental analysis of airflow in a multi-duct cleaning system for a rice combine harvester. Trans. ASABE 2016, 59, 1101–1110. [Google Scholar] [CrossRef]
  15. Wan, X.; Yuan, J.; Yang, J.; Liao, Y.; Liao, Q. Effects of working parameters on the performance of cyclone separator for rapeseed combine harvester based on CFD. Int. J. Agric. Biol. Eng. 2023, 16, 128–135. [Google Scholar] [CrossRef]
  16. Chu, K.W.; Wang, B.; Yu, A.B.; Vince, A. CFD-DEM modelling of multiphase flow in dense medium cyclones. Powder Technol. 2009, 193, 235–247. [Google Scholar] [CrossRef]
  17. Younsi, M.; Bakir, F.; Kouidri, S.; Rey, R. Influence of impeller geometry on the unsteady flow in a centrifugal fan: Numerical and experimental analyses. Int. J. Rotating Mach. 2007, 2007, 34901. [Google Scholar] [CrossRef]
  18. Hussain, S.; Jianjun, H.; Yong, C.; Ali, A.; Song, H.; Zheng, D.; Farid, M.U.; Ghafoor, A.; Ahmed, M. CFD study of self-cleaning system of multi-stage tangential roller threshing unit for precise buckwheat breeding. Heliyon 2024, 10, e27180. [Google Scholar] [CrossRef] [PubMed]
  19. Pan, Y.; Chen, C. Exploring the relationship between particle deposition and near-wall turbulence quantities in the built environment. Build. Environ. 2021, 196, 107814. [Google Scholar] [CrossRef]
  20. Zhang, J.; Chen, Q.; Zhou, H.; Zhang, C.; Jiang, X.; Lv, X. CFD analysis and RSM-based design optimization of axial air-assisted sprayer deflectors for orchards. Crop Prot. 2024, 184, 106794. [Google Scholar] [CrossRef]
  21. Yuan, J.; Wu, C.; Li, H.; Qi, X.; Xiao, X.; Shi, X. Movement rules and screening characteristics of rice-threshed mixture separation through a cylinder sieve. Comput. Electron. Agric. 2018, 154, 320–329. [Google Scholar] [CrossRef]
  22. Liu, P.; Wang, X.; Jin, C. Bench test and analysis of cleaning parameter optimization of 4 L-2.5 wheat combine harvester. Appl. Sci. 2022, 12, 8932. [Google Scholar] [CrossRef]
  23. Wang, H.; Zhang, H.; Hu, X.; Luo, M.; Wang, G.; Li, X.; Zhu, Y. Measurement of airflow pattern induced by ceiling fan with quad-view colour sequence particle streak velocimetry. Build. Environ. 2019, 152, 122–134. [Google Scholar] [CrossRef]
  24. Köhler, H.; Liebmann, V.; Golla, C.; Fröhlich, J.; Rüdiger, F. Modeling and CFD-simulation of cleaning process for adhesively detaching film-like soils with respect to industrial application. Food Bioprod. Process. 2021, 129, 157–167. [Google Scholar] [CrossRef]
  25. Xingyu, W.; Jiacheng, Y.; Qingxi, L.; Chongyou, W.; Min, Z.; Zhuohuai, G.; Haitong, L. Computational fluid dynamics analysis of the airflow field inside a cyclone of a combine harvester with adjustable blocks. Biosyst. Eng. 2023, 230, 205–218. [Google Scholar] [CrossRef]
  26. Chen, X.; Wang, D.; Wang, Y.; Lv, W.; Lei, D.; Zhang, Y.; Xia, L.; Sun, X.; Guo, Y.; Su, D.; et al. CFD design and testing of an air flow distribution device for microwave infrared hot-air rolling-bed dryer. Biosyst. Eng. 2024, 246, 204–218. [Google Scholar] [CrossRef]
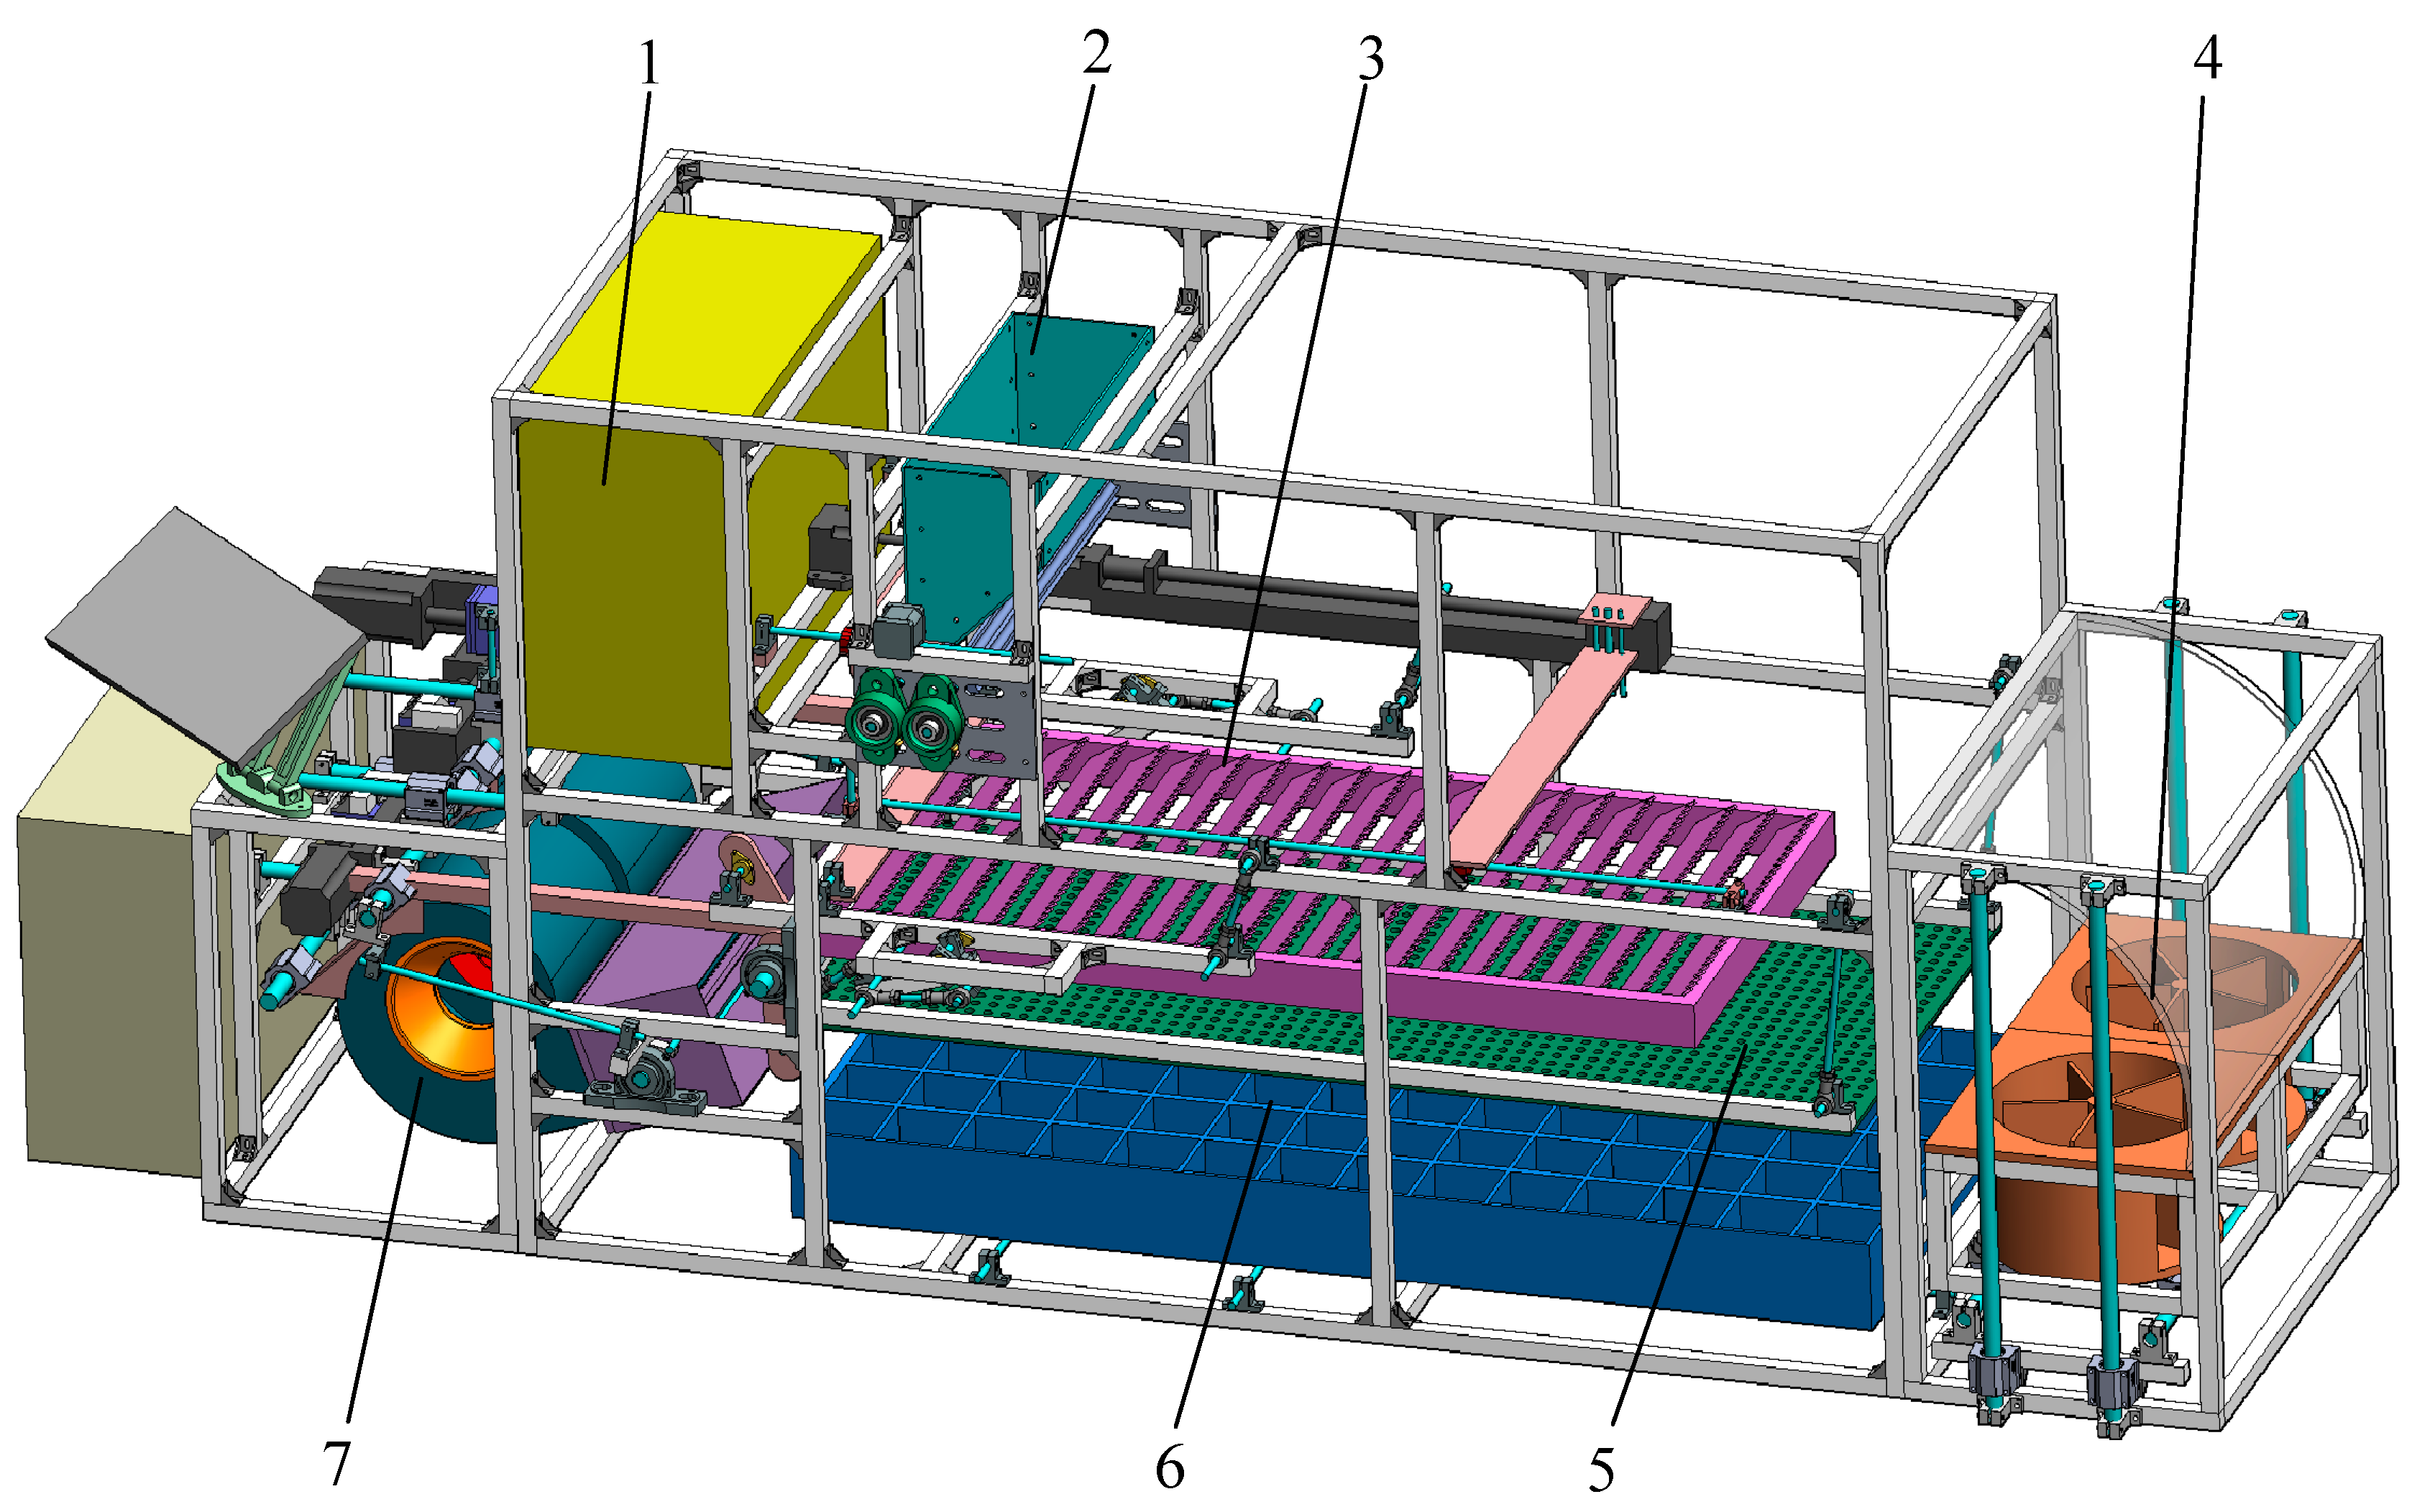
Figure 1. “Front-blowing and rear-suction” air-sieve combined cleaning test platform. (1) Control cabinet; (2) feeding hopper; (3) fish-scale sieve; (4) induced draft fan; (5) perforated sieve; (6) collection box; (7) centrifugal fan.
Agriculture 15 01722 g001
Figure 2. Theoretical model of the “front-blowing and rear-suction” air-sieve combined cleaning system.
Agriculture 15 01722 g002
Figure 3. Simulation model of the cleaning device.
Agriculture 15 01722 g003
Figure 4. Fluctuation of airflow velocity over the sieve surface prior to improvement.
Agriculture 15 01722 g004
Figure 5. Airflow velocity fluctuation over the sieve surface after improvement.
Agriculture 15 01722 g005
Figure 6. Contour maps of the observation plane at different rotational speeds.
Agriculture 15 01722 g006
Figure 7. Effect of induced draft fan speed on the average airflow velocity and non-uniformity coefficient.
Agriculture 15 01722 g007
Figure 8. Contour maps of the observation plane at different vertical installation positions.
Agriculture 15 01722 g008
Figure 9. Effect of the vertical installation position of the induced draft fan on the average airflow velocity and velocity non-uniformity coefficient.
Agriculture 15 01722 g009
Figure 10. Contour maps of the observation plane at different horizontal distances from the sieve surface.
Agriculture 15 01722 g010
Figure 11. Effects of the horizontal distance between the induced draft fan and the sieve surface on airflow velocity and the non-uniformity coefficient.
Agriculture 15 01722 g011
Figure 12. Bench test validation. (a) Overall view of the self-developed cleaning test bench; (b) experimental setup for airflow verification.
Agriculture 15 01722 g012
Table 1. Main structural parameters of the cleaning test platform.
ParameterValue
Overall dimensions of the test platform frame/mm2200 × 600 × 1000
Impeller diameter of the centrifugal fan/mm300 mm
Outlet width of the centrifugal fan/mm540 mm
Impeller diameter of the induced draft fan/mm250 mm
Vertical distance from induced draft fan to sieve surface/mm150 mm
Dimensions of fish-scale sieve (Length × Width)/mm1000 mm × 500 mm
Inclination angle of the fish-scale sieve/°23°
Dimensions of perforated sieve (Length × Width)/mm1200 mm × 500 mm
Table 2. Coded levels of test factors.
LevelFactors
Induced Draft Fan Speed
A/r·min−1
Vertical Installation Position of the Induced Draft Fan
B/mm
Horizontal Distance from the Screen Surface to the Induced Draft Fan
C/mm
1200050250
2220070350
3240090450
Table 3. Simulation experiment scheme and results.
Test NumberInduced Draft Fan Speed
A/r·min−1
Vertical Installation Position of the Induced Draft Fan
B/mm
Horizontal Distance from the Screen Surface to the Induced Draft Fan
C/mm
Airflow Non-Uniformity Coefficient in the Rear Section
Y/%
122007035010.96
222007035011.09
324005035012.96
420009035014.2
520005035016.32
622005045012.53
720007025015.63
822009025012.94
924009035012.31
1022009045012.51
1124007025012.96
1222005025015.26
1320007045013.92
1422007035010.57
1524007045011.92
1622007035011.33
1722007035011.62
Table 4. Analysis of variance for the regression model.
IndexSourceSum of SquaresDegrees of FreedomMean SquareFp
Airflow Non-uniformity Coefficient in the Rear SectionModel44.9194.9949.26<0.0001
A12.3112.3121.43<0.0001
B3.2613.2632.220.0008
C4.3714.3743.10.0003
BC1.3211.3213.060.0086
A210.32110.32101.87<0.0001
B26.7716.7766.83<0.0001
C23.6313.6335.80.0006
Residual0.709170.1013
Lack of Fit0.086230.02870.18450.9018
Pure Error0.622940.1557
Total Error45.6216
Disclaimer/Publisher’s Note: The statements, opinions and data contained in all publications are solely those of the individual author(s) and contributor(s) and not of MDPI and/or the editor(s). MDPI and/or the editor(s) disclaim responsibility for any injury to people or property resulting from any ideas, methods, instructions or products referred to in the content.