Article

Hyperspectral Imaging Combined with a Dual-Channel Feature Fusion Model for Hierarchical Detection of Rice Blast

1
College of Information and Electronic Engineering, Shenyang Agricultural University, Shenyang 110866, China
2
Key Laboratory of Smart Agriculture Technology in Liaoning Province, Shenyang 110866, China
*
Author to whom correspondence should be addressed.
Agriculture 2025, 15(15), 1673; https://doi.org/10.3390/agriculture15151673
Submission received: 30 June 2025 / Revised: 28 July 2025 / Accepted: 31 July 2025 / Published: 2 August 2025

Abstract

Rice blast caused by Magnaporthe oryzae is a major cause of yield reductions and quality deterioration in rice. Therefore, early detection of the disease is necessary for controlling the spread of rice blast. This study proposed a dual-channel feature fusion model (DCFM) to achieve effective identification of rice blast. The DCFM model extracted spectral features using successive projection algorithm (SPA), random frog (RFrog), and competitive adaptive reweighted sampling (CARS), and extracted spatial features from spectral images using MobileNetV2 combined with the convolutional block attention module (CBAM). Then, these features were fused using the feature fusion adaptive conditioning module in DCFM and input into the fully connected layer for disease identification. The results show that the model combining spectral and spatial features was superior to the classification models based on single features for rice blast detection, with OA and Kappa higher than 90% and 88%, respectively. The DCFM model based on SPA screening obtained the best results, with an OA of 96.72% and a Kappa of 95.97%. Overall, this study enables the early and accurate identification of rice blast, providing a rapid and reliable method for rice disease monitoring and management. It also offers a valuable reference for the detection of other crop diseases.

1. Introduction

Rice is one of the most crucial crops in the world, and a main source of food for over half of the world’s population [1]. Crop pests and diseases are among the serious threats to agricultural production in China. Diseases such as rice blast are increasingly affecting rice growers worldwide, posing a significant risk to global food security [2]. The incidence and severity of rice blast fluctuate annually based on geographical location and environmental factors [3], and can cause an annual yield loss of 10 to 30% [4]. During severe outbreaks, reductions in rice production can escalate from 40 to 50%. When the pathogen infects the crown, leaf blade, leaf neck, and spike, the onset of the disease is most pronounced [5]. Initially, the infection manifests as a small brown spot on the leaf tissue, gradually expanding into a fusiform shape, with a gray center and brown edges. These lesions may continue to grow, eventually merging and causing the death of the entire leaf [6,7]. Therefore, developing rapid and non-destructive methods for disease detection is indispensable for effectively monitoring rice growth.
Traditional methods for detecting rice diseases rely heavily on labor-intensive practices, including field inspections, surveys, and sample collection [8]. These approaches are time- and labor-intensive, highly dependent on subjective judgment, and often yield diagnostic accuracy. Moreover, they typically require inspectors with specialized expertise [9]. In large-scale or cross-regional farming, such methods are highly inefficient. Detecting early or latent signs of infestation also poses significant time and technical challenges [10]. Hyperspectral imaging technology (HSI) has emerged as a promising alternative to traditional methods. Owing to its high spectral resolution and the ability to capture both spectral and spatial information, it has become a research hotspot and has been widely applied in crop disease identification [11,12,13].
Technological advances in computer vision and machine learning have promoted the effective application of image processing in crop disease detection [14,15]. With the introduction of convolutional neural network (CNN) methods, crop disease detection based on deep learning has shown remarkable performance compared to traditional machine learning methods [16,17]. Even with limited labeled samples, semi-supervised models have been able to achieve high classification accuracy. You et al. [18] utilized hyperspectral microscope imaging combined with advanced chemometrics to recognize diseased Korla fragrant pears. The CNN model based on fusion datasets performed the best at differentiating between healthy pears and diseased pears, with a maximum accuracy of 96.72%. Chun et al. [19] developed a rapid and non-destructive method for determining the stage of botrytis cinerea infection in strawberry fruit using hyperspectral fluorescence imaging combined with multiple classification models. The 1D-CNN model, which was based on a ResNet-50, outperformed the other models with a precision of 96.88%, a recall of 96.87%, an F1-score of 96.85%, and an accuracy of 96.86%. Gui et al. [20] suggested a classification method using HSI technology for the early identification of soybean mosaic virus disease. This method combined a convolutional neural network with a support vector machine. The CNN-SVM model demonstrated 96.67% accuracy on the training set and 94.17% accuracy on the test set. Qi et al. [21] proposed a deep learning classification framework for effectively detecting potato late blight in hyperspectral images. The model integrated 2D and 3D convolutional neural networks (2D-CNN and 3D-CNN) with deep collaborative attention networks (PLB-2D-3D-A), achieving a maximum accuracy of 79%. Bu et al. [22] proposed ResNet-R&H, a novel classification model based on the ResNet architecture. By fusing RGB and hyperspectral images, the model was used to assess the freshness of vegetable soybean and achieved a test accuracy of 97.6%. Chen et al. [23] developed a deep learning model called the Rice Bakanae Disease-Visual Geometry Group (RBD-VGG) to detect rice bakanae disease. On the 21st day of infection, an accuracy of 92.2% was attained on average using this model.
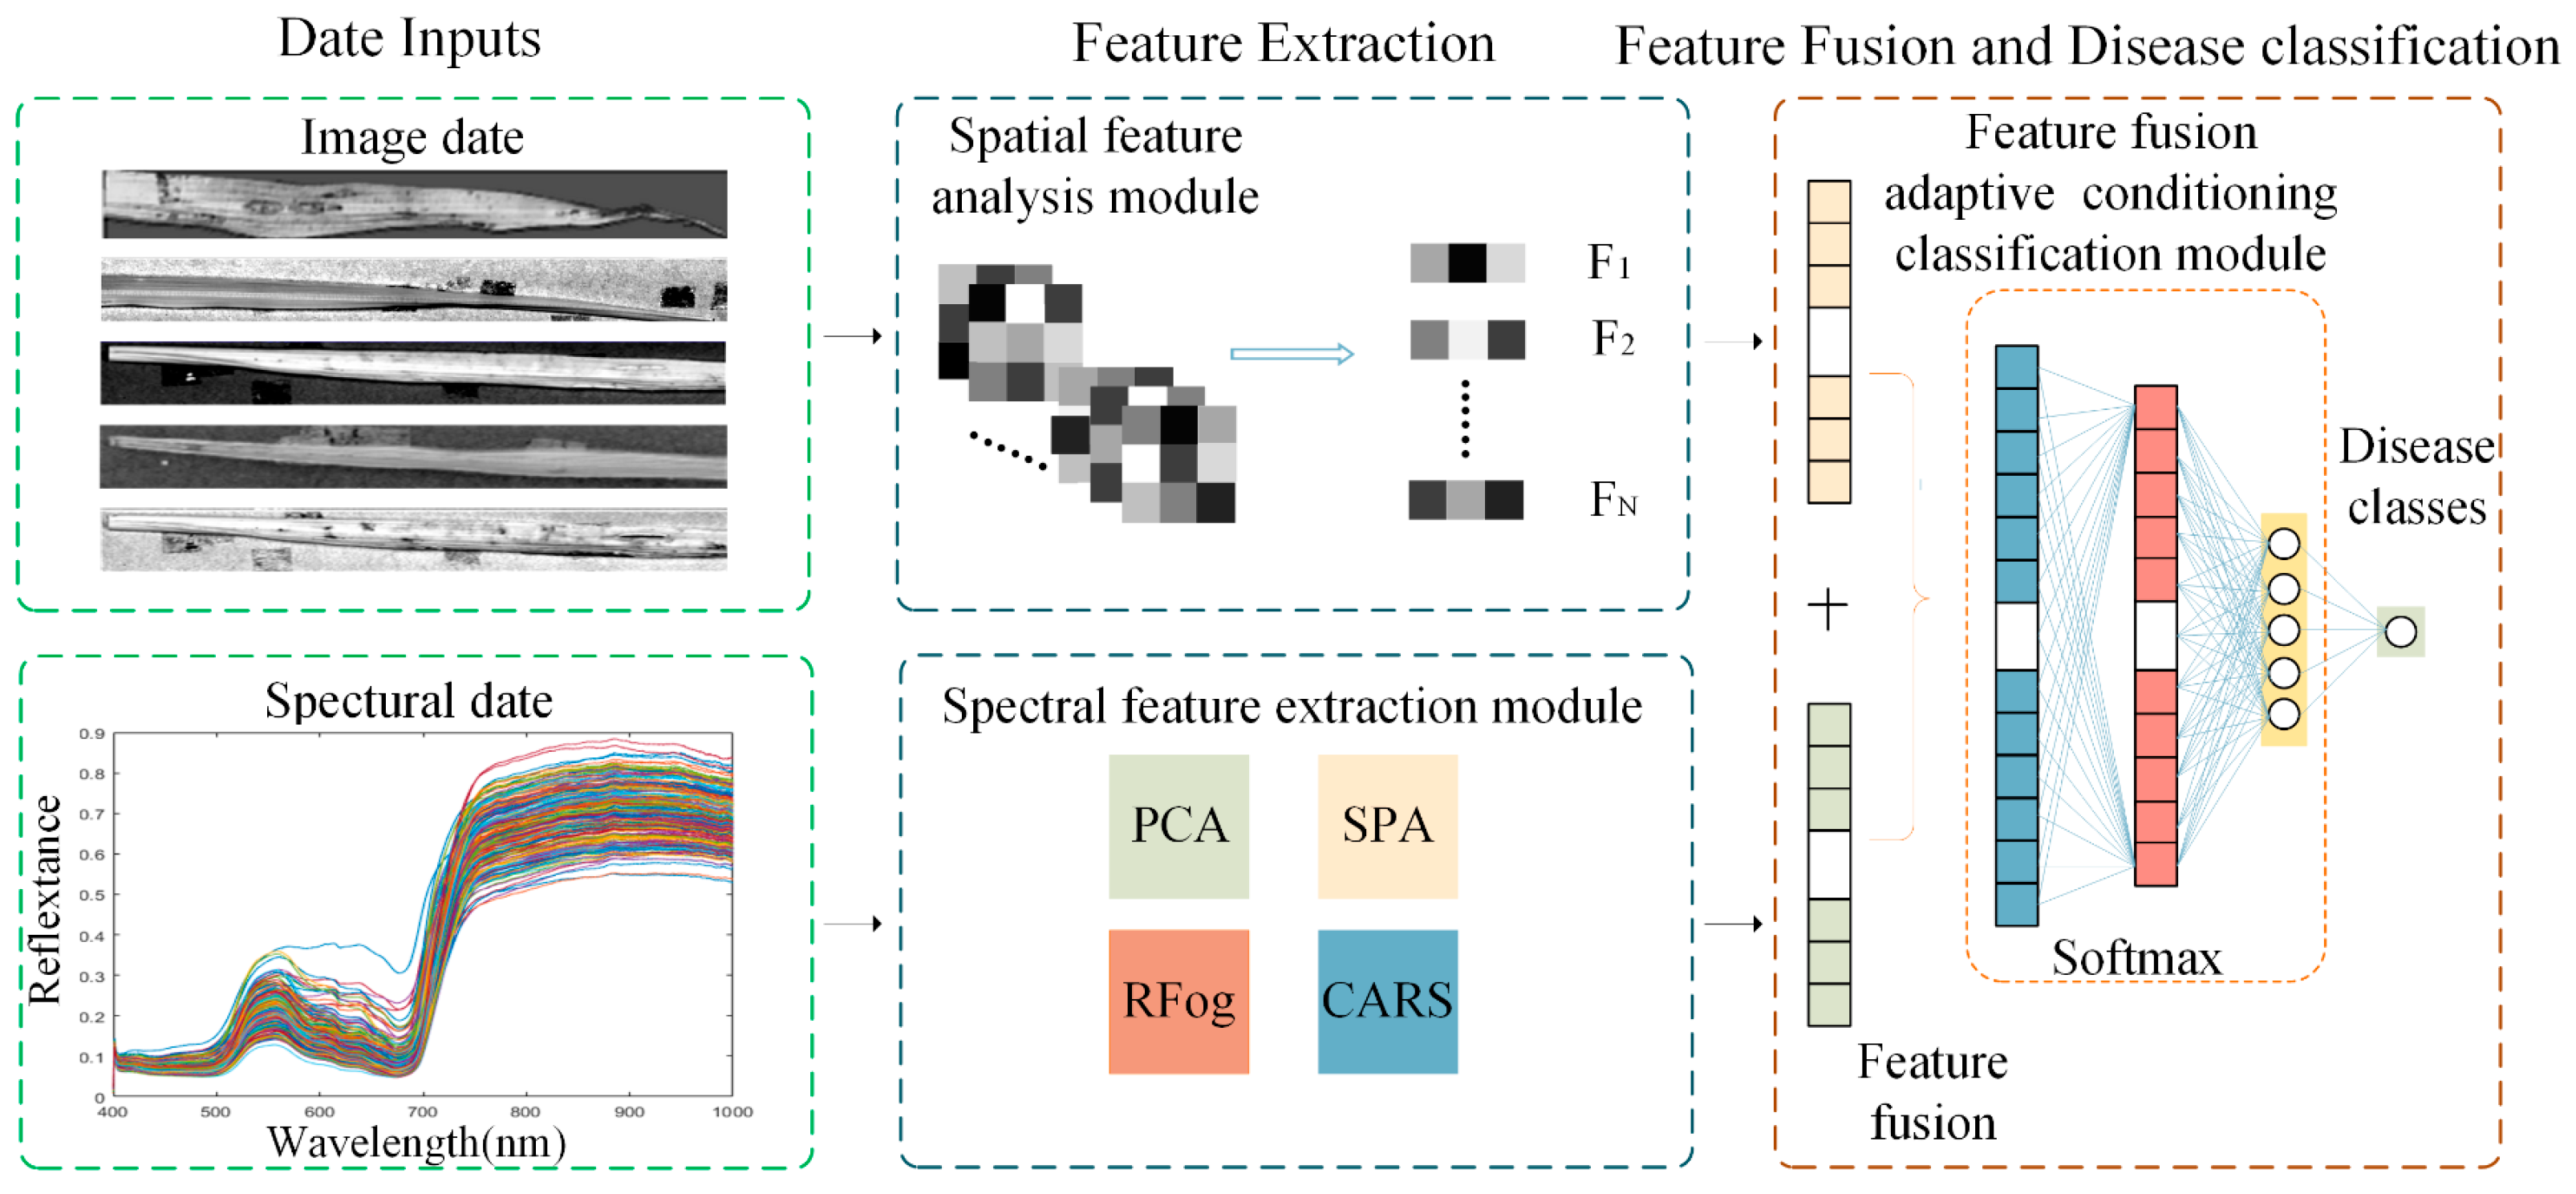
Although HSI and image processing technologies have been widely used in agricultural production, most of the existing studies are still limited to modeling and analysis using spectral or image data. In contrast, relatively little attention has been given to the extraction and fusion of spatial structural features embedded within spectral images. Rice blast infestation often presents as a multilevel symptom ranging from microscopic pigment changes to macroscopic leaf morphology. Relying solely on biochemical response signals from spectral curves makes it difficult to fully capture the spatial distribution characteristics of the disease. Image information, on the other hand, can reveal structural changes in the shape, margins, and irregularities of disease spots. Therefore, relying only on single-dimensional features may lead to information loss and limited discriminative capability. The core of the HSI technique lies in its three-dimensional data, which include rich two-dimensional image information and one-dimensional spectral data. This necessitates utilizing the spectral and spatial information of the fusion features to distinguish different levels of rice blast.
Given these, this paper proposed a dual-channel deep learning feature fusion adaptive conditioning model. It employed the successive projection algorithm (SPA), random frog (RFrog), and competitive adaptive reweighted sampling (CARS) to determine spectral characteristic wavelengths associated with rice blast. In parallel, spatial features were extracted using the MobileNetV2 model combined with a dual-attention mechanism. Spectral and image data were input simultaneously and fused through a feature fusion adaptive conditioning module. This approach fully leveraged both internal and external features of disease identification, enabling high-precision classification of rice blast. Comparative analysis was conducted using support vector machine (SVM), particle swarm algorithm optimized support vector machine (PSOSVM), random forest (RF), residual neural network (ResNet50), and MobileNetV2 models with those in this study. This provides research ideas and methods for the application of hyperspectral images in rice blast detection.

2. Materials and Methods

2.1. Experimental Area

The experimental region of this study was situated in Liujiaohe Village, Shenyang New District, Shenyang, Liaoning Province (2020) (41°48′11″ N, 123°25′31″ E) and at the experimental base of Shenyang Agricultural University, Haicheng City, Liaoning Province (2021 and 2022) (40°85′43″ N, 122°74′33″ E). The study included both artificially stained experimental plots (2020 and 2021) and natural incidence areas (2022). Haicheng City is in the central part of the Liaodong Peninsula and belongs to the temperate semi-humid continental climate, with four distinct seasons and abundant rainfall. The average temperature in July and August is 25 °C, the average rainfall is 145 mm, the humidity is 78%, and there are 9 rainy days per month. The climatic conditions are favorable for rice cultivation, and the study area is shown in Figure 1.
Artificially stained experimental plots (2020 and 2021) are as follows: The test variety was Mongolian rice, which is susceptible to rice blast. During the rice cultivation period, the paddy fields were not sun-dried. The spore suspension was evenly sprayed on the leaf surface at 5:30 p.m. after sunset on 3 July 2020 and 6 July 2021, respectively. At the inoculation site, moistened black impermeable plastic bags were wrapped around the rice plants and removed at 6:30 a.m. the following day. To ensure the test results’ reliability, plant protection experts were invited to provide guidance and assistance during the rice blast inoculation process. Through the experimental design of artificially inducing rice blast, rice in the infected area exhibited symptoms 6 days after inoculation. Trials were conducted at three critical fertility stages, namely the jointing, booting, and heading stages of rice, to collect healthy and diseased plants. Rice plants were randomly sampled from the selected area, focusing on only one leaf per plant below the flag leaf where symptoms were evident. These leaves were then manually collected and sent to the laboratory for hyperspectral image acquisition.
Natural incidence areas (2022) are as follows: With Yanfeng 47 as the planting rice variety and an area of 0.39 hm 2 , the experimental plot produced a 30 × 20 cm density. The field looked to have an infestation of the rice blast on 12 July 2022, as discovered by the plant protection crew.
In addition, referring to the “GTB 15790-2009 rules of investigation and forecast of the rice blast” [24], the percentage of diseased area for the whole leaf blade was calculated to determine the disease level in the collected rice samples. The details are presented in Table 1. Figure 2 shows that level 0 refers to plots free from disease, while levels 1 to 4 denote progressively increasing infection severity.

2.2. Hyperspectral Image Acquisition and Processing

Figure 3 demonstrates the process of hyperspectral image acquisition. The images of rice leaves were captured using this hyperspectral imaging system. The system consisted mostly of a hyperspectral imaging spectrometer (ImSpector V10E, Spectral Imaging Ltd., Oulu, Finland), a CCD camera (IGV-B1410, Antrim, Northern Ireland), a precision displacement console, a lightless dark box, two 150 W fiber optic halogen lamps (Ocean Optics, Dunedin, FL, USA), and a computer. The ImSpector V10E acquired an effective spectral range of 400–1000 nm, with 942 bands and a spectral resolution of 1.09 nm. The distance of the camera lens from the rice leaf surface was pre-set at 32 cm to capture images. Until the transition area was sharp and the black stripe was imaged, the focal length of the lens was adjusted using a white paper focusing plate with black stripes. For optimal image quality, the light source’s exposure and intensity were adjusted, and the scanning speed was set to 1.2 mm/s.
The intensity levels in different spatial hyperspectral images vary due to uneven illumination on the leaf surface and the dark current of the camera. Therefore, to acquire the final spectral reflectance, black and white plate reference correction must be applied to the raw hyperspectral images using the following equation.
I = R S R D R W R D
where I represents the corrected spectral reflectance of rice leaves, R S represents the spectral reflectance of the original hyperspectral images of rice leaves, and R W and R D are the spectral reflectance of the corrected white plate and corrected black plate, respectively.

2.3. Data Extraction

2.3.1. Spectral Feature Extraction

The whole rice leaves were used as a single region of interest (ROI), and the average spectral reflectance manually extracted around the ROI using the software ENVI 5.3 was used as one-dimensional spectral data of rice. Finally, 96 health data and 500 disease data were obtained. Due to the high dimensionality and strong correlation inherent in spectral data, a large amount of redundant information exists, which increases model complexity. To eliminate interfering classification variables and amplify spectral differences between sample categories, it is crucial to reduce the dimensionality of raw spectral data and extract key wavelengths for classification [25]. The SPA, CARS, and RFrog were employed in this paper to reduce the dimensionality of the data. These methods are widely used in the field of crop disease detection for selecting spectral characteristic wavelengths. This is because they are well-suited for scenarios involving high dimensionality, small sample sizes, and severe feature redundancy.
SPA is a forward feature-variable selection algorithm that eliminates the effect of collinearity between many wavelength variables and reduces model complexity [26]. The process begins by selecting an initial wavelength and calculating its projection onto the remaining unselected wavelengths. Wavelengths with the largest projection vectors are added to the wavelength subset and are iterated for N times. Each selected wavelength is linearly minimized to the previous one. Then the calibration correction model is used to select the spectral characteristic wavelengths.
CARS combines adaptive reweighted sampling (ARS) and exponentially decreasing function (EDF), which is a commonly utilized feature-variable selection method in crop disease identification. The spectral characteristic wavelengths are derived from the feature variables with the lowest root-mean-square error of cross-validation (RMSECV) through Monte Carlo interactive validation [27]. This method effectively enhances prediction accuracy while maximizing the retention of informative variables.
RFrog is a novel feature-variable extraction algorithm inspired by the modeling framework of Reversible Jump Markov Chain Monte Carlo [28]. This algorithm utilizes specific variables from the spectral data for continuous iteration and modeling. It simulates a Markov chain aligned with the steady-state distribution in space, calculates the selection probability of each spectral variable, and determines the spectral characteristic wavelengths based on the magnitude of these probabilities.
In this case, SPA is a fully deterministic method and does not require the setting of a random seed, whereas RFrog and CARS involve randomized processes during execution, which may lead to differences in the results of each run. To ensure the reproducibility of the experimental results, this paper sets a fixed random seed in the relevant algorithms.

2.3.2. Image Feature Parameter Extraction

The texture and shape feature parameters of rice samples were extracted from single-channel grayscale images. The spatial configuration and grayscale distribution of the image pixels were reflected in the texture features [29]. Extracting and incorporating these texture features helps improve the representation of spatial patterns in certain scenarios [30]. In the classification of rice blast, different disease classes may exhibit different texture patterns. Thus, extracting texture features can provide more distinguishing information. In addition to texture features, shape features serve as a basis for rice blast classification [31], and were used to characterize the shape of spots in rice blast images by extracting attributes such as area, perimeter, and width-to-height ratio. Finally, the feature parameters were combined with the original spectral data as fusion data to provide comprehensive and precise information for subsequent modeling.

2.4. DCFM Model

To accurately assess the severity of rice blast, it is necessary to combine spectral and spatial information of rice samples. Therefore, a dual-channel feature fusion model (DCFM) was constructed to effectively integrate spectral and spatial information. The model was based on deep learning and implemented using a convolutional neural network (CNN), as shown in Figure 4. The DCFM consisted of three main parts, namely a module for extracting features from one-dimensional spectral data of rice samples, a module for extracting spatial features from image data, and a module for feature fusion and adaptive conditioning classification. The effectiveness of the proposed DCFM was evaluated and examined by comparing it to the SVM, PSOSVM, RF, ResNet50, and MobileNetV2 model architectures. To ensure the fairness and scientific validity of the comparison, all baseline models (SVM, PSOSVM, RF, ResNet50, and MobileNetV2) underwent parameter tuning. Among them, the SVM model optimized the penalty coefficient c and kernel parameter g by grid search. The number of decision trees in RF was set to 1000, and the rest of the parameters were default values. The PSOSVM model combined the particle swarm optimization algorithm to automatically search for the optimal hyperparameters. A variable inertia weight ϖ is introduced to enhance global search capability and reduce the risk of falling into local optima. For the deep learning models ResNet50 and MobileNetV2, the parameters were tuned based on empirical principles and performance in this study.

2.4.1. Spectral Feature Extraction Module

When crops are affected by diseases, their spectral responses change significantly, exhibiting distinct spectral characteristics. Therefore, in the spectral feature extraction module, traditional methods such as SPA, RFrog, and CARS are used to extract spectral features to help classify different disease levels.

2.4.2. Spatial Feature Extraction Module

In the spatial feature extraction module, the classical MobileNetV2 framework was used. Since feature fusion involves handling significantly more data than single-feature inputs, model input size and computational efficiency become critical. MobileNetV2, with its lightweight architecture, offers fewer parameters and lower computational complexity compared to the commonly used ResNet50 in hyperspectral images. This greatly reduces computational cost and hardware requirements. Therefore, MobileNetV2 was chosen as the backbone for spatial feature extraction in this study. The framework consisted of three convolutional layers, one fully connected layer, and one pooling layer. The pooling layer used maximum pooling, and the activation function was ReLU6. Due to different image sizes, all of the images were normalized to 1024 × 512, with blank spaces filled with zeros. The overall structure of MobileNetV2 is displayed in Table 2. Compared to the spectral feature extraction module, the spatial feature extraction module employed the CBAM [32], which consisted of two sub-modules connected in series, namely the channel attention module (CAM) and the spatial attention module (SAM), as shown in Figure 5. The overall network structure for spatial feature extraction is shown in Figure 6. This hybrid attention mechanism has the advantage of plug-and-play compatibility with the original network and can be integrated with any feedforward neural network. It can simultaneously acquire attention information in both channel and spatial dimensions, effectively improving the efficiency and accuracy of the network. The final SoftMax layer in MobileNetV2 was removed, eliminating its original classification function and allowing the model output to be converted into spatial feature representations. Subsequently, the extracted spatial features were mapped by adding a fully connected layer to convert them into one-dimensional vectors.
First, important channels were emphasized through CAM. The spatial dimensions of the input feature maps were compressed through parallel global max pooling (GMP) and global average pooling (GAP), while the original number of channels was preserved. Then, the two obtained feature maps were input into the multilayer perceptron (MLP) for compression and stretching. The features outputted from MLP were summed element by element, and the channel weight data were obtained after the sigmoid function. The sigmoid function maps the values to the range of (0, 1), making it well-suited for representing the degree of emphasis or suppression for each channel. For each channel’s feature map, two 2D feature maps were obtained using maximum pooling and average pooling. These were then stacked along the channel dimension and fused through a convolutional layer. Finally, the resulting feature maps were passed through a sigmoid activation function to produce spatial weight maps, which highlight or suppress specific spatial positions. The process can be defined as follows:
M c ( F ) = ρ ( w 0 ( w 1 ( F a v g c ) ) + w 1 ( w 0 ( F m a x c ) ) )
M s ( F ) = ρ ( f ( [ F a v g s ; F m a x s ] )
where F and F represent the input feature map, M c ( ) denotes channel weights, M s ( ) denotes spatial weights, F a v g and F m a x denote the average and maximum pooling layers, w 0 and w 1 denote the parameters of the MLP layer, f denotes the convolutional layer, and ρ denotes the sigmoid function.

2.4.3. Feature Fusion Adaptive Conditioning Module for DCFM Model

Feature fusion was the merging of one-dimensional feature vectors extracted from hyperspectral images and spectral data to enhance the utilization of features by the model and improve classification performance. Since the two input eigenvalues may differ in size, the data need to be normalized before fusion to effectively limit the range of the preprocessed data and reduce the impact of outliers on the accuracy of the model. Min–max normalization is a type of normalization that converts data from different value intervals to the same range from 0 to 1. Specifically, if one supposes the input data is u = { u 1 , u 2 , , u C } , the normalization formula is Equation (4).
u = u min ( u ) max ( u ) min ( u )
Due to the different sources of the two features, there was no guarantee that they were not strongly correlated. Therefore, it was necessary to whiten each of these two types of input features. Suppose the input data is y = { y 1 , y 2 , , y T } , the mean and variance of the data were first calculated for each feature by subtracting its corresponding mean and then dividing by its standard deviation so that each feature has zero mean and unit variance. This process not only helps to eliminate the correlation between features, but also helps to mitigate the problem of vanishing or exploding gradients, thus improving the model’s performance and speeding up the convergence of the network. The principle is shown in Equations (5)–(7), below:
μ 1 T i = 1 T y i
σ 2 1 T i = 1 T ( y i μ ) 2
y w h i t e = y i μ σ 2 + ϵ
where y i denotes the value taken by the i-th sample, T is the input data size, μ denotes the mean of the dataset, and σ 2 denotes the variance of the dataset.
The multiscale spatial features extracted from the hyperspectral image are X t = x t 1 , x t 2 , , x t n R n , and the spectral data are X e = x e 1 , x e 2 , , x e n R m . In this experiment, feature fusion is performed by concatenating the spatial features X t and X e to obtain a new feature vector X f ; X f is an m + n-dimensional feature vector. The feature fusion formula is expressed as follows:
X f = X t X e = ( x t 1 , x t 2 , , x t n , x e 1 , x e 2 , , x e m ) , X f R n + m
In X f , each feature vector not only contains the main features of the original spectral data, but also covers multi-scale spatial features in the neighborhood space and adjacent frequency bands. The centralized multi-scale features help reduce misclassification caused by similar single-scale features, thereby enhancing disease recognition. The fused feature X f is input to the output layer for disease classification. Each neuron in the output layer was interconnected with each neuron in the previous layer to ensure sufficient information transmission and integration. The SoftMax function was used as the activation function for the final layer, converting the output into a probability distribution to facilitate the classification decision.

2.5. Experimental Settings

In this study, the experimental processing platform is i9-10980XE CPU, the main frequency is 2934 MHz, the memory is 64 G, and the GPU model is Quadro RTX 5000. All models were constructed using PyTorch 1.13.0 + Cuda 11.6 in Python 3.7. For reproducibility, a fixed random seed was set across all relevant libraries. The input image size for the experiment was 1024 × 512. Considering the potential negative impact of data augmentation on spectral curves, the model was trained using the original samples, without applying any augmentation techniques. To eliminate the uncertainty caused by dataset splitting on the model classification performance, all 596 samples were selected for model training in this study, and the model was evaluated using five-fold cross-validation. The models were trained using specific parameters, with a training batch size of 128 across 500 epochs. The SGD optimization algorithm was chosen, the initial learning rate of the algorithm was set to 0.001, and the momentum was set to 0.9. The loss function adopted weighted CrossEntropy. By assigning higher weights to the disease levels with fewer samples, the model was guided to pay more attention to the levels that were easily overlooked during the training, thus effectively mitigating the impact of imbalance across disease levels on performance. To comprehensively evaluate the performance of the rice blast recognition models, the overall accuracy (OA), precision, F1-score, and Kappa coefficient were used as the evaluation metrics. All metrics take values between 0 and 1, with larger values indicating better model performance. Ultimately, the best-performing model was determined based on the average performance of OA, Kappa, and F1-score in the five-fold cross-validation. These metrics were calculated as follows:
O A = T P + T N T P + T N + F P + F N
Precision = T P T P + F P
F 1 - score = 2 T P 2 T P + F N + F P
P e = i = 1 c ( T P i + F N i ) ( T P i + F P i ) N 2
Kappa = OA P e 1 P e
where TP denotes the correctly identified positive samples, TN denotes the correctly identified negative samples, FP denotes the falsely identified negative samples labeled as positive, and FN denotes the falsely identified positive samples labeled as negative.

3. Results

3.1. Spectral Analysis for Rice Blast

Figure 7 presents the average reflectance curves of rice blast infestation at different stages. In the visible region (500–600 nm), the reflectance of infected rice leaves slightly increases. In the red-edge region (630–720 nm), due to leaf damage and chlorophyll degradation caused by rice blast [33], the spectral curves exhibit a blue shift towards shorter wavelengths. In the NIR region (720–1000 nm), the spectral curves of diseased leaves significantly decrease. In the wavelength range of 400–450 nm, reflectance from diseased and healthy leaf regions of rice is noisy and has significant overlap [24].

3.2. Hyperspectral Image Result of Dimensionality Reduction

The hyperspectral image contains high-dimensional features and a large amount of information. However, this high dimensionality also increases the difficulty and complexity of image processing [34]. To simplify this process, principal component analysis (PCA) was utilized to reduce the dimensionality and generate principal component maps that retained substantial valid information [35]. The whole leaf of each sample was selected for PCA using the ROI tool. The first three principal component maps (PC1–PC3) of each hyperspectral image were retained for spatial feature extraction, and their cumulative variance contributions all exceeded 95%, as shown in Figure 8. Significant differences between healthy and diseased leaves were observed in the principal component images from PC1 to PC3. The diseased regions showed a noticeable texture difference from the surrounding areas, appearing with darker grayscale and lower brightness in PC2. Therefore, the spatial features extracted from the image after dimensionality reduction by PCA can clearly distinguish between the diseased area and the healthy ones.

3.3. Analysis of Spectral Feature Extraction Results

SPA was used to extract features from the spectral data to effectively capture information related to rice blast. The minimum and maximum numbers of features selected by the algorithm were set to 5 and 10, respectively, with RMSE used as the evaluation criterion. Figure 9A illustrates the RMSE plot used to determine the number of effective wavelengths. When the number of features was 1 to 4, the RMSE curve became steeper, indicating that these features significantly enhanced the model’s predictive ability and represented a critical feature subset. For features 5 to 8, the curve became gentler, but continued to decline. This indicated that compared to the previous features, these features had less impact on model accuracy and remained stable at the 10th wavelength. Eventually, SPA screened out 10 optimal spectral characteristic wavelengths with a relatively uniform distribution across the spectrum, as shown in Figure 9B and Table 3.
Feature extraction was performed using the RFrog, with the number of PLS components set to 6 and the number of iterations set to 100. The characteristic wavelengths were determined based on the probability value, with a screening threshold of 0.3. Wavelengths with a sampling probability greater than 0.3 were recognized as characteristic wavelengths, as shown in Figure 10A. A total of 18 key spectral characteristic wavelengths were successfully identified among 942 potential wavelengths, as shown in Table 3. These wavelengths showed a high correlation with the target variables in terms of both statistical relevance and biophysical significance.
The CARS was utilized to reduce the dimensionality of spectral data, with the number of Monte Carlo runs set to 50, as shown in Figure 10B. The RMSECV initially decreased and then increased as the number of sampled variables changed, reaching its minimum at iteration 20. The best selection of wavelength variables was selected at this point, resulting in the final spectral characteristic wavelengths presented in Table 3.

3.4. Modelling Results for Single Features Input

To verify the advantages of DCFM in this study, the SVM, PSOSVM, and RF models based on single spectral features, as well as the ResNet50 and MobileNetV2 models based on single image features, were built. The feature maps extracted by the ResNet50 and MobileNetV2 models are shown in Figure 11. It can be observed that as the depth of the convolutional neural network increases, the spatial resolution of the feature maps gradually decreases. In the shallow convolutional layers near the input, the model typically extracts low-level features, such as edges and textures, and the feature maps at this stage retain almost all of the original image information. However, in the deeper convolutional layers closer to the output, the extracted features become increasingly abstract, containing less visual detail and more semantic information relevant to specific levels.
As detailed in Table 4 and Table 5, among the models based on single spectral features, the PSOSVM model using spectral characteristic wavelengths by SPA achieved the best classification performance, with an OA of 94.31%, a Kappa of 92.97.%, and an F1-score of 94.14%. Figure 12 shows the heat map of the accuracy across different models and feature extraction methods for different disease levels. SVM and PSOSVM performed well when using SPA-based features, with an accuracy of 100% on level 4. RF performed better on levels 0 and 1 when using CARS, but misclassification was higher for level 2, resulting in a lower accuracy of 74.32%. ResNet50 and MobileNetV2 models constructed based on single image features have higher misclassification rates, with OA and Kappa of 85.81%, 86.90%, 82.43%, and 83.82%, respectively. This may be attributed to the spectral features’ superior ability to reveal the intrinsic characteristics of crops, making it more effective in capturing subtle differences among rice blast severity levels compared to image data [36]. In addition, from the classification results, MobileNetV2 was more suitable as a backbone network for spatial feature extraction compared to ResNet50. Overall, the SVM, PSOSVM, and RF models constructed using spectral features outperformed the image-based ResNet50 and MobileNetV2 models in terms of classification accuracy.

3.5. DCFM Modeling Results

The DCFM rice blast classification model was constructed using both spectral and spatial features, and the recognition results of the model are summarized in Table 6. The experimental results demonstrated that the DCFM model based on fused features achieved higher accuracy than models using a single feature input in identifying different rice blast severity levels, with OA and Kappa being higher than 90% and 88%, respectively. When the spectral characteristic wavelengths screened by SPA were fused with spatial features, the best classification result was obtained, with an OA of 96.72% and a Kappa of 95.97%. As displayed in Figure 13, the SPA-DCFM model was more accurate in classifying diseases at levels 1 and 4, with accuracies of 99.42% and 100%, respectively. The models in this paper outperformed traditional machine learning models (SVM, ELM, and RF) in terms of OA, Kappa, and F1-score. Compared to SPA-SVM, OA and Kappa increased by 4.78% and 5.93%, respectively. Compared to SPA-PSOSVM, OA and Kappa increased by 2.41% and 3%, respectively. Compared to SPA-RF, OA and Kappa increased by 7.73% and 9.56%, respectively. In comparison to the other two deep learning models, the classification accuracy of the ResNet50 and MobileNetV2 models was lower than that of the model proposed in this paper. When comparing and analyzing models built on single versus fused features, it was evident that the DCFM model using the effective fusion of spectral and spatial features had superior recognition accuracy for rice blast.
Table 7 shows the model parameters and floating point operations per second (FLOPs) for DCFM, ResNet50, and MobileNetV2, as well as the results of the inference time comparison to the traditional methods, SVM, PSOSVM, and RF. Among the deep learning models, MobileNetV2 has the lowest number of parameters and FLOPs, with 3.5 M and 0.31 B. The DCFM model has the second highest number of parameters and FLOPs, with 3.9 M and 0.39 B. In contrast, ResNet50 has the highest number of parameters and FLOPs, 4.2 M and 0.67 B, respectively, suggesting a higher computational complexity. Therefore, for the proposed DCFM, MobileNetV2 was chosen as the backbone of spatial feature extraction, which has a lower number of parameters and better computational speed for this architecture. In terms of inference time, traditional machine learning methods (SVM, PSOSVM, and RF) significantly outperformed the deep learning models. SPA-RF takes only 0.08 ms, which is 5.5 times faster than the fastest deep learning model (MobileNetV2, 0.44 ms). However, DCFM may obtain higher classification accuracy through feature fusion, and thus was more advantageous in terms of overall performance.

4. Discussion

Rice blast poses a serious threat to rice production, potentially leading to significant yield losses or possibly crop collapse [37]. Efficient and precise monitoring and control of rice blast are crucial for increasing rice production and quality. HSI is an emerging technology that has been widely applied in disease detection and agriculture due to its non-destructive, quick, and precise qualities.

4.1. Physiological Relevance and Mechanistic Interpretation of Selected Spectral Features

To eliminate the effect of nonlinear distortions and noise caused by the environment and equipment in the spectral images, and to obtain more accurate data, the Savitzky–Golay (SG) filter with nine points was first used to calibrate and process hyperspectral images [38]. Identifying the correct spectral features is essential for recognizing abnormal areas and disease lesions [39], as shown by the spectral reflectance curves corresponding to the different types of ROIs in 
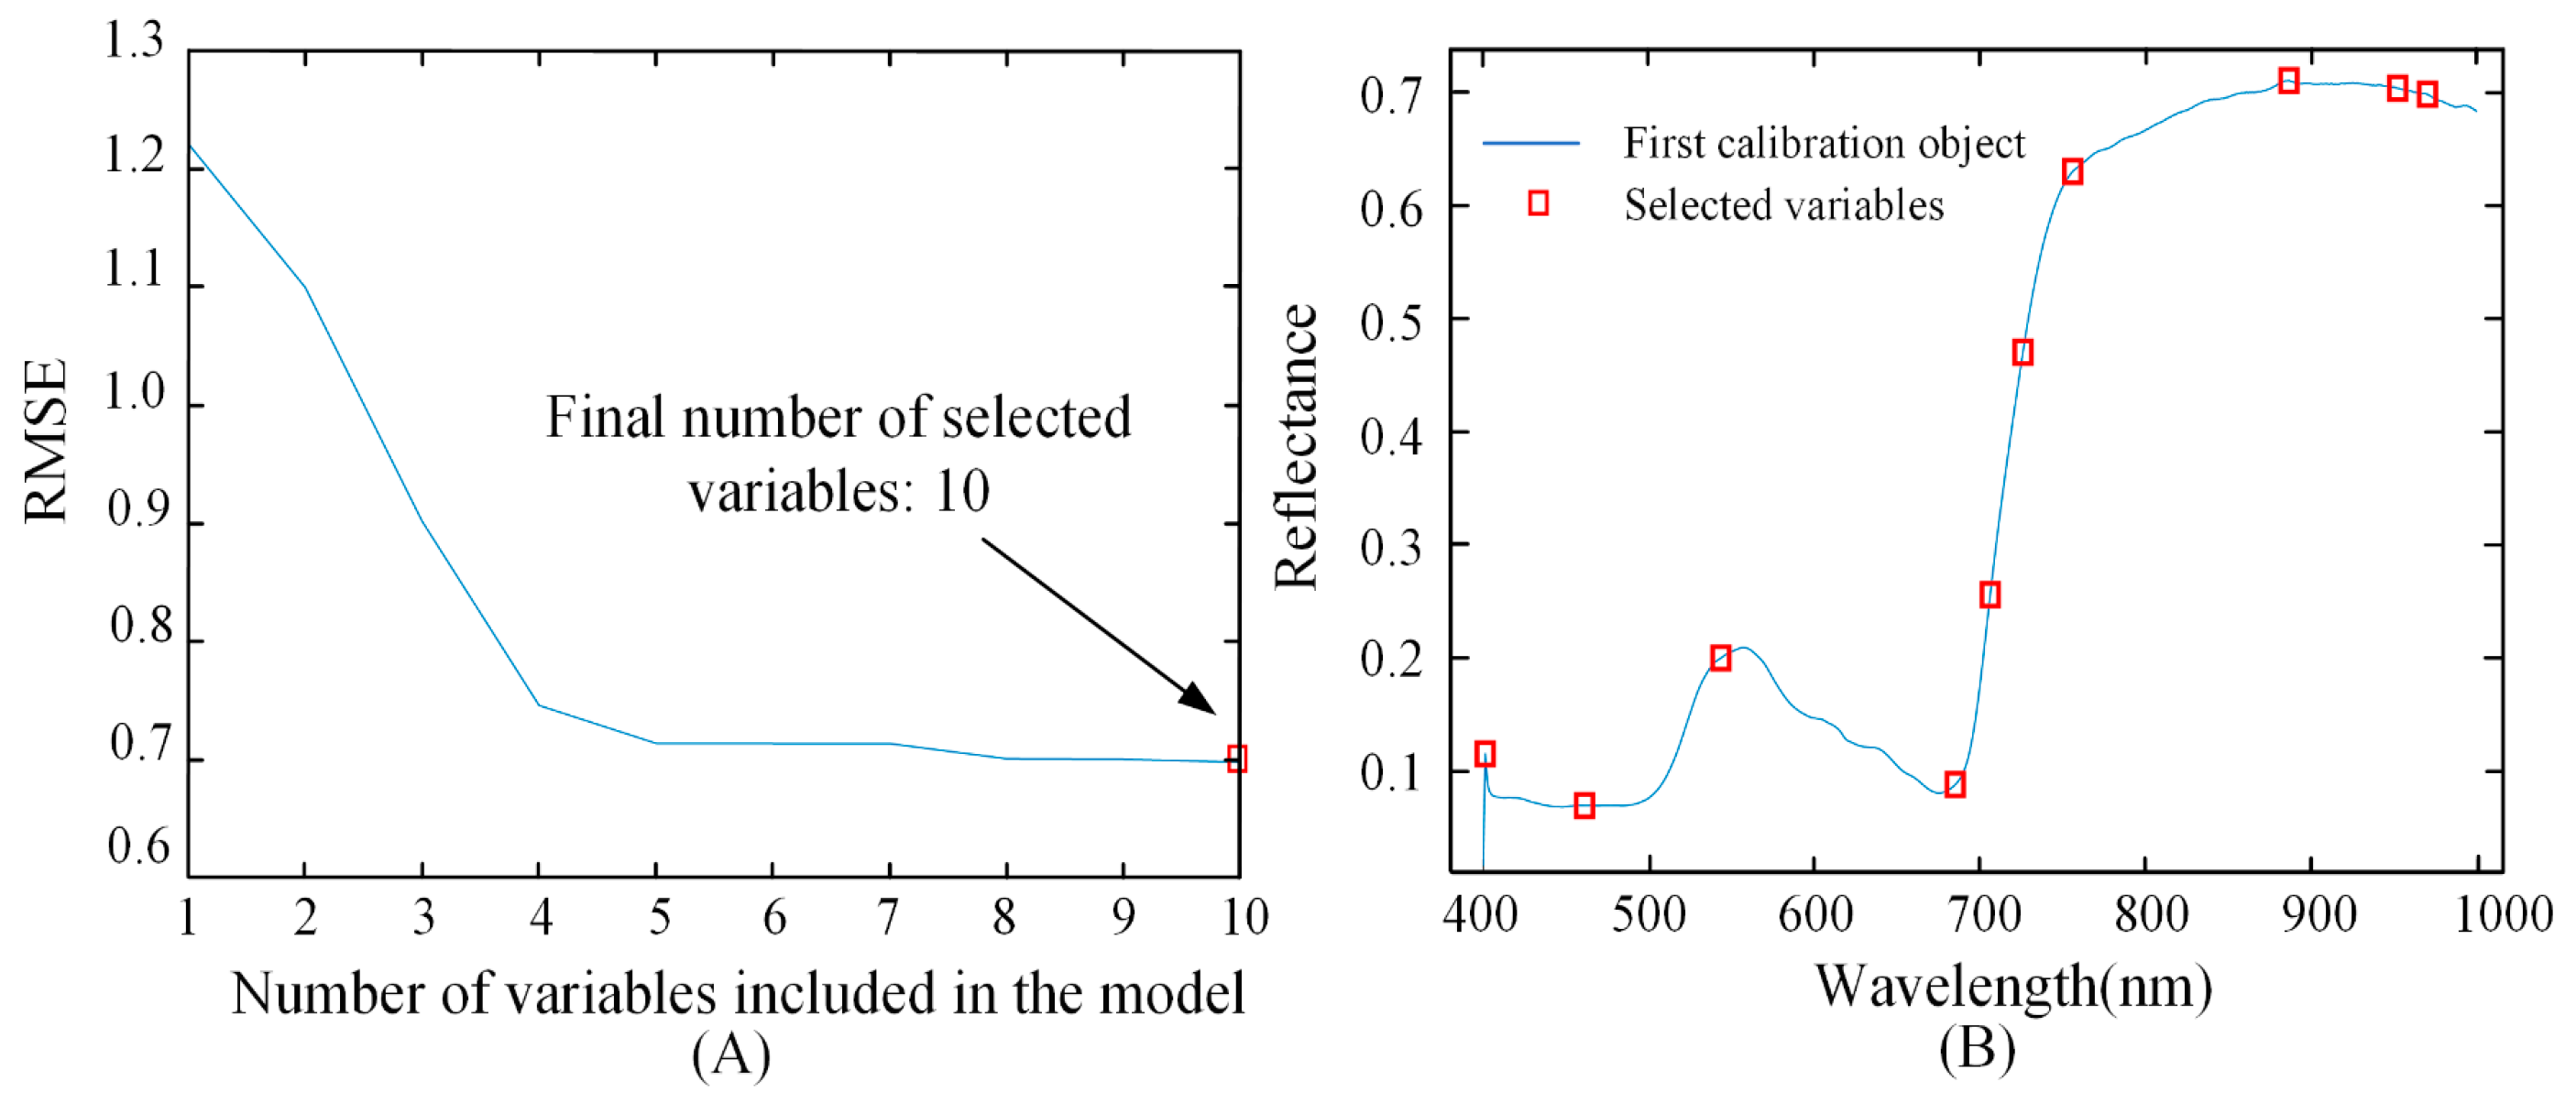
Figure 7. Therefore, after pre-processing, the high-dimensional spectral data were analyzed to find characteristic wavelengths using SPA, RFrog, and CARS. As can be seen from Table 3, there were some differences in the wavelengths extracted by the three feature selection methods, but all of them were highly concentrated in the red-edge and NIR region. Specifically, seven of the ten characteristic wavelengths (685–973 nm) extracted by the SPA method were located in the red-edge and NIR bands. Similarly, 11 of the 18 wavelengths (648–961 nm) extracted by the RFrog method belong to the same wavelengths, while 44 of the 59 characteristic wavelengths (630–990 nm) extracted by the CARS method were in the red-edge and NIR bands. The red-edge band, located between 630–720 nm, was a unique spectral wavelength between the red absorption maximum and high reflectance [40], reflecting the conversion process between chlorophyll absorption and sheet scattering. Horler et al. [41] identified a peak, about 720 nm, attributed to leaf reflection scattering properties by derivative analysis. Table 3 shows that all three methods selected wavelengths near this peak, 726 nm, 721 nm, and 718 nm, respectively. In addition, the red-edge band was selected frequently, probably due to a decrease in leaf chlorophyll content caused by rice blast, which resulted in a shift of the red-edge position to shorter wavelengths (blueshift), a spectral change that provides reliable feature support for early disease detection [42]. With the deepening of the infestation process, the infestation filaments gradually penetrated the interior of the leaf cells, leading to a decrease in the reflective ability of water in the leaf to the NIR band and a weakening of the cellular water-holding capacity. At the same time, the plant produces reactive oxygen species (e.g., hydrogen peroxide) and deposits cellulose at the site of infection, eventually triggering tissue necrosis. Therefore, the selected characteristic wavelengths were highly concentrated in the NIR region, reflecting the sensitive response of water changes to spectral features [43].

4.2. Performance Assessment of Rice Blast Recognition Based on Spectral–Spatial Feature Fusion

Previous studies demonstrated that combining spectral features with image textural features enabled the identification of rice blast [44,45]. In contrast, the DCFM model proposed in this study directly input two-dimensional hyperspectral images, after PCA-based dimensionality reduction, into the network. MobileNetV2 was employed to extract spatial information, and the CBAM module was introduced to capture dependencies between spatial neighborhoods and salient features of the input feature maps. This enabled the model to extract more important spatial features. The last SoftMax layer of MobileNetV2 was removed, so its final output was the spatial information features of the image, eliminating the need to extract texture and shape features separately. Spatial features were mapped to one-dimensional data using a fully connected layer, which was then used for subsequent feature fusion with spectral data. This method utilized both spectral and image data obtained from hyperspectral images, enabling the simultaneous consideration of structural differences and spectral features associated with rice blast to improve classification accuracy. Based on different input features, three DCFM models were constructed, with the OA and Kappa being higher than 90% and 88%, respectively.
To further evaluate the classification model, the proposed DCFM model was compared to SVM, PSOSVM, RF, ResNet50, and MobileNetV2. The OA, Kappa, and F1-score of these models were lower than those of the DCFM model. When combined with the SPA feature extraction method, the DCFM achieved its best performance, with an OA of 96.72% and a Kappa coefficient of 95.97%. Additionally, it exhibited high precision in detailed disease classification, with accuracies of 94.48%, 99.42%, 95.03%, 94.53%, and 100% for levels 0, 1, 2, 3, and 4, respectively. Firstly, this may be because SPA selected fewer but more representative feature dimensions. It retained a set of wavelengths with minimal information redundancy among bands in the spectral data and effectively avoided multicollinearity. In contrast, CARS tended to select a set of spectral characteristic wavelengths that were highly correlated with the classification results. However, its stability was easily affected by the adaptive resampling strategy, resulting in a slightly lower performance compared to the SPA-based model. RFrog was a probability-based feature selection method, which was more likely to introduce redundant wavelengths or noise while capturing potential information. This reduced the purity of the feature set and weakened the model’s generalization ability, making its overall performance the poorest among the three methods. In addition, the spatial attention mechanism added to the convolutional neural network emphasized important features and suppressed irrelevant information. This enhanced the network’s capacity to extract features and facilitated the fusion of spatial and spectral features, thereby enabling the proposed model to achieve superior classification accuracy and robustness. This proved that the dual-channel feature fusion method in this study was effective and superior in rice blast classification.
Figure 13A–C show the prediction results of the fusion feature model compared to the actual categories. Figure 13D–L present the prediction results of models based solely on spectral features, while Figure 13M,N illustrate the results for models using only image features. When using spectral or image features alone, the model’s misclassification on the mild disease levels (levels 1–3) was more obvious, indicating that the models have a problem of recognition ambiguity in identifying the early stages of the disease. In contrast, the number of missed and misclassified judgments by DCFM was significantly reduced. This indicated that the fused spatial information provided the model with more discriminative features. This enhanced the practicality and promotion potential of the DCFM model in complex field environments.

4.3. Advantages and Limitations

In small and medium sample data scenarios, complex feature fusion mechanisms may trigger problems such as unstable model training. To balance model performance and computational efficiency, this study adopted a simple tandem strategy to fuse the spectral features with the spatial features that were mapped into one-dimensional vectors. Although fusion methods based on the attention mechanism or weighted combination can theoretically enhance the interaction and representation between different features, they tend to incur huge computational costs. In practical agricultural applications, the model can be integrated into hyperspectral imaging systems and deployed on ground monitoring platforms or handheld portable devices for real-time field monitoring. Due to the low computational complexity of the model, it is suitable for resource-constrained agricultural production environments.
Meanwhile, it is undeniable that the number of training samples for different complex field environments has an important impact on the performance of deep learning models. To further improve the generalization ability and recognition accuracy of the rice blast detection model, future research will focus on expanding the sample sources to include rice blast samples from diverse geographical regions, cropping structures, and rice varieties. It will also aim to extend detection from the leaf scale to the canopy scale and incorporate more advanced feature fusion strategies to support broader field-level monitoring and management applications.

5. Conclusions

To efficiently and non-destructively identify rice blast levels and fully exploit the potential of HSI data, a dual-channel deep learning model (DCFM) combined with HSI was proposed. The model combined the CBAM spatial feature extraction module with MobileNetV2 to extract image features from rice samples, and then fused these features using a feature fusion adaptive conditioning module to classify rice blast. Compared to classical machine learning (SVM, PSOSVM, and RF) and deep learning (ResNet50 and MobileNetV2), DCFM achieved higher classification accuracy in disease classification. Among them, the combination of SPA and the DCFM model obtained the best identification performance, with an OA of 96.72% and a Kappa of 95.97%. Compared to classical algorithms using single features, spectral–spatial feature fusion better discriminated the differences between diseased rice samples of different varieties. The improvement highlighted the necessity and effectiveness of incorporating spatial information. This also provided a valuable reference for the accurate classification of other rice diseases using HSI. Additionally, the roles of different wavelengths and spatial information in the final classification are not equivalent. Therefore, constructing a spectral–spatial attention enhancement module using attention mechanisms to automatically highlight salient spectral features and spatial correlations between neighboring pixels is a direction worth further exploring.

Author Contributions

Conceptualization, Y.Q. and T.L.; methodology, Y.Q. and T.L.; software, Y.Q. and S.G.; validation, S.G. and W.Y.; formal analysis, S.G.; investigation, Q.Y.; resources, T.X.; data curation, Y.Q. and P.W.; writing—original draft preparation, Y.Q.; writing—review and editing, Y.Q., Q.Y. and T.L.; visualization, Y.Q., P.W. and J.M.; supervision, T.L., W.Y. and T.X.; project administration, T.L.; funding acquisition, T.L. and T.X. All authors have read and agreed to the published version of the manuscript.

Funding

This research was funded by the National Key R&D Program of China (2022YFD2002303-01, 2024YFD1501500), Liaoning Provincial Science and Technology Department Project (2023-MS-212).

Institutional Review Board Statement

Not applicable.

Data Availability Statement

The data presented in this study are available on request from the corresponding author.

Conflicts of Interest

The authors declare no conflicts of interest.

References

  1. Peng, S.; Tang, Q.; Zou, Y. Current Status and Challenges of Rice Production in China. Plant Pro. Sci. 2009, 12, 3–8. [Google Scholar] [CrossRef]
  2. Fukai, S.; Cooper, M. Development of Drought-Resistant Cultivars Using Physiomorphological Traits in Rice. Field Crops Res. 1995, 40, 67–86. [Google Scholar] [CrossRef]
  3. Hossain, M.; Ali, M.; Hossain, D. Occurrence of Blast Disease in Rice in Bangladesh. Am. J. Agric. Sci. 2017, 4, 74–80. [Google Scholar]
  4. Neupane, N.; Bhusal, K. A Review of Blast Disease of Rice in Nepal. J. Plant Pathol. Microbiol. 2020, 11, 528. [Google Scholar] [CrossRef]
  5. Bonman, J.; Estrada, B.; Bandong, J. Leaf and Neck Blast Resistance in Tropical Lowland Rice Cultivars. Plant Dis. 1989, 73, 388–390. [Google Scholar] [CrossRef]
  6. Larijani, M.R.; Asli-Ardeh, E.A.; Kozegar, E.; Loni, R. Evaluation of Image Processing Technique in Identifying Rice Blast Disease in Field Conditions Based on KNN Algorithm Improvement by K-Means. Food Sci. Nutr. 2019, 7, 3922–3930. [Google Scholar] [CrossRef] [PubMed]
  7. Zarbafi, S.S.; Rabiei, B.; Ebadi, A.A.; Ham, J.H. Statistical Analysis of Phenotypic Traits of Rice (Oryza Sativa L.) Related to Grain Yield under Neck Blast Disease. J. Plant Dis. Prot. 2019, 126, 293–306. [Google Scholar] [CrossRef]
  8. Zhang, Y.; Hao, X.; Li, F.; Wang, Z.; Li, D.; Li, M.; Mao, R. Unsupervised Domain Adaptation Semantic Segmentation Method for Wheat Disease Detection Based on UAV Multispectral Images. Comput. Electron. Agric. 2025, 236, 110473. [Google Scholar] [CrossRef]
  9. Liu, T.; Qi, Y.; Yang, F.; Yi, X.; Guo, S.; Wu, P.; Yuan, Q.; Xu, T. Early Detection of Rice Blast Using UAV Hyperspectral Imagery and Multi-Scale Integrator Selection Attention Transformer Network (MS-STNet). Comput. Electron. Agric. 2025, 231, 110007. [Google Scholar] [CrossRef]
  10. Sankaran, S.; Mishra, A.; Ehsani, R.; Davis, C. A Review of Advanced Techniques for Detecting Plant Diseases. Comput. Electron. Agric. 2010, 72, 1–13. [Google Scholar] [CrossRef]
  11. Abdulridha, J.N.; Ampatzidis, Y.; Kakarla, S.C.; Roberts, P.D. Detection of Target Spot and Bacterial Spot Diseases in Tomato Using UAV-Based and Benchtop-Based Hyperspectral Imaging Techniques. Precis. Agric. 2019, 21, 955–978. [Google Scholar] [CrossRef]
  12. Wu, G.; Fang, Y.; Jiang, Q.; Cui, M.; Li, N.; Ou, Y.; Diao, Z.; Zhang, B. Early Identifica-tion of Strawberry Leaves Disease Utilizing Hyperspectral Imaging Combing with Spectral Features, Multiple Vegetation Indices and Textural Features. Comput. Electron. Agric. 2023, 204, 107553. [Google Scholar] [CrossRef]
  13. Hu, G.; Yao, P.; Wan, M.; Bao, W.; Zeng, W. Detection and Classification of Diseased Pine Trees with Different Levels of Severity from UAV Remote Sensing Images. Ecol. Inform. 2022, 72, 101844. [Google Scholar] [CrossRef]
  14. Nazari, K.; Ebadi, M.J.; Berahmand, K. Diagnosis of Alternaria Disease and Leafminer Pest on Tomato Leaves Using Image Processing Techniques. J. Sci. Food Agric. 2022, 102, 6907–6920. [Google Scholar] [CrossRef]
  15. Ahila, A.; Prema, V.; Ayyasamy, S.; Sivasubramanian, M. An Enhanced Deep Learning Model for High-Speed Classification of Plant Diseasesz0066 with Bioinspired Algorithm. J. Supercomput. 2024, 80, 3713–3737. [Google Scholar] [CrossRef]
  16. Wang, H.; Nguyen, T.-H.; Nguyen, T.N.; Dang, M. PD-TR: End-to-End Plant Diseases Detection Using a Transformer. Comput. Electron. Agric. 2024, 224, 109123. [Google Scholar] [CrossRef]
  17. Nagaraju, M.; Chawla, P.; Upadhyay, S.; Tiwari, R. Convolution Network Model Based Leaf Disease Detection Using Augmentation Techniques. Expert Syst. 2022, 39, e12885. [Google Scholar] [CrossRef]
  18. You, S.; Li, Y.; Song, J.; Yu, X.; Tu, K.; Lan, W.; Pan, L. Evaluating the Microstructure and Physicochemical Properties of ‘Korla’ Fragrant Pear Disease Caused by Alternaria Alternata: Vis-NIR Hyperspectral Microscope Imaging Coupled with Convolutional Neural Network. Postharvest Biol. Technol. 2024, 212, 112913. [Google Scholar] [CrossRef]
  19. Chun, S.-W.; Song, D.-J.; Lee, K.-H.; Kim, M.-J.; Kim, M.S.; Kim, K.-S.; Mo, C. Deep Learning Algorithm Development for Early Detection of Botrytis Cinerea Infected Strawberry Fruit Using Hyperspectral Fluorescence Imaging. Postharvest Biol. Technol. 2024, 214, 112918. [Google Scholar] [CrossRef]
  20. Gui, J.; Fei, J.; Wu, Z.; Fu, X.; Diakite, A. Grading Method of Soybean Mosaic Disease Based on Hyperspectral Imaging Technology. Inf. Process. Agric. 2021, 8, 380–385. [Google Scholar] [CrossRef]
  21. Qi, C.; Sandroni, M.; Cairo Westergaard, J.; Høegh Riis Sundmark, E.; Bagge, M.; Alexandersson, E.; Gao, J. In-Field Classification of the Asymptomatic Biotrophic Phase of Potato Late Blight Based on Deep Learning and Proximal Hyperspectral Imaging. Comput. Electron. Agric. 2023, 205, 107585. [Google Scholar] [CrossRef]
  22. Bu, Y.; Hu, J.; Chen, C.; Bai, S.; Chen, Z.; Hu, T.; Zhang, G.; Liu, N.; Cai, C.; Li, Y.; et al. ResNet Incorporating the Fusion Data of RGB & Hyperspectral Images Improves Classification Accuracy of Vegetable Soybean Freshness. Sci. Rep. 2024, 14, 2568. [Google Scholar] [CrossRef]
  23. Chen, S.; Lu, X.; Fang, H.; Perumal, A.B.; Li, R.; Feng, L.; Wang, M.; Liu, Y. Early Surveillance of Rice Bakanae Disease Using Deep Learning and Hyperspectral Imaging. Abiotech 2024, 5, 281–297. [Google Scholar] [CrossRef]
  24. Zhao, D.; Feng, S.; Cao, Y.; Yu, F.; Guan, Q.; Li, J.; Zhang, G.; Xu, T. Study on the Classification Method of Rice Leaf Blast Levels Based on Fusion Features and Adaptive-Weight Immune Particle Swarm Optimization Extreme Learning Machine Algorithm. Front. Plant Sci. 2022, 13, 879668. [Google Scholar] [CrossRef] [PubMed]
  25. Raghavendra, A.; Guru, D.S.; Rao, M.K. Mango Internal Defect Detection Based on Optimal Wavelength Selection Method Using NIR Spectroscopy. Artif. Intell. Agric. 2021, 5, 43–51. [Google Scholar] [CrossRef]
  26. Zhang, M.; Chen, T.; Gu, X.; Kuai, Y.; Wang, C.; Chen, D.; Zhao, C. UAV-Borne Hyperspectral Estimation of Nitrogen Content in Tobacco Leaves Based on Ensemble Learning Methods. Comput. Electron. Agric. 2023, 211, 108008. [Google Scholar] [CrossRef]
  27. Li, H.; Liang, Y.; Xu, Q.; Cao, D. Key Wavelengths Screening Using Competitive Adaptive Reweighted Sampling Method for Multivariate Calibration. Anal. Chim. Acta 2009, 648, 77–84. [Google Scholar] [CrossRef]
  28. Li, H.-D.; Xu, Q.-S.; Liang, Y.-Z. Random Frog: An Efficient Reversible Jump Markov Chain Monte Carlo-like Approach for Variable Selection with Applications to Gene Selection and Disease Classification. Anal. Chim. Acta 2012, 740, 20–26. [Google Scholar] [CrossRef]
  29. Wijayanto, A.K.; Prasetyo, L.B.; Hudjimartsu, S.A.; Sigit, G.; Hongo, C. Textural Features for BLB Disease Damage Assessment in Paddy Fields Using Drone Data and Machine Learning: Enhancing Disease Detection Accuracy. Smart Agric. Technol. 2024, 8, 100498. [Google Scholar] [CrossRef]
  30. Balling, J.; Herold, M.; Reiche, J. How Textural Features Can Improve SAR-Based Tropical Forest Disturbance Mapping. Int. J. Appl. Earth Obs. Geoinf. 2023, 124, 103492. [Google Scholar] [CrossRef]
  31. Shaodan, L.; Yue, Y.; Jiayi, L.; Xiaobin, L.; Jie, M.; Haiyong, W.; Zuxin, C.; Dapeng, Y. Application of UAV-Based Imaging and Deep Learning in Assessment of Rice Blast Resistance. Rice Sci. 2023, 30, 652–660. [Google Scholar] [CrossRef]
  32. Woo, S.; Park, J.; Lee, J.-Y.; Kweon, I.S. CBAM: Convolutional Block Attention Module. In Proceedings of the Computer Vision—ECCV, Munich, Germany, 8–14 September 2018; Ferrari, V., Hebert, M., Sminchisescu, C., Weiss, Y., Eds.; Springer International Publishing: Cham, Switzerland, 2018; pp. 3–19. [Google Scholar] [CrossRef]
  33. Zhang, J.; Huang, Y.; Pu, R.; Gonzalez-Moreno, P.; Yuan, L.; Wu, K.; Huang, W. Monitoring Plant Diseases and Pests through Remote Sensing Technology: A Review. Comput. Electron. Agric. 2019, 165, 104943. [Google Scholar] [CrossRef]
  34. Bioucas-Dias, J.M.; Plaza, A.; Camps-Valls, G.; Scheunders, P.; Nasrabadi, N.; Chanussot, J. Hyperspectral Remote Sensing Data Analysis and Future Challenges. IEEE Geosci. Remote Sens. Mag. 2013, 1, 6–36. [Google Scholar] [CrossRef]
  35. Feng, S.; Cao, Y.; Xu, T.; Yu, F.; Zhao, D.; Zhang, G. Rice Leaf Blast Classification Method Based on Fused Features and One-Dimensional Deep Convolutional Neural Network. Remote Sens. 2021, 13, 3207. [Google Scholar] [CrossRef]
  36. Han, L.; Tian, J.; Huang, Y.; He, K.; Liang, Y.; Hu, X.; Xie, L.; Yang, H.; Huang, D. Hyperspectral Imaging Combined with Dual-Channel Deep Learning Feature Fusion Model for Fast and Non-Destructive Recognition of Brew Wheat Varieties. J. Food Compos. Anal. 2024, 125, 105785. [Google Scholar] [CrossRef]
  37. Wu, X.-Y.; Dong, B.; Zhu, X.-M.; Cai, Y.-Y.; Li, L.; Lu, J.-P.; Yu, B.; Cheng, J.-L.; Xu, F.; Bao, J.-D.; et al. SP-141 Targets Trs85 to Inhibit Rice Blast Fungus Infection and Functions as a Potential Broad-Spectrum Antifungal Agent. Plant Commun. 2024, 5, 100724. [Google Scholar] [CrossRef]
  38. Yu, R.; Ren, L.; Luo, Y. Early Detection of Pine Wilt Disease in Pinus Tabuliformis in North China Using a Field Portable Spectrometer and UAV-Based Hyperspectral Imagery. For. Ecosyst. 2021, 8, 44. [Google Scholar] [CrossRef]
  39. Zhang, J.; Tian, Y.; Yan, L.; Wang, B.; Wang, L.; Xu, J.; Wu, K. Diagnosing the Symptoms of Sheath Blight Disease on Rice Stalk with an In-Situ Hyperspectral Imaging Technique. Biosyst. Eng. 2021, 209, 94–105. [Google Scholar] [CrossRef]
  40. Curran, P.J.; Dungan, J.L.; Macler, B.A.; Plummer, S.E. The Effect of a Red Leaf Pigment on the Relationship between Red Edge and Chlorophyll Concentration. Remote Sens. Environ. 1991, 35, 69–76. [Google Scholar] [CrossRef]
  41. Horler, D.N.H.; Dockray, M.; Barber, J. The Red Edge of Plant Leaf Reflectance. Int. J. Remote Sens. 1983, 4, 273–288. [Google Scholar] [CrossRef]
  42. Zheng, Q.; Chen, Y.; Xia, Q.; Zhang, Y.; Li, D.; Jiang, H.; Wang, C.; Zhao, L.; Huang, W.; Dong, Y.; et al. New Hyperspectral Geometry Ratio Index for Monitoring Rice Blast Disease from Leaf Scale to Canopy Scale. Remote Sens. 2024, 16, 4681. [Google Scholar] [CrossRef]
  43. Mandal, N.; Das, D.K.; Sahoo, R.N.; Adak, S.; Kumar, A.; Chinnusamy, V.; Mukherjee, J.; Rajashekara, H.; Ranjan, R.; Das, B. Assessing Rice Blast Disease Severity through Hyperspectral Remote Sensing. J. Agrometeorol. 2022, 24, 241–248. [Google Scholar] [CrossRef]
  44. Guo, W.; Gong, Z.; Gao, C.; Yue, J.; Fu, Y.; Sun, H.; Zhang, H.; Zhou, L. An Accurate Monitoring Method of Peanut Southern Blight Using Unmanned Aerial Vehicle Remote Sensing. Precis. Agric. 2024, 25, 1857–1876. [Google Scholar] [CrossRef]
  45. Zeng, T.; Zhang, H.; Li, Y.; Yin, C.; Liang, Q.; Fang, J.; Fu, W.; Wang, J.; Zhang, X. Monitoring the Severity of Rubber Tree Infected with Powdery Mildew Based on UAV Multispectral Remote Sensing. Forests 2023, 14, 717. [Google Scholar] [CrossRef]
Figure 1. Study site.
Agriculture 15 01673 g001
Figure 2. Ground images of rice blast at different levels of disease severity.
Agriculture 15 01673 g002
Figure 3. Hyperspectral imaging system: (1) CCD camera; (2) hyperspectral imaging spectrometer; (3) lens; (4) light source controller; (5) light source; (6) moving table; (7) displacement controller; (8) computer.
Agriculture 15 01673 g003
Figure 4. Structure of the DCFM model.
Agriculture 15 01673 g004
Figure 5. Hybrid attention mechanism structure.
Agriculture 15 01673 g005
Figure 6. Spatial local convolutional network structure.
Agriculture 15 01673 g006
Figure 7. Comparison of average leaf reflectance curves. (A) Average leaf reflectance curves of diseases at 400 to 1000 nm; (B) average leaf reflectance curves of diseases at 630 to 720 nm.
Agriculture 15 01673 g007
Figure 8. Principal component images of rice leaves.
Agriculture 15 01673 g008
Figure 9. Selection process of wavelengths using SPA. (A) RMSE screen plot for determining the number of effective wavelengths; (B) distribution of effective wavelengths marked by each square.
Agriculture 15 01673 g009
Figure 10. Extraction of characteristic wavelengths by RFrog, CARS. (A) RFrog; (B) CARS.
Agriculture 15 01673 g010
Figure 11. Feature map. (A) MobileNetV2; (B) ResNet50.
Agriculture 15 01673 g011
Figure 12. Accuracy heat map.
Agriculture 15 01673 g012
Figure 13. Confusion matrix for classification models with different input features.
Agriculture 15 01673 g013
Table 1. Disease classification standards and sample size statistics.
Disease LevelStandards for Spot LevelSize
Level 0No disease spots.96
Level 1Disease spot area less than 1% of leaf area.174
Level 2Disease spot area of 1~5% of leaf area.138
Level 3Disease spot area of 5~10% of leaf area.92
Level 4Disease spot area of 10~50% of leaf area.96
Table 2. MobilenetV2 model structure.
InputOperatortcns
2242 × 3Conv2d-3212
1122 × 32bottlenneck61611
1122 × 16bottlenneck62422
562 × 24bottlenneck63232
284 × 32bottlenneck66442
142 × 64bottlenneck69631
142 × 96bottlenneck616032
72 × 160bottlenneck632011
72 × 320Conv2d1 × 1-128011
72 × 1280avgpool1 × 1--1-
1 × 1 × 32Conv2d1 × 1-k--
Note: t is the multiplication factor, c is the number of output channels, n is the number of repetitions of the module, and s is the step size of the first layer of each module.
Table 3. Spectral characteristic wavelength screening results.
MethodCharacteristic Wavelengths/nm
SPA401, 461, 543, 685, 706, 726, 756, 887, 983, 973
RFrog514, 536, 547, 549, 572, 604, 623, 648, 674, 721, 736, 764, 773, 871, 917, 922, 925, 961
CARS402, 410, 413, 418, 517, 543, 547, 548, 552, 572, 574, 575, 576, 622, 629, 630, 631, 632, 648, 649, 718, 752, 753, 764, 792, 794, 799, 803, 805, 816, 832, 836, 838, 865, 874, 890, 891, 893, 894, 895, 896, 903, 912, 923, 927, 938, 944, 946, 950, 959, 965, 966, 972, 974, 975, 976, 987, 988, 990
Table 4. Recognition results under single spectral features input.
MethodsSVMPSOSVMRF
OA (0%)Kappa(%)F1-Score (%)OA (%)Kappa (%)F1-Score (%)OA (%)Kappa (%)F1-Score (%)
SPA91.9490.0492.8394.3192.9794.1488.9986.4186.79
RFrog88.6085.9188.6987.3684.5587.8288.9986.3888.70
CARS88.2785.5488.9091.7489.8091.1092.6690.9493.09
Table 5. Recognition results under single image data input.
Input FeaturesMethodsOA (%)Kappa (%)F1-Score (%)
ImageResNet5085.8182.4384.04
MobileNetV286.9083.8286.11
Table 6. Results of DCFM based on different features.
Input FeaturesPrecision (%)OA (%)Kappa (%)F1-Score (%)
Level 0Level 1Level 2Level 3Level 4
SPA+ Image94.4899.4295.0394.5310096.7295.9796.42
RFrog+ Image94.2698.3387.9291.2310090.8888.7990.53
CARS+ Image95.3795.7694.9291.8410094.7493.5594.47
Table 7. Comparison of model sizes and inference times of different models.
MethodsParameters/MillionFLOPs/BillionInferencing Time (s)
SPA+ Image-DCFM3.90.390.46
Image-ResNet504.20.670.58
Image-MobileNetV23.50.310.44
SPA-SVM--0.11
SPA-PSOSVM--0.17
SPA-RF--0.08
Disclaimer/Publisher’s Note: The statements, opinions and data contained in all publications are solely those of the individual author(s) and contributor(s) and not of MDPI and/or the editor(s). MDPI and/or the editor(s) disclaim responsibility for any injury to people or property resulting from any ideas, methods, instructions or products referred to in the content.

