1. Introduction
Wheat powdery mildew, caused by
Blumeria graminis f. sp.
tritici, is a devastating fungal disease that severely impacts global wheat production. By impairing leaf photosynthesis, the disease causes premature plant senescence, reduces grain filling efficiency, and leads to significant yield losses ranging from 10% to 50% [
1], along with substantial deterioration in grain quality. The pathogen also decreases thousand-grain weight by 10–20% [
2], compromises flour quality, and reduces the nutritional value and market competitiveness of wheat grains. Effective disease control requires an integrated strategy incorporating resistant cultivars, optimized field management, and timely fungicide application. Precise identification and severity assessment of powdery mildew infection are particularly critical, enabling farmers to minimize yield losses, optimize control measures, improve pesticide application efficiency, and prevent reductions in thousand-grain weight [
3]. Furthermore, accurate disease evaluation facilitates the development of resistant varieties, supports precision agriculture implementation, and enhances the economic sustainability of wheat production systems. Current disease severity grading methods, while fundamental for diagnosis and control decisions, predominantly rely on manual visual assessment [
4]. These conventional approaches are not only time-consuming and labor-intensive but also subjective and inconsistent, making them unsuitable for large-scale cultivation systems requiring rapid and accurate disease diagnosis. This pressing challenge highlights the urgent need for innovative solutions leveraging advanced computer vision and deep learning technologies to revolutionize disease identification and severity assessment in modern agriculture.
The rapid evolution of artificial intelligence and deep learning technologies has brought transformative progress to agricultural disease identification [
5]. This field has witnessed a paradigm shift from manual assessment to automated, intelligent detection systems. Modern image recognition techniques, powered by machine learning and deep learning architectures, can efficiently process large-scale image datasets [
6], offering unprecedented advantages in terms of processing speed, detection accuracy, operational objectivity, and non-destructive analysis [
7]. These capabilities provide essential technological foundations for real-time disease monitoring and assessment. Current methodologies in plant disease image recognition primarily fall into two categories: traditional machine learning and deep learning approaches [
8]. The conventional machine learning pipeline involves manual feature extraction, where experts identify and isolate key visual characteristics such as color histograms, texture patterns, and edge contours from images [
9]. These handcrafted features are then processed using various machine learning algorithms, including principal component analysis (PCA) for dimensionality reduction, support vector machines (SVM) for classification, AdaBoost for ensemble learning, and K-means clustering for pattern recognition [
10,
11,
12,
13], ultimately enabling automated disease identification and severity assessment. For instance, Sowmiya et al. [
14] proposed an Improved Quantum Whale Optimization Algorithm integrated with Principal Component Analysis (IQWO-PCA) to analyze tomato disease image datasets using a machine learning (ML) model, thereby facilitating the adoption of effective preventive measures against this agricultural threat. Piyush et al. [
15] attained a diagnostic accuracy of 98% in the automated identification of apple fruit and apple tree diseases by integrating a comprehensive feature extraction module with a Support Vector Machine (SVM) model encoded by an optimally constrained Restricted Boltzmann Machine (RBM). Shedthi et al. [
16] developed a plant disease recognition framework that leveraged image processing and machine learning techniques. Their system employed a hybrid clustering algorithm—combining a Genetic Algorithm with K-means—for image segmentation and utilized an Artificial Neural Network (ANN) for disease classification. Although these approaches based on handcrafted feature extraction have achieved notable improvements in plant disease detection, they still exhibit inherent limitations. These include a strong reliance on manual feature engineering, difficulties in handling high-dimensional and sparse data, limited ability to model complex non-linear relationships, poor scalability to large datasets, and dependence on extensive labeled data for training.
In recent years, with the rapid advancement of deep learning technologies, models such as UNet [
17], ResNet [
18], and L-CSMS [
19] have been increasingly employed in crop disease recognition. These methods enable the autonomous extraction of image features and optimize the training process, thereby significantly enhancing the performance and accuracy of plant disease identification tasks [
20]. For example, Deng et al. [
21] proposed a leaf blight segmentation model based on an improved VCDM-UNet. By analyzing the segmentation output, they quantified the proportion of diseased areas relative to total leaf area to perform disease severity grading, achieving an average grading accuracy of 83.95%. Zhang et al. [
22] introduced the GhostNetV2 feature extraction module into the YOLOv8 architecture and constructed the GSGF model for grape leaf disease recognition, which attained an accuracy of 97.1% in tomato disease classification. Jiang et al. [
23] developed a tea leaf disease detection method based on an enhanced Faster R-CNN algorithm, utilizing ResNet50 as the backbone integrated with a Feature Pyramid Network (FPN), achieving an average precision (PmA) of 88.06%. Yang [
24] employed a combination of MobileNetV2 and the Large Margin Nearest Neighbor (LMNN) algorithm for wheat blast severity classification, resulting in a 3.5% improvement in accuracy over the baseline MobileNetV2 model. Similarly, Picon et al. [
25] applied an improved ResNet architecture for the classification of European wheat diseases, achieving an accuracy of 87%. These studies demonstrate that deep learning approaches—through architectural augmentations—significantly improve the model’s capability to autonomously learn complex and subtle disease features, thereby eliminating the need for labor-intensive manual feature engineering that is typical in traditional machine learning methods [
26]. This principle underpins the methodology adopted in this study for the classification of wheat powdery mildew severity levels.
The primary objective of this study was to accurately classify the severity levels of wheat powdery mildew on individual leaf blades, with particular emphasis on the early detection of infections when visible symptoms are minimal or absent. To this end, a dataset comprising 532 RGB images of single wheat leaves was collected using a digital mobile phone during the irrigation stage. These images were annotated and categorized based on the severity grading standard defined in GBT 17980.22-2000 [
27,
28]. Considering the relatively limited size of the dataset, data augmentation techniques were employed as a preprocessing step to increase the number of training samples, thereby improving model robustness and generalization. The ResNet34 [
29] model was adopted as the backbone for automated feature extraction. To accelerate the training process and enhance feature representation, a transfer learning strategy was incorporated by initializing the network with weights pre-trained on large-scale datasets. Additionally, the Squeeze-and-Excitation (SE) attention mechanism [
30] was integrated into the architecture to improve the model’s sensitivity to salient disease-related features. Meanwhile, the convolutional layer conv1 was modified from 7 × 7 to 3 × 3 with a stride of 1 and padding of 1, in order to better capture the texture and edge details of wheat leaves. Subsequently, the optimal training strategy was determined through hyperparameter tuning experiments, and GrabCut-based background processing along with data augmentation was introduced to enhance the model’s robustness. In addition, interpretability techniques such as channel masking and Grad-CAM were employed to visualize the model’s decision-making process. Based on these augmentations, the QY-SE-MResNet34 model was developed to classify the input leaf images according to powdery mildew severity levels. The model’s performance was evaluated using four metrics: precision (1), recall (2), accuracy (3), and balanced F-score (4) [
31]. The recognition performance of the proposed QY-SE-MResNet34 model was systematically compared with four mainstream deep learning models: ResNet34, ResNet50, VGG16, and MobileNetV2, in order to assess its effectiveness and identify the optimal model for powdery mildew severity classification.
3. Results and Analysis
Section 3 focuses on the training process, performance evaluation, and in-depth analysis of the proposed model.
Section 3.1 introduces the hyperparameter tuning process and identifies key training configurations.
Section 3.2 compares the classification performance of various models to assess the effectiveness of the proposed improvements.
Section 3.3 discusses the impact of image preprocessing and data augmentation on model performance, including background removal, specific parameter settings, and visualized results.
Section 3.4 presents and analyzes the classification results of different models on wheat powdery mildew severity levels.
Section 3.5 conducts ablation experiments to verify the contribution of each improvement module. Finally,
Section 3.6 explores the model’s interpretability and input feature sensitivity through channel masking and Grad-CAM visualization, providing further insights into the model’s decision-making mechanism and feature dependencies.
3.1. Hyperparameter Tuning Experiments
To achieve optimal model training performance, this study conducted tuning experiments on the key hyperparameters of the deep learning model. The setting of hyperparameters significantly affects the stability, convergence speed, and final accuracy of model training. Based on the ResNet34 architecture, we performed a series of combination experiments on three key parameters: learning rate, batch size, and number of epochs. In the tuning process, the accuracy on the validation set was used as the evaluation metric to objectively reflect the model’s generalization ability and avoid overfitting that may result from relying solely on training set performance.
The initial parameter settings were as follows: epoch = 100, batch size = 64, and learning rate = 0.01. On this basis, different combinations of these parameters were adjusted to observe their impact on model performance. The hyperparameter tuning process is shown in
Table 2. From the experimental results, it can be seen that as the number of epochs increases and the batch size and learning rate are adjusted, the model’s accuracy on the validation set gradually improves. Among the tested combinations, the configuration of epoch = 200, batch size = 32, and learning rate = 0.001 achieved the best performance, with a validation accuracy of 76.74%. Therefore, this set of parameters was ultimately adopted for formal training and model comparison experiments.
3.2. Different Models’ Accuracy Analysis
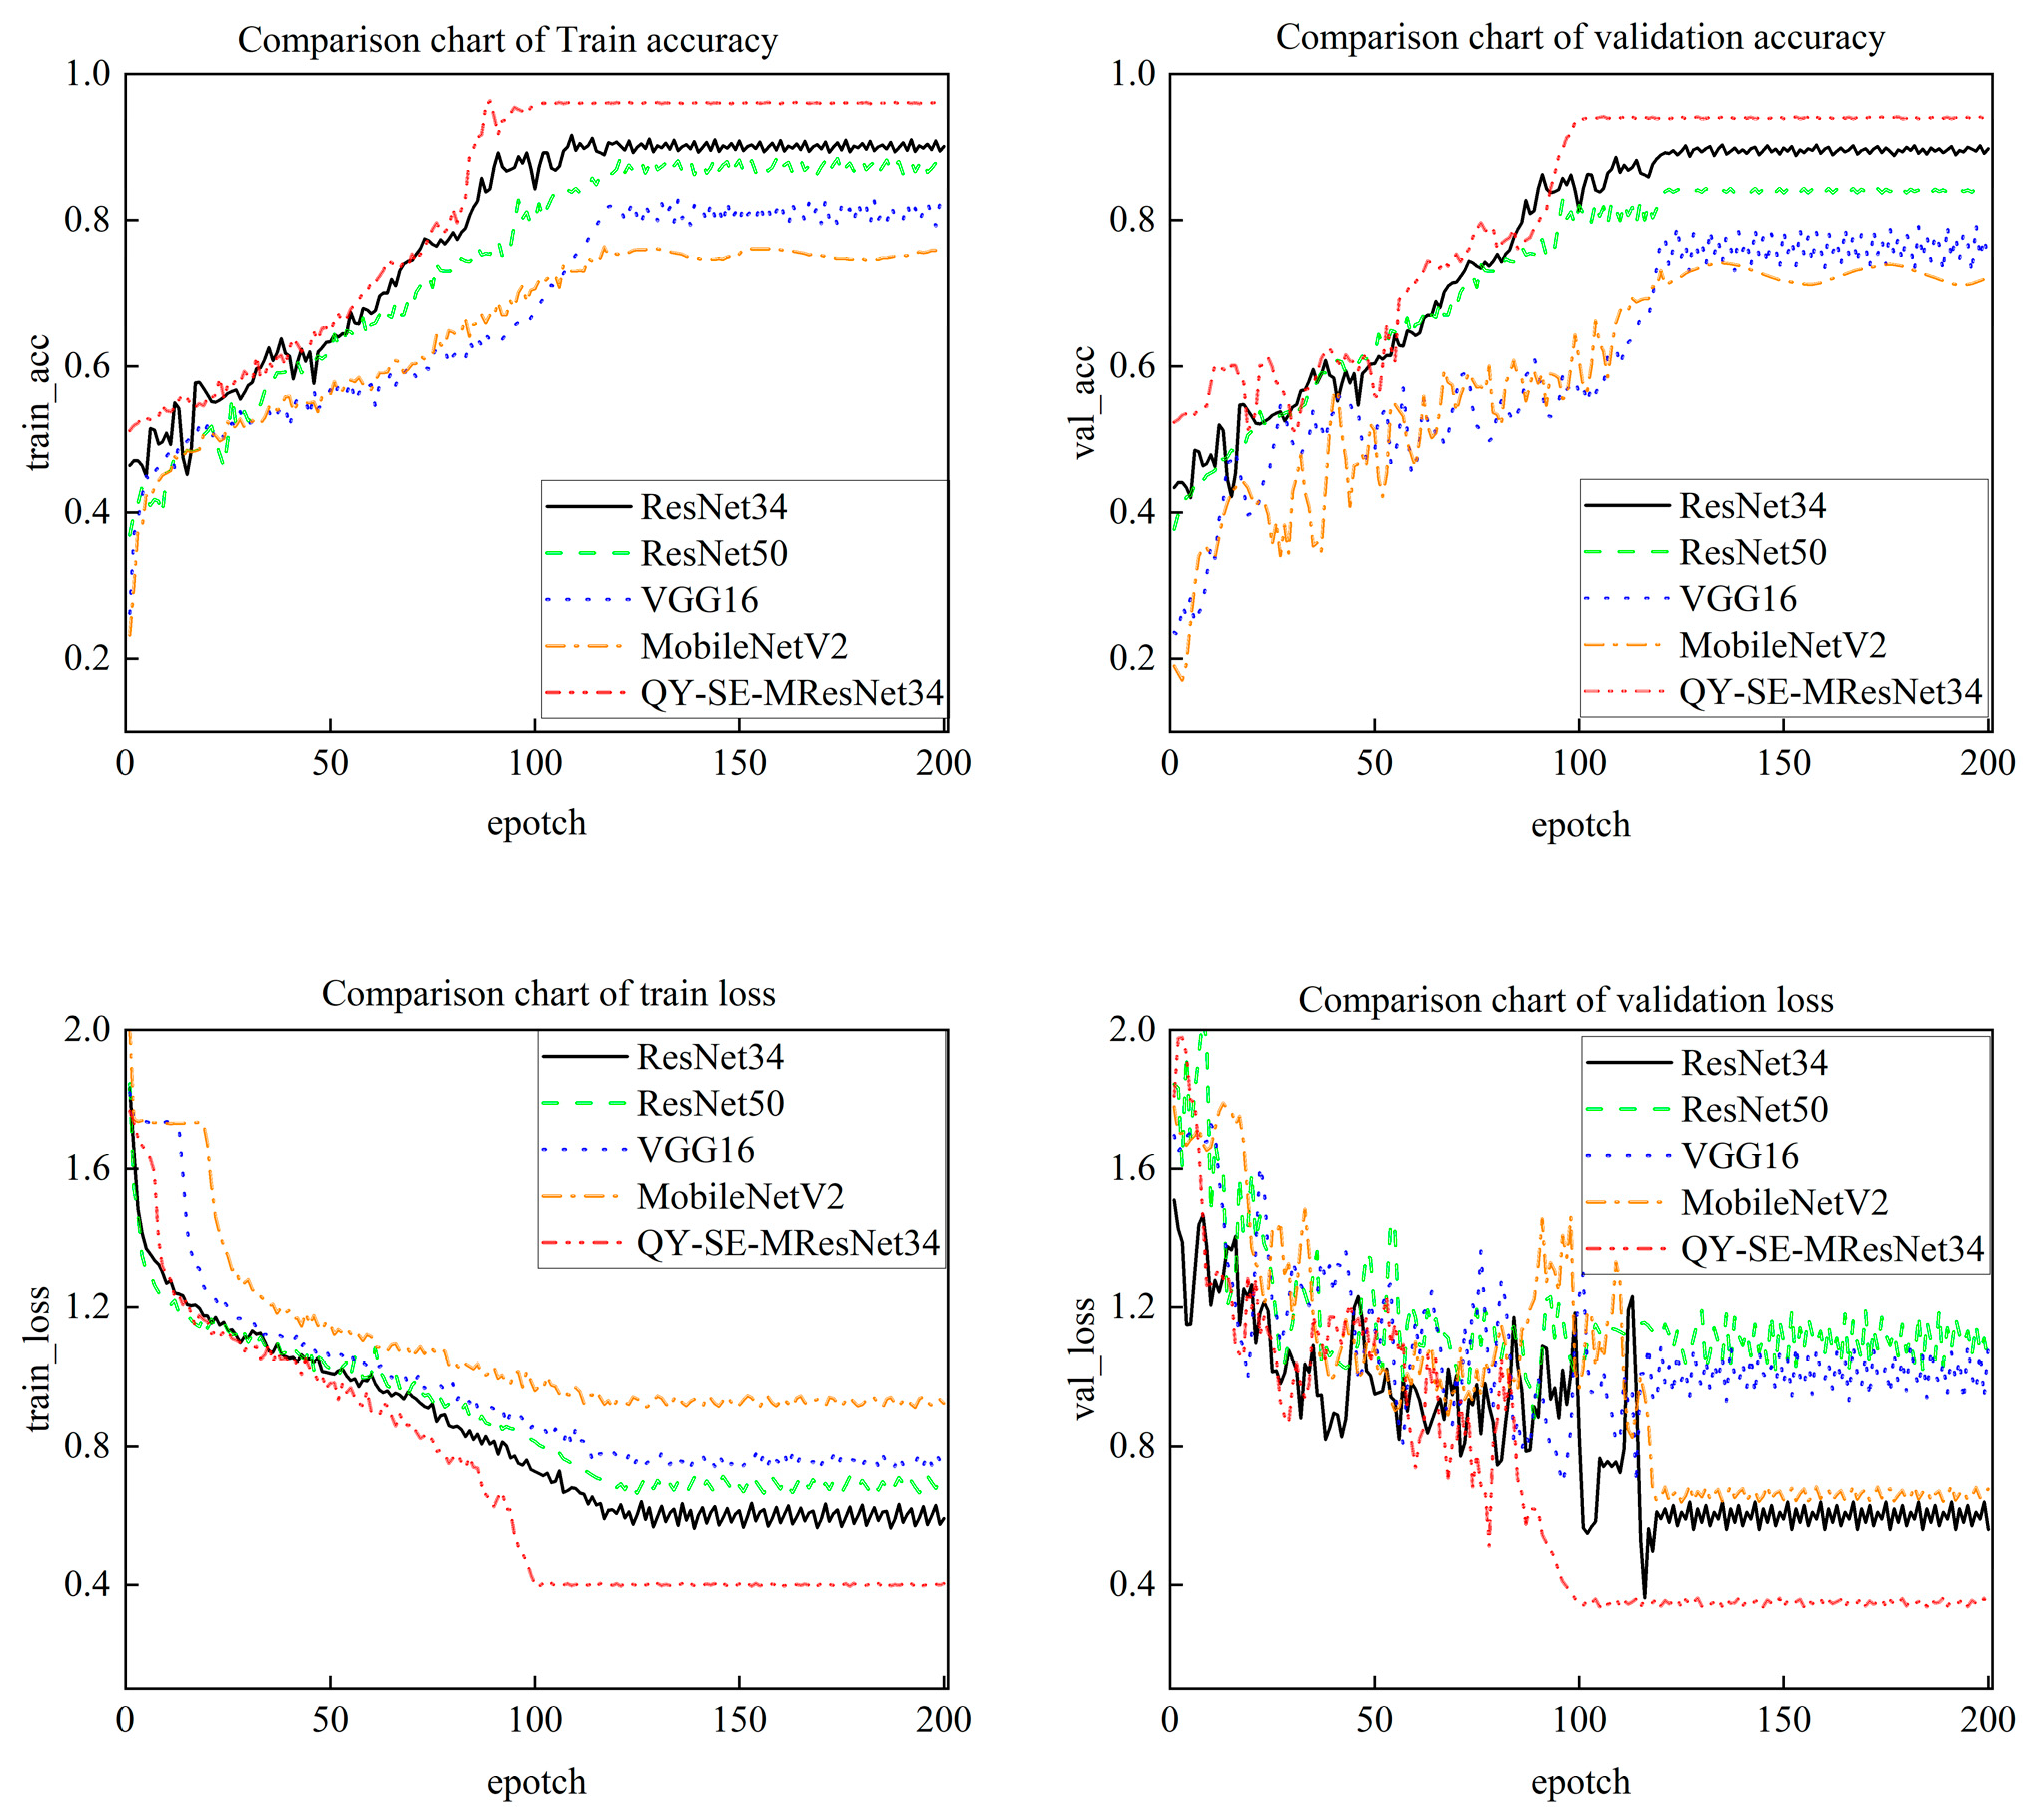
To assess the performance of deep learning models in classifying the severity levels of wheat powdery mildew, a comparative experiment was conducted involving five models: ResNet34, ResNet50, VGG16, MobileNetV2, and the proposed QY-SE-MResNet34. The variations in accuracy and loss values across training epochs for each model are depicted in
Figure 6. As shown, model accuracy generally increases while loss decreases with the number of training epochs, eventually stabilizing as the models converge. This trend reflects the models’ ability to progressively learn discriminative features from the input data, thereby enhancing their classification and recognition capabilities. Among the models evaluated, QY-SE-MResNet34 exhibits the fastest convergence, attaining high accuracy and low loss within approximately 80 epochs. The ResNet34 model follows closely, achieving similar performance after around 90 epochs. In contrast, ResNet50, VGG16, and MobileNetV2 require nearly 100 epochs to reach comparable results. Analysis of the relationship between training iterations and performance metrics reveals that QY-SE-MResNet34 achieves the lowest loss value among all models. This suggests that its design—featuring weighted feature fusion and convolutional kernels of different sizes—enhances the network’s capacity to extract edge details and disease-specific features from wheat leaf images. Consequently, the model demonstrates an improved ability to focus on key regions and capture fine-grained variations across different severity levels, thereby boosting its classification performance in wheat powdery mildew severity identification tasks.
During training, the dataset was divided into a training set and a validation set at a ratio of 9:1.
Figure 6 clearly illustrates the trends of accuracy and loss on both the training and validation sets across different epochs for each model. The performance of the models on the validation set remained consistent with that on the training set, demonstrating good generalization ability and indicating that no significant overfitting occurred during training.
Although the QY-SE-MResNet34 model tended to stabilize around the 80th epoch, considering the different convergence speeds of the models and to ensure comparability under consistent training settings, the Early Stopping mechanism was not applied. Instead, all models were trained for a fixed number of 200 epochs, allowing for a complete observation of the learning process and performance differences. This setting helps to comprehensively evaluate convergence trends and provides a more intuitive basis for performance comparison between models.
Table 3 summarizes the accuracy and loss values of each model following 200 training epochs. As shown, the proposed QY-SE-MResNet34 model outperforms the other architectures, achieving the highest training accuracy of 89% and validation accuracy of 87%. These results indicate that the model possesses strong generalization capability and is highly effective in identifying fine-grained features related to disease severity. In addition, the QY-SE-MResNet34 model records the lowest training and validation loss values, at 0.6925 and 0.6771, respectively, further demonstrating its robustness and superior performance in wheat powdery mildew severity classification.
3.3. The Impact of Data Augmentation on Improving Model Performance
3.3.1. Image Preprocessing (Background Removal)
To further enhance the model’s robustness and avoid background interference during feature extraction, background removal was performed on the original images before data augmentation. Given the relatively uniform imaging environment of wheat powdery mildew samples—typically photographed against a white canvas or background board under controlled lighting conditions—the foreground mainly consisted of a single leaf, and the background was relatively simple. However, since the color of powdery mildew lesions often closely resembles the background, simple color thresholding or binarization methods may lead to the loss of lesion information or incomplete foreground contours, ultimately affecting the model’s ability to learn disease-related features.
Therefore, this study adopted a semi-automatic foreground extraction method based on GrabCut to effectively separate the leaf region from the background. The GrabCut algorithm uses Gaussian Mixture Models (GMM) to model foreground and background pixels and classifies them based on the min-cut principle, enabling fine segmentation of complex foregrounds. Specifically, the original image was first resized to 20% of its original size. Then, a rectangle was drawn around the leaf region to initialize GrabCut, ensuring that lesion areas were included in the foreground modeling and reducing the impact of background lighting variations on edge segmentation. The resulting foreground images retained the complete leaf contours and lesion areas while effectively removing background pixels.
Figure 7 presents a comparison between the original images and those processed using GrabCut. As shown, background information was effectively eliminated, while the leaf contours and disease regions were preserved, providing cleaner input data for subsequent data augmentation and model training.
Although this study attempted to apply GrabCut-based background removal during the image preprocessing stage, the collected images featured clean and uniform backgrounds. Moreover, the model achieved a relatively high classification accuracy of 89% even without background removal, indicating that the background had minimal impact on feature extraction. Considering that background removal may lead to the loss of lesion edge information and incurs a high computational cost when applied to large-scale datasets, this operation was performed only on a subset of images for illustrative purposes rather than on the entire dataset. Nevertheless, this method may serve as a useful reference for lesion recognition in more complex background scenarios in future studies.
3.3.2. Data Augmentation Methods and Parameters
To expand the training dataset and enhance the model’s generalization ability, the following data augmentation methods and corresponding parameters were applied:
Horizontal flip: 100% probability
Random rotation: Angle range of ±50°, uniformly sampled
Image translation: Random horizontal and vertical shifts of ±10% of the image width/height
Brightness adjustment: Randomly adjusted with a brightness factor between 0.8 and 1.2
Hue adjustment: Hue shift range of ±10°
Contrast adjustment: Contrast factor randomly set between 0.8 and 1.2
Sharpness adjustment: Sharpness augmentation factor ranging from 0.5 to 1.5
Figure 8 shows illustrative examples of the different types of data augmentation.
3.3.3. Visualization and Comparison of Data Augmentation Effects
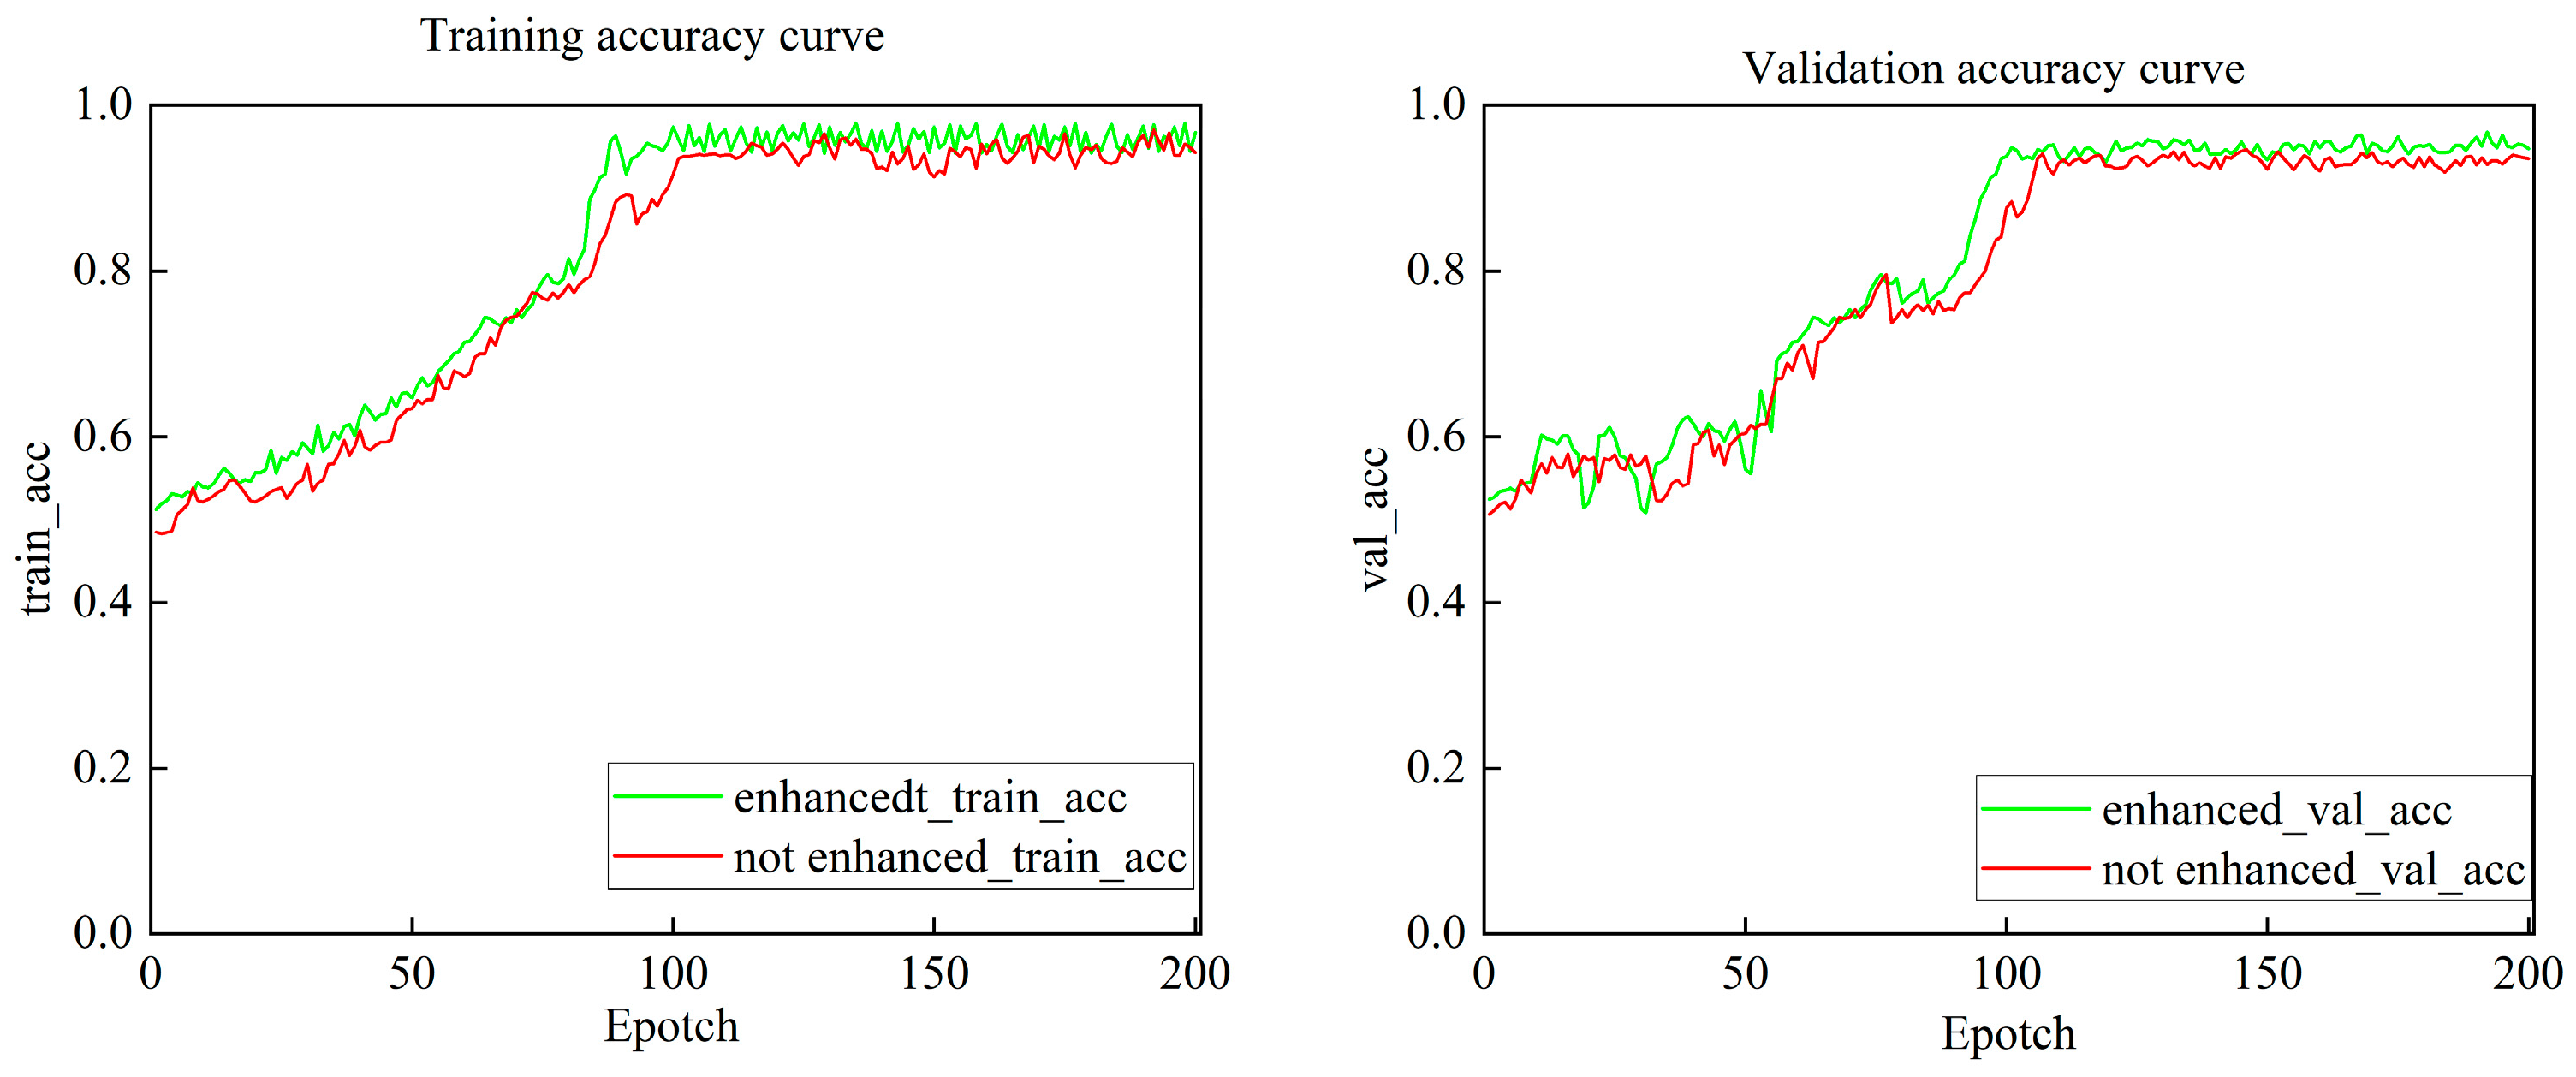
After applying data augmentation, the training samples were balanced and used for training experiments on both the training and validation sets. The results are shown in
Table 4. As observed, the training and validation accuracy after data augmentation reached 89.9% and 87.6%, respectively, whereas without data augmentation, the training and validation accuracy were 86.4% and 83.7%, respectively. Data augmentation thus improved the training and validation accuracy by 3.5% and 3.9%, respectively. Moreover, the gap between training and validation accuracy was smaller in the augmented dataset compared to the non-augmented one.
These results indicate that using data augmentation techniques—such as flipping, rotation, translation, and color transformations—to generate a more diverse training dataset effectively reduces model overfitting and enhances its robustness and generalization capability in the wheat powdery mildew severity classification task.
To more intuitively demonstrate the impact of data augmentation,
Figure 9 presents the training and validation accuracy curves over epochs for models trained with and without data augmentation. As shown in
Figure 9, the model trained with data augmentation exhibits more stable training behavior, faster accuracy improvement, and consistently higher validation accuracy compared to the model without augmentation. This indicates that data augmentation effectively alleviates overfitting and enhances the model’s generalization ability.
3.4. Different Models’ Disease Severity Recognition Results and Analysis
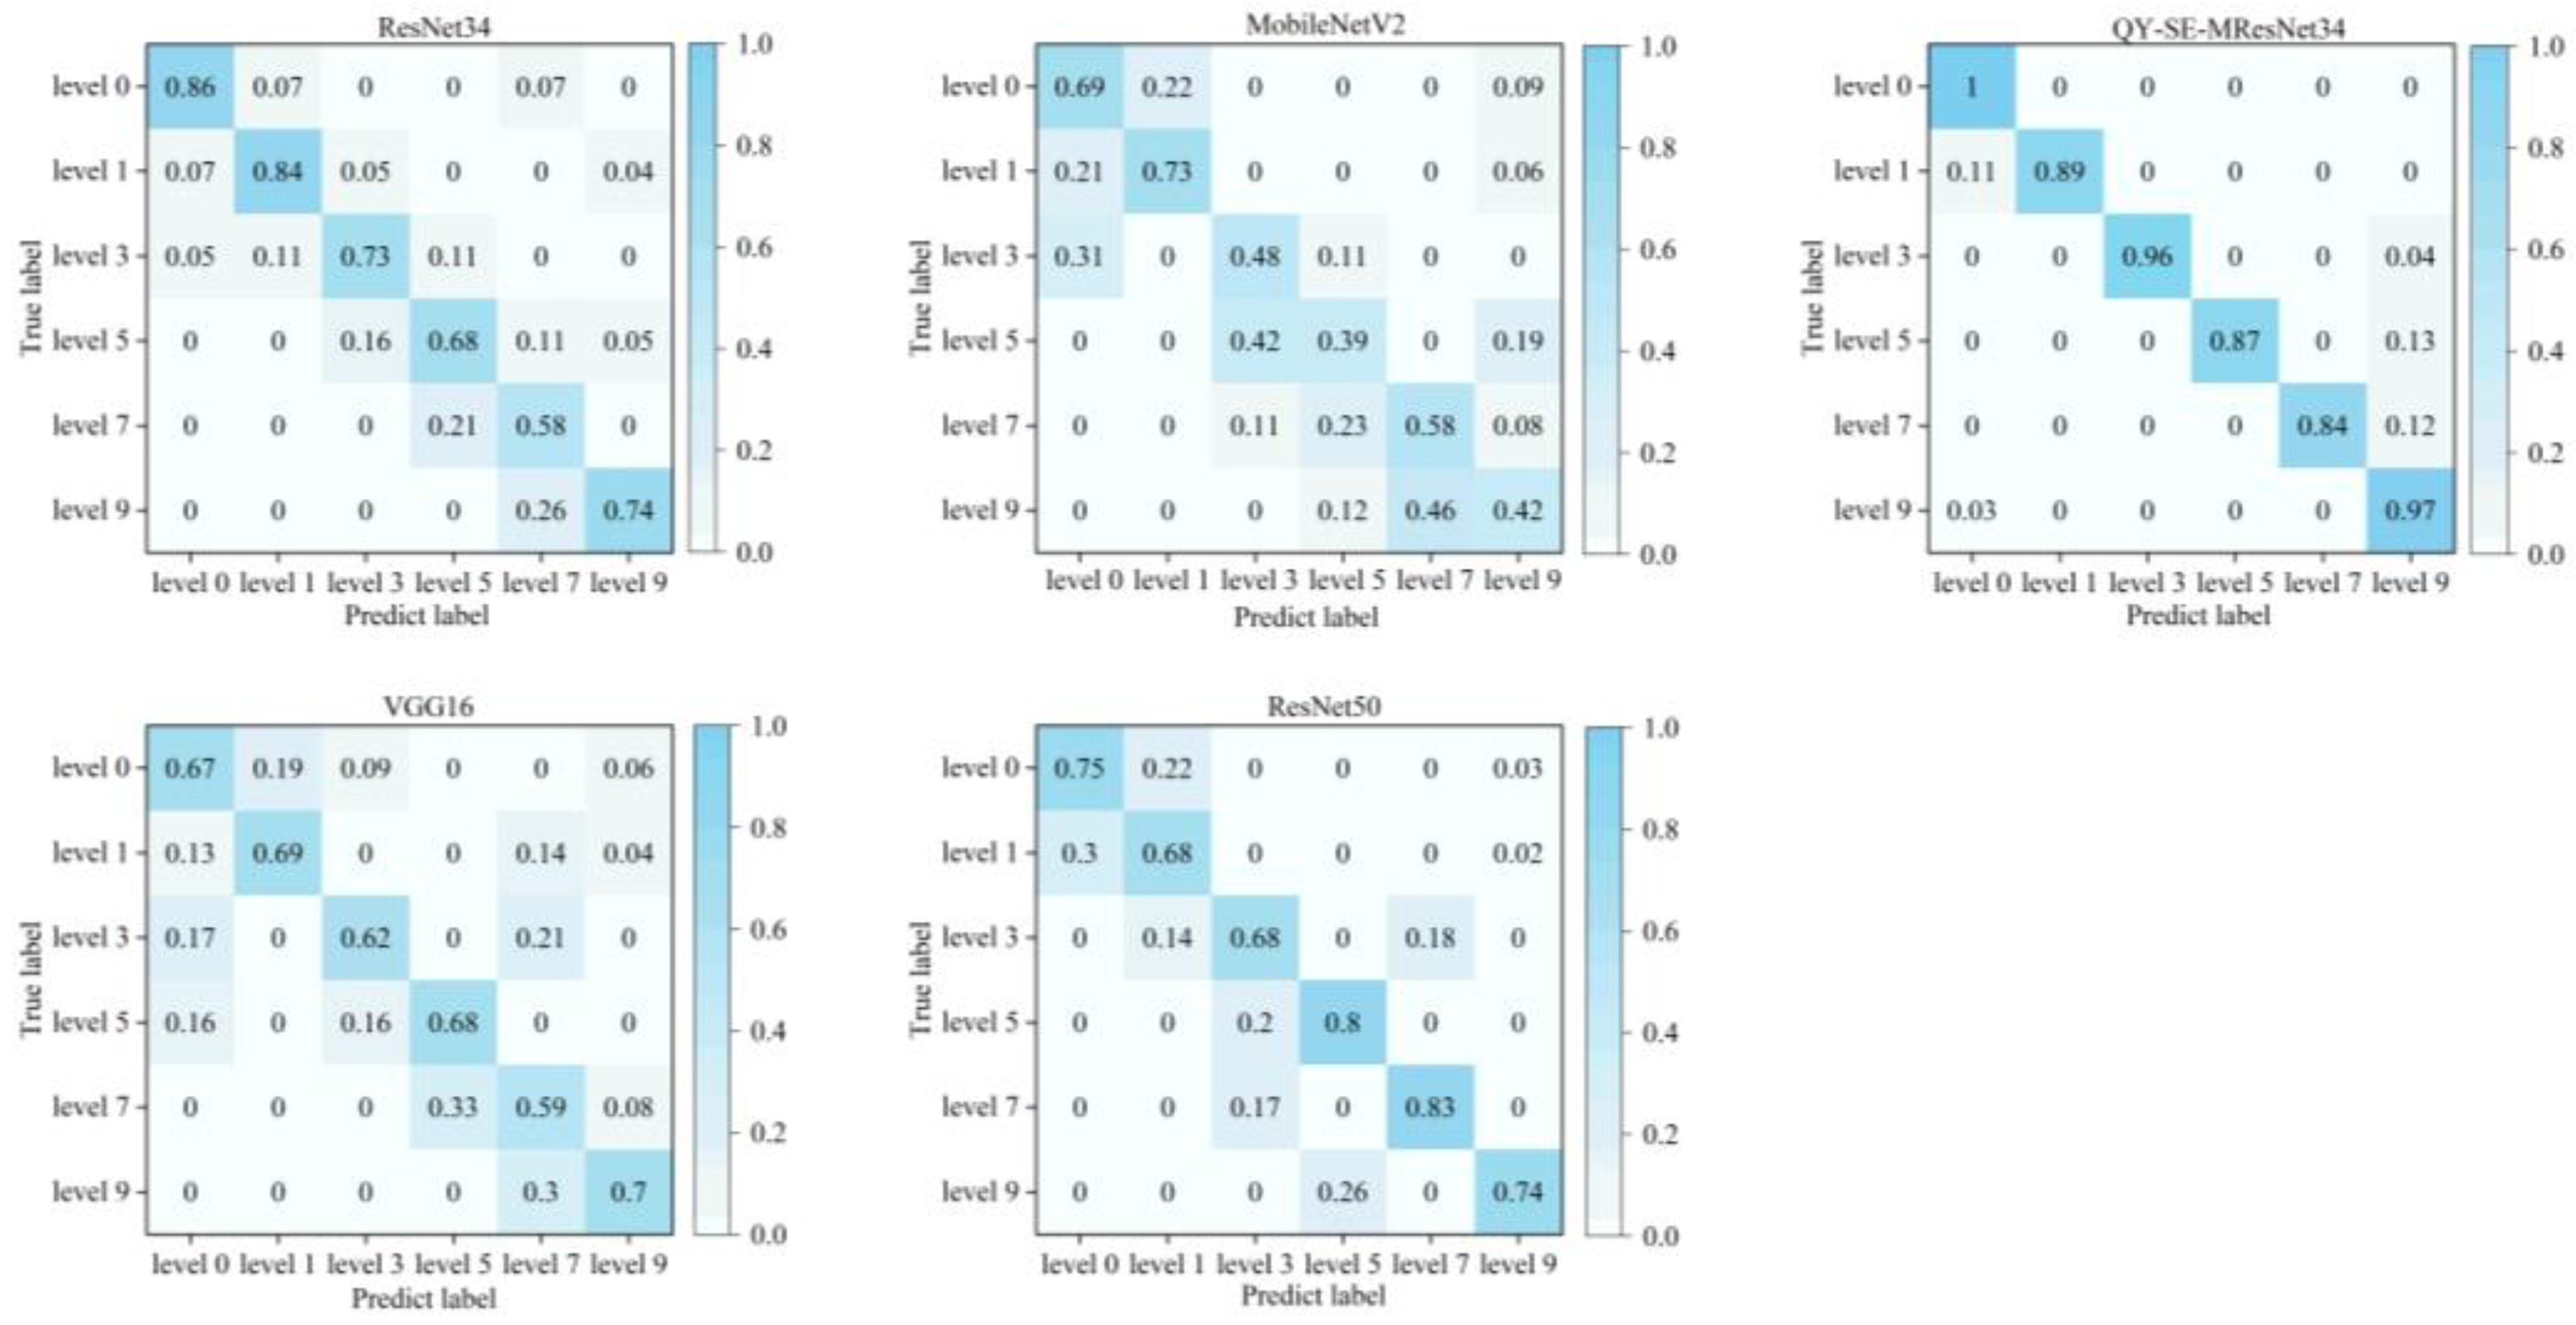
Figure 10 presents the confusion matrices for the various models. As shown, the QY-SE-MResNet34 model exhibits superior performance in classifying the severity levels of wheat powdery mildew compared to other models. For the 0-level disease, the QY-SE-MResNet34 model achieves a perfect recognition rate of 1.00, whereas other models—except for ResNet34, which attains an accuracy of 0.86—show relatively low recognition rates. In the 1-level category, only the QY-SE-MResNet34 and ResNet34 models surpass a recognition rate of 0.80, while the remaining models fluctuate around 0.70. These results indicate that the QY-SE-MResNet34 and ResNet34 models are particularly effective in identifying the early stages (0 and 1 level) of the disease. For the 3-level disease, the QY-SE-MResNet34 model achieves the highest recognition rate of 0.96, in stark contrast to MobileNetV2, which records the lowest at 0.48. The recognition accuracies of the other three models range between 0.60 and 0.70. Except for the QY-SE-MResNet34 model, the remaining models demonstrate limited effectiveness in identifying the mid-severity levels (3-, 5-, and 7-level). Notably, 5-level diseases are frequently misclassified as 3-level, and 7-level diseases are often confused with 5-level, due to the high similarity in visual features such as white lesions and leaf yellowing. These overlapping characteristics make it challenging for the models to distinguish between varying degrees of leaf necrosis and discoloration. Regarding the 9-level disease, the MobileNetV2 model again shows the lowest recognition rate (0.42), while ResNet34, ResNet50, and VGG16 achieve approximately 0.70. In contrast, the QY-SE-MResNet34 model reaches the highest recognition rate of 0.97. Overall, the QY-SE-MResNet34 model demonstrates the most consistent and accurate performance across all severity levels. The confusion matrix clearly illustrates the model’s superior ability to extract fine-grained features and distinguish between subtle inter-class differences, thereby significantly enhancing classification performance in wheat powdery mildew severity identification tasks.
Table 5 summarizes the performance metrics of each model in recognizing different severity levels of wheat powdery mildew. As shown, the QY-SE-MResNet34 model consistently outperforms the other models across all severity levels in terms of precision, recall, and balanced F-score. These results highlight the model’s superior capability in accurately identifying and distinguishing fine-grained disease features, thereby enhancing the overall classification effectiveness for wheat powdery mildew severity assessment.
As shown in
Table 6, the QY-SE-MResNet34 model achieved the highest performance across all evaluation metrics for wheat powdery mildew severity classification, with precision, recall, F1-score, and accuracy reaching 88.6%, 85.83%, 86.17%, and 87%, respectively. In contrast, the MobileNetV2 model exhibited the lowest performance, with corresponding values of 60.7%, 61.0%, 59.7%, and 60.5%, followed by the VGG16 model, which yielded values of 64.1%, 62.7%, 63.6%, and 63.4%, respectively.
Notably, the QY-SE-MResNet34 model outperformed the baseline ResNet34 model by a margin of 10.8% in classification accuracy (76.2%), demonstrating the substantial improvements achieved through the integration of transfer learning, the incorporation of the SE attention module, and the optimization of the first convolutional layer (Conv1). The use of convolutional kernels with varying sizes further enhanced the model’s ability to capture fine-grained features across different disease severity levels, thereby enriching the image feature representations and improving classification precision.
Although the ResNet50 model showed moderate performance, its effectiveness in identifying fine-grained features was relatively limited. Despite offering benefits such as reduced parameter count and lower computational complexity, its reliance on lightweight operations—such as depthwise separable convolutions—may constrain its representational capacity, rendering it less effective for detailed classification tasks like wheat powdery mildew severity assessment.
3.5. Ablation Experiment
To validate the effectiveness of integrating ResNet34 with transfer learning, the SE attention mechanism, and Conv1 layer optimization, an ablation study was conducted. The evaluated models included the baseline ResNet34, ResNet34 with transfer learning (QY-ResNet34), ResNet34 incorporating the SE module (SE-ResNet34), ResNet34 with Conv1 optimization (MResNet34), and a combined model integrating all three improvements (QY-SE-MResNet34). These models were assessed using four evaluation metrics: precision, recall, accuracy, and balanced F-score.
The results of the ablation experiment are summarized in
Table 7. Compared with the baseline ResNet34, the QY-ResNet34 model showed improvements in precision (1.9%), recall (2.75%), F-score (2.7%), and accuracy (2.8%). These gains suggest that incorporating transfer learning enables the model to effectively leverage prior knowledge from pretrained networks, thereby accelerating convergence and reducing computational costs. The SE-ResNet34 model achieved notable improvements—5.81% in precision, 8.6% in recall, 7.98% in F-score, and 4.8% in accuracy—demonstrating that the inclusion of the SE module strengthens the model’s ability to emphasize disease-relevant features, thereby enhancing classification performance. The MResNet34 model, which modifies the Conv1 layer, achieved performance gains of 3.01% in precision, 5.91% in recall, 4.85% in F-score, and 3.8% in accuracy. These results indicate that optimizing the initial convolutional layer enables the network to extract more detailed spatial features and better capture subtle differences in disease severity levels. Among all tested configurations, the QY-SE-MResNet34 model outperformed the others across all metrics, confirming that the synergistic integration of transfer learning, SE attention, and Conv1 optimization significantly enhances the model’s ability to recognize wheat powdery mildew severity. These results demonstrate the effectiveness of the proposed augmentations in improving both the robustness and precision of fine-grained disease classification.
3.6. Model Interpretability and Feature Sensitivity Analysis
3.6.1. Channel Masking Sensitivity Analysis
To further investigate the model’s sensitivity to different input color channels, this study designed and conducted a channel masking sensitivity experiment. The experiment involved individually masking the red, green, and blue channels of the input images by setting the pixel values of the corresponding channel to zero. The goal was to observe the change in the model’s classification performance when information from a single channel was missing, thereby revealing the model’s dependency on each channel and its impact on the disease severity recognition results.
Specifically, based on the preprocessed RGB images, the pixel values of one color channel were set to zero to generate masked images, which were then fed into the trained QY-SE-MResNet34 model for prediction. By comparing the predicted classes and confidence scores before and after masking, the contribution of each channel’s information to the model’s decision-making was evaluated.
Figure 11 shows the visual comparison between the original and masked images, while
Table 8 summarizes the predicted classes and confidence scores under different masking conditions.
The experimental results show that after masking the blue channel, the model’s predicted classes and confidence scores exhibited significant changes, with a notable decline in performance. In contrast, masking the red and green channels resulted in relatively stable predictions, with only slight decreases in confidence. Combined with the visual changes in the masked images (where masking the blue channel caused the image to appear yellowish, and masking the red and green channels resulted in magenta and cyan hues, respectively), these findings indicate that the model relies more heavily on features from the blue channel for classifying powdery mildew severity.
In summary, the channel masking sensitivity analysis verifies the model’s differential responses to individual input channels, providing intuitive insights into its decision-making process. This analysis also offers valuable guidance for future model optimization and data augmentation strategy design.
3.6.2. Visualization of Model Attention Regions (Grad-CAM)
To further explore the decision basis and interpretability of the proposed QY-SE-MResNet34 model in the task of wheat powdery mildew severity classification, this study adopts Grad-CAM (Gradient-weighted Class Activation Mapping) to visualize the model’s attention regions.
Grad-CAM is a gradient-based interpretability technique that generates heatmaps by computing the gradients of the model’s output with respect to the feature maps of a selected convolutional layer. These heatmaps highlight the regions in the input image that the model focuses on when making predictions. This method does not require modification of the model architecture and is applicable to various convolutional neural networks, making it effective for identifying whether the model attends to task-relevant areas.
In this study, two representative images with severity levels 3 and 9 were selected for visualization. The original images were overlaid with their corresponding Grad-CAM heatmaps for analysis. As shown in
Figure 12, the model primarily focuses on regions with dense lesion distribution during prediction, and in images with higher severity, the activation regions are more pronounced. This indicates that the model does not simply rely on background or leaf contour information but effectively captures fine-grained differences in diseased areas, demonstrating a reliable decision basis and interpretability.
The visualization results indicate that the proposed model can effectively distinguish diseased areas from background noise, thereby enhancing its interpretability and practical value, and providing strong support for its deployment in real-world agricultural applications. In this section, two representative samples with correct model predictions—leaf images corresponding to powdery mildew severity levels 3 and 9—are selected. Grad-CAM is used to generate heatmaps to observe whether the model’s attention is focused around the lesion areas. Only these two typical severity levels are presented here, as the Grad-CAM visualizations of other severity levels exhibit similar attention patterns, reflecting a consistent focus trend of the model.
4. Discussion
Current research on wheat diseases primarily concentrates on disease type classification, with convolutional neural networks (CNNs) widely applied in agricultural disease identification tasks. Backbone architectures such as ResNet and VGG have demonstrated outstanding performance in the classification of various wheat disease images. For instance, Feng et al. [
48] employed a transfer learning strategy by setting all layers of a lightweight CNN model as trainable, thereby developing a wheat leaf disease recognition model that exhibits high accuracy, strong generalization capability, and suitability for deployment on mobile platforms. The model was trained on a dataset encompassing three major wheat leaf diseases: powdery mildew, stripe rust, and leaf rust. Similarly, Lou et al. [
49] proposed WDMNet, a lightweight wheat disease recognition network based on multi-scale attention, designed to identify six common wheat diseases. By integrating a multi-scale attention mechanism, the model effectively enhances the extraction of key disease features, such as lesion location, shape, and color. In parallel, data sources for wheat disease detection have become increasingly diverse. Gao et al. [
50] introduced a novel approach for the rapid and non-destructive monitoring of wheat Fusarium head blight (FHB), combining low-altitude remote sensing using unmanned aerial vehicles (UAVs) with multispectral imaging and incorporating spectral and textural analysis techniques.
Although previous studies have made significant advances in wheat disease recognition, their focus has largely been on multi-disease classification tasks [
51]. In contrast, this study specifically addresses the automated severity grading of wheat powdery mildew at the leaf level. By enhancing the ResNet34 model and benchmarking it against several mainstream deep learning architectures, we achieved effective classification of powdery mildew severity levels. Specifically, we developed an advanced model, QY-SE-MResNet34, built upon the ResNet34 backbone. This model retains the original network’s residual learning capability while integrating transfer learning to accelerate convergence and improve generalization performance. Additionally, squeeze-and-excitation (SE) attention modules are embedded within each residual block, enabling the model to better focus on critical lesion regions. Given the characteristics of wheat leaf disease images, such as small lesion sizes and blurred edges, the original 7 × 7 convolution kernel in ResNet34’s first layer was replaced with a 3 × 3 kernel to more effectively capture fine-grained local features. Then, the optimal training strategy was determined through hyperparameter tuning experiments, further improving the model’s performance. To address the issue of image backgrounds, the GrabCut method was introduced for background processing, enhancing the model’s focus on key regions and its robustness. Combined with data augmentation techniques, the positive impact on model performance was demonstrated through visual comparisons. Finally, interpretability techniques such as channel masking and Grad-CAM were employed to analyze the model’s decision-making process, revealing the model’s sensitivity to different input channels and image regions, thereby deepening the understanding of its discriminative mechanisms. Furthermore, in accordance with the national standard (GBT 17980.22-2000), we constructed a six-level severity image dataset of single wheat leaves affected by powdery mildew, thereby enhancing the model’s capability to distinguish subtle differences in disease severity under real-world conditions. Unlike many existing studies that focus primarily on binary classification (diseased vs. healthy), our work tackles a more granular severity grading problem. Through architectural optimization and a careful balance between performance and model complexity, the proposed QY-SE-MResNet34 outperformed baseline models in accuracy, recall, and F1-score, demonstrating strong practical applicability and scalability.
This study acknowledges several limitations that warrant further attention. First, the enhanced QY-SE-MResNet34 model exhibited superior performance compared to the baseline ResNet34 on our self-constructed wheat powdery mildew dataset. This improvement may be partly attributed to the image acquisition process, where wheat leaf images were captured outdoors using smartphones after manual collection. This approach effectively reduced interference from factors such as background occlusion, plant growth position, and solar altitude angle, resulting in more consistent leaf contours and geometric features across images, which contributed to stable grading results. However, in real-world applications, wheat leaves are often subject to uncontrollable environmental factors that cause greater variability in contour and geometric characteristics, potentially leading to decreased grading accuracy. The dataset used in this study contains images with relatively clean backgrounds and uniform lighting, resulting in limited sample complexity that cannot fully represent the diversity of real-world environments. Consequently, the model’s generalization ability in practical scenarios remains insufficient. Although GrabCut background processing and data augmentation methods were introduced to improve model robustness, the actual effectiveness of these preprocessing and augmentation strategies still needs to be further validated under more complex and natural conditions. Additionally, this study focuses primarily on improving the deep neural network architecture and algorithmic enhancements, without addressing model deployment. Finally, the current model only performs powdery mildew severity classification on wheat leaves and does not cover diseases on stems and spikes; future work should expand the application scope and improve the model’s applicability.
Therefore, addressing these challenges in future research is of paramount importance. On one hand, it is essential to evaluate the model’s performance under complex environmental conditions and in the presence of co-occurring wheat diseases. Future studies should also extend severity classification to additional plant organs such as stems and ears to enhance the model’s applicability. Simultaneously, balancing model complexity with generalization capability remains a critical consideration. Incorporating lightweight modules—such as the Convolutional Block Attention Module (CBAM) or depthwise separable convolutions—could improve feature extraction efficiency while maintaining manageable computational complexity. In this study, the SE attention mechanism was employed to strengthen the model’s focus on salient lesion features and facilitate fine-grained feature extraction across varying severity levels of powdery mildew, thereby enriching the model’s representational capacity. On the other hand, future research should also emphasize real-time deployment and large-scale application of the model in conjunction with emerging technological advancements. As deep learning technologies continue to evolve and computational resources become increasingly accessible, it is critical for models to transition from controlled experimental settings to practical, real-world agricultural environments. The proposed QY-SE-MResNet34 model, which incorporates SE attention mechanisms and modified convolutional layers based on transfer learning, has shown significant improvements in the accuracy and efficiency of powdery mildew severity classification. Nevertheless, practical deployment requires further attention to computational efficiency, hardware compatibility, and adaptability to diverse environmental conditions. Future efforts will focus on optimizing the model’s computational performance, enhancing inference speed on edge devices, and adopting model compression and acceleration techniques to ensure stable operation in low-resource settings. Moreover, additional augmentations will be necessary to accommodate the complexity and variability of different agricultural scenarios, thereby improving the model’s robustness and generalization. This will ultimately enable large-scale disease monitoring and support the implementation of precision agriculture practices. To address this, future research will focus on collecting wheat leaf images under natural field conditions with diverse angles, complex backgrounds, and at multiple time periods, in order to systematically evaluate the model’s adaptability and robustness in real-world environments.


 ,
, 


