Article

Detection Model for Cotton Picker Fire Recognition Based on Lightweight Improved YOLOv11

College of Mechanical and Electrical Engineering, Xinjiang Agricultural University, Urumqi 830052, China
*
Author to whom correspondence should be addressed.
Agriculture 2025, 15(15), 1608; https://doi.org/10.3390/agriculture15151608
Submission received: 1 July 2025 / Revised: 20 July 2025 / Accepted: 23 July 2025 / Published: 25 July 2025
(This article belongs to the Section Artificial Intelligence and Digital Agriculture)

Abstract

In response to the limited research on fire detection in cotton pickers and the issue of low detection accuracy in visual inspection, this paper proposes a computer vision-based detection method. The method is optimized according to the structural characteristics of cotton pickers, and a lightweight improved YOLOv11 algorithm is designed for cotton fire detection in cotton pickers. The backbone of the model is replaced with the MobileNetV2 network to achieve effective model lightweighting. In addition, the convolutional layers in the original C3k2 block are optimized using partial convolutions to reduce computational redundancy and improve inference efficiency. Furthermore, a visual attention mechanism named CBAM-ECA (Convolutional Block Attention Module-Efficient Channel Attention) is designed to suit the complex working conditions of cotton pickers. This mechanism aims to enhance the model’s feature extraction capability under challenging environmental conditions, thereby improving overall detection accuracy. To further improve localization performance and accelerate convergence, the loss function is also modified. These improvements enable the model to achieve higher precision in fire detection while ensuring fast and accurate localization. Experimental results demonstrate that the improved model reduces the number of parameters by 38%, increases the frame processing speed (FPS) by 13.2%, and decreases the computational complexity (GFLOPs) by 42.8%, compared to the original model. The detection accuracy for flaming combustion, smoldering combustion, and overall detection is improved by 1.4%, 3%, and 1.9%, respectively, with an increase of 2.4% in mAP (mean average precision). Compared to other models—YOLOv3-tiny, YOLOv5, YOLOv8, and YOLOv10—the proposed method achieves higher detection accuracy by 5.9%, 7%, 5.9%, and 5.3%, respectively, and shows improvements in mAP by 5.4%, 5%, 4.8%, and 6.3%. The improved detection algorithm maintains high accuracy while achieving faster inference speed and fewer model parameters. These improvements lay a solid foundation for fire prevention and suppression in cotton collection boxes on cotton pickers.

1. Introduction

As China’s largest cotton-producing province, Xinjiang accounts for 80% of the country’s cotton supply. Due to the labor-intensive nature of cotton harvesting, mechanical harvesting has become the predominant method. However, cotton picker fires occasionally occur. The cotton harvested by these machines is primarily stored in cotton collection boxes, and fires in these boxes can lead to severe cotton picker fires, causing significant economic losses to the cotton industry. Therefore, developing an efficient and rapid flame detection algorithm adapted to cotton collection boxes is of critical importance. This algorithm enables the swift detection of cotton fires, providing a basis for subsequent fire prevention and extinguishing operations on cotton pickers. Currently, fire detection primarily involves flame detection and smoke detection [1]. These methods are widely applied in fire detection systems. However, due to the operational characteristics of cotton harvesters, fieldwork involves a large amount of dust and cotton fibers. Smoke detection is susceptible to interference under such conditions, increasing the likelihood of detection errors, which can impact subsequent fire prevention and extinguishing operations for cotton harvesters. Therefore, taking into account the operational characteristics and environmental conditions of cotton harvesters, visual recognition-based detection of cotton fire situations is more appropriate for practical application.
The use of computer vision inspection is a current research hotspot. It is highly favored by scholars for its advantages, such as high detection accuracy, fast speed, and wide detection range [2]. At present, among the algorithms used in computer vision inspection, the convolutional neural network YOLO algorithm in deep learning is the most widely applied in fire detection tasks. The reason is that this algorithm offers high efficiency and performance, strong adaptability, and ease of deployment, making it more suitable for real-world environments. Various authors [3,4,5,6,7,8,9] conducted fire detection using YOLOv8 for different tasks and achieved excellent results in flame detection, with an accuracy rate of approximately 90%. For example, a study [4] introduced the lightweight module SlimNeck and the slicing-assisted inference method SAHI to optimize the network structure and inference architecture of the algorithm. This makes the algorithm more suitable for fire detection tasks. The improved model increased the detection speed, reduced the computational burden, and enabled the detection accuracy of the model to reach 94.4%, showing excellent performance in detecting both flames and smoke. In the YOLOv7 version of the algorithm, there are also studies on fire detection. Reference [10] used AFPN (Progressive Feature Pyramid Network) to improve the neck part and adopted content-aware feature recombination to replace traditional upsampling, which reduced the number of parameters in YOLOv7 by 5% while achieving a better accuracy of 90.9%, representing an improvement of 4.6%. For example, in reference [11], the feature extraction capability of the network was enhanced by using spatial-to-depth convolution (SPD-Conv) and the C3 module, which improved the detection of small target flames in fire detection. The detection accuracy for small target flames reached 98.8%, and the detection accuracy for small target smoke was 90.6%. The current version of YOLO is 11. In the latest research on flame detection using YOLO [12], various variants of YOLOv11 were summarized, including YOLO11n, YOLO11s, YOLO11m, YOLO11l, and YOLO11x, for fire detection across five severity levels. The performance of these variants in flame detection was evaluated, and overall, the YOLOv11 variants demonstrated good results in flame classification, with accuracy rates exceeding 90% in all tests. Reference [13] proposes integrating adaptive feature fusion (AFF) into the feature extraction process of YOLOv11 to enhance the model’s feature fusion capability, filter out irrelevant information in features, reduce interference from complex backgrounds, and enable better adaptation to fire detection and recognition. The aforementioned fire detection method does not provide detailed checks for smoldering and open flame conditions. Additionally, partial obstruction of the image detection devices’ lenses results in low detection accuracy and failures. To address these challenges, data on smoldering, open flames, and partially obstructed lenses were collected to create a suitable dataset. The YOLOv11 model was then used to improve the cotton fire detection method. The main contributions of this study are as follows:
  • In the backbone module, the MobileNetV2 module is introduced to replace the original backbone blocks, achieving model lightweighting. Compared to the original model, this reduces the parameter count by 0.96 million.
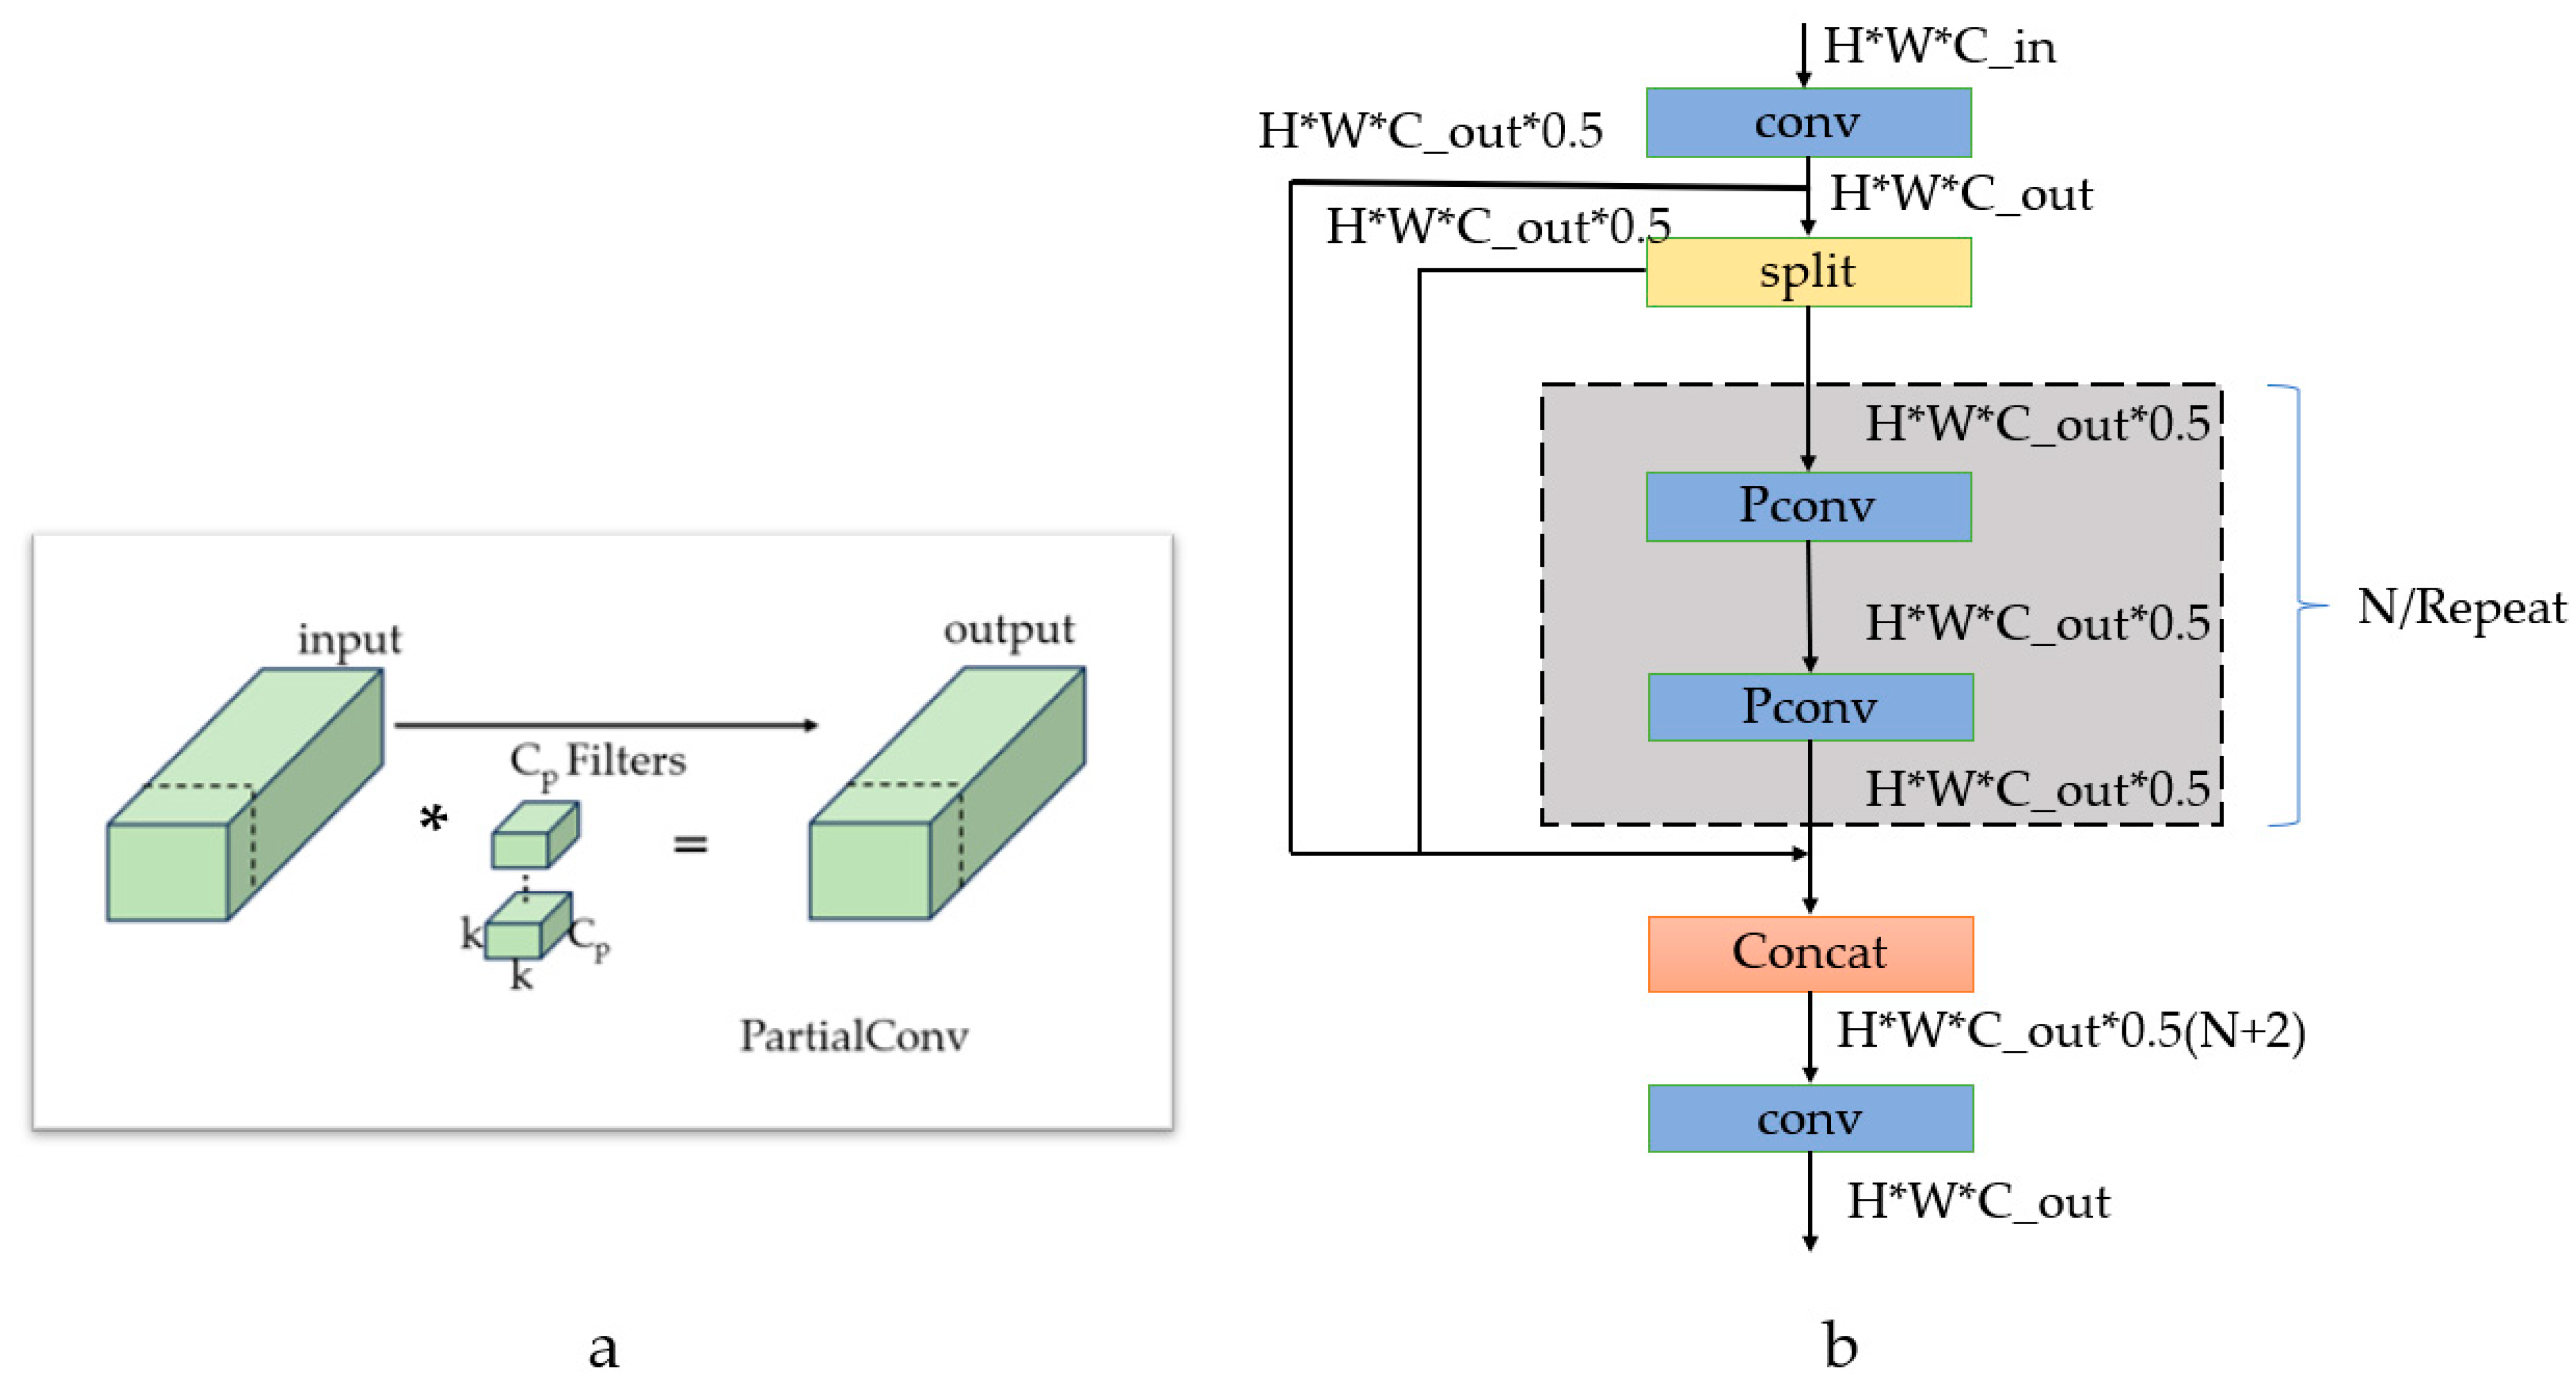
  • The original convolutions in the neck module are replaced with partial convolutions (PartialConv) to enhance the model’s feature extraction capabilities. After incorporating these convolutions, the detection accuracy for smoldering and open flames in cotton increases by 1.8% and 1.3%, respectively.
  • The integrated CBAM-ECA (Convolutional Block Attention Module-Efficient Channel Attention) mechanism is introduced to enhance the model’s feature extraction capability, improving the model’s accuracy in detecting smoldering and open flames by 1.1% and 1.3%, respectively.
  • An improved loss function is adopted to enhance the model’s precise localization of cotton fire situations.
The remainder of this study is structured as follows: Section 2 outlines the acquisition of relevant data and provides a detailed introduction to the methods used in this study; Section 3 outlines the experimental design, proposes relevant evaluation indicators, presents the experimental results, and discusses the results; and Section 4 summarizes the findings and points out directions for future study.

2. Materials and Methods

2.1. Materials

The dataset used in this experiment is a self-made cotton flame dataset. When creating the self-made cotton combustion dataset, the working characteristics of the cotton picker were taken into consideration, including operation on both sunny and cloudy days and the fact that the imaging device remained fixed during operation. Considering the combustion characteristics of cotton, there are two forms of combustion: smoldering and open flames. Therefore, images in the dataset were captured at distances ranging from 0.5 m to 1.2 m. Additionally, to increase variability, the camera was obstructed during data collection to obtain some extreme datasets. A portion of the resulting datasets is shown in Figure 1 below: In Figure 1, (a) represents a single open flame, and (b) represents multiple open flame instances. This helps the model learn the relevant features of cotton open flames, and the multiple open flame data enhance the model’s ability to effectively detect and locate multiple fire sources. (c) represents a dataset of obscured open flames and smoldering fires, simulating situations where the view is obstructed in complex scenarios, thereby enhancing the model’s robustness. (d) represents smoldering fire data, and (e) represents obscured smoldering fire data. Detecting smoldering fires is critical for early warning and prevention. By using smoldering fire data, the model can identify fire signs before the fire becomes more dangerous. This diverse dataset enhances the model’s learning capability, enabling it to achieve good generalization across various cotton fire scenarios. Additionally, the presence of occluded samples further enhances the model’s feature extraction and recognition capabilities. Open flame data accounts for 0.6, and smoldering data accounts for 0.4, which are used for model training and testing.
To reduce overfitting during model training, data augmentation techniques were applied to the original dataset, including horizontal flipping, vertical flipping, brightness changes, random cropping, and saturation changes. The resulting dataset comprises 4100 images, effectively expanding the dataset, highlighting sample features, and enhancing the model’s robustness and generalization capabilities. The enhanced data are shown in Figure 2, where (a) represents the original image, (b) represents horizontal mirroring, (c) represents vertical flipping, (d) represents Gaussian noise, (e) represents brightness enhancement, and (f) represents random cropping. The enhanced data are divided into an 8:1:1 ratio for use in the training set, validation set, and test set. The number of category data in each dataset is shown in Table 1.
The annotation of the dataset follows the YOLO format and is performed using Labelimg. Open flames are annotated as “fire”, and smoldering fires are annotated as “Smoldering”. After annotation, the text file is generated.

2.2. Methods

2.2.1. Optimized YOLOv11

YOLOv11 is the latest version of the YOLO series, released by Ultralytics on 30 September 2024 [14]. The development of version 11 has improved detection speed and accuracy. YOLOv11 is based on the network architecture of YOLOv8. It includes an input layer, a backbone network, a neck network, and a detection head [15]. It adopts a lightweight network structure, replacing the C2f module in YOLOv8 with a C3k2 module, and combines the C2PSA attention mechanism to enhance feature capture capabilities.
Considering the actual working environment characteristics of the cotton picker, visual detection in real-world scenarios often involves obstacles such as debris obstruction and complex lighting conditions, while also requiring the model to be compact and lightweight. Therefore, the YOLOv11 algorithm was designed to meet the requirements of actual detection. It has been optimized to enhance its feature extraction and detection capabilities, leading to the development of an improved YOLOv11 model. The improvements are as follows:
  • Replace the backbone part of the network with MobileNetV2 to reduce the model size, achieving lightweight design while enhancing the model’s feature extraction capability. The improved part is MobileNetV2* in Figure 3.
  • Replace the original convolutional modules in the neck section with improved convolutional modules to further reduce the model size while enhancing its feature extraction capabilities. The improved part is c3k2-Pconv* in Figure 3.
  • Design a fused attention mechanism, CBAM-ECA, to achieve dual attention mechanisms, where CBAM captures spatial grayscale interference and ECA enhances feature extraction capabilities. The improved part is the CBAM-ECA* in Figure 3.

2.2.2. Position Loss Function

The loss function plays an important role in the YOLO algorithm’s detection performance. The position loss function is implemented in the head of the YOLO model, which is also the key component responsible for the final prediction and loss calculation in the object detection model. It helps the model learn to accurately detect the location and category of objects from the input image. The position loss function is used to quantify the positional difference between the predicted bounding box and the ground truth box [16]. IoU (Intersection over Union) is defined as the ratio of the overlapping area between the predicted bounding box (with area SA) and the ground truth bounding box (with area SB) to the total area covered by both boxes. The principle is illustrated in Figure 4a,b. It serves as a standard metric for measuring the similarity between two arbitrarily shaped regions and is widely used to evaluate localization accuracy in object detection tasks. The mathematical formulation of the loss function is as follows: Equation (1).
In this equation, xa1 to xd2 represent the distances shown in the figure, while SA, SB, and S denote the area of the ground truth box, the predicted box, and the overlapping region, respectively.
L o s s   I o U = S = ( ( m i n ( x c 1 , x d 2 ) + m i n ( x d 1 , x c 2 ) ) ( m i n ( x a 1 , x b 2 ) + m i n ( x b 1 , x a 2 ) ) S A + S B S
The bounding box regression in YOLOv11 employs the CIoU (Complete-IoU) loss function, which integrates the overlap ratio, center-to-center distance, and aspect ratio to provide a more comprehensive evaluation of predicted bounding boxes. The corresponding mathematical formulation is presented in Equations (2)–(4). wgt and hgt are the width and height of the actual box. w and h are the width and height of the predicted box. C represents the diagonal length of the minimum enclosing rectangle of the two bounding boxes. α is the weighting coefficient used to balance the consistency of proportions; ϑ is a measure of the consistency of the width-to-height ratio of the two boxes. The principle is illustrated in Figure 4c.
L o s s   C I o U = I o U ( ρ 2 ( b , b g t ) c 2 + α ϑ )
θ = 4 π 2 ( arctan w g t h g t arctan w h ) 2
α = θ ( 1 I o U ) + θ
To enhance the learning capability of YOLOv11, the original position loss function is improved by adopting the DIoU (Distance-IoU) loss function. The penalty terms related to the aspect ratio are removed, the loss calculation logic is restructured, and only the IoU term and the center point distance penalty are retained. All calls to the bounding box regression loss are redirected to the DIoU implementation. DIoU extends IoU by incorporating the distance between the center points of the predicted and ground truth bounding boxes, enabling effective gradient descent even when the two boxes do not overlap. In contrast, the standard IoU loss function fails to provide meaningful gradient information in cases where there is no overlap between the predicted box and the ground truth box, which limits the model’s learning efficiency. This improvement allows the model to converge faster and achieve more accurate localization. And the principles of the IoU, CIoU, and DIoU loss functions are illustrated in Figure 4d. These two mathematical equations are shown in Equations (5)–(7), where xb, yb and xbgt, ybgt represent the center point coordinates of the predicted bounding box and the ground truth bounding box, respectively, and ρ2(b,bgt) denotes the squared Euclidean distance between the two center points (i.e., the distance between two points in Euclidean space).
D I o U = 1 I o U + ρ 2 ( b , b g t ) c 2
ρ = ( x x g t ) 2 + ( y y g t ) 2
c = ( m a x ( x 1 m a x , x 2 m a x ) m i n ( x 1 m i n , x 2 m i n ) ) 2 ( m a x ( y 1 m a x , y 2 m a x ) m i n ( y 1 m i n , y 2 m i n ) ) 2

2.2.3. MobileNetV2

MobileNetV2 is a lightweight network proposed by Sandler et al. in 2019 [17]. It is a redesigned architecture based on MobileNetV1, introducing the concepts of residual structures and linear bottlenecks. In traditional residual networks, information is first compressed, and then the number of channels is expanded. In MobileNetV2, this process is reversed: the expansion layer uses a 1 × 1 convolution to map low-dimensional features into a high-dimensional space, thereby expanding the number of channels (increasing dimensionality). Then, a 3 × 3 depth wise separable convolution is applied to extract features. The projection layer uses another 1 × 1 convolution to map high-dimensional features back to a lower-dimensional space, thus reducing the number of channels. After the final 1 × 1 convolution in the bottleneck layer, the ReLU activation function is not used; instead, a linear transformation is applied to preserve the richness of the information. The core innovation—the inverted residual structure—is shown in Figure 5a, while the overall network architecture is illustrated in Figure 5b. The structural parameters of MobileNetV2 are listed in Table 2 (k is the number of categories in the dataset). This design reduces the model’s inference memory usage while preserving the feature extraction capability of the channel-wise convolutions. This network structure is well-suited for efficient computation on mobile and embedded devices. However, since it primarily employs 3 × 3 convolution kernels, its receptive field is limited, leading to challenges such as poor detection of small objects and loss of fine details, which prevent the model from fully capturing object features. Therefore, it is necessary to enhance the model’s feature extraction capabilities in subsequent improvements. In this study, MobileNetV2 is integrated into the backbone of YOLOv11, increasing the network depth while reducing the number of parameters and computational load of YOLOv11. This achieves lightweight optimization and serves as the first part of the overall model improvement strategy.

2.2.4. Convolution Optimization Section

Partial convolution is a high-speed inference convolution that achieves a more efficient feature extraction space by reducing redundant computations and memory access. The structure diagram of this convolution is shown in Figure 6a, where * denotes the convolution operation, H and W represent the height and width of the input feature map, k denotes the size of the convolution kernel, and cp denotes the number of channels involved. When performing partial convolution, in addition to the standard convolution weights, a binary mask is also required to indicate which pixels are valid (i.e., not occluded or lost). This mask is passed along with the input to the convolution layer. For each convolution operation, only when the corresponding mask value is 1 will the input value at that position be used in the calculation; otherwise, the input value at that position will be ignored. To compensate for information loss caused by ignoring certain pixels, partial convolution also adjusts the output results to ensure they are not affected by missing data. In the cotton fire detection task, missing data or occluded images caused by cotton leaves or other occluding objects, or other factors, can lead to insufficient feature extraction by the model, resulting in a decrease in accuracy. Therefore, the C3k2 convolution module of YOLOv11 was improved by introducing the concept of partial convolution into this convolution module, defined as the new C3k2-PartialConv (hereinafter referred to as PConv), with the structure shown in Figure 6b.
During the partial convolution optimization of YOLOv11, the feature map first undergoes a standard convolution to reduce the number of channels to half of the original value. Subsequently, feature segmentation is performed, dividing the feature map into equal-sized segments. Each segmented feature map is processed through a partial convolution layer to obtain a new feature map, with the number of channels remaining half of the original value. This operation is repeated N times to enhance feature representation. Finally, the N+2 feature maps are concatenated to form a new feature map, which then passes through a convolution layer to restore the channel count to its original value.

2.2.5. Design of the CBAM-ECA Attention Mechanism

CBAM (Convolutional Block Attention Module) is a convolutional attention mechanism module that combines spatial and channel dimensions [18,19]. It serves as an effective attention module for feedforward convolutional networks. The CBAM module sequentially infers attention maps along two independent dimensions—channel and spatial—thereby enhancing representational capacity by dynamically focusing on informative features [20,21]. The CBAM attention mechanism integrates both channel and spatial mechanisms [22], with its core equations shown in Equations (8) and (9). The advantage of this mechanism lies in its ability to achieve both model lightweighting and plug-and-play functionality while maintaining high efficiency. This enables it to capture spatial interference, such as dust, and enhance feature recognition capabilities in complex environments [23]. It is suitable for reducing dust and cotton fiber interference during cotton picker operations, thereby improving recognition accuracy. AvgPool: Average pooling; MaxPool: Max pooling; σ: Activation function; function f7×7: 7×7 convolution kernel K: convolution kernel size; MLP: multi-layer perceptron. Equation (8) combines average pooling and max pooling to capture different types of feature information. The MLP structure effectively learns complex dependencies between channels, thereby generating more accurate channel-wise attention weights. Equation (9) of the spatial attention module generates attention weights in the spatial dimension, highlighting important spatial regions. This enables the model to achieve better feature extraction and more accurate recognition in cotton fire detection.
M c F = σ ( M L P ( A v g P o o l F + M L P M a x P o o l F
M s F = σ ( f 7 × 7 ( A v g P o o l F ; M a x P o o l F )
ECA (Efficient Channel Attention) is a lightweight and efficient attention mechanism that can adaptively adjust the size of convolutional kernels [24,25,26,27,28,29], thereby effectively capturing cross-channel dependencies while maintaining constant channel dimensions. The ECA mechanism reduces model complexity while preserving performance. It captures information at different scales through one-dimensional convolution operations. Given an input feature map, the mechanism performs global average pooling on each channel, applies a dynamically sized convolution layer transformation, and finally obtains the final feature map through weighted calculations. The corresponding equations are shown in Equations (10) and (11). k denotes the size of the one-dimensional convolution kernel. C denotes the number of channels, and σ denotes the activation function sigma, while γ and b are hyperparameters used to dynamically adjust the size of the convolution kernel. The practical significance of these two equations is to adaptively adjust the size of the convolution kernel, ensuring its reasonableness and further enhancing the model’s robustness and generalization ability. By effectively capturing the dependencies among channels, the model reduces complexity while maintaining performance, improving computational efficiency, and providing enhanced feature extraction capabilities for cotton fire detection tasks.
X = X c ( σ ( C o n v k ( 1 H × W i = 1 H j = 1 W X i j ) ) )
k = i n t ( l o g 2 ( C ) γ + b γ o d d )
The MobileNetV2 architecture replaces the backbone of YOLO. Although this makes the model lighter, it may also result in a decrease in accuracy for the optimized YOLO models. Therefore, the feature extraction capability of the network needs to be enhanced in the neck section. A fused attention mechanism is designed, taking into account the presence of cotton lint and dust during actual cotton picker operations. Combining the CBAM mechanism can highlight scenes with high distinguishability in images, which offers advantages in dusty environments. The ECA mechanism can adaptively reinforce information in important channels, helping the model better capture relatively prominent features even in low-contrast environments. The ECA mechanism’s ability to avoid dimensionality reduction and reinforce effective features ensures more precise and richer feature capture. The structural diagram of this mechanism is shown in Figure 7. In the neck section, the CBAM module is first applied to perform dual attention processing on the feature map in both the channel and spatial dimensions. Then, the ECA module is applied to further strengthen the channel information, ensuring that relative display features can be captured even in low-contrast environments. The final output feature map has a more accurate and rich feature representation, which helps improve the detection performance of the model.

3. Result

3.1. Evaluation Indicators

The improved model needs to be evaluated using commonly accepted metrics in comparison with other models. The evaluation metrics selected in this paper include mAP (mean average precision), GFLOPs, precision (Pr), recall rate (Re), and FPS. The evaluation equations for mAP, precision (Pr), and recall (Re) are given in Equations (12)–(14), respectively.
m A P = 1 M i n A P i = 1 M i n 0 1 ( P r ( R e ) d ( R e ) )
P r = T P T P + F p
R e = T P T P + F N
Accuracy reflects how many of the detected objects are actually correct, helping to determine how many of the detected cotton fires are actually correct, thereby reducing the possibility of false positives and false negatives. The recall assessment metric evaluates the extent to which the model detects cotton fires, ensuring that no cotton fires are overlooked, meaning that as many real cotton fires as possible are captured. In fire detection, mAP provides an overall perspective to evaluate the model’s ability to identify fires in various situations. M is the number of sample categories to be detected, Pr is the precision, and Re is the recall rate. Tp is the number of samples correctly predicted as positive, FP is the number of samples incorrectly predicted as positive, and FN is the number of samples incorrectly predicted as negative class.

3.2. Experimental Results

3.2.1. Experimental Environment Configuration

This experiment was conducted using the deep learning framework PyTorch 2.0.1, with the code implemented in a Python 3.8.19 environment. The general-purpose computing architecture CUDA 11.8 was used, along with an NVIDIA GeForce RTX 3090 graphics card. The programming environment was PyCharm 2024.1.7. The training parameters for the model are set as shown in Table 3 below. The input images were resized to a resolution of 640 pixels, and computations were performed using a batch size of 16.

3.2.2. Comparison of Model Improvement Result

To verify whether the improved model can achieve optimized performance in the task of identifying cotton fire conditions, the improved method was evaluated using a self-constructed cotton fire condition dataset. The evaluation results for each component are presented below.
  • Experimental results of loss function improvement.
To verify the effectiveness of the localization loss function, comparative experiments were conducted between the CIoU loss used in YOLOv11, the improved DIoU loss, and a model combining both loss functions. The experiments were carried out on the dataset, and the results are summarized in Table 4. The training and validation box loss values were visualized using Origin software, as shown in Figure 8 (all curves in this paper were generated using Origin). From the table and figure, it can be clearly observed that after incorporating the DIoU loss, the loss decreases faster than with the original CIoU loss. The detection accuracy for flaming combustion and the mAP value are both improved compared to the original model, with increases of 0.9% and 0.5%, respectively. Additionally, the overall model accuracy is enhanced by 0.8%, and the convergence speed is faster than that of the original YOLOv11 model. At the same time, the improved DIoU loss function outperforms the CIoU loss function in detecting both smoldering and flaming in cotton fires and achieves higher mAP values. In summary, the improved DIoU loss function accelerates target localization and enhances detection accuracy, indicating the feasibility of the proposed experimental approach.
2.
Experimental Results of Replacing the Main Network with MobileNetV2.
MobileNetV2 replaces the backbone structure of YOLOv11. As discussed in the previous section, this network structure primarily uses 3 × 3 convolution kernels, which limits its receptive field. This affects the model’s ability to detect small objects and leads to a loss of detail, preventing it from fully understanding object features. Through model validation, the evaluation metrics are shown in Table 5. As can be seen in Table 5 and Figure 9, the addition of the MobileNetV2 network results in a decrease in model accuracy, with reductions of 0.3% and 1.7% in smoldering and open flame detection, respectively, and a total accuracy decrease of 0.4%. Therefore, it becomes necessary to implement accuracy optimization and compensation strategies in subsequent stages of model development.
3.
Improved experimental results for partial convolution.
The improved convolutional layer enhances the model’s feature extraction capability. As shown in Table 6, the model’s accuracy for open flames and smoldering fires is improved by 0.9%, 1.8%, and 1.3%, respectively, and the mAP is improved by 1.9%. The improvement in mAP is clearly visible in Figure 10. Therefore, we conclude that this comprehensive approach is feasible.
4.
Results of comparative experiments with the addition of attention mechanisms.
To verify the effectiveness of the attention mechanism, the performance of the improved attention mechanism was compared with that of the original attention mechanism. For this purpose, several models were trained and evaluated, including the original model, a model with only the improved attention mechanism added, a model with only CBAM added, a model with only ECA added, a model with fused CBAM and ECA (referred to as BE in the figure), and YOLOv11. The results are shown in Table 7, and the mAP curve is presented in Figure 11. As shown in the table, the accuracy of the model with the attention mechanism added (92.0%) is higher than that of the original model (90.8%). Moreover, the model maintains superior performance in detecting both smoldering and open fires. The fused attention mechanism outperforms the other two individual attention mechanisms in terms of both accuracy and mAP values. By integrating the attention mechanisms, the model’s feature extraction capability is enhanced, thereby improving its overall detection performance.

3.3. Comparative Tests

The comparison experiment used two datasets: the first was a custom-made cotton fire dataset named Fire1, and the second was a public dataset named Fire2.
Multi-model validation was conducted on the Fire1 dataset, with the results shown in Table 8. The proposed algorithm demonstrated significant advantages across multiple key metrics. It has only 1.6 million parameters, which is far lower than other models such as YOLOv3-tiny (9.5 million), YOLOv5s (2.2 million), and YOLOv10n (2.7 million). Additionally, compared to the improved models in references [4,11], the optimized lightweight model has the lowest parameter count, significantly reducing hardware resource consumption. Furthermore, the algorithm achieves accuracy rates of 92.3% and 94.7% for the “Smoldering” and “Flames” categories, respectively. The overall precision (All Pr) reaches 92.7%, which is 1.9% higher than the original model and surpasses most other comparison models. The improved model’s mAP value reaches 97.6%, outperforming most competing models and ensuring high detection accuracy. Moreover, the computational complexity (GFLOPs) of this algorithm is only 3.6, the lowest among all models, and the model size is merely 3.5 MB, also the smallest. This achieves low resource consumption and makes it more suitable for deployment in real-world cotton picker operations. More importantly, while maintaining high performance, the frame rate (FPS) reaches 85.5, an increase of 10 frames per second compared to the original YOLOv11, and outperforms other models. In summary, this algorithm combines high accuracy, real-time performance, outstanding lightweight design, and high efficiency, offering superior performance and lower resource consumption compared to existing models.
To validate the model’s generalization capability, the public dataset fire2 was used to verify whether the model performs better than YOLOv11 on other datasets after optimization. A second comparison experiment was conducted using the fire2 dataset, with the results shown in Table 9. As can be observed from the table, the algorithm demonstrates excellent performance on another dataset, achieving an accuracy of 92.3% and an average precision (mAP%) of 96.3%. These two metrics not only demonstrate the model’s high accuracy and reliability but also highlight its strong generalization capability. Even when faced with different data distributions and scene changes, this algorithm can maintain high-precision detection performance. Additionally, its computational complexity is as low as 3.8 GFLOPs, and the model size is only 3.5 MB, indicating that it is not only efficient and lightweight but also demonstrates its broad applicability and stability across various application scenarios. Therefore, whether on the initial evaluation dataset or other datasets, this algorithm demonstrates good generalization capabilities.

3.4. Ablation Experiment

After comparing the performance of different visual detection algorithms, a set of ablation experiments was designed to compare different improvement mechanisms and test their performance in identifying cotton fire hazards. The improvement mechanisms include replacing the backbone of the YOLO algorithm with MobileNetV2 and replacing the C3k2 convolution in the neck module with partial convolution. An integrated CBAM-ECA mechanism is incorporated into the neck module, while the loss function is modified within the detection head to enhance model performance. The results are shown in the following Table 10. The table provides the following information: In this ablation experiment, replacing the backbone of YOLO with the MobileNetV2 network structure significantly reduces the network’s computational complexity and further reduces the model size of the optimal weights. As noted in Section 2.2.3, replacing the backbone network of YOLOv11 with MobileNetV2 significantly reduces the number of parameters in the model. However, since this network uses 3 × 3 convolutional layers, it does limit the receptive field of the model, resulting in a decrease in the mAP50 value and all three accuracy metrics. By partially replacing the standard convolutions in C3k2 with partial convolutions, the model’s accuracy is improved, compensating for the loss in precision. Additionally, as validated in the preceding section, incorporating the CBAM-ECA attention mechanism enhances the model’s feature extraction capabilities, increasing the accuracy rate from 90.8% to 92.0%. It is considered that there is only one improvement in Mobilenet_v2 between No. 7 and No. 8, and the differences in smoldering accuracy, flaming accuracy, overall accuracy, and mAP values are less than 0.3%, 0.5%, 0.4%, and 0.1%, respectively. Meanwhile, the model’s parameter count is reduced from 2.58M to 1.57M, and the model size is reduced from 5.5 MB to 3.3 MB. The computational complexity (GFLOPs) is only 3.8, significantly lower than that of other models, meaning that the model requires fewer computational resources and runs faster in practical applications, making it suitable for deployment on resource-constrained devices. Considering the working location and mode of cotton pickers, it was decided to incorporate MobileNetV2 into the optimization process, sacrificing a small amount of accuracy to achieve a reduced computational load and parameter count, thereby significantly improving the recognition speed.

3.5. Results of Instance Verification

The example detection image is shown in Figure 12 below. In this figure, it can be observed that there is no significant difference between the detection of a single burning cotton and smoldering cotton. However, in images containing multiple burning and smoldering instances, the improved algorithm shows a noticeable difference. The improved model is better able to focus on the fire areas and reduce background noise interference, indicating that it has enhanced feature extraction capabilities and higher detection accuracy.
Model validation on the fire2 dataset; the instance detection map is shown in Figure 13 below.
In this figure, it can be seen that the improved algorithm performs better in these cases. It achieves higher accuracy under different environmental conditions, adapts more effectively to various complex scenarios, and reduces both false positives and false negatives through optimization, thereby improving the overall detection accuracy. Furthermore, the generalization ability of the model is validated as feasible through the use of the second dataset.

3.6. Data Visualization Heat Map Analysis

To demonstrate how the model makes decisions regarding the presence or absence of cotton fire and which parts of the image it primarily relies on, Grad-CAM++ technology is employed to generate heatmaps. This helps verify whether the model has correctly learned the relevant features, thereby ensuring the accuracy of its flame detection. Grad-CAM++ is an improved version of Grad-CAM [30,31], which computes feature map weights by performing pixel-level weighted averaging of gradients. This method better captures the importance of specific activation maps and avoids the issue of gradient saturation. The heatmap of cotton fire situations obtained using this technique is shown in Figure 14. In the generated heatmap, red and yellow areas indicate regions that the model focuses on—that is, where fires are present. When compared with other models such as YOLOv3-tiny, YOLOv5, YOLOv8, YOLOv10, and YOLOv11, the improved algorithm effectively identifies both smoldering and open flame regions and marks them with accurate bounding boxes. In identifying cotton clusters at different combustion stages, the improved algorithm can more accurately locate flame regions while reducing background interference and false positives. YOLOv3-tiny shows lower focus on target areas, with a more dispersed heat distribution and some missed detections. YOLOv8 demonstrates improved focus but still exhibits regions with low heat intensity. YOLOv10 presents more concentrated heatmaps, although there are inaccuracies in the heat distribution. YOLOv11 performs similarly. The improved algorithm generates heatmaps that better highlight flame areas, with more precise bounding box positioning. While the original YOLOv11 model can identify flame regions to some extent, the improved model performs significantly better under the same conditions. It focuses more accurately on the specific areas where cotton fires occur, showing higher activation intensity and more concentrated distributions in the heatmaps. This indicates that the model has learned flame-related features more thoroughly and possesses stronger discriminative capabilities and localization accuracy.
This improvement is primarily attributed to structural optimizations in the model and the introduction of more effective attention mechanisms, thereby significantly enhancing the accuracy and practicality of fire detection.

4. Conclusions

Experiments have shown that the sample data of cotton fire situations serves as the detection target, and the diversity of the samples is achieved through data augmentation techniques. Replacing the backbone with the MobileNetV2 network has significantly improved the model’s lightweight performance. This model has fewer parameters, resulting in faster computation speed, making it highly suitable for deployment in embedded environments. By incorporating a fused attention mechanism and partial convolution, the feature extraction capability of the model is enhanced, thereby improving its accuracy. Moreover, after modifying the loss function of YOLOv11, the model’s localization and detection capabilities are further strengthened.
In comparison with models such as YOLOv3-tiny, YOLOv5s, YOLOv8, YOLOv10, and YOLOv11, in the detection of cotton fires. The improved model achieves the best performance in terms of model parameters, with a parameter count of only 1.57M. This is 1.01M fewer than the original model and significantly lower than the other models. At the same time, the model achieves the highest accuracy in cotton fire recognition. The recognition accuracies for smoldering and open flame fires are 92.3% and 94.7%, respectively, with the overall detection accuracy reaching 92.7%—the highest among all models. In terms of detection speed, the model achieves the fastest inference speed of 85.5 FPS. In general, compared with other models, the improved model demonstrates superior performance in accuracy, efficiency, and speed. This approach provides a lightweight solution for the embedded deployment of computer vision recognition and offers a new idea for fire prevention and extinguishing strategies for the cotton collection box of cotton pickers.
The shortcomings are that the model’s accuracy and detection speed still need further improvement, which provides new insights and reference ideas for future research directions. In terms of real-time detection during model deployment, it is also important to consider comparisons of detection performance across different hardware devices. This will help guide future research toward achieving high-precision fire prevention and suppression detection for cotton-picking machines.

Author Contributions

Conceptualization, C.H., Z.S. and F.W.; methodology, D.S. and F.W.; design, Z.S., F.W. and Y.W.; analysis, Z.S. and F.W.; F.W. and Z.S. wrote the paper. All authors have read and agreed to the published version of the manuscript.

Funding

This research was funded by the Xinjiang Uygur Autonomous Region Natural Science Foundation Project: Research on Fire Mechanism and Monitoring System of Cotton Picker (2022D01A77) and the Xinjiang agricultural machinery R & D and manufacturing promotion and application integration project: Cotton picker automatic alignment navigation and fire monitoring system R & D and manufacturing promotion and application (YTHSD 2022-04-02).

Institutional Review Board Statement

Not applicable.

Data Availability Statement

The dataset used in this research is available upon valid request to any of the authors of this research article.

Conflicts of Interest

The authors declare no conflicts of interest.

References

  1. Ren, D.; Liu, H.; Sun, H.J. Forest flame detection with feature constraints and spatial domain frequency domain interaction. J. Saf. Environ. 2025, 1–10. [Google Scholar] [CrossRef]
  2. Gong, W.; Xiao, D.; He, B. Fire Target Detection Algorithm Based on Improved YOLOv7. J. Combust. Sci. Technol. 2024, 30, 394–402. [Google Scholar]
  3. Wang, Z.; Zhang, J. Research on improved YOLOv8 lightweight fire detection algorithm based on. Comput. Technol. Dev. 2024, 34, 61–68. [Google Scholar] [CrossRef]
  4. Deng, L.; Zhou, J.; Liu, Q. Flame and smoke detection algorithm based on improved YOLOv8. J. Tsinghua Univ. Nat. Sci. Ed. 2025, 65, 681–689. [Google Scholar] [CrossRef]
  5. Guo, J.; Liu, L.; He, J. Fire Detection Algorithm for UAV Aerial Photography Based on Improved YOLOv8. J. For. Eng. 2025, 10, 111–122. [Google Scholar] [CrossRef]
  6. Chen, K.; Tian, X.; Guan, Y. Smoke and fire detection algorithm for chemical plants based on improved YOLOv8. Control. Eng. 2025, 1–9. [Google Scholar] [CrossRef]
  7. Yun, B.; Xu, X.; Zeng, J.; Lin, Z.; He, J.; Dai, Q. An Improved Unmanned Aerial Vehicle Forest Fire Detection Model Based on YOLOv8. Fire 2025, 8, 138. [Google Scholar] [CrossRef]
  8. Li, Y.; Song, X.; Lin, F.; Fang, X. Enhanced flame detection in virtual tunnels using DEV-YOLOv8 and digital twin systems. Simul. Model. Pract. Theory 2025, 143, 103143. [Google Scholar] [CrossRef]
  9. Li, D.; Yang, T.; Zhou, J.; Wu, S.-q.; Liu, Q.-y. YOLOv8-EMSC: A lightweight fire recognition algorithm for large spaces. J. Saf. Sci. Resil. 2024, 5, 422–431. [Google Scholar] [CrossRef]
  10. Liu, H.; Zhu, J.; Xu, Y.; Xie, L. Mcan-YOLO: An Improved Forest Fire and Smoke Detection Model Based on YOLOv7. Forests 2024, 15, 1781. [Google Scholar] [CrossRef]
  11. Shao, D.; Liu, Y.; Liu, G.; Wang, N.; Chen, P.; Yu, J.; Liang, G. YOLOv7scb: A Small-Target Object Detection Method for Fire Smoke Inspection. Fire 2025, 8, 62. [Google Scholar] [CrossRef]
  12. Alkhammash, E.H. Multi-Classification Using YOLOv11 and Hybrid YOLO11n-MobileNet Models: A Fire Classes Case Study. Fire 2025, 8, 17. [Google Scholar] [CrossRef]
  13. Huo, Y.; Zhang, Y.; Xu, J.; Dai, X.; Shen, L.; Liu, C.; Fang, X. A Small-Sample Target Detection Method for Transmission Line Hill Fires Based on Meta-Learning YOLOv11. Energies 2025, 18, 1511. [Google Scholar] [CrossRef]
  14. Han, T.; Yu, S.; Ma, L.; Huang, Y.; Hou, S.; Pang, J. Research on the Detection Model of Foreign Objects and Defects in Photovoltaic Panels Based on Improved YOLOv11n. Comput. Eng. Appl. 2025, 61, 123–134. [Google Scholar] [CrossRef]
  15. Liu, H.; Huang, Z.; Qiu, B.; Wang, K. Major defect detection method for transmission lines based on improved YOLOv11n. High Volt. Technol. 2025, 1–12. [Google Scholar] [CrossRef]
  16. Wang, Z.; Wu, H.; Chen, F. Solar cell microdefect detection method based on improved YOLO11. Laser Optoelectron. Prog. 2025, 1–16. Available online: http://kns.cnki.net/kcms/detail/31.1690.tn.20250409.1031.074.html (accessed on 12 April 2025).
  17. Sandler, M.; Howard, A.; Zhu, M.; Zhmoginov, A.; Chen, L.-C. MobileNetV2: Invertedresiduals and linear bottlenecks. In Proceedings of the 2018 IEEE/CVF Conference on Computer Vision and Pattern Recognition (CVPR), Salt Lake City, UT, USA, 18–23 June 2018; pp. 4510–4520. [Google Scholar]
  18. Yue, Y.; Zhang, W. Detection and Counting Model of Soybean at the Flowering and Podding Stage in the Field Based on Improved YOLOv5. Agriculture 2025, 15, 528. [Google Scholar] [CrossRef]
  19. Ye, P.; Zhang, H.; Zhou, X. CNN-CBAM-LSTM: Enhancing Stock Return Prediction Through Long and Short Information Mining in Stock Prediction. Mathematics 2024, 12, 3738. [Google Scholar] [CrossRef]
  20. Bui, T.D.; Do Le, T.M. Ghost-Attention-YOLOv8: Enhancing Rice Leaf Disease Detection with Lightweight Feature Extraction and Advanced Attention Mechanisms. AgriEngineering 2025, 7, 93. [Google Scholar] [CrossRef]
  21. Tong, X.; Liang, Z.; Liu, F. Succulent Plant Image Classification Based on Lightweight GoogLeNet with CBAM Attention Mechanism. Appl. Sci. 2025, 15, 3730. [Google Scholar] [CrossRef]
  22. Hu, Q.; Zhang, Y. GCS-YOLO: A Lightweight Detection Algorithm for Grape Leaf Diseases Based on Improved YOLOv8. Appl. Sci. 2025, 15, 3910. [Google Scholar] [CrossRef]
  23. Ji, Y.; Zhang, D.; He, Y.; Zhao, J.; Duan, X.; Zhang, T. Improved YOLO11 Algorithm for Insulator Defect Detection in Power Distribution Lines. Electronics 2025, 14, 1201. [Google Scholar] [CrossRef]
  24. Chen, K.; Diao, Y.; Wang, Y.; Zhang, X.; Zhou, Y.; Gu, M.; Zhang, B.; Hu, B.; Li, M.; Li, W.; et al. MCT-CNN-LSTM: A Driver Behavior Wireless Perception Method Based on an Improved Multi-Scale Domain-Adversarial Neural Network. Sensors 2025, 25, 2268. [Google Scholar] [CrossRef]
  25. Liu, Z.; Zhang, Y.; Teng, G. Identification Method of Mature Wheat Varieties Based on Improved DenseNet Model. Agriculture 2025, 15, 736. [Google Scholar] [CrossRef]
  26. Chen, X.; Wang, S.; Dinavahi, V.; Yang, L.; Wu, D.; Shen, M. Landslide Recognition Based on DeepLabv3+ Framework Fusing ResNet101 and ECA Attention Mechanism. Appl. Sci. 2025, 15, 2613. [Google Scholar] [CrossRef]
  27. Wang, H.; Zhang, Y.; Li, Z.; Li, M.; Wu, H.; Jia, Y.; Yang, J.; Bi, S. An Efficient Method for Counting Large-Scale Plantings of Transplanted Crops in UAV Remote Sensing Images. Agriculture 2025, 15, 511. [Google Scholar] [CrossRef]
  28. Zhang, J.; Jiang, C. DAHD-YOLO: A New High Robustness and Real-Time Method for Smoking Detection. Sensors 2025, 25, 1433. [Google Scholar] [CrossRef]
  29. Gao, X.; Du, J.; Liu, X.; Jia, D.; Wang, J. Object Detection Based on Improved YOLOv10 for Electrical Equipment Image Classification. Processes 2025, 13, 529. [Google Scholar] [CrossRef]
  30. Sultan, T.; Chowdhury, M.S.; Safran, M.; Mridha, M.F.; Dey, N. Deep Learning-Based Multistage Fire Detection System and Emerging Direction. Fire 2024, 7, 451. [Google Scholar] [CrossRef]
  31. Gupta, S.; Dubey, A.K.; Singh, R.; Kalra, M.K.; Abraham, A.; Kumari, V.; Laird, J.R.; Al-Maini, M.; Gupta, N.; Singh, I.; et al. Four Transformer-Based Deep Learning Classifiers Embedded with an Attention U-Net-Based Lung Segmenter and Layer-Wise Relevance Propagation-Based Heatmaps for COVID-19 X-ray Scans. Diagnostics 2024, 14, 1534. [Google Scholar] [CrossRef]
Figure 1. Cotton fire data set example. (a) a single open flame, (b) multiple open flame, (c) obscured open flames and smoldering fire, (d) smoldering fire, (e) obscured smoldering fire.
Agriculture 15 01608 g001
Figure 2. Cotton fire data set example. (a) original image, (b) horizontal mirroring, (c) vertical flipping, (d) Gaussian noise, (e) brightness enhancement, (f) random cropping.
Agriculture 15 01608 g002
Figure 3. Improved YOLOv11 structure diagram (the asterisk indicates the improvement).
Agriculture 15 01608 g003
Figure 4. Loss function principle diagram. (a,b) are all IoU loss functions. (c) is CIoU, (d) is DIoU loss function.
Agriculture 15 01608 g004
Figure 5. The inverted residual structure and main network structure of MobileNetV2. (a) the inverted residual structure, (b) Main network structure.
Agriculture 15 01608 g005
Figure 6. Partial convolution module structure diagram. (a) Partial convolution structure diagram, (b) Convolution improvement structure diagram.
Agriculture 15 01608 g006
Figure 7. CBAM-ECA attention mechanism structure diagram.
Agriculture 15 01608 g007
Figure 8. Loss curve and map value curve diagram.
Agriculture 15 01608 g008
Figure 9. Comparison of mAP value curve between MobileNetV2 and the original model.
Agriculture 15 01608 g009
Figure 10. Comparison of map values curve between the partial convolution and the original model.
Agriculture 15 01608 g010
Figure 11. Comparison of map values curve between different attention mechanisms and original models.
Agriculture 15 01608 g011
Figure 12. Detection performance of different models.
Agriculture 15 01608 g012
Figure 13. Dataset 2—Performance evaluation of different models.
Agriculture 15 01608 g013
Figure 14. Heat map visualization.
Agriculture 15 01608 g014
Table 1. Data classification table.
Data SetTotalFlameSmoldering
Training set328019801300
Test set410280130
Validation set410200210
Table 2. MobileNetV2 parameter structure table.
Number of LayersOperationConvolution KernelNumber of RepetitionsStride
1Conv3 × 312
2Bottleneck3 × 3, 1 × 111
3~4Bottleneck3 × 3, 1 × 122
5~7Bottleneck3 × 3, 1 × 132
8~11Bottleneck3 × 3, 1 × 141
12~14Bottleneck3 × 3, 1 × 132
15~17Bottleneck3 × 3, 1 × 132
18Bottleneck3 × 3, 1 × 111
19Conv1 × 111
20Avgpool7 × 71-
21Conv1 × 1 × k1-
Table 3. Experimental parameter setting table.
ParametersValue
Lr0.01
Epoch1000
Iou0.7
Momentum0.937
OptimizerSGD
Table 4. Loss function metric data.
ModelPrAll Pr
/%
Recall
/%
MAP
/%
Smoldering/%Flame/%
YOLOv1190.991.790.893.595.1
+DIoU90.992.691.392.295.2
Table 5. MobileNetV2 experimental data evaluation indicators.
ModelPrAll Pr
/%
Recall
/%
mAP
/%
Smoldering/%Flame/%
YOLOv1190.991.790.893.595.1
+MobileNetV290.690.090.494.395.0
Table 6. Improved partial convolution evaluation indicators.
ModelPrAll Pr
/%
Recall
/%
mAP
/%
Smoldering/%Flame/%
YOLOv1190.991.790.890.695.1
+Pcov91.893.592.191.097.3
Table 7. Evaluation metrics for adding different attention mechanisms.
ModelPrAll Pr
/%
Recall
/%
mAP
/%
Smoldering/%Fire/%
Yolov1190.991.790.893.595.1
+CBAM91.492.791.690.596.6
+ECA90.992.291.090.496.8
+CBAM-ECA92.093.092.089.597.3
Table 8. Generalized experiment results table.
ModelNumber of Parameters
/M
PrAll Pr
/%
Map
/%
GFLOPsSize
/MB
FPS
Smoldering/%Flame/%
Yolov3-tiny9.587.286.386.892.214.319.271.4
Yolov5s2.287.484.185.792.65.84.778.5
Yolov8n2.789.884.686.892.86.95.781.3
Reference 42.888.084.286.191.46.38.177.1
Yolon10n2.787.684.387.491.38.25.979.3
Yolov112.690.991.790.895.16.35.575.5
Reference 113.988.584.586.692.38.58.371.4
This algorithm1.692.394.792.797.63.83.585.5
Table 9. Comparison of experimental results from different models.
ModelNumber of Parameters
/M
Pr
/%
Map
/%
GFLOPsSize
/MB
Yolov112.690.195.36.35.5
This algorithm1.692.396.33.83.5
Table 10. Ablation experiment.
Number+DIoU+Pconv+MN+BESize/MBPrAll PrRecallMAP
/%
GFLOPsNum of Para/M
Smoldering/%Fire/%
1 5.590.991.790.893.595.16.32.58
2 5.590.992.691.392.295.26.32.58
3 5.391.893.592.191.097.35.92.50
4 3.690.690.090.894.395.03.91.62
5 5.592.093.092.089.597.36.32.58
6 3.591.492.891.691.796.53.71.58
7 4.492.695.293.190.397.75.22.08
83.592.394.792.790.697.63.81.57
Disclaimer/Publisher’s Note: The statements, opinions and data contained in all publications are solely those of the individual author(s) and contributor(s) and not of MDPI and/or the editor(s). MDPI and/or the editor(s) disclaim responsibility for any injury to people or property resulting from any ideas, methods, instructions or products referred to in the content.

