Article

A Seed Vigor Test Through a Biospeckle Laser: A Comparison of Local and Global Analyses

by
Bruno Vicentini
1,
Roberto Alves Braga
1,*,
José Luís Contado
2,
José Eduardo da Silva Gomes
3 and
Rolando de Jesus Gonzalez-Peña
4
1
Departament of Automatica (DAT), School of Engineering, Federal University of Lavras (UFLA), Lavras 37203202, MG, Brazil
2
Departament of Food Science (DCA), Federal University of Lavras (UFLA), Lavras 37203202, MG, Brazil
3
Mechatronics Department (DMCVG), Federal Centre for Technological Education of Minas Gerais (CEFET-MG), Varginha 37203202, MG, Brazil
4
Department Fisiologia, Unidad de Biofísica y Física Médica, Facultad de Medicina y Odontología, Universidad de Valencia, 46010 Valencia, Spain
*
Author to whom correspondence should be addressed.
Agriculture 2025, 15(14), 1553; https://doi.org/10.3390/agriculture15141553
Submission received: 16 June 2025 / Revised: 8 July 2025 / Accepted: 17 July 2025 / Published: 19 July 2025

Abstract

Seed vigor testing traditionally requires large sample sizes and extended durations. The biospeckle laser (BSL) technique offers a faster, image-based alternative for seed analysis though the standardization of set protocols. This study evaluated the efficiency of local and global BSL analyses in bean seeds (Phaseolus vulgaris L.). Two groups of seeds (872 in total) were classified into high- and low-vigor seeds using the emergence test over 800 samples. The BSL test was then applied to 72 seeds (36 per group), analyzing biological activity locally (vascular and embryonic areas) and globally (whole image). BSL analysis detected significant differences between the groups (p < 0.05). Among the methods, the local analysis of the embryonic axis was most effective (F = 44.252, p = 0.000), showing a clearer distinction than the global analysis (F = 19.484, p = 0.000). The vascular area analysis did not yield significant results. These findings highlight the efficiency of the local BSL analysis at the embryonic axis for vigor tests compared to the global analysis. However, it was observed that the selected point in the local analysis affects the reliability of the vigor test. It was a relevant step toward standardization demanding additional tests in other species and varieties.

1. Introduction

Vigor tests provide critical information regarding seed quality [1,2], and they are recognized by the International Seed Testing Association (ISTA) [3]. Traditional methods for assessing seed vigor include standard germination tests, seedling growth evaluations, and the tetrazolium test (TT), among others, such as the emergence test using the Emergence Speed Index (ESI) [4,5]. However, these conventional approaches are time-consuming and reliant on skilled personnel, making them non-automated [6,7]. Additionally, conventional vigor tests may yield inconsistent results due to variations in germination conditions [6], requiring large seed sample sizes for accurate assessments [6,8].
Therefore, the limitations presented by the traditional tests of a seed’s vigor have motivated the development of novel tests based on the advancement in technology [6]. Techniques such as hyperspectral imaging (HSI), spectroscopy, X-ray imaging, and thermal imaging have emerged as viable alternatives [9]. Furthermore, the integration of machine vision and digital imaging has enhanced optical methods, including the biospeckle laser (BSL) technique, which provides a means of seed vigor assessments. The BSL is considered as fast with a simple setup technique that provides stable analysis using an accessible algorithm [8]. The BSL has large application in seeds, particularly in vigor testing [10].
The biospeckle laser (BSL), also known as laser biospeckle [11], is an interferometric phenomenon that is known by its application in many areas, particularly in agriculture [12]. Its application in seed analysis has been presented as reliable, and it is considered as simple, fast, and objective with the potential to provide automated analysis [8]. The relation between the BSL technique and seed analysis is presented in works using the seeds of maize (Zea mays L.) [13], the seeds of beans (Phaseolus vulgaris L.) [14] and the seeds of peas (Pisum sativum) [15]; these cases particularly target the viability of the seeds.
The adoption of the BSL technique for providing vigor tests was carried out, for example, in the seeds of coffee (Coffea arabica L.) [16,17], in the seeds of chickpeas (Cicer arietinum L.) [18], in the seeds of soybeans (Glycine max L.) [6,19] as well as in the seeds of Canadian Western Red Spring wheat (Triticum aestivum L.) [20].
The assessment of seeds’ vigor by the BSL technique is based on the illumination of the seed, usually without its tegument, after controlled imbibition. The interference pattern observed presents a dynamic appearance that can be linked to the biological activity of the sample. The higher the activity, the higher the “boiling” effect observed by the observer, which in this case is a digital camera [14]. And the level of changes in the speckle pattern can be associated with the biological activity of the seed.
The BSL presents an index known as biospeckle activity (BA) that is a nondimensional magnitude expressed by means of numerical and graphical outcomes that, in the case of the numerical outcome, can be obtained from the whole images of the speckle pattern in time or from a portion of the same images in time. In the case of a seed, when whole-image analysis is carried out, the speckle pattern image can contain the seed over the optical table. Therefore, BA is a global index of activity over all the elements in the image, the seed, and the optical table.
Otherwise, the analysis of BA, in a region of interest (ROI) of the seed, can be named as the local analysis of the BSL; it presents biological activity that is restricted to an ROI within the seed. Usually, the BSL is used in the embryonic axis, since it is one of the areas in the seed that is more active during germination [16,17]. The embryonic area can be divided into the vascular area and the embryonic axis (or radicle) [10].
The Full Time History of the Speckle Patterns (FTHSP) [19], the modified structure function (MSF) associated with the power density function [18,21], and autocorrelation [22] can be examples of the analysis of the whole speckle pattern images in time to obtain a single numerical index to summarize biospeckle activity (BA). However, the main question that arises is as follows: how can the global index address BA to classify high- and low-vigor seeds considering the influence of areas of the seed which do not contribute or have low contribution to its germination? It is necessary to remember that the global index can also bring information from the optical table where the seed is placed during illumination.
Also, the local index can be obtained from an ROI within a seed, for example, from randomly selected points distributed according to a Gaussian function [23]. The points, for example, along the embryonic axis are observed over time, forming the basis of the Time History of the Speckle Pattern (THSP) [23]. The local index is, therefore, the numerical outcome derived from the THSP within a specific region of the seed. Since a seed is a complex organism, the main question we seek to address is as follows: is there a region of interest within the seed that accurately represents the seed’s vigor?
Therefore, in the literature one can observe the application of the BSL on the seed vigor test using the global and local analyses; however, one does not have any comparison of their efficiency.
This study aimed to check the efficiency of the BSL technique in global and local analyses for determining the vigor of seeds. Two Phaseolus vulgaris L. (common bean) seeds were classified by the emergence test in two groups: high-vigor seeds and artificially aged (low-vigor) seeds. Biospeckle activity, adopting the local analysis, was assessed in specific internal regions of the seeds—namely, the vascular area and the embryonic axis—and it was assessed in the entire illuminated seed image, representing the global analysis.
Therefore, this study proposes the adoption of the BSL local analysis as a standard procedure for seed vigor testing in Phaseolus vulgaris L., detailing the experimental setup, seed preparation, and image analysis methodologies. Additionally, recommendations for future research are provided to expand the standardization process to other seed species and varieties.

2. Material and Methods

The comparison of the efficiency of the local and global analyses of seeds’ vigor using the BSL technique was carried out in bean seeds (Phaseolus vulgaris L.). Two groups of seeds were analyzed: seeds with high vigor and seeds with low vigor. The certification quality of the groups before the BSL analysis was provided by the emergence test, particularly the Emergence Speed Index (ESI).

2.1. Seed Preparation

Two kilograms of bean seeds (Phaseolus vulgaris L.), cultivar BRSMG Amuleto with high-vigor seeds, was used to randomly select 872 samples. And the samples were divided into two groups:
-
436 high-vigor seeds, with 36 used in BSL tests and 400 in the emergence test;
-
436 seeds submitted for the accelerated aging process [24], with 36 used in the BSL test and 400 in the emergence test.
In the first step of preparation, all the seeds were sterilized using a 2% sodium hypochlorite (HClO) solution for 1 min and then rinsed eight times with water, followed by two additional rinses with demineralized water.
Half of the seeds were subjected to accelerated aging conditions to obtain the low-vigor group: They were placed in germination boxes (Gerboxes) and incubated in a biochemical oxygen demand (BOD) incubator at 42 °C with 99% relative humidity for 96 h. Afterward, the seeds were dried back to a moisture content of 13% [24].

2.2. Emergence Test

The emergence test was carried out to certify that we had a high-vigor group and a low-vigor group of seeds for the BSL application. The emergence test was conducted using 400 high-vigor and 400 low-vigor seeds, with eight replications of 50 seeds each. The seeds were sown in plastic boxes containing an organic substrate composed of pine bark and vegetable peat. Daily irrigation was applied twice a day.
Seedling emergence was evaluated 11 days after sowing by counting emerged seedlings, defined as those with two fully opened cotyledon leaves above the substrate, as described by Nakagawa (1999) [25]. The Emergence Speed Index (ESI), assessed concurrently with the emergence test, was determined through daily seedling counts conducted between the fourth and ninth days after sowing [26]. The ESI was calculated using Equation (1), which was proposed by Maguire (1962) [27].
E S I = E 1 N 1 + E 2 N 2 + + E n N n
where E1, E2, …, and En are the numbers of daily emerged seedlings and N1, N2, …, and Nn are the numbers of days after sowing, linked to the emerged seedlings by the indices from 1 to n.

2.3. Seed Preparation for BSL Analysis

Seventy-two (72) bean seeds stored at 10 °C with a moisture level of 13% were transferred to room temperature (25 °C).
The preparation of the seeds for BSL analysis followed the ISTA [3] protocol, and in summary, the seeds, 36 high-vigor seeds and 36 low-vigor seeds, were placed in Petri dishes between moistened filter paper at 25 °C in a BOD following ISTA guidelines [3]. After 24 h, the seed coats were removed. The seeds were removed from the closed Petri dish one by one and then split in half, with one cotyledon removed, and the cotyledon portion attached to the embryonic axis, specifically its inner part, was used for illumination experiments.

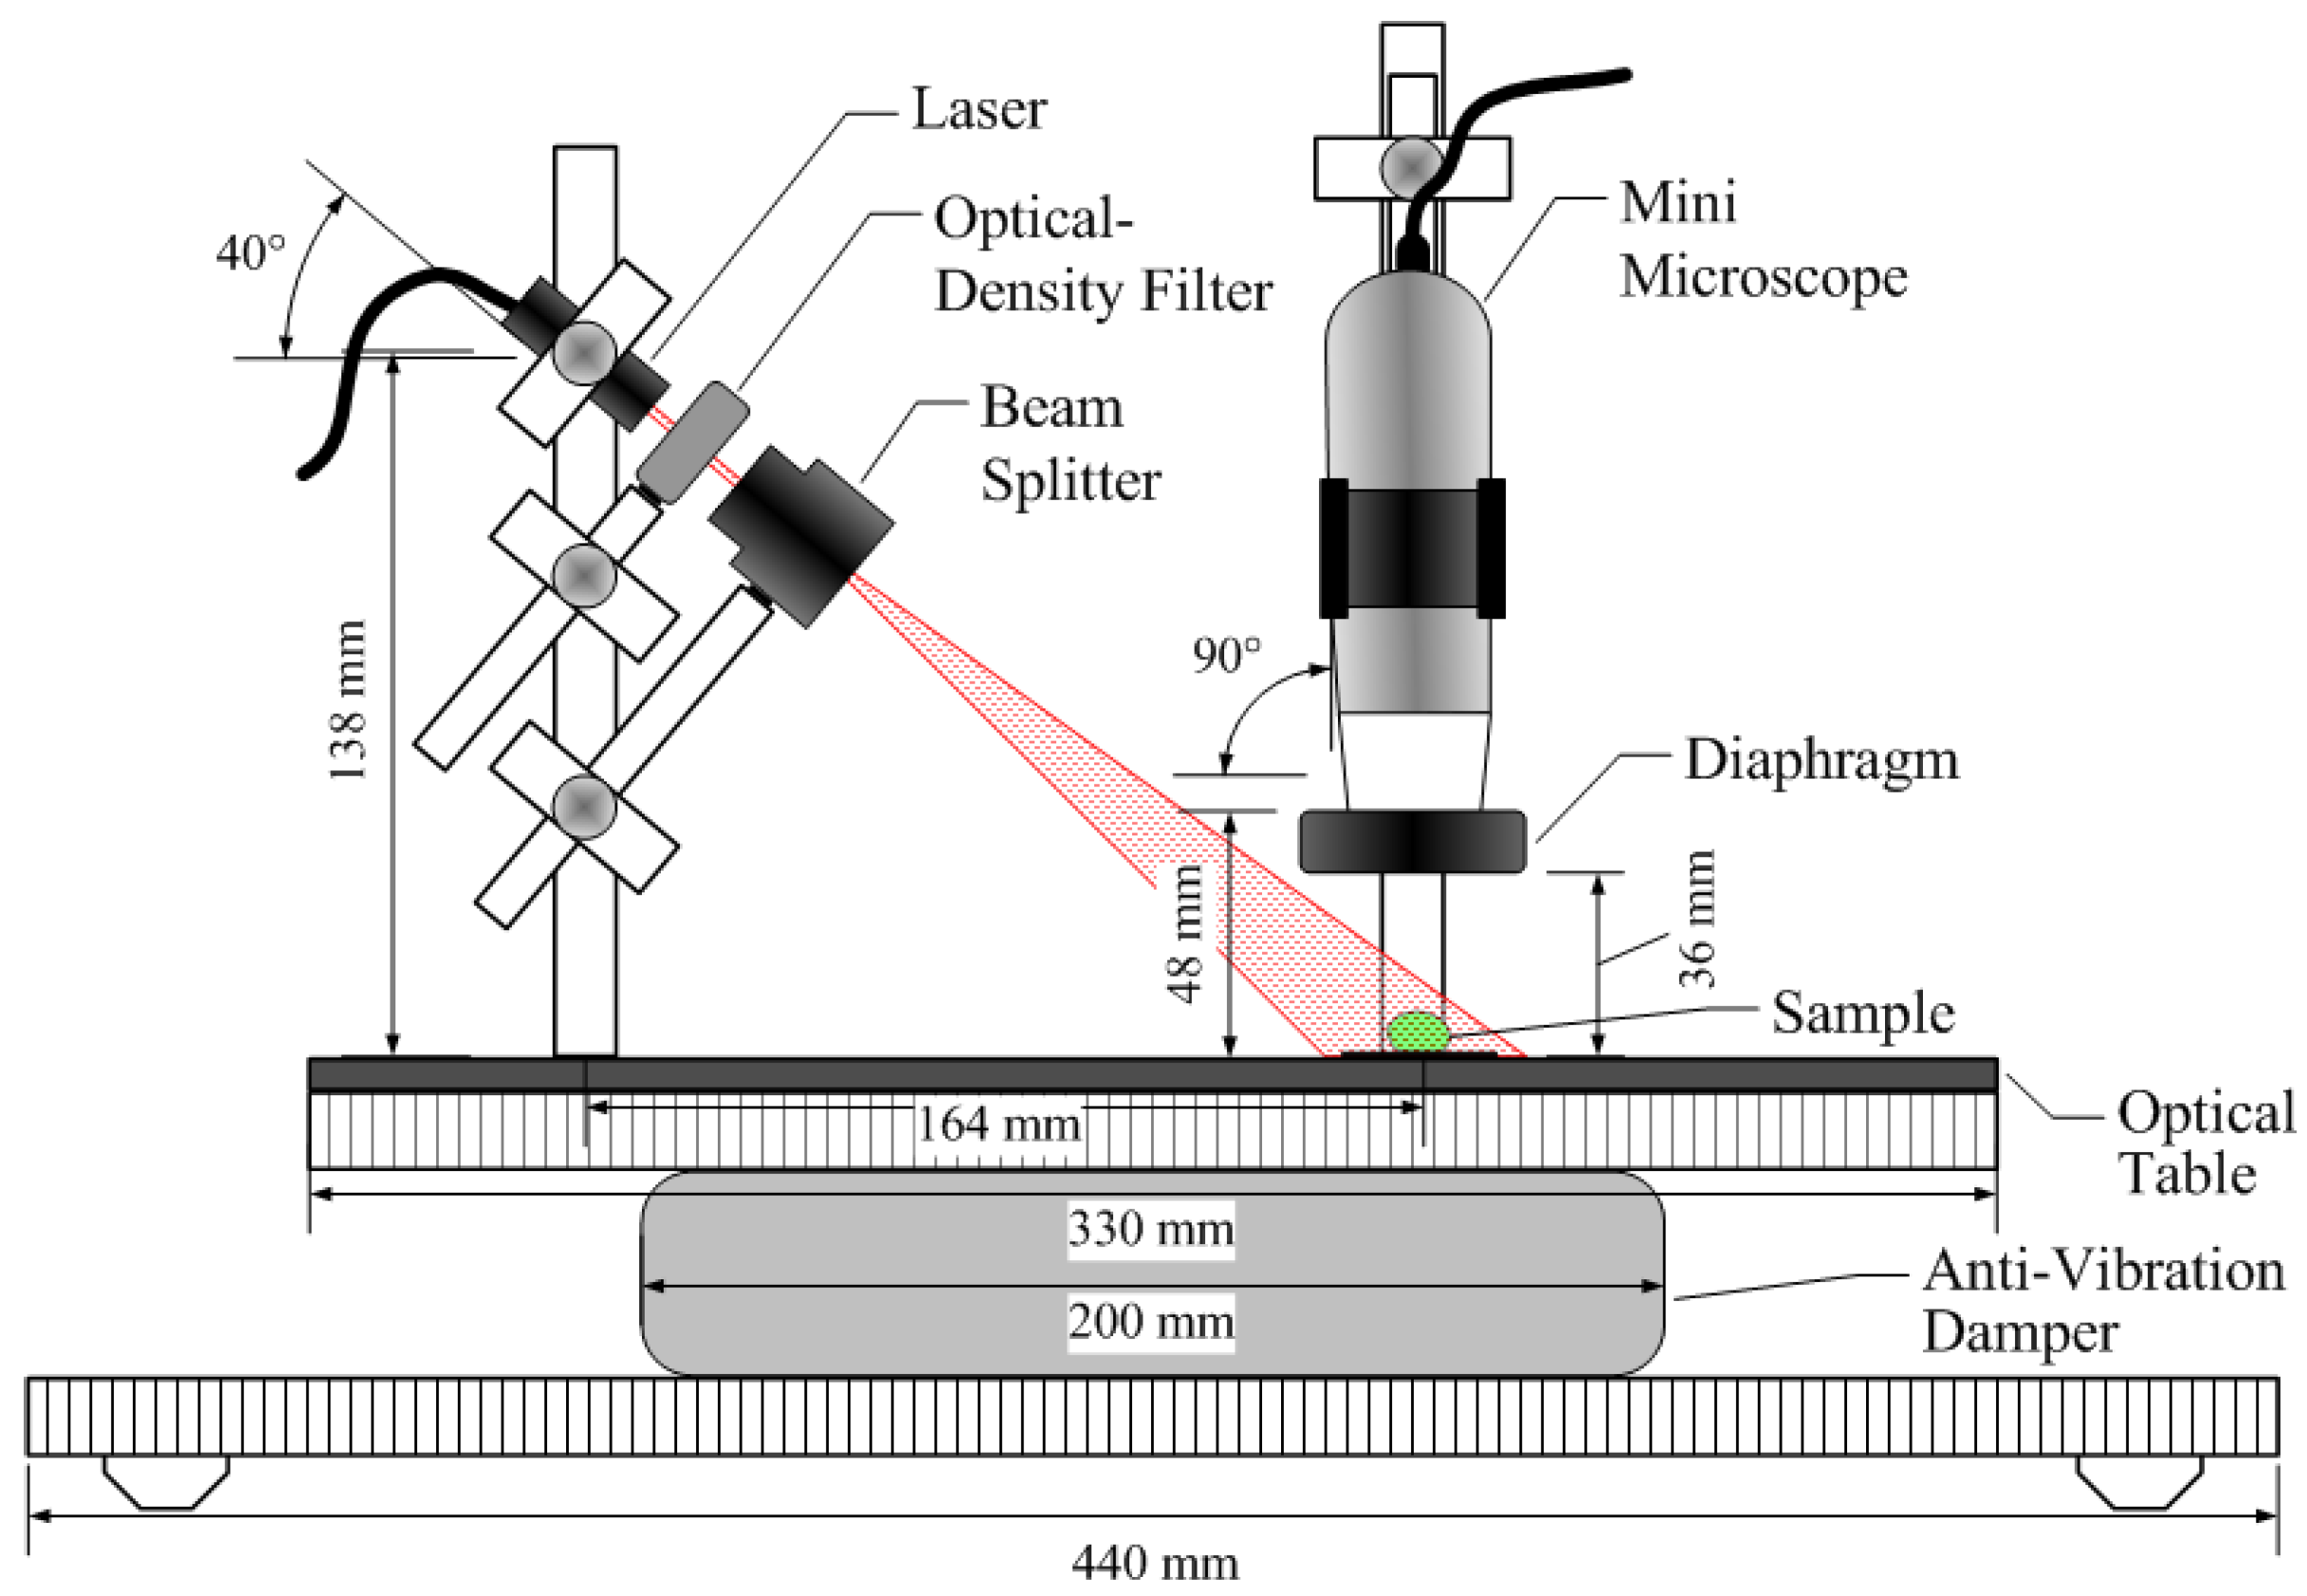
2.4. Hardware for BSL Analysis

The hardware used to carry out the BSL in seeds can be seen in Figure 1 where the back-scattering configuration is presented. It consists of an optical table with an anti-vibration system, a solid-state laser (635 nm/3 mW) associated with a beam splitter, and an optical-density filter of 0.1. The CMOS camera (Dino-Lite US) is a mini microscope (Dino-Lite AM7013MZT, with 5 mega-pixels), with an adapted diaphragm with a 3 mm aperture. The mini microscope was connected to a computer where the images were assembled.

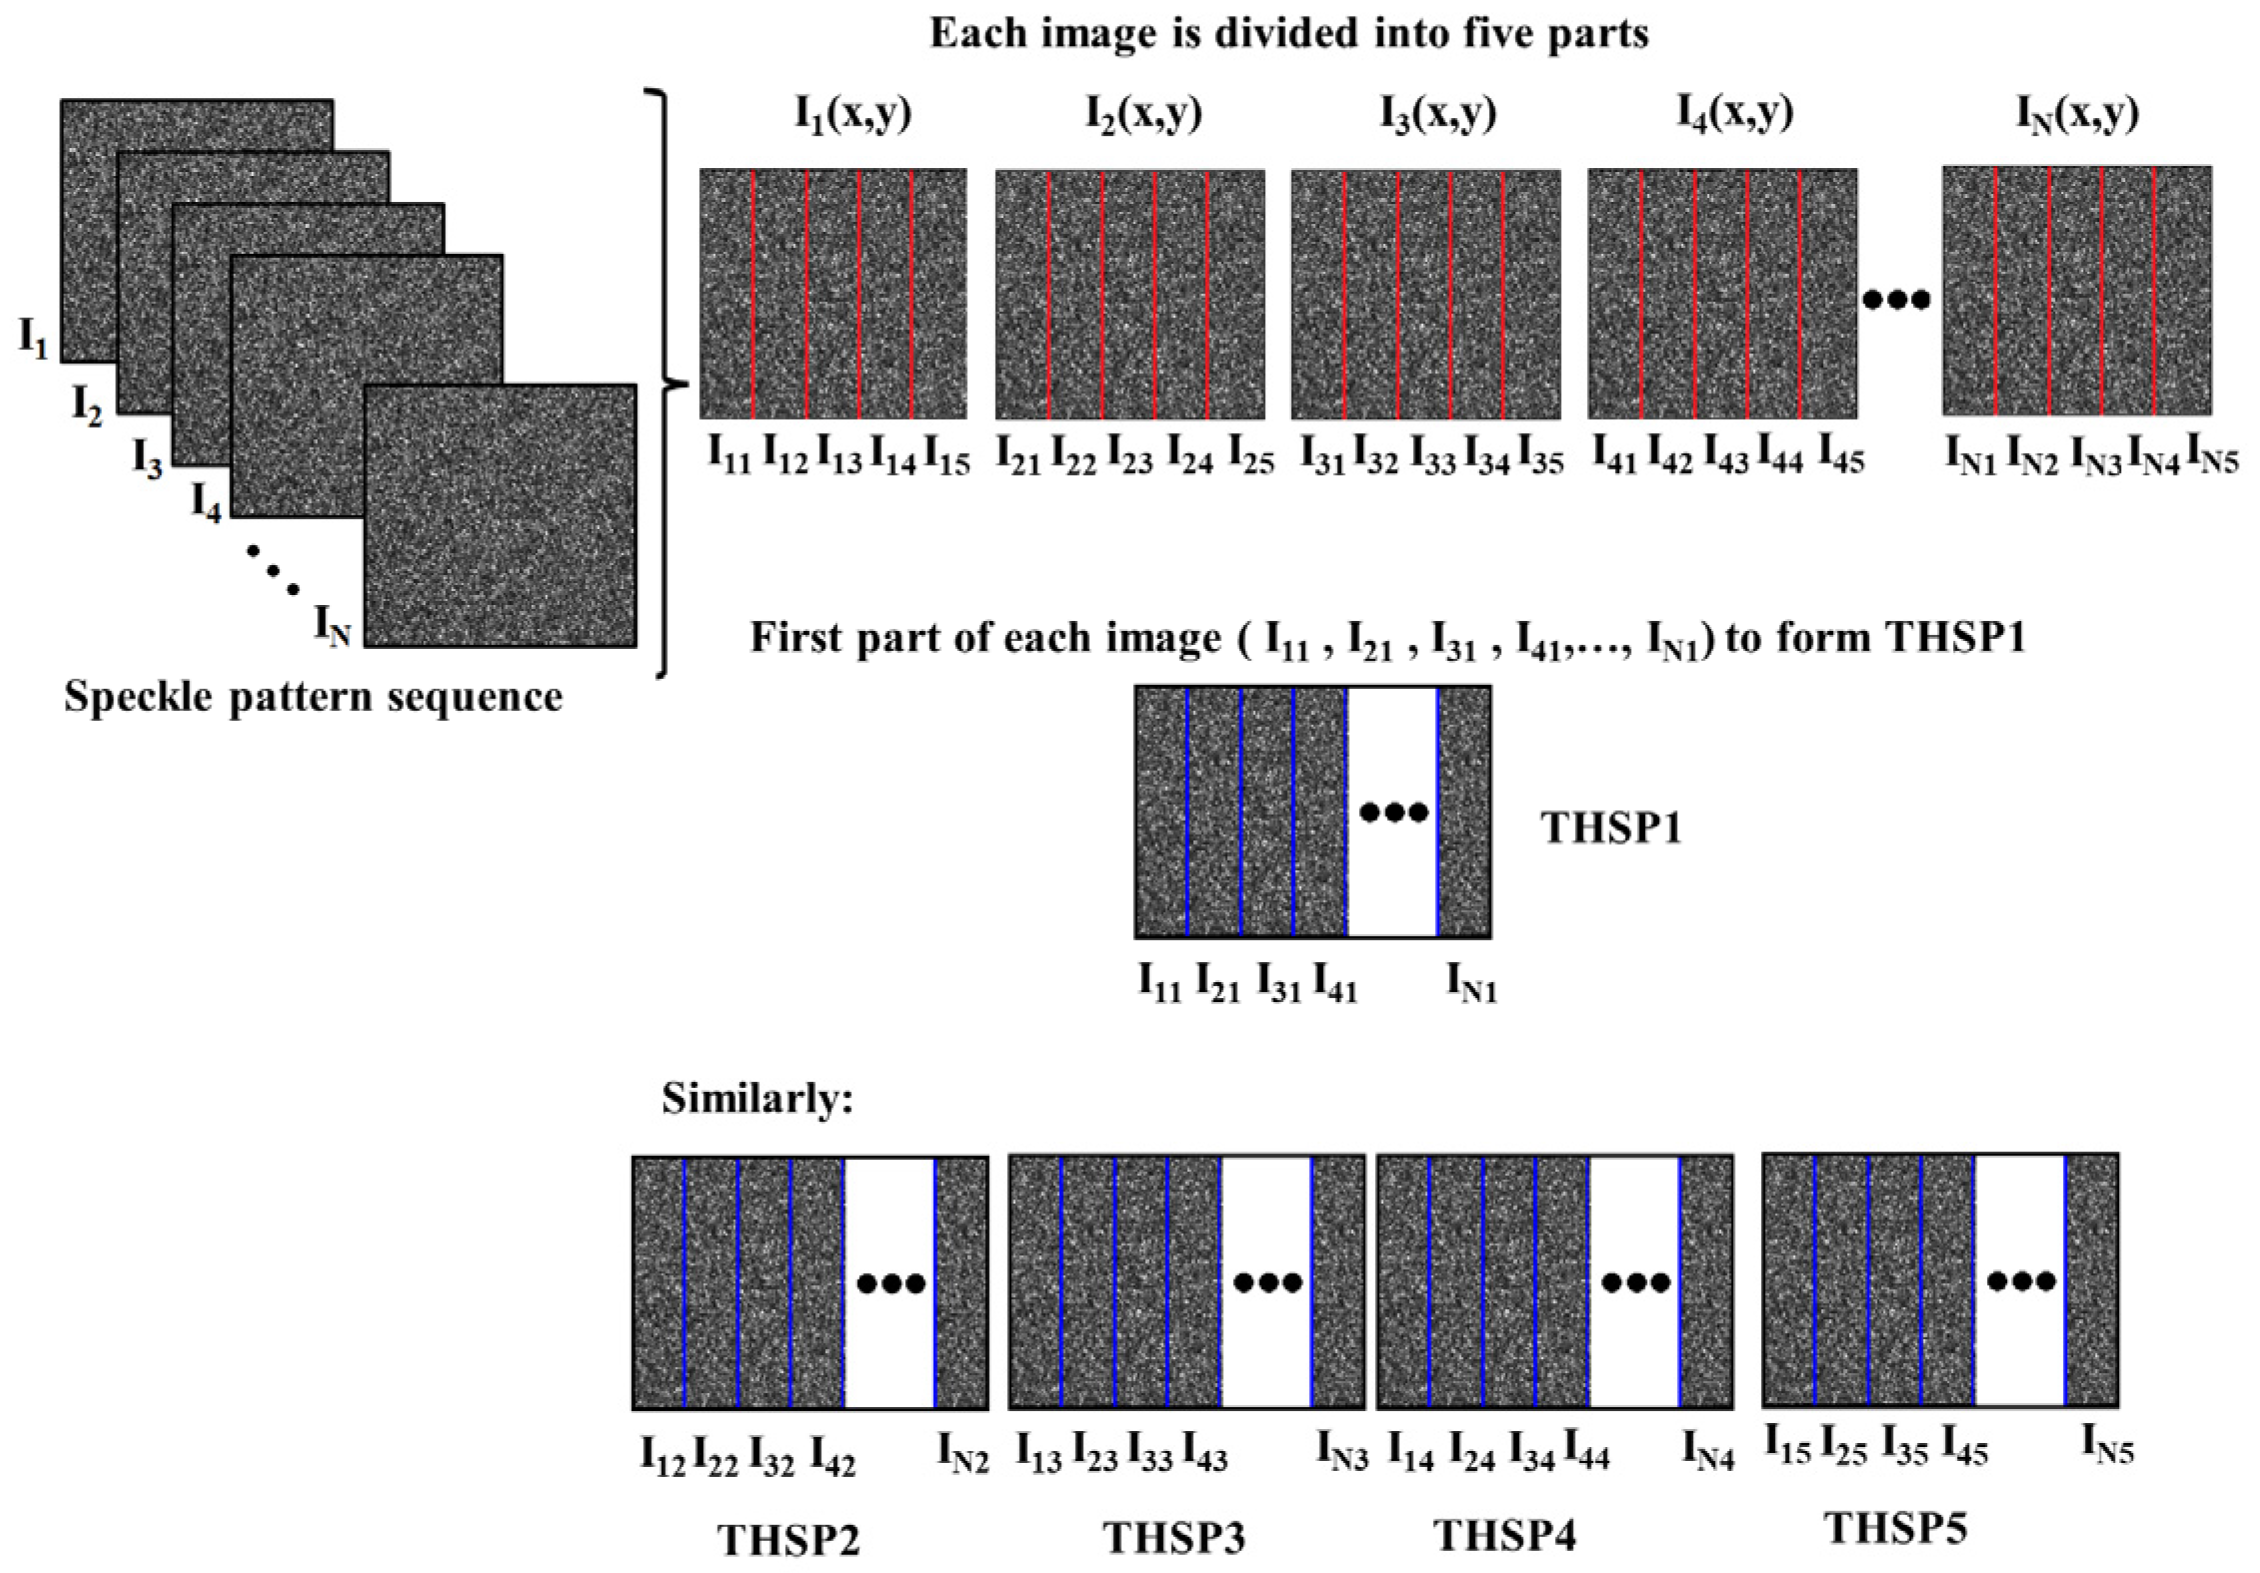
2.5. Image Acquisition and Analysis

In the BSL technique, the laser was set up to illuminate the seeds one by one, and the speckle pattern images were obtained in a frame rate of 10 fps, assembling 128 images for analysis. The quality of the speckle patterns was tested based on their contrast and saturation [18,28,29].
After the quality test protocol, the speckle pattern images were analyzed using local and global approaches, and the BSL numerical outcomes were determined.

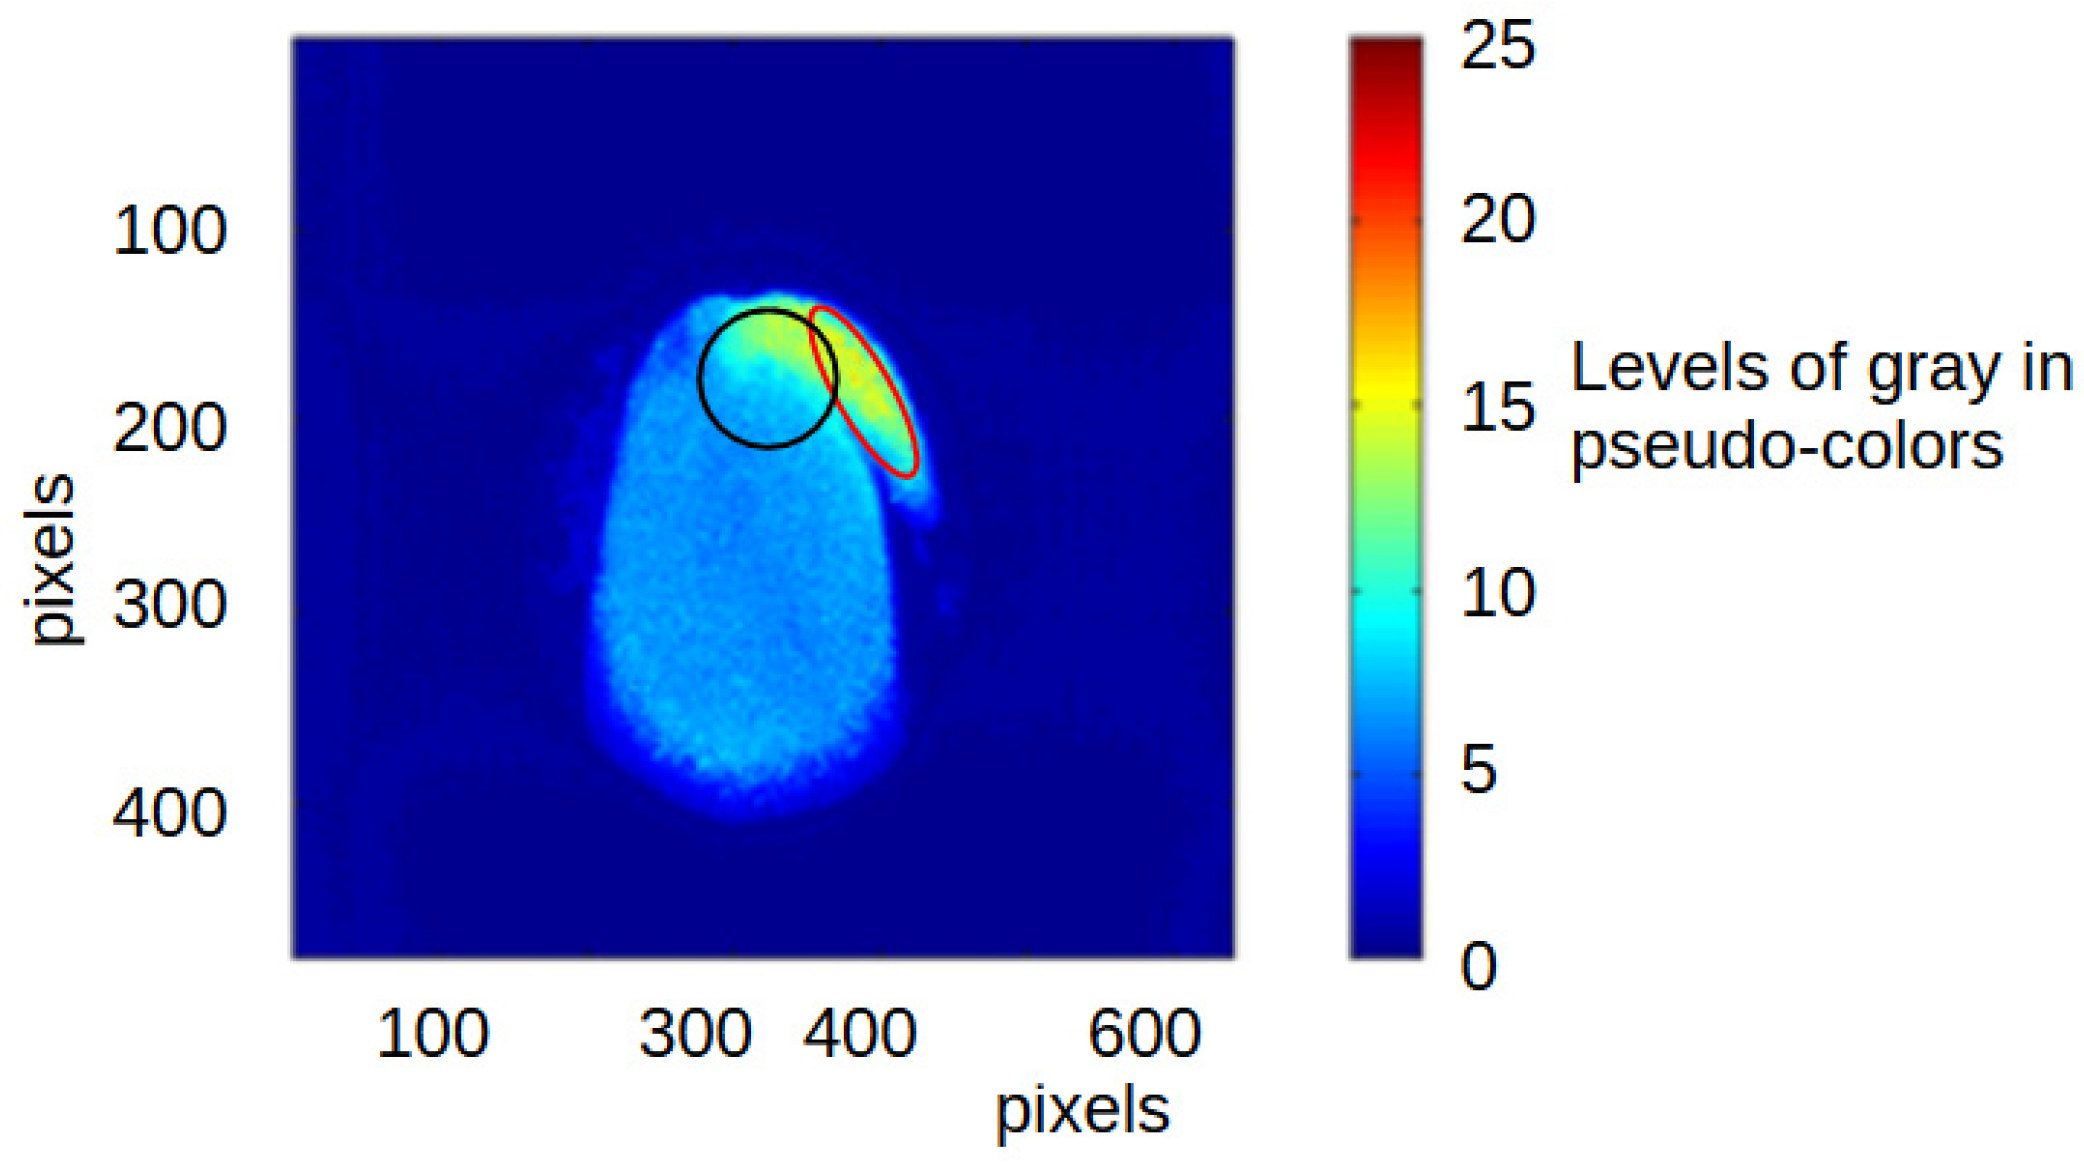
2.5.1. Local Regions of Interest and BSL Analysis

In the local approach for analyzing the BSL, the region of interest (ROI) is a delimited area of the seed where a physiologic response to germination is expected. The two local ROIs observed in this work were the vascular area and the embryonic axis. In Figure 2, the vascular and embryonic regions are delimited in the map of the activity of a seed. The vascular region is presented in Figure 2 by the area within the black circle, and the embryonic axis is delimited by a red ellipse. The map is expressed by the graphical outcome of the BSL index, which is known as the Absolute Value of the Differences (AVD) [23] and named GraphAVD. The pseudo-color from blue to red represents the level of activity from low to high, respectively. GraphAVD is presented by Equation (2):
G r a p h A V D = E I k I k + 1 = 1 N 1 k = 1 N 1 | I k I k + 1 |
where I is the speckle pattern image, and it is observed in time and represented by N, which is the number of frames, from k = 1 to N. And E[ . ] is the expectation operator.
The numerical analyses were computed using the Time History of the Speckle Pattern (THSP) [30,31,32]. The THSP was built using a collection of 100 random points obtained using a Gaussian distribution with a δ equal to 10, within the ROI [23]. Therefore, the first collection of points obtained from the first speckle pattern was fixed and monitored in time (in the sequence of speckle pattern images). The selection of the points in a Gaussian distribution that are responsible for building the THSP allows the observation of the sample in a limited spot area. The random choice of the points provides the ability to cover the ROI, and the definition of their number associated with the standard deviation of the Gaussian function is relevant to assure the homogeneous covering of the ROI, but with great weight in its center defined by the user. In addition, the replications are relevant to enhance the observation of the ROI.
The numerical values of biospeckle activity (BA) were obtained from the co-occurrence matrix (COM) derived from the TSHP [32]. The numerical values were the Absolute Values of the Differences (AVDs) and their variations [23]. In Equation (3), one can see AVD1 with the normalization of the COM, as represented by the whole summation of the occurrences in the COM.
A V D 1 = i j C O M   ( i , j ) l m C O M ( l , m )   i j
where the variables i, j, l, and m represent the coordinates of the COM.
In Equation (4), the normalization of the COM represents the whole summation of the occurrences in the COM, but with the absolute value changed by the square of the difference. Despite it is being called AVD2 [23], its original designation is inertia moment [32].
A V D 2 = i j C O M   ( i , j ) l m C O M ( l , m )   i j 2
where the variables i, j, l, and m represent the coordinates of the COM.
In Equation (5), one can observe the second central moment of AVD1 (its variance), named AVD3, with the normalization of the COM being the same as AVD1.
A V D 3 = E i j 2 E i j 2
where the variables i and j represent the coordinates of the COM.
Finally, one can see the Absolute Value of the Difference index, named AVD4, with the normalization proposed by Arizaga et al. (1999) [32] in Equation (6):
A V D 4 = i j C O M   ( i , j ) m C O M ( i , m )   i j
where the variables i and j represents the coordinates of the COM and m represents the number of columns.

2.5.2. Global Regions of Interest and BSL Analysis

In the global approach for analyzing the BSL, the ROI is defined as the whole image, i.e., the speckle pattern that includes the optic table and the whole seed.
The global analysis of the BSL implemented in this work was the Full Time History of the Speckle Pattern (FTHSP) presented by [19]. The collection of images of the speckle patterns in time was analyzed by creating five sections of the image sequence to build the THSP. In Figure 3, one can see the image sequence, as well as the illustration of the five sections that were used to build each THSP that was used to obtain the numerical index (AVD1), as presented in Equation (3). In Equation (7), one can observe how the global AVDG was obtained using the five AVD1 indices obtained in the sections:
A V D 1 G = 1 5 i = 1 5 A V D 1 i
where i represents the THSP matrices from 1 to 5.

2.6. Statistical Analysis of the BSL Test

The statistical design was conducted in randomized blocks, with the results of the numerical analyses subjected to descriptive analysis and normality testing (Shapiro–Wilk), as well as analysis of variance and Tukey’s test, with a significance level of 5%.

3. Results

The results are related to the emergency test to certify the two groups of seeds (high- and low-vigor seeds) for BSL analysis. The results of the BSL analysis, in turn, present the quality test of the speckle images, as well as the statistical analysis of the numerical outcomes of the illuminated seeds.

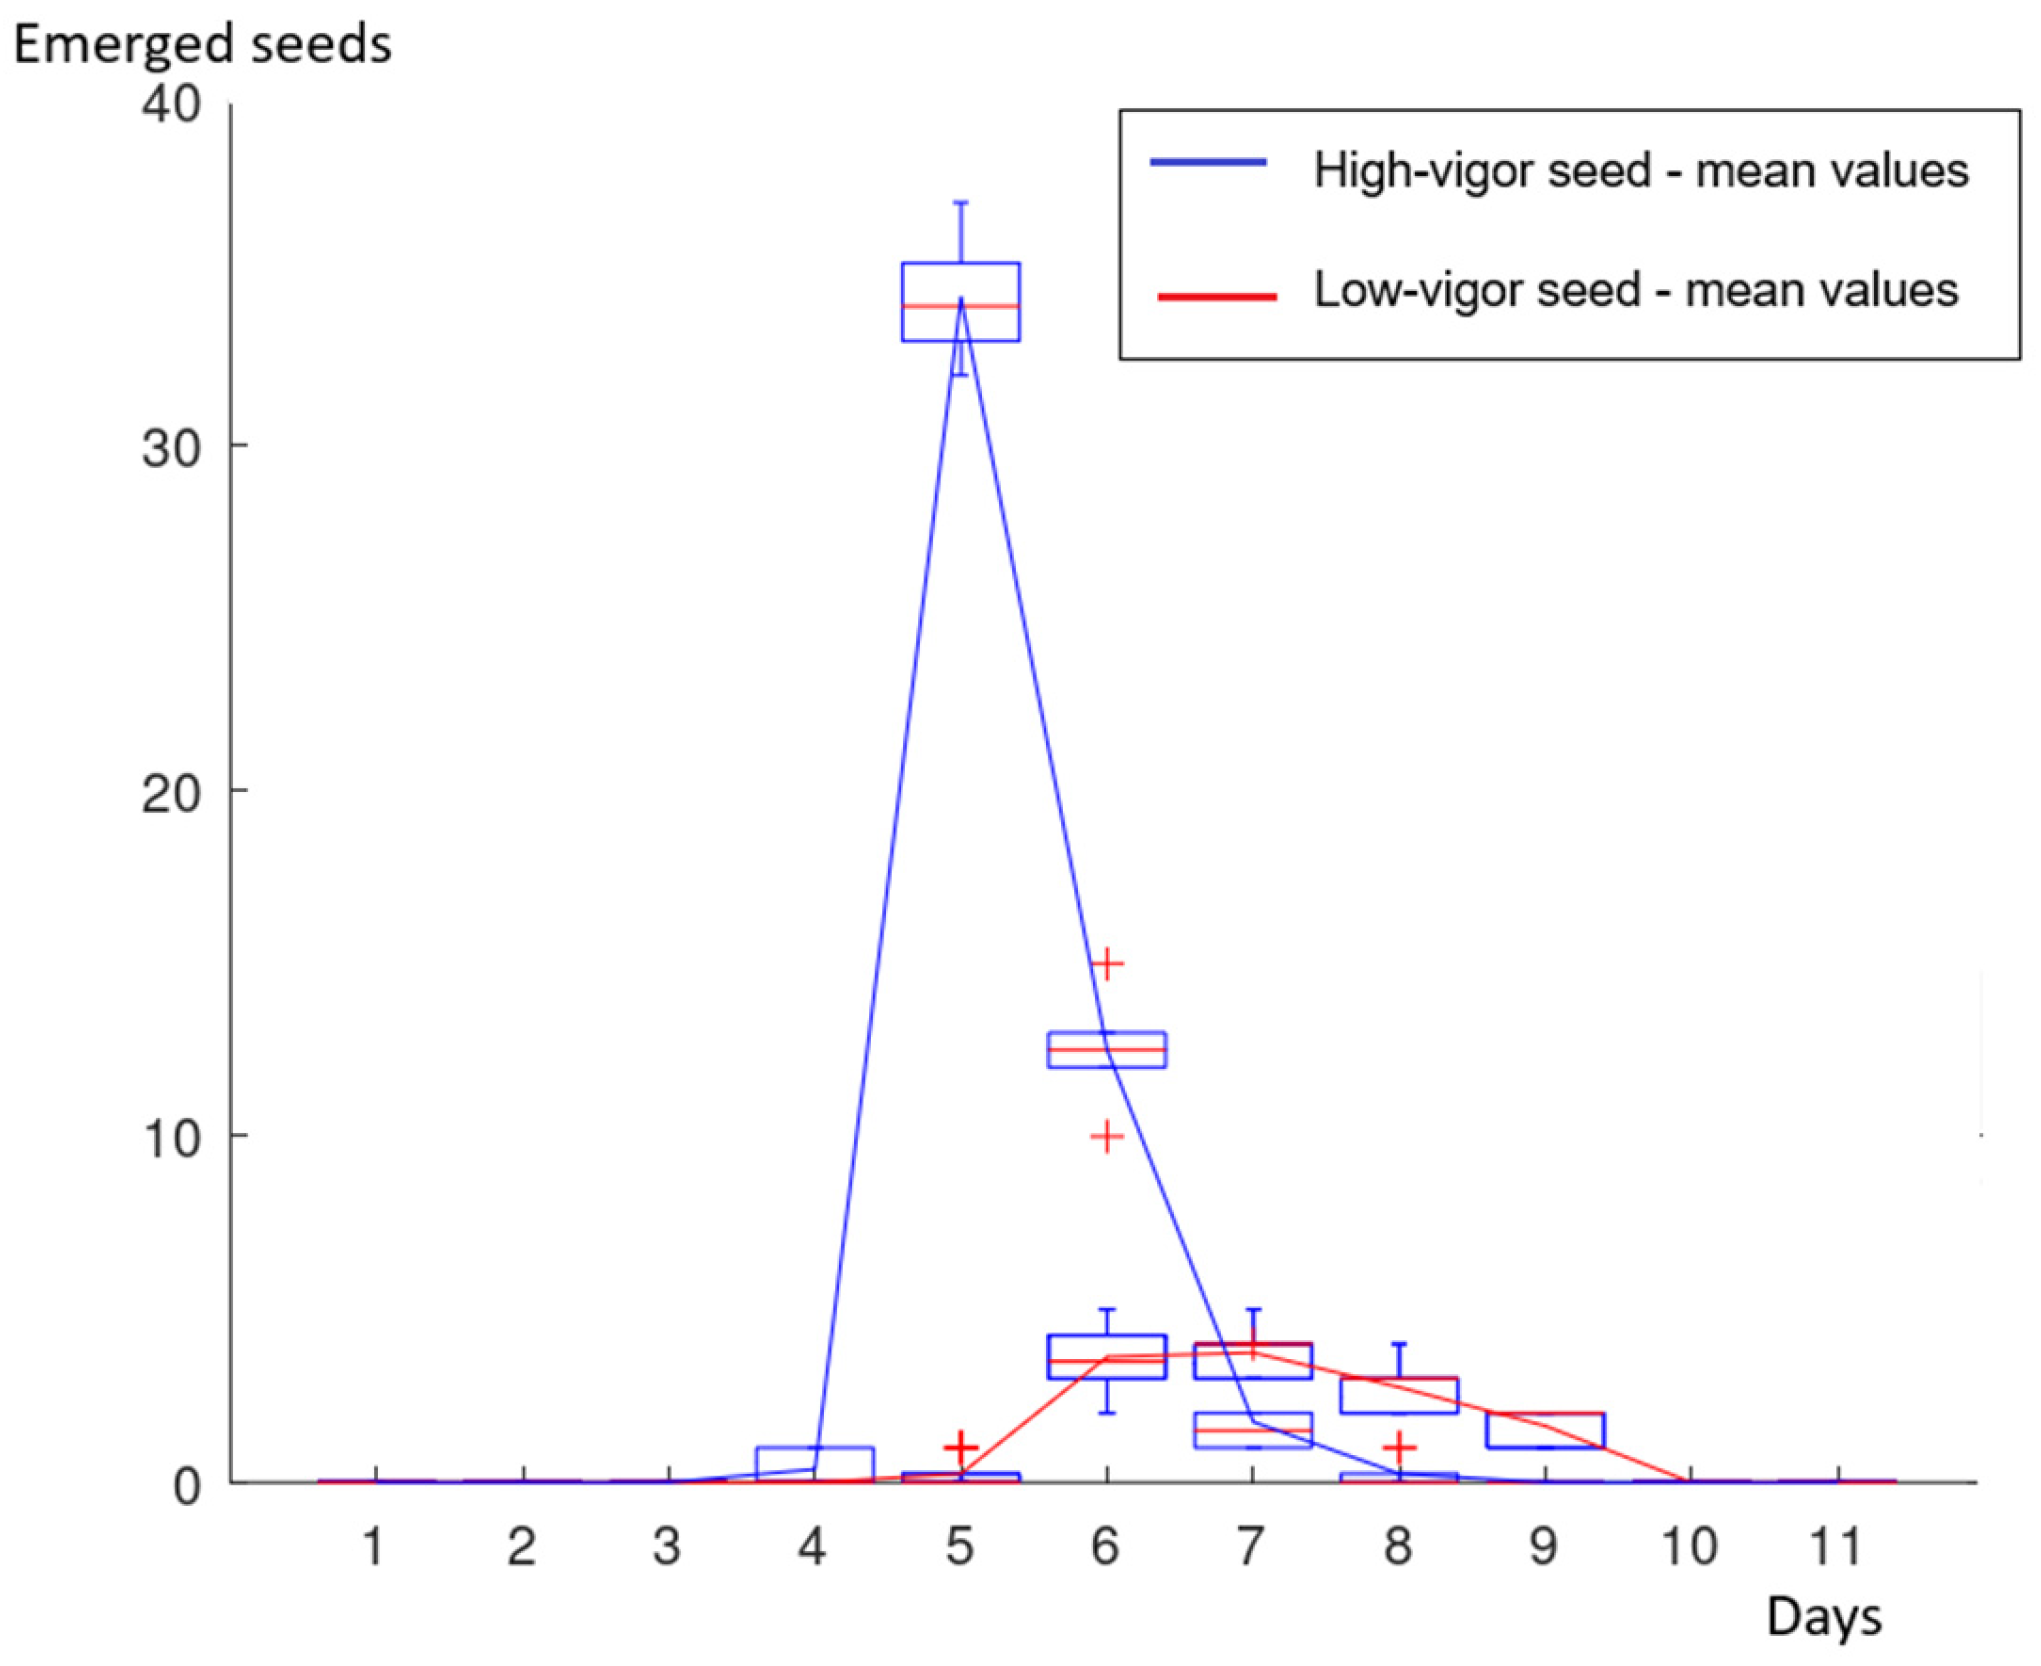
3.1. Emergency Test and Emergence Speed Index (ESI)

In Figure 4, one can observe the counting of the seeds’ emergence in accordance with the day of monitoring. Therefore, counting was expressed by the two boxplot graphs: one for the high-vigor group of seeds and the other for the low-vigor group.
The ESI test proved the difference between the two groups: the high-vigor group with an ESI of 9.31 and the low-vigor group with an ESI of 1.70.
One can observe the following in Figure 4: the level of the peak, representing the number of emerged seeds, and the momentum of emergence. And in both cases, the ESI presented significant differences between the groups, with the high values of emerging seeds related to the high-vigor group and the peak of emergence occurring at different times. The high-vigor group presented a peak on the 5th day with more than 30 seeds emerging, while the low-vigor group presented a peak between the 6th and 7th days with not more than 5 seeds emerging.

3.2. Biospeckle Laser Analysis

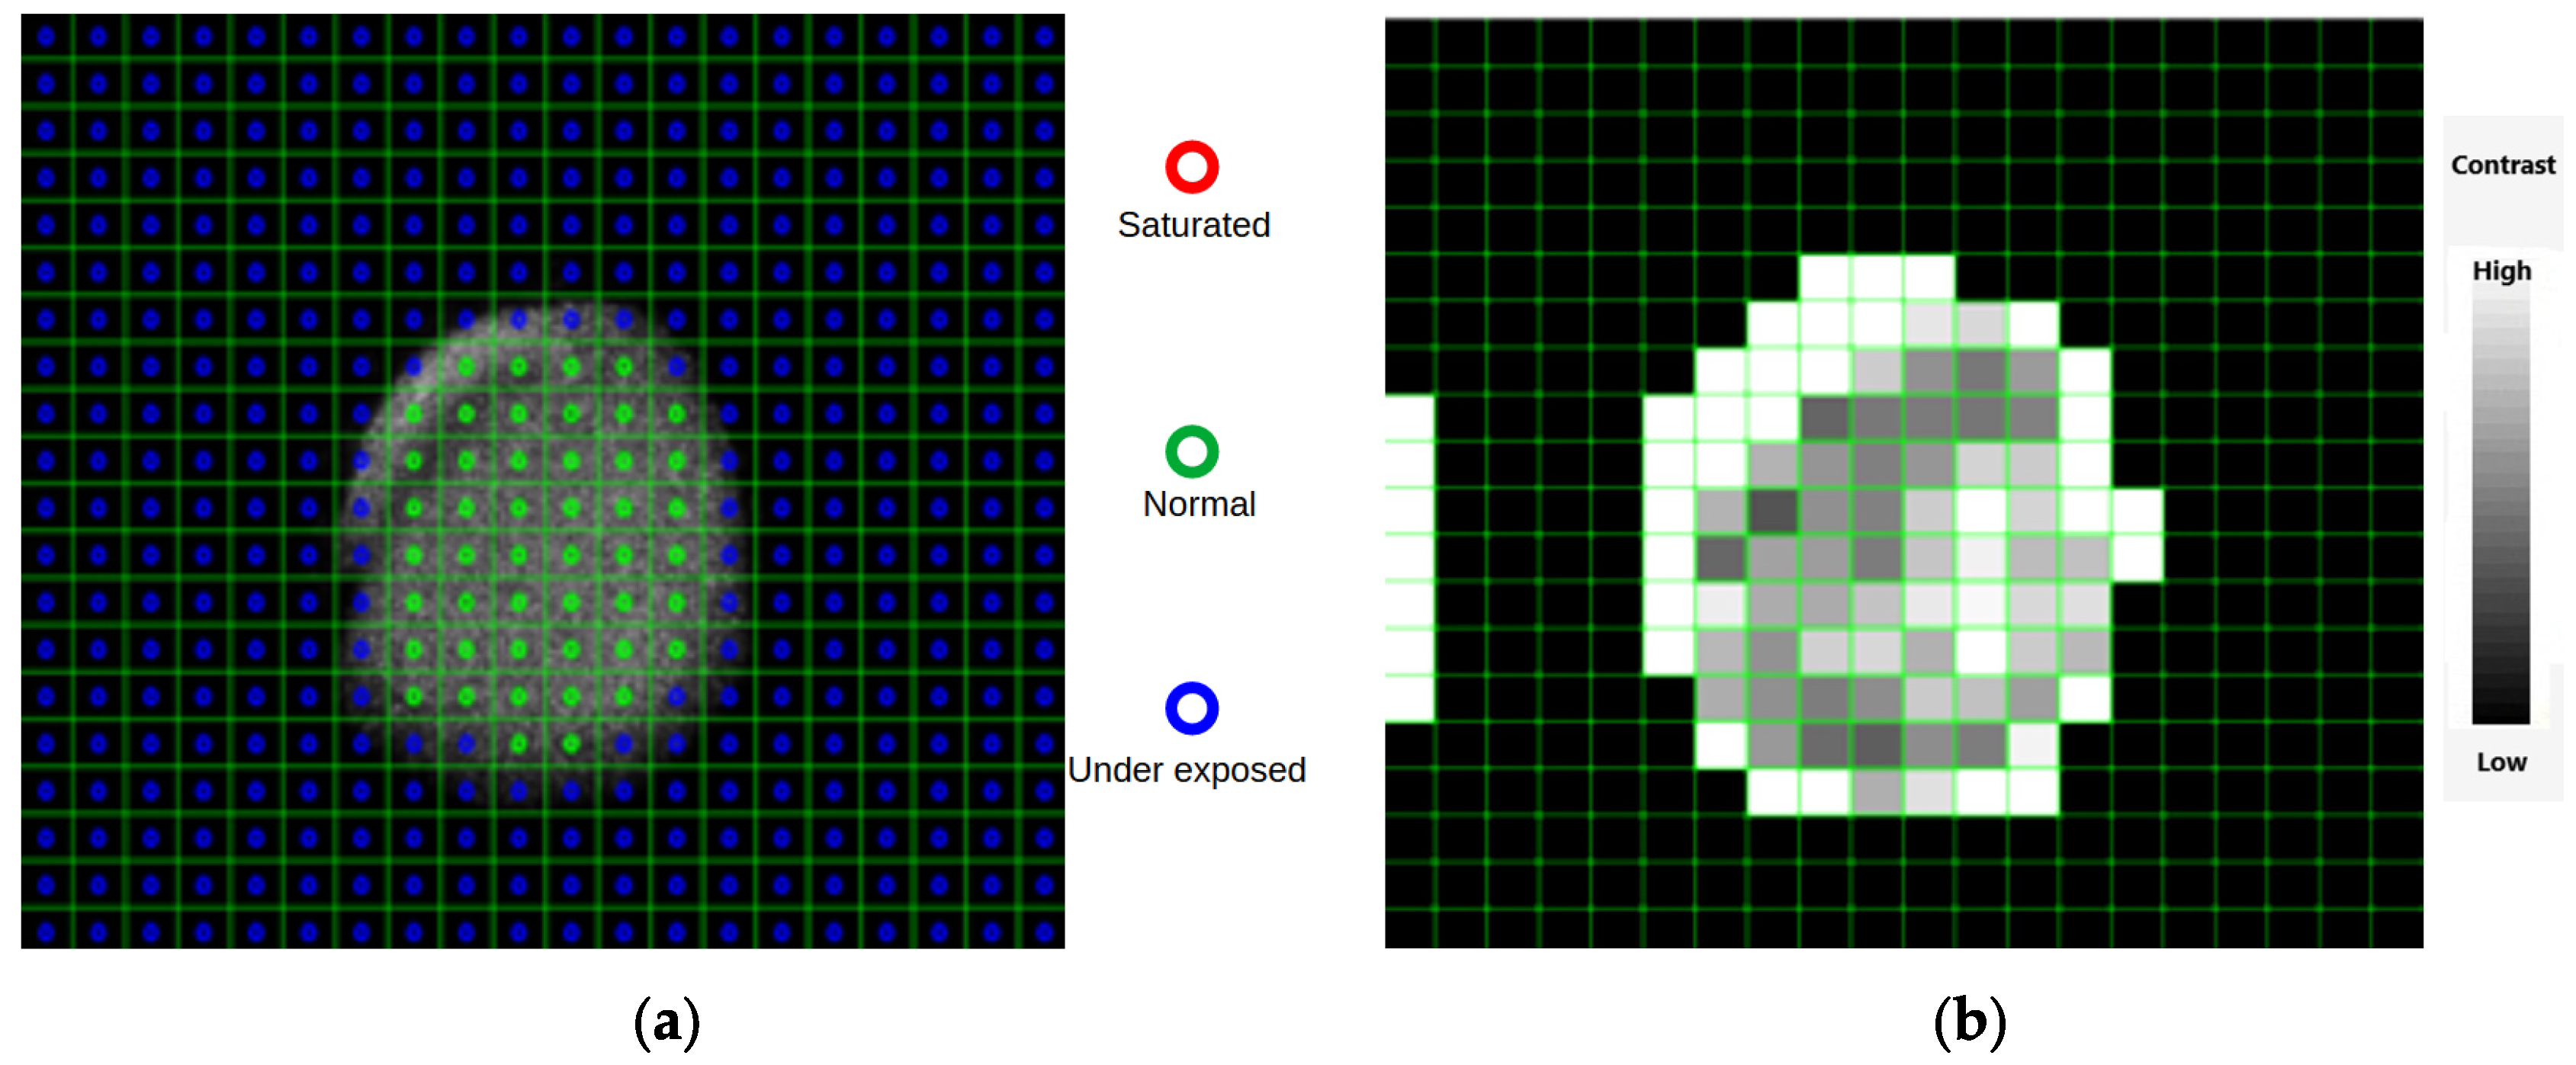
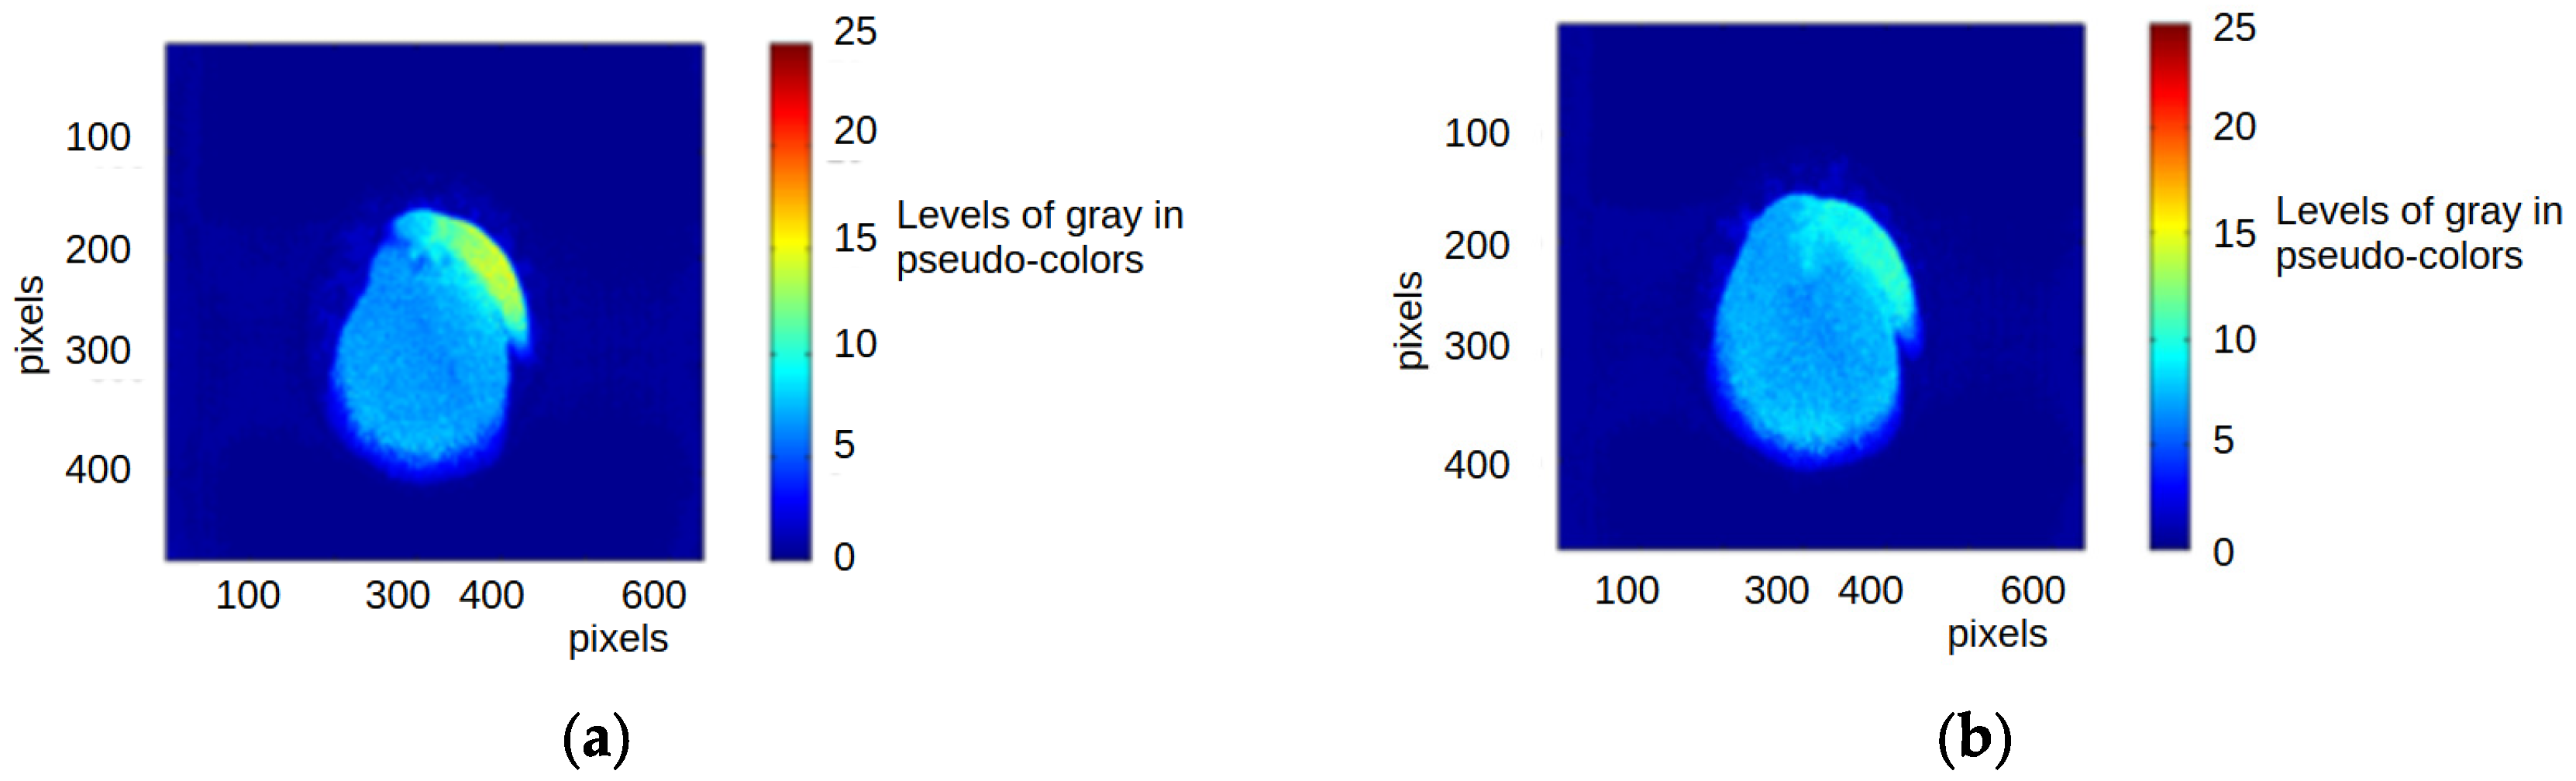
3.2.1. Quality Test Protocol

The quality test of the speckle patterns from the high- and low-vigor seeds presented that the speckle images in the seeds passed the light exposition and contrast tests. As an example, one can observe, in Figure 5, the result of the graphical outcomes of the quality test from one of the seeds tested.
The regions of interest in the seed, vascular area, and embryonic axis presented good standards for the two features: the level of illumination and contrast. The vascular area and the embryonic axis presented enough light, as expressed by the green circles, meaning that the ROI in the seed was not underexposed to light nor did they receive over-illumination that resulted in the saturation of the pixels. The adjusted thresholds for the under-exposition of light were set to 35 on a grayscale (0 to 255), and for the over-illumination scenario, they were set to 220 on a grayscale. Thus, the blue circles represent the level of light equal or under 35; the red circles represent the level of light over 220, and the green circles represent the level of illumination between 35 and 220. The absence of red circles in Figure 5a means the absence of saturation in the image. In the case of contrast, the ROI of the vascular area and the embryonic axis presented speckle grains with high contrast, as expressed by the light gray squares, which are expressed from 100 to 255 on grayscale values. Therefore, once the level of illumination and the contrast of the speckle grains were within the boundaries, we can guarantee that the BSL indices were not compromised.
In Figure 6, the map of the activity of one seed with high vigor and one seed with low vigor by means of GraphAVD is presented. The pseudo-color from blue to red represents the level of activity from low to high, respectively. It is possible to observe higher activity in the embryonic axis of the high-vigor seed.

3.2.2. Local Analysis with the BSL Results in the Vascular Region of the Seeds

The statistical analysis of the BSL results was conducted using the analysis of variance (ANOVA) for each one of the BSL indices, namely AVD1, AVD2, AVD3, and AVD4. In Table 1, it is possible to observe the ANOVA of the BSL index AVD1 in 36 seeds with high vigor and in 36 seeds with low vigor. The area observed was the vascular region.
The degrees of freedom (DFs) refer to the number of independent values that can vary in an analysis without violating constraints, and the sum of squares (SQ) quantifies variation in the data. The mean squares (MSs) are the averages of the sum of squares, adjusted by the degrees of freedom.
Therefore, there was no statistically significant difference between the high- and low-vigor seeds through the index AVD1, as presented in Table 1. The same result was observed using the following BSL indices: AVD2, AVD3, and AVD4. Since AVD1 presented the best results compared to AVD2, AVD3, and AVD4, we decided to avoid the presentation of all the ANOVAs. Therefore, the results for all indices, after their respective analyses of variance, are summarized by the Tukey test (t-test) presented in Table 2. The same letter aside from the mean values means that there is no statistically significant difference between high- and low-vigor seeds.

3.2.3. Local Analysis with the BSL Results in the Embryonic Axis of the Seeds

Regarding the embryonic axis, the ANOVA for the AVD1 is presented in Table 3, where it is possible to observe the statistically significant difference between the high- and low-vigor seeds through the BSL analysis. The same occurred in the other indices, as shown in Table 4 by the t-test.
The statistically significant difference between the high- and low-vigor seeds was observed by all indices (different letters) in the t-test presented in Table 4.
Therefore, after the imbibition time of 24 h, the region that presented higher separation between the groups (high- and low-vigor) was the embryonic axis.

3.2.4. Global Analysis with the Full THSP

The result of the FTHSP, which represents in this work the global approach, is presented in the ANOVA in Table 5. The values of AVD1 were obtained from the whole image of the seed.
The t-test (p< 0.05) is presented in Table 6, where the statistically significance difference is presented by different letters beside the mean values.

4. Discussions

The vigor testing of bean seeds (Phaseolus vulgaris L.) by the BSL technique presented reliable results using the global and local analyses, with both being able to classify high- and low-vigor seeds. The BSL numerical outcomes obtained from the embryonic axis and from the whole image of the seed presented higher biospeckle activity (BA) for high-vigor seeds than in the case of low-vigor seeds.
The local analysis driven by the random Gaussian distribution [23] within the embryonic axis presented better performance than the global analysis conducted by the Full Time History of the Speckle Pattern (FTHSP) methodology [19].
The BSL outcomes from the embryonic axis presented a statistically significant difference (p < 0.05) between high- and low-vigor seeds with an F-value of 44.252, while the analysis of the whole image (global analysis) presented statistically significant differences with an F-value of 19.484.
The better performance of the local analysis was strengthened by the higher difference in the BA mean values related to high- and low-vigor seeds: 11.286497 and 7.770878, respectively. The ratio between them was 1.45, while in the case of the global analysis, the ratio was 1.15.
The flexibility presented by the local analysis can, therefore, address the BA of heterogeneous elements such as seeds. The FTHSP [19] and autocorrelation [22] are relevant methodologies for the global analysis, but only when there is a homogeneous sample under analysis.
The application of BSL to entire speckle images—including areas less involved in germination, such as regions within the seed but distant from the embryonic axis, or even areas outside the seed boundaries—likely explains the lower significance of the global analysis results compared to those of the local analysis alone, like the embryonic axis. This suggests that the key issue is the reduced sensitivity of the global analysis, which is caused by the influence of irrelevant regions that do not contribute meaningfully to vigor assessments.
A challenge presented by the local analysis could be addressed by the failure of the BA monitoring of the vascular area in the seed. It means that the wrong selection of the area or the wrong moment of illumination after imbibition can compromise the test.
The vascular area and the embryonic axis are regions of relevance in the germination process, and that was the reason for choosing them during the BSL analysis. However, the two regions have distinct roles during germination, and their different responses after 24 h of imbibition can be explained by the distinct activity of them in time.
In seeds, the vascular area is responsible for transporting nutrients to the embryonic axis, which in turn drives the structural development of the seedling. Consequently, the radicle is the first structure to emerge from the embryonic axis and is responsible for forming the primary root [33]. Therefore, despite the relevance of the vascular area in the seed’s germination, the biospeckle activity after 24 h of imbibition did not address relevant information to separate high-vigor bean seeds from low-vigor bean seeds.
The observation of the embryonic axis, or radicle [10], is key for forecasting vigor [16,17] using the BSL technique, that is, when its great activity during the first stages of the germination process [33] is easily observed. However, the time of imbibition, which is necessary for BSL adoption, must be considered for each type of seed, since the best moment for observing the embryonic axis will certainly vary. We observed that 24 h of imbibition was reliable for the seeds of the beans (Phaseolus vulgaris L.); however, it can be different in other seeds.
Germination begins with imbibition—the absorption of water by the seed—and ends with the elongation of the embryonic axis [34], passing through a series of ordered physiological and morphogenetic processes [35].
Finally, in this work we could show the other advantages of the BSL test with respect to traditional tests, including the emergence test; the number of seeds and the time required are used for vigor analysis [8]. In the emergence test, we used 800 seeds for 11 days. The BSL analyzed 72 seeds after 24 h for seed imbibition and took 1 day for vigor analysis.
This work represents an effort toward the standardization of the seed vigor test using the BSL analysis, but in this case it is limited to the common bean seed (Phaseolus vulgaris L.). The protocol presented a clear design of the setup; the preparation of the seeds, according to the international rules [3]; and the analysis of the seed quality test in a laboratory without the influence of external environmental factors (e.g., sun light, wind, dust, and mechanical vibration). Future research work should address protocol adjustments or validation to different species and varieties. The time of imbibition and its relation to different regions within the seed must be considered in the standards for each species and variety.
The analysis of vigor using the BSL must consider that the seeds of different species and varieties can vary the optimum point of observation regarding the germination process. Thus, further research should consider the establishment of adjustments in the proposed standard for each case.
In addition, the proposed BSL analysis of seeds’ vigor must always calibrate the system using low- and high-vigor seeds in a preliminary step before the main analysis. And the calibration must always be repeated when a seed of a different species or variety is prepared for testing.
After presenting a direction for carrying out the BSL in seeds, one can think about the natural evolution and application of the technique in an automated way, where classification models of the high- and low-vigor seeds can be addressed.

5. Conclusions

The evaluation of the global and local BSL (biospeckle laser) analyses for assessing seed vigor in the common bean (Phaseolus vulgaris L.) presented their reliability in distinguishing between high- and low-vigor seeds. The local analysis demonstrated superior performance compared to the global approach. Among the two seed regions analyzed—the vascular area and the embryonic axis—only the embryonic axis was able to significantly differentiate high- from low-vigor seeds using the BSL technique.
The BSL technique required the analysis of 72 seeds over a period of two days, whereas the standard emergence test required 800 seeds and 11 days to complete the classification.
Future work should enlarge the number of species and varieties tested using the proposed protocol to create a solid standard for the seed vigor test. It must be considered that each species and varieties can demand different times of imbibition to deliver the local analysis.

Author Contributions

Conceptualization, B.V. and R.A.B.; methodology, B.V., R.A.B. and J.L.C.; software, B.V., J.E.d.S.G. and R.d.J.G.-P.; formal analysis, B.V., R.A.B., J.L.C., J.E.d.S.G. and R.d.J.G.-P.; investigation, B.V., J.E.d.S.G. and R.d.J.G.-P.; resources, R.A.B. and R.d.J.G.-P.; data curation, B.V. and R.A.B.; writing—original draft preparation, B.V. and R.A.B.; writing—review and editing, B.V., R.A.B., J.L.C., J.E.d.S.G. and R.d.J.G.-P.; supervision, R.A.B.; project administration, R.A.B.; funding acquisition, R.A.B. All authors have read and agreed to the published version of the manuscript.

Funding

This research was partially funded by CNPq, grant number 316938/2021-1, and FAPEMIG, grant number PPM 163-17.

Institutional Review Board Statement

Not applicable.

Data Availability Statement

Data supporting the reported results can be found in ZENODO (EU Open Research Repository) at https://doi.org/10.5281/zenodo.14833719.

Acknowledgments

This work was partially supported by the Federal University of Lavras, CNPq 316938/2021-1, FAPEMIG 163-17, the Federal Centre for Technological Education of Minas Gerais, the and University of Valencia.

Conflicts of Interest

The authors declare no conflicts of interest. The authors declare that there is no personal circumstances or interest that may be perceived as inappropriately influencing the representation or interpretation of the reported research results. The funders had no role in the design of the study; in the collection, analyses, or interpretation of data; in the writing of the manuscript; or in the decision to publish the results.

References

  1. Rajjou, L.; Duval, M.; Gallardo, K.; Catusse, J.; Bally, J.; Job, C.; Job, D. Seed germination and vigor. Annu. Rev. Plant Biol. 2012, 63, 507–533. [Google Scholar] [CrossRef] [PubMed]
  2. Finch-Savage, W.E.; Bassel, G.W. Seed vigour and crop establishment: Extending performance beyond adaptation. J. Exp. Bot. 2016, 67, 567–591. [Google Scholar] [CrossRef] [PubMed]
  3. ISTA. Seed Vigour Testing. In International Rules for Seed Testing; ISTA: Bassersdorf, Switzerland, 2021; Volume 20, pp. 15–20. [Google Scholar]
  4. Machado, C.G.; Silva, G.Z.; Cruz, S.C.S.; Anjos, R.C.L.; Silva, C.L.; Matos, L.F.L.; Smaniotto, A.O. Germination and Vigor of Soybean and Corn Seeds Treated with Mixed Mineral Fertilizers. Plants 2023, 12, 338. [Google Scholar] [CrossRef] [PubMed]
  5. Frota, L.M.; de Oliveira, G.M.; de Oliveira, M.T.R. Seed size improves vigor and emergence of Cenostigma tocantinum seedlings. Aust. J. Crop Sci. 2024, 18, 460–465. [Google Scholar] [CrossRef]
  6. Singh, P.; Tiwari, B.; Kumar, A.; Gedam, B.; Bhatia, V.; Krejcar, O.; Dobrovolny, M.; Nebhen, J.; Prakash, S. Deep transfer learning based photonics sensor for assessment of seed-quality. Comput. Electron. Agric. 2022, 196, 106891. [Google Scholar] [CrossRef]
  7. Xia, Y.; Xu, Y.; Li, J.; Zhang, C.; Fan, S. Recent advances in emerging techniques for non-destructive detection of seed viability: A review. Artif. Intell. Agric. 2019, 1, 35–47. [Google Scholar] [CrossRef]
  8. Xing, M.; Long, Y.; Wang, Q.; Tian, X.; Fan, S.; Zhang, C.; Huang, W. Physiological Alterations and Nondestructive Test Methods of Crop Seed Vigor: A Comprehensive Review. Agriculture 2023, 13, 527. [Google Scholar] [CrossRef]
  9. Rahman, A.; Cho, B. Assessment of seed quality using non-destructive measurement techniques: A review. Seed Sci. Res. 2016, 26, 285–305. [Google Scholar] [CrossRef]
  10. Braga, R.A., Jr.; Contado, J.L.; Ducatti, K.R.; da Silva, E.A. Analysis of Seed Vigor Using the Biospeckle Laser Technique. AgriEngineering 2025, 7, 3. [Google Scholar] [CrossRef]
  11. Singh, P.; Chatterjee, A.; Rajput, L.S.; Rana, S.; Kumar, S.; Nataraj, V.; Bhatia, V.; Prakash, S. Development of an intelligent laser biospeckle system for early detection and classification of soybean seeds infected with seed-borne fungal pathogen (Colletotrichum truncatum). Biosyst. Eng. 2021, 212, 442–457. [Google Scholar] [CrossRef]
  12. Zdunek, A.; Adamiak, A.; Pieczywek, P.M.; Kurenda, A. The biospeckle method for the investigation of agricultural crops: A review. Opt. Lasers Eng. 2014, 4, 20–290. [Google Scholar] [CrossRef]
  13. Silva, G.M.; Peixoto, L.S.; Fujii, A.K.; Parisi, J.J.D.; Aguiar, R.H.; Fracarolli, J.A. Evaluation of Maize Seeds Treated with Trichodermil® through Biospeckle. J. Agric. Sci. Technol. B 2018, 8, 175–187. [Google Scholar] [CrossRef]
  14. Braga, R.A.; Dal Fabbro, I.M.; Borem, F.M.; Rabelo, G.F.; Arizaga, R.; Rabal, H.; Trivi, M. Assessment of Seed Viability by Laser Speckle Techniques. Biosyst. Eng. 2003, 86, 287–294. [Google Scholar] [CrossRef]
  15. Men, S.; Yan, L.; Qian, H. Application of Bio-speckle Activity to Assess Seed Viability. Adv. J. Food Sci. Technol. 2015, 3, 214–218. [Google Scholar] [CrossRef]
  16. Vivas, P.G.; Resende, L.S.; Braga, R.A., Jr.; Guimarães, R.M.; Azevedo, R.; da Silva, E.A.; Toorop, P.E. Biospeckle activity in coffee seeds is associated non-destructively with seedling quality. Ann. Appl. Biol. 2016, 170, 141–149. [Google Scholar] [CrossRef]
  17. Braga, R.A.; Azevedo, R.L.; Guimarães, R.M.; Reis, L.V. Magnetic field in coffee seed germination. Sci. Agrotecnol. 2020, 44, e0039020. [Google Scholar] [CrossRef]
  18. Singh, P.; Chatterjee, A.; Bhatia, V.; Prakash, S. Application of laser biospeckle analysis for assessment of seed priming treatments. Comput. Electron. Agric. 2020, 169, 105212. [Google Scholar] [CrossRef]
  19. Singh, P.; Chatterjee, A.; Rajput, L.S.; Rana, S.; Bhatia, V.; Prakash, S. Laser biospeckle technique for characterizing the impact of temperature and initial moisture content on seed germination. Opt. Lasers Eng. 2022, 153, 106999. [Google Scholar] [CrossRef]
  20. Sutton, D.B.; Punja, Z.K. Investigating biospeckle laser analysis as a diagnostic method to assess sprouting damage in wheat seeds. Comput. Electron. Agric. 2017, 141, 238–247. [Google Scholar] [CrossRef]
  21. Chatterjee, A.; Bhatia, V.; Prakash, S. Anti-spoof touchless 3D fingerprint recognition system using single shot fringe projection and biospeckle analysis. Opt. Lasers Eng. 2017, 95, 1–7. [Google Scholar] [CrossRef]
  22. Kurenda, A.; Adamiak, A.; Zdunek, A. Temperature effect on apple bio-speckle activity evaluation with different indices. Postharvest Biol. Technol. 2012, 67, 118–123. [Google Scholar] [CrossRef]
  23. Braga, R.A.; Rivera, F.P.; Moreira, J. A Practical Guide, 1st ed.; Editora UFLA: Lavras, Brazil, 2016; 162p. [Google Scholar]
  24. Ortiz, T.A.; Gomes, G.R.; Takahashi, L.S.A. Standardization of the accelerated aging test methodology for snap bean seed to differentiate batches by physiological quality. Int. J. Veg. Sci. 2024, 30, 131–137. [Google Scholar] [CrossRef]
  25. Nakagawa, J. Testes de vigor baseados no desempenho das plântulas. In Vigor de Sementes: Conceitos E Testes, 1st ed.; Krzyzanowski, F.C., Vieira, R.D., França Neto, J.B., Eds.; ABRATES: Londrina, Brazil, 1999; pp. 2.1–2.24. [Google Scholar]
  26. Pereira, M.D.; Reis, J.A.; Ferrari, C.S.; Florestal, A.M.G.V.-C.; Brasil, S.L. Processamento digital de imagens de plântulas na avaliação do vigor de sementes de Moringa oleifera Lam. Ciênc. Florest. 2020, 30, 291–306. [Google Scholar] [CrossRef]
  27. Maguire, J.D. Speed of germination-aid selection and evaluation for seedling emergence and vigor. Crop Sci. 1962, 2, 176–177. [Google Scholar] [CrossRef]
  28. Moreira, R.R.J.; Cardoso, R.A.; Braga, R.A. Quality test protocol to dynamic laser speckle analysis. Opt. Lasers Eng. 2014, 61, 8–13. [Google Scholar] [CrossRef]
  29. Kaler, N.; Bhatia, V.; Mishra, A.K. Deep Learning-Based Robust Analysis of Laser Bio-Speckle Data for Detection of Fungal-Infected Soybean Seeds. IEEE Access 2023, 11, 89331–89348. [Google Scholar] [CrossRef]
  30. Oulamara, A.; Tribillon, G.; Duvernoy, J. Biological Activity Measurement on Botanical Specimen Surfaces Using a Temporal Decorrelation Effect of Laser Speckle. J. Mod. Opt. 1989, 36, 165–179. [Google Scholar] [CrossRef]
  31. Xu, Z.; Joenathan, C.; Khorana, B.M. Temporal and spatial properties of the time-varying speckles of botanical specimens. Opt. Eng. 1995, 34, 1487–1502. [Google Scholar] [CrossRef]
  32. Arizaga, R.; Trivi, M.; Rabal, H. Speckle time evolution characterization by the co-occurrence matrix analysis. Opt. Laser Technol. 1999, 31, 163–169. [Google Scholar] [CrossRef]
  33. Carvalho, N.M.; Nakagawa, J. (Eds.) Sementes: Ciência, Tecnologia e Produção, 5th ed.; Funep: Jaboticabal, Brazil, 2012; 590p. [Google Scholar]
  34. Bewley, J.D. Seed Germination and Dormancy. Plant Cell 1997, 9, 1055–1066. [Google Scholar] [CrossRef] [PubMed]
  35. Zhang, W.; Hao, Y.; Teng, C.; Fan, X.; Yang, X.; Liu, M.; Ren, G.; Tan, C. Effects of Salt Stimulation on Lunasin Accumulation and Activity during Soybean Germination. Foods 2020, 9, 118. [Google Scholar] [CrossRef] [PubMed]
Figure 1. BSL setup with the optical table, the laser illumination system, and the USB CMOS camera.
Agriculture 15 01553 g001
Figure 2. The map of activity of a bean seed with the representation of the vascular region (black circle) and of the embryonic axis (red ellipse). The pseudo-colored image represents low activity (in blue) to high activity (in red).
Agriculture 15 01553 g002
Figure 3. Illustration of the Full THSP from the sequence of images.
Agriculture 15 01553 g003
Figure 4. Emergence test of the seeds, with the box plot presenting the variation in emergence. The blue line indicates the mean values of emergence in high-vigor seeds, and the red line indicates the mean values of emergence in low-vigor seeds. The boxes represent the interquartile range from 25% to 75%; the whiskers are the minimum and maximum values of the dataset, and the ‘+’ symbol represents the outliers.
Agriculture 15 01553 g004
Figure 5. Quality test protocol in a seed of a bean with the (a) light exposition test and the (b) contrast test.
Agriculture 15 01553 g005
Figure 6. Graphical outcome using the index GraphAVD in (a) a high-vigor seed and in (b) a low-vigor seed, where the blue color represents low activity and the red color represents high activity in the map of activity.
Agriculture 15 01553 g006
Table 1. Analysis of variance of AVD1 at a level of 5% for high- and low-vigor seeds in the vascular region.
SVDFSQMSF Valuep
Seed13.5789273.5789272.6710.1067
Error7093.8022681.340032
Corrected Total7197.381195
CV (%) =17.24
Overall Mean: 6.7135208Number of observations: 72
SV: Source of Variation; DF: Degree of Freedom; SQ: Sum of Squares; MS: Mean Square.
Table 2. Mean values of the numerical BSL indices in the vascular area of the bean seed and the results of the Tukey test (p < 0.05). letter beside the mean values representing the statistically significant difference.
Seed A V D 1 A V D 2 A V D 3 A V D 4
High Vigor6.936472 a80.211417 a30.855500 a1013.004444 a
Low vigor6.490569 a70.684417 a27.191083 a932.284722 a
CV (%)17.2433.7532.4024.38
Table 3. Analysis of variance of AVD1 at a significance level of 5% for high- and low-vigor seeds in the embryonic axis.
SVDFSQMSF Statisticp-Value
Seed1222.472441222.47244144.2520.0000
Error70351.9202125.027432
Corrected Total71574.392653
CV (%) =23.53
Overall Mean: 9.5286875Number of observations: 72
SV: Source of Variation; DF: Degree of Freedom; SQ: Sum of Squares; MS: Mean Square.
Table 4. Mean values of the numerical BSL indices in the embryonic axis of the bean seed and the results of the Tukey test (p < 0.05), with different letters beside the mean values representing the statistically significant difference.
Seed A V D 1 A V D 2 A V D 3 A V D 4
High Vigor11.286497 a219.023028 a84.338694 a1884.731389 a
Low vigor7.770878 b101.746917 b38.956444 b1152.799167 b
CV (%)23.5344.1542.6529.02
Table 5. Analysis of variance of the FTHSP (global analysis) at a significance level of 5% for high- and low-vigor seeds.
SVDFSQMSF Statisticp-Value
Seed11.1904251.19042519.4840.0000
Error704.2767940.061097
Corrected Total715.467219
CV (%) =13.20
Overall Mean: 1.8728917Number of observations: 72
SV: Source of Variation; DF: Degree of Freedom; SQ: Sum of Squares; MS: Mean Square.
Table 6. Mean values of the numerical BSL using the FTHSP and the AVD1 index of the high- and low-vigor bean seeds and the results of the Tukey test (p < 0.05). Different letters beside the mean values representing the statistically significant difference.
Seed FTHSP - A V D 1
High Vigor2.001475 a
Low vigor1.744308 b
CV (%)13.20
Disclaimer/Publisher’s Note: The statements, opinions and data contained in all publications are solely those of the individual author(s) and contributor(s) and not of MDPI and/or the editor(s). MDPI and/or the editor(s) disclaim responsibility for any injury to people or property resulting from any ideas, methods, instructions or products referred to in the content.

