Article

On-Demand Design of Terahertz Metasurface Sensors for Detecting Plant Endogenous and Exogenous Molecules

1
School of Agricultural Engineering, Jiangsu University, Zhenjiang 212013, China
2
Key Laboratory of Agriculture Equipment and Intelligence of Jiangsu Province, Zhenjiang 212013, China
*
Author to whom correspondence should be addressed.
Agriculture 2025, 15(14), 1481; https://doi.org/10.3390/agriculture15141481
Submission received: 3 June 2025 / Revised: 2 July 2025 / Accepted: 4 July 2025 / Published: 10 July 2025
(This article belongs to the Section Digital Agriculture)

Abstract

This study presents a neural-network-based method for on-demand design of terahertz metasurface sensors, aimed at detecting plant endogenous and exogenous molecules. The approach uses target performance indicators (constructed via fingerprint peaks) as inputs and structural parameters as outputs, employing a neural network to map the complex relationship between them. Two single-resonant-peak metasurface sensors were developed to detect abscisic acid and gibberellic acid. The abscisic acid metasurface sensor achieved an average MSE of 5.66 × 10⁻⁶ and RER of 0.167%, while the gibberellic acid metasurface sensor had an average MSE of 8 × 10⁻⁷ and RER of 0.086%. Their resonant peaks highly matched the substance fingerprint peaks, enabling specific detection. Metasurface sensors’ sensitivities were effectively controlled using correlation analysis and neural networks, achieving remarkable levels of 156.7 and 150.1 GHz/RIU, allowing trace detection. Three dual-resonant-peak metasurface sensors were designed to improve the detection specificity for chlorophyll and folpet and to detect chlorophyll and folpet simultaneously. These metasurface sensors exhibited average MSEs of 1.4 × 10⁻⁵, 1.6 × 10⁻⁶, 1.35 × 10⁻⁵ and RERs of 0.27%, 0.088%, 0.20%. The model also worked for four other plant-related molecules, proving its strong generalization ability. Overall, for different application scenarios of exogenous and endogenous molecules in plants, the on-demand design methodology offers a whole new set of ideas for quickly designing and widely applying metasurface sensors with suitable performance indicators.

Graphical Abstract

1. Introduction

Plant endogenous and exogenous molecules are of great significance for regulating plant stress resistance, growth development, and physiological processes [1,2]. Abscisic acid, an endogenous metabolite, accumulates rapidly under abiotic stresses like low temperatures and drought, thereby enhancing plant stress resistance [3]. Gibberellic acid, as an exogenous growth regulator, can promote seed germination, seedling growth, dry weight, and protein accumulation [4]. Chlorophyll, a key pigment in photosynthesis, drives plant growth and development, and reflects the plant’s photosynthetic capacity, growth stage, and nitrogen status [5]. Folpet is an efficient fungicide, widely used for controlling fungal diseases in fruits, vegetables, and other crops [6]. Detecting these plant endogenous and exogenous molecules helps us to gain deeper insights into plant physiological mechanisms, clarifies the plant’s role in coping with environmental changes, offers theoretical support for boosting agricultural production, and facilitates the cultivation of superior varieties to enhance crop quality and yield. This is of great importance for advancing plant science and agricultural practices.
Currently, major plant molecular detection methods, including mass spectrometry, chromatographic analysis, and hyphenated techniques, are highly sensitive, yet complex, time-consuming, and unsuitable for high-throughput large-sample detection [7,8,9]. Spectroscopy-based methods like visible–near-infrared, mid-infrared, Raman, and fluorescence spectroscopy [10,11,12,13,14,15] provide molecular-level insights into sample chemical composition and molecular structure, enabling fingerprinting of chemical bonds and functional groups in molecules. Mid-infrared and Raman spectroscopic techniques detect better than visible–near-infrared techniques, and fluorescence penetration of older leaves is weaker. When slight changes are detected in the components of the test sample, the visible light-near infrared spectrum signal is weak. In addition, mid-infrared and Raman spectroscopy merely have specific detection ranges [16].
Terahertz waves are located between infrared and microwave [17]. Due to the weak interaction between molecules in this band, it has obvious characteristic absorption peaks, so that each biological molecule has “fingerprint” sign characteristics, that is, the terahertz wave has fingerprint spectroscopic properties. At the same time, the terahertz wave also has transient, high permeability, and other characteristics, so the terahertz spectroscopy is a kind of rapid, non-destructive detection technology [18,19,20,21]. However, due to the longer wavelength of terahertz compared to visible and near-infrared light, it makes the interaction between the THz wave and the sample weaker, resulting in weak signals obtained, inconspicuous fingerprint absorption peaks, and insufficient resolution and sensitivity to meet the demand for the detection of trace substances [22,23].
Metasurfaces, as two-dimensional subwavelength periodic resonant structures, enhance the interaction [24,25] between terahertz waves and trace substances through localized electromagnetic field enhancement, thereby realizing the amplification of the detection signal of terahertz waves and enabling trace detection. Metasurfaces can be based on molecular fingerprint spectrum characteristics. By precisely matching the resonance peaks of the metasurface with the fingerprint peaks of the material, the interaction between the metasurface and the substance can be significantly enhanced, thereby improving the sensitivity of the sensor and enabling specific detection of the target object [26,27,28]. Traditional forward design of metasurface sensors requires pre-setting structural patterns through parametric modeling based on target optical performance requirements, followed by repeated structural parameter optimization and performance verification to ultimately achieve the desired sensing functionality. The traditional design process for metasurface sensors is limited by their high complexity and time-consuming nature, relying on researcher-driven electromagnetic simulation strategies that require repeated computationally intensive full-wave simulations to explore the parameter space until the target optical response is achieved. Traditional forward design struggles to immediately achieve ideal design outcomes, necessitating repeated trial-and-error iterations, which severely hinders the application of terahertz metasurface sensors.
In recent years, data-driven methods such as artificial neural networks have been used to replace the traditional simulation process, accelerating the intelligent and optimal design of super-surface structures, and solving the difficult problem of the technology of complex structure design and multiparameter co-optimization. Unlike conventional metasurfaces designed using electromagnetic simulation, well-trained deep learning or neural network models can quickly, efficiently, and accurately automatically output metasurface structures that satisfy the design parameters. At the same time, numerous studies have already demonstrated the outstanding ability of deep learning or neural network models to address challenges in electromagnetic simulation. Zhao et al. applied efficient deep learning to the inverse design of terahertz metasurface biosensors [29]. Their proposed scheme can generate suitable structural parameters based on the required frequency and bandwidth. Hu et al. proposed a deep learning method combining LSTM with CNN to design dual-band electromagnetically induced transparent terahertz devices on demand [30]. Simulations and experiments showed that this approach enables fast and efficient design of dual-EIT MMs. Son et al. used a bidirectional DNN combined with inverse design to create an all-dielectric metasurface colorimetric sensor [31]. They achieved a target of keeping the MSE error within 0.005.
The on-demand design methodology in this study can be tailored to different agricultural application scenarios of exogenous and endogenous molecules in plants, which can significantly simplify the design process and quickly and accurately output metasurface sensors with appropriate performance specifications. This study targeted the detection of exogenous plant molecules (the plant growth regulator gibberellic acid and the pesticide folpet) and endogenous metabolites (abscisic acid and chlorophyll). By comparing various machine learning models and deep learning models, the optimal algorithm model (SC_ISSA-BPNN) was selected to design five types of single/dual-peak terahertz metasurface sensors with high specificity as required. The model’s generalization ability was further validated using four additional substances: carbendazim, β-carotene, phenylalanine, and 2,4-D.

2. Methods and Materials

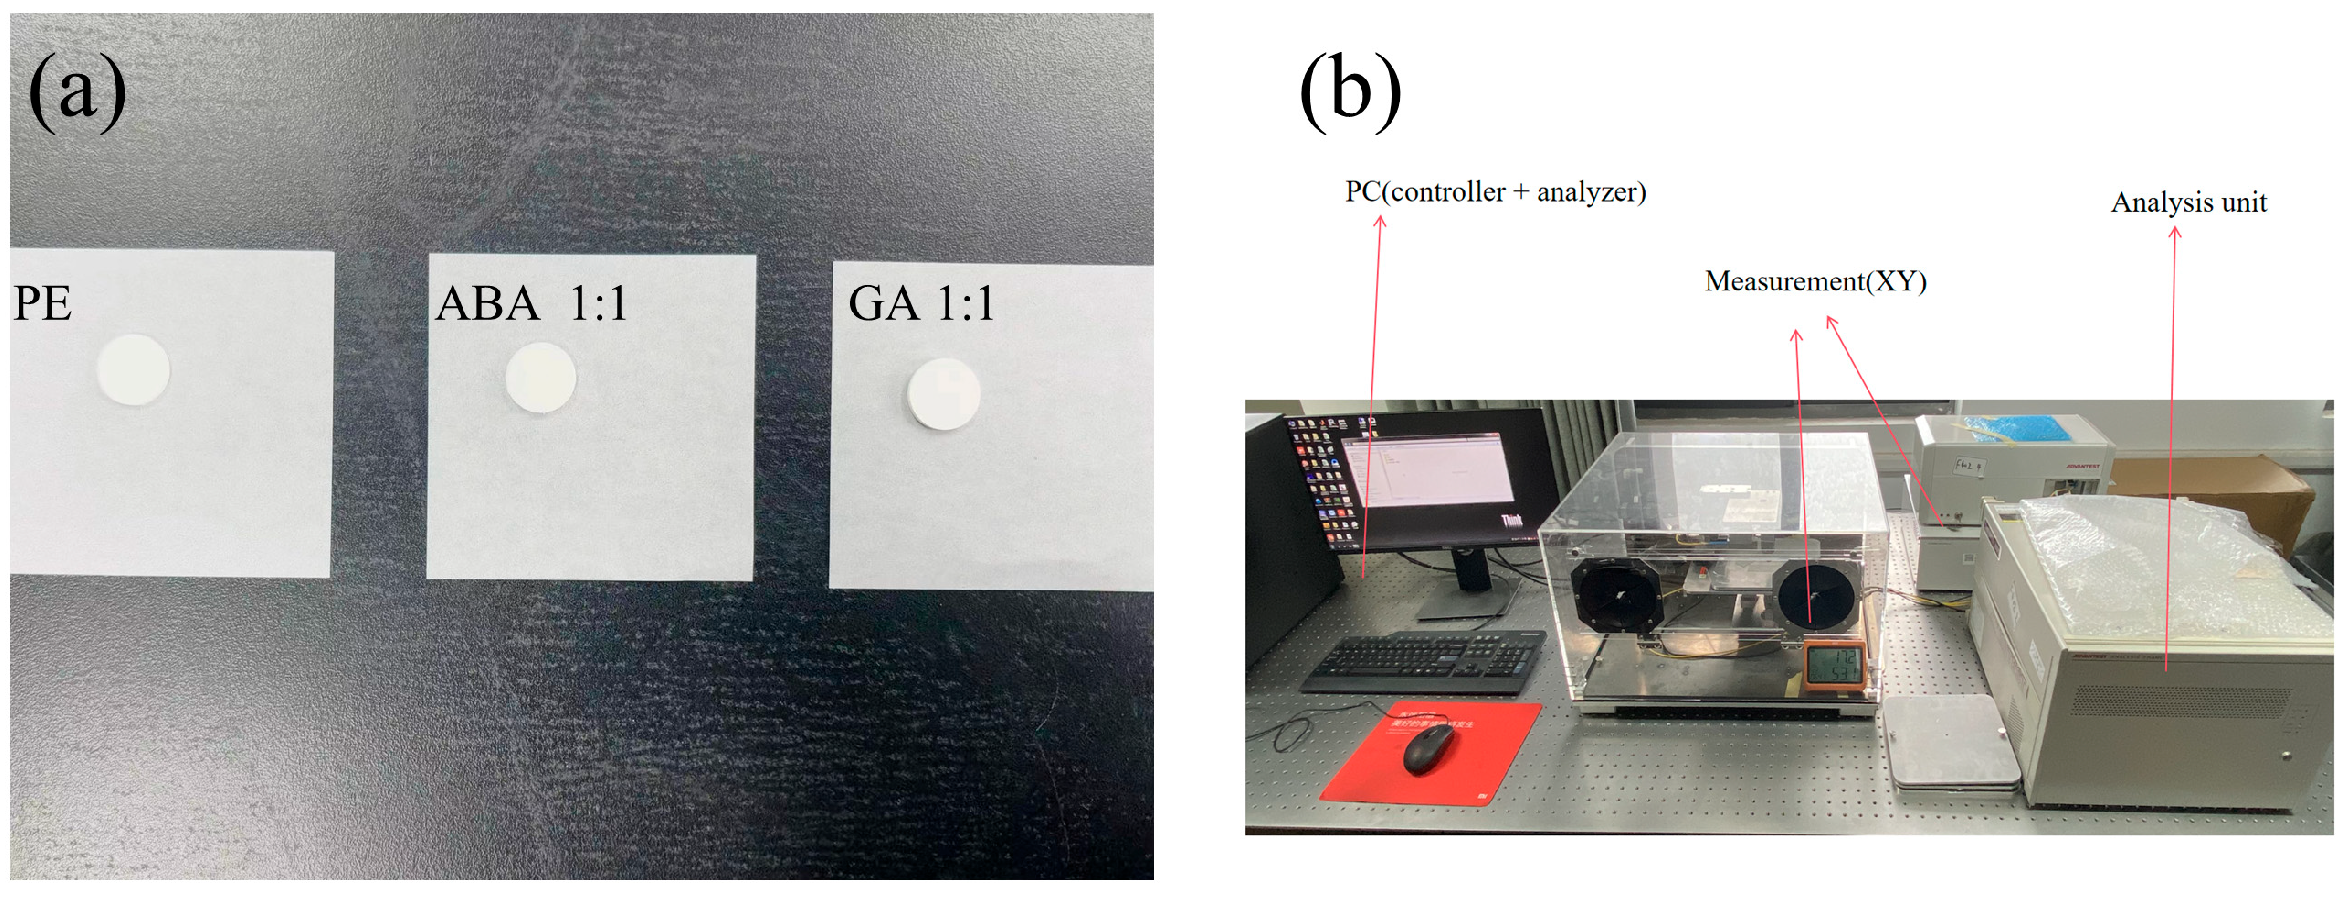
2.1. Target Terahertz Fingerprint Peak Acquisition

Gibberellic acid (GA) (purity 96%) and abscisic acid (ABA) (purity 98%) pure samples were purchased from Shanghai Yi En Chemical Technology Co. (Shanghai, China). Polyethylene (PE) was selected as the diluent. High-density polyethylene is nearly transparent in the terahertz wavelength range, so it does not affect the characteristic absorption peaks of the sample in the terahertz wavelength range when used as a diluent. Additionally, its viscosity allows it to act as an adhesive, making it easier to form the sample during the pressing process. First, abscisic acid, gibberellic acid, and polyethylene powder were ground in an agate mortar. After grinding, the samples were sieved through a 200-mesh standard sieve to remove large particles. Then, the amounts of abscisic acid, gibberellic acid, and polyethylene were quantitatively measured using a precision electronic balance. Next, abscisic acid and polyethylene (gibberellic acid and polyethylene) were mixed uniformly. Then, using a tablet press, the mixture was compressed at 12 MPa pressure for 3 min. The two samples and polyethylene powder were compressed into circular tablets with a thickness of approximately 1.1 mm and a diameter of approximately 13 mm at mass ratios of 1:1, 3:1, and 5:1. Figure 1a shows the samples prepared by the tableting pressing method, in which the pure PE will serve as the sample for the background reference spectrum. The transmission module of a TS7400TS terahertz spectrometer (Advantest Ltd., Tokyo, Japan) was employed to acquire the THz spectra of the tablets (Figure 1b). To reduce the impact of moisture on the THz spectra, nitrogen purge was applied to maintain the humidity within the detection chamber below 5% during the experiment. The terahertz time-domain spectrometer had a detection range of 0.5–1.8 THz, a frequency resolution of 7.6 GHz, and used perpendicular incidence with both the incident and refracted angles at 0°, with no multiple THz wave reflections within the sample. With pure PE as the reference spectrum, the sample’s complex refractive index and extinction coefficient were derived by calculating the ratio of the pure PE spectrum to the sample spectrum, following the optical parameter extraction method proposed by Dorney and Duvillaret et al. [32,33,34]. The sample’s absorption spectrum (fingerprint spectra) was then calculated.
The positions and intensities of THz absorption peaks for gibberellic acid and abscisic acid mainly result from low-frequency vibrations, including bond stretching, bond angle changes, and dihedral angle rotations within or between molecules, among others. In this study, the quantum-chemistry software Gaussian16W (Windows version of Gaussian16) was used to analyze the fingerprint spectrum of gibberellic acid and abscisic acid. The vibration-mode analysis involved three steps: molecular modeling, structural optimization, and molecular-frequency calculation. First, the single-molecule geometric-structure information of gibberellic acid and abscisic acid was obtained from the Protein Data Bank (PDB). Then, input files for the two target substances were created in GaussianView, and structural optimization and molecular frequency calculations were carried out using Gaussian16W software. The theoretical calculations used the B3LYP method and 6-311G (d,p) basis set from density functional theory (DFT). Finally, after the calculation was completed, we checked whether the imaginary frequency appeared to judge whether the simulation calculation was completed or not. The theoretical calculation did not appear to be an imaginary frequency, indicating that this single-molecule model was the minimum energy configuration. This model can be used to carry out molecular vibration simulation and analysis. The single-molecule structures of gibberellic acid and abscisic acid after geometric optimization are shown in Figure 2.

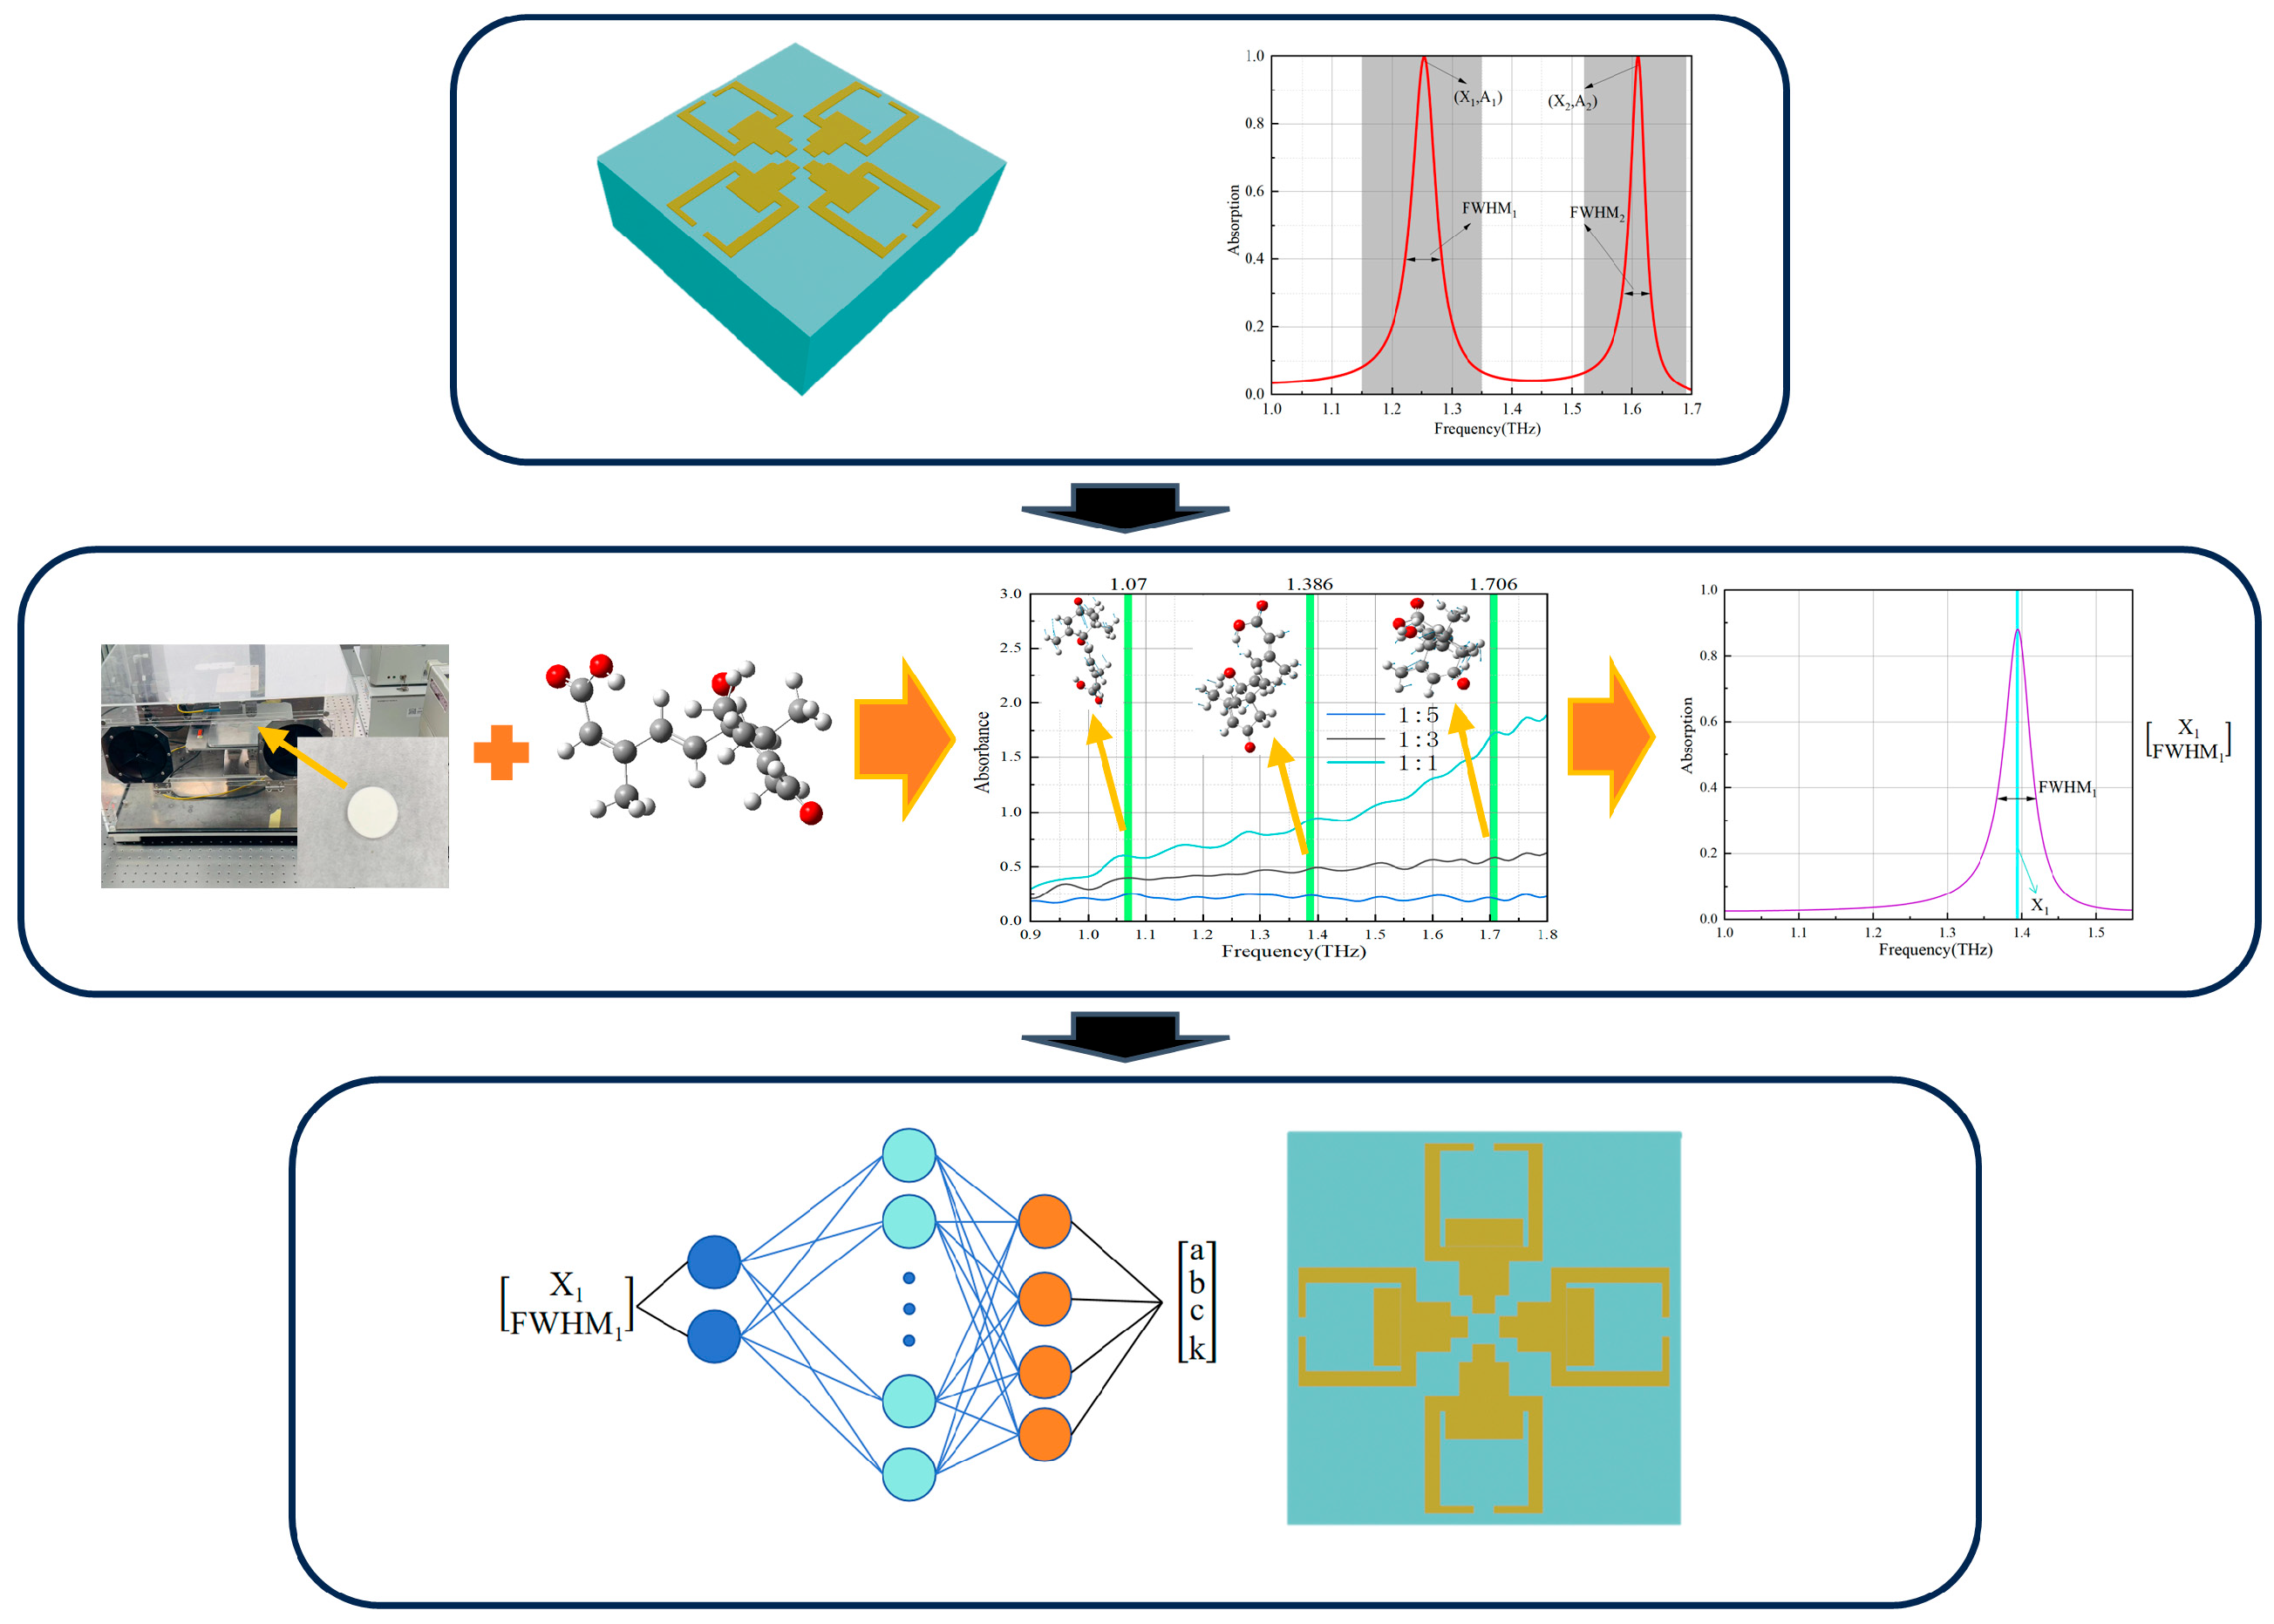
2.2. On-Demand Design Overall Concept

The overall design approach is illustrated in Figure 3. Initially, a three-layer metasurface sensor was preliminarily designed using CST Studio Suite 2023, and relevant datasets were collected and processed.
Subsequently, the target performance indicators were established to serve as inputs to the neural network model, and the experimental fingerprint spectra and experimental fingerprint peaks of the measured samples were first obtained by a terahertz time-domain spectrometer, while simulations of the measured samples were carried out by using density functional theory in order to resolve the fingerprint peaks of the samples. These fingerprint peaks were then used to construct the target performance indicators.
Finally, the collected dataset was used to develop neural network models for the on-demand design of the metasurface sensor. Different optimized neural network models were compared based on the prediction-error magnitudes of their performance indicators, leading to the development of optimal-algorithm-based neural network models. The target performance indicators based on fingerprint peaks were utilized as inputs for this model to predict the structural parameters and ultimately obtain the desired metasurface sensor.
The detailed details of each design part will be elaborated in the following subsections.

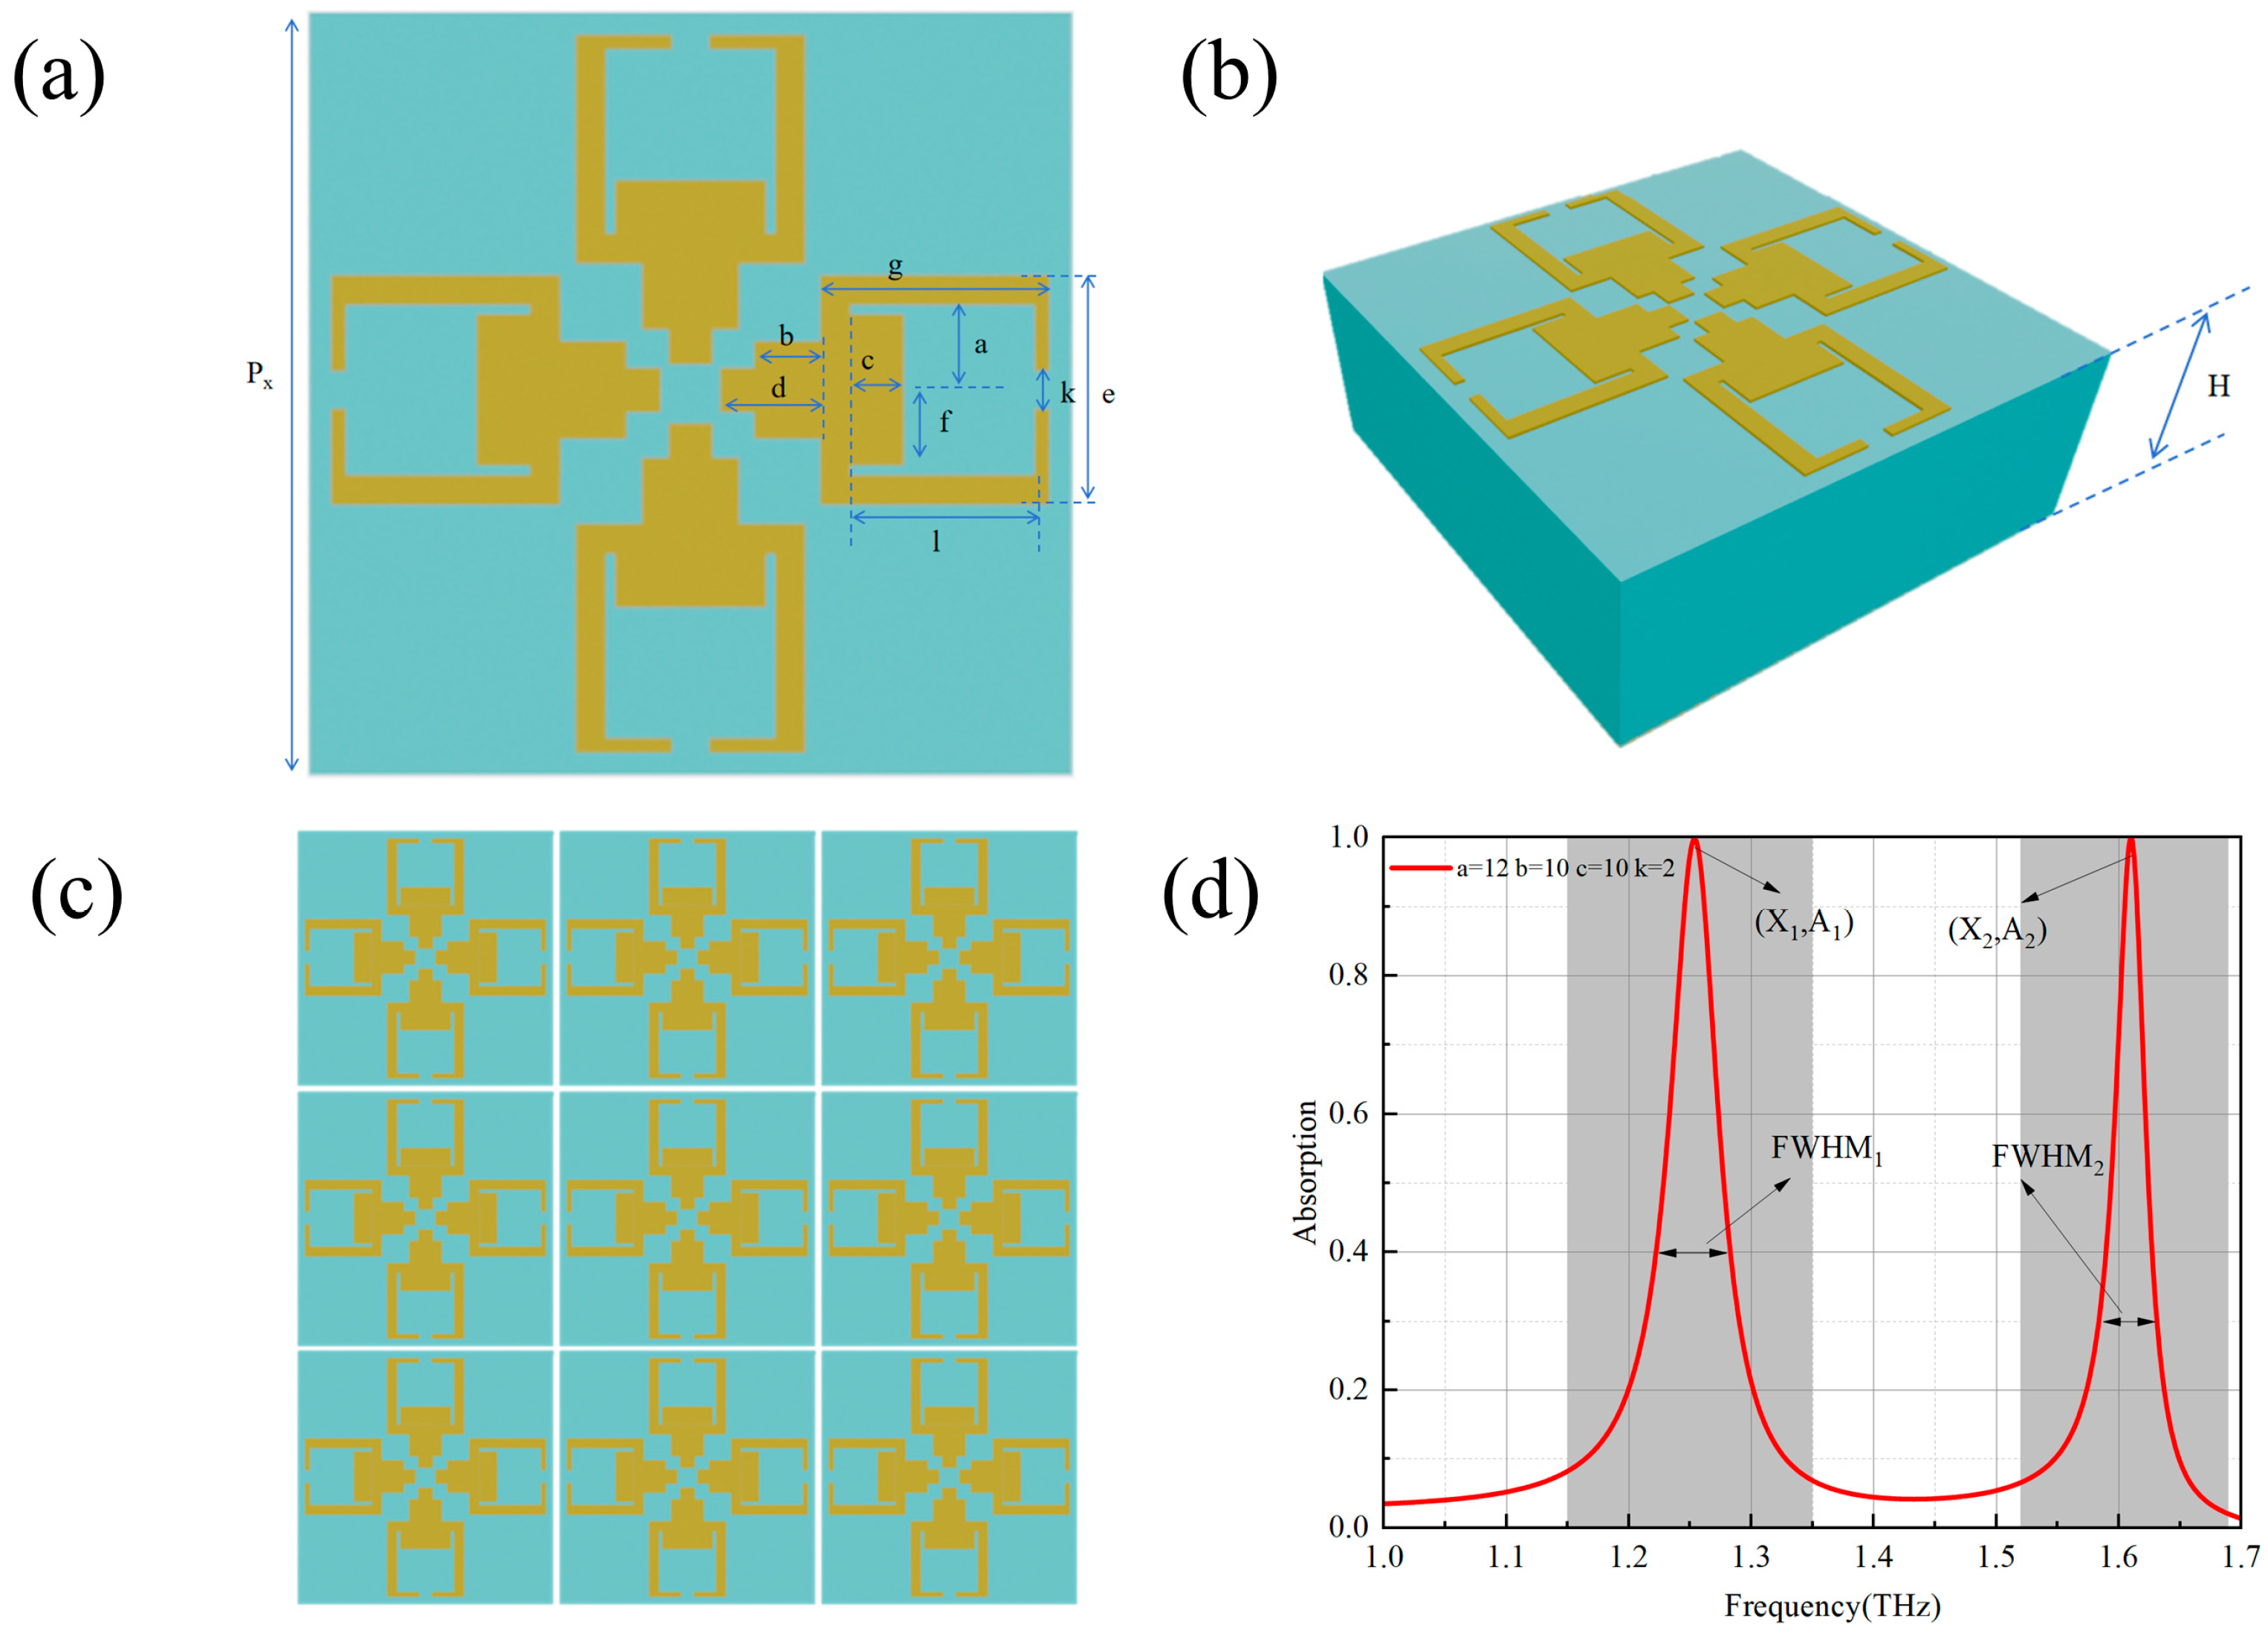
2.3. Dataset Construction for Inverse Design of Terahertz Metasurface Sensors

The THz metasurface sensor features a three-layer structure of gold–polyimide–gold, as shown in Figure 4a,b. This three-layer structured metasurface sensor is flexible and suitable for most sensing scenarios in the agricultural field. Au is an inert metal, and polyimide is chemically inert, which lays the theoretical foundation for the long-term use of processed and manufactured metasurface sensors. The structural period is Px = 50 μm. The bottom and top layers are gold with a conductivity of σ = 4.561 × 10⁷ S/m and a thickness of 0.2 μm. The middle layer is polyimide with a dielectric constant of ε = 3.5 and a thickness of H = 45 μm. The top layer consists of four symmetrical “cavity”-shaped structures, incorporating eight dimensional parameters: a, b, c, d, e, f, g, l, k. Figure 4c presents a schematic of the metasurface sensor’s periodic structure. Numerical simulations in the frequency domain were performed using the electromagnetic simulation software CST Studio Suite 2023 to obtain absorption spectra, as depicted in Figure 4d. The key parameters of resonance characteristics of the sensor include, for the first resonance peak, A1 (the maximum absorption at the first resonant peak), X1 (the resonance frequency of the first resonant peak), and FWHM1 (the full width at half maximum of absorption at the first resonant peak). For the second resonance peak, the parameters are A2 (the maximum absorption at the second resonance peak), X2 (the resonance frequency of the second resonance peak), and FWHM2 (the full width at half maximum of absorption at the second resonance peak). In addition, the sensing performance index quality factors Q for the first resonance peak and the second resonance peak are Q1 (the quality factor of the first resonant peak) and Q2 (the quality factor of the second resonance peak), respectively, where Q is calculated as follows:
Q = f FWHM .
where f is the resonant frequency of the resonant peak and FWHM is the full width at half maximum of the resonant peak absorption.
The CST software was used to scan the designed metasurface sensor, generating 6571 datasets. Of these, 2371 were allocated for training the neural network model, while the remaining 4200 were reserved for calculating the sensitivity. From the 2371-dataset training pool, 2 datasets with significant deviations were discarded, leaving 2369 datasets. Subsequently, 2014 datasets (85%) were selected as the training set, and 355 datasets (15%) were designated as the test set.
Training set construction: Preliminary parameter sweeps of the structural parameters via CST identified the key parameters affecting the sensor’s performance as a, b, c, and k. A parameter sweep of these four parameters yielded 2016 datasets, which, after excluding 2 with significant deviations, resulted in 2014 training datasets. The specific parameter sweep ranges are detailed in Table 1.
Test set construction: A test set of 355 groups was intentionally constructed to assess the performance of the neural network model and its ability to generalize over an unknown range of parameters. The structural parameters of the sensors in the test set exceeded the training set boundaries. This approach assessed whether the model had captured the underlying physical laws rather than just mechanically overfitting the training set data. The test set effectively evaluated the neural network’s capacity to process new data and thus verified its generalization ability.
Sensitivity dataset construction: The sensitivity of 1050 metasurface sensors was calculated. Each sensor was coated with a 0.4 μm thick sample layer. In total, 4200 absorption spectra of sensors covered with a sample layer were calculated to obtain the sensitivity dataset (Table S1). The sensitivity calculation formula is as follows:
S = f n
where ∆f is the frequency shift of the resonance peak position and ∆n is the change in refractive index. Taking structure 3 (a = 11.7, b = 8.4, c = 9, k = 2) as an example, a sample layer with a thickness of 0.4 um was added to the surface of the metasurface sensor, and the refractive index of the sample under test was changed, changing the refractive index of the sample from 1.0 to 1.3 in 0.1 steps, and the resonant frequency corresponding to the resonant peaks was red-shifted, so as to obtain the first resonance peaks and second resonance peaks of the structure 3, as shown in Figure 5a,b. The absorption spectra of the first and second resonance peaks of structure 3 are obtained as shown in Figure 5a,b, from which Δf and Δn are calculated, and, finally, the sensor sensitivity is calculated.

3. Results and Discussion

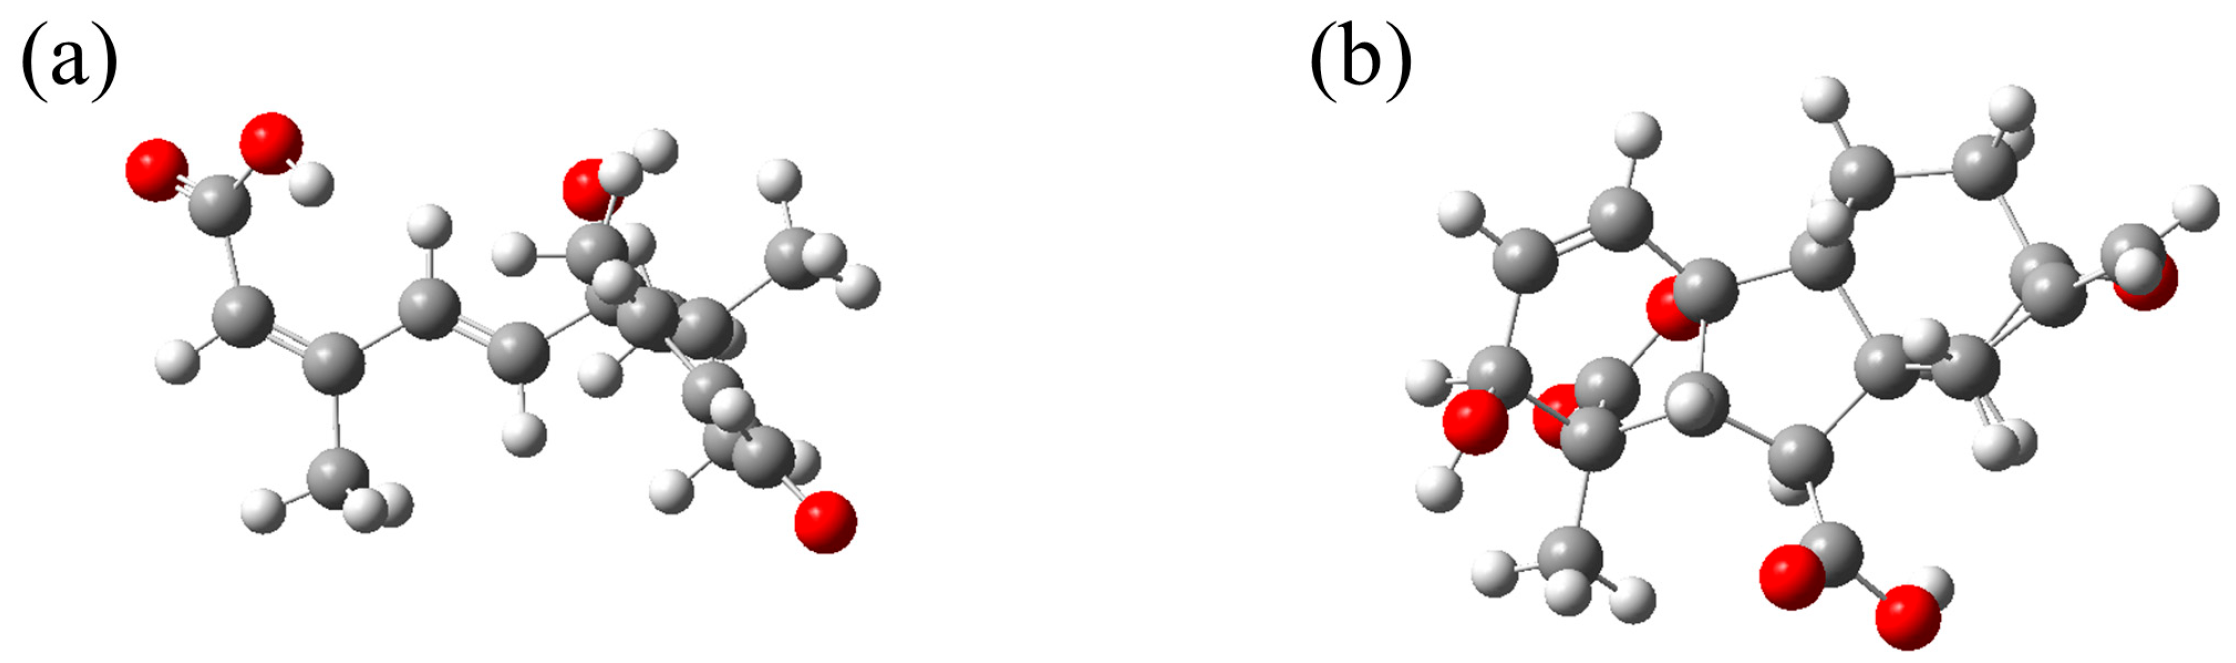
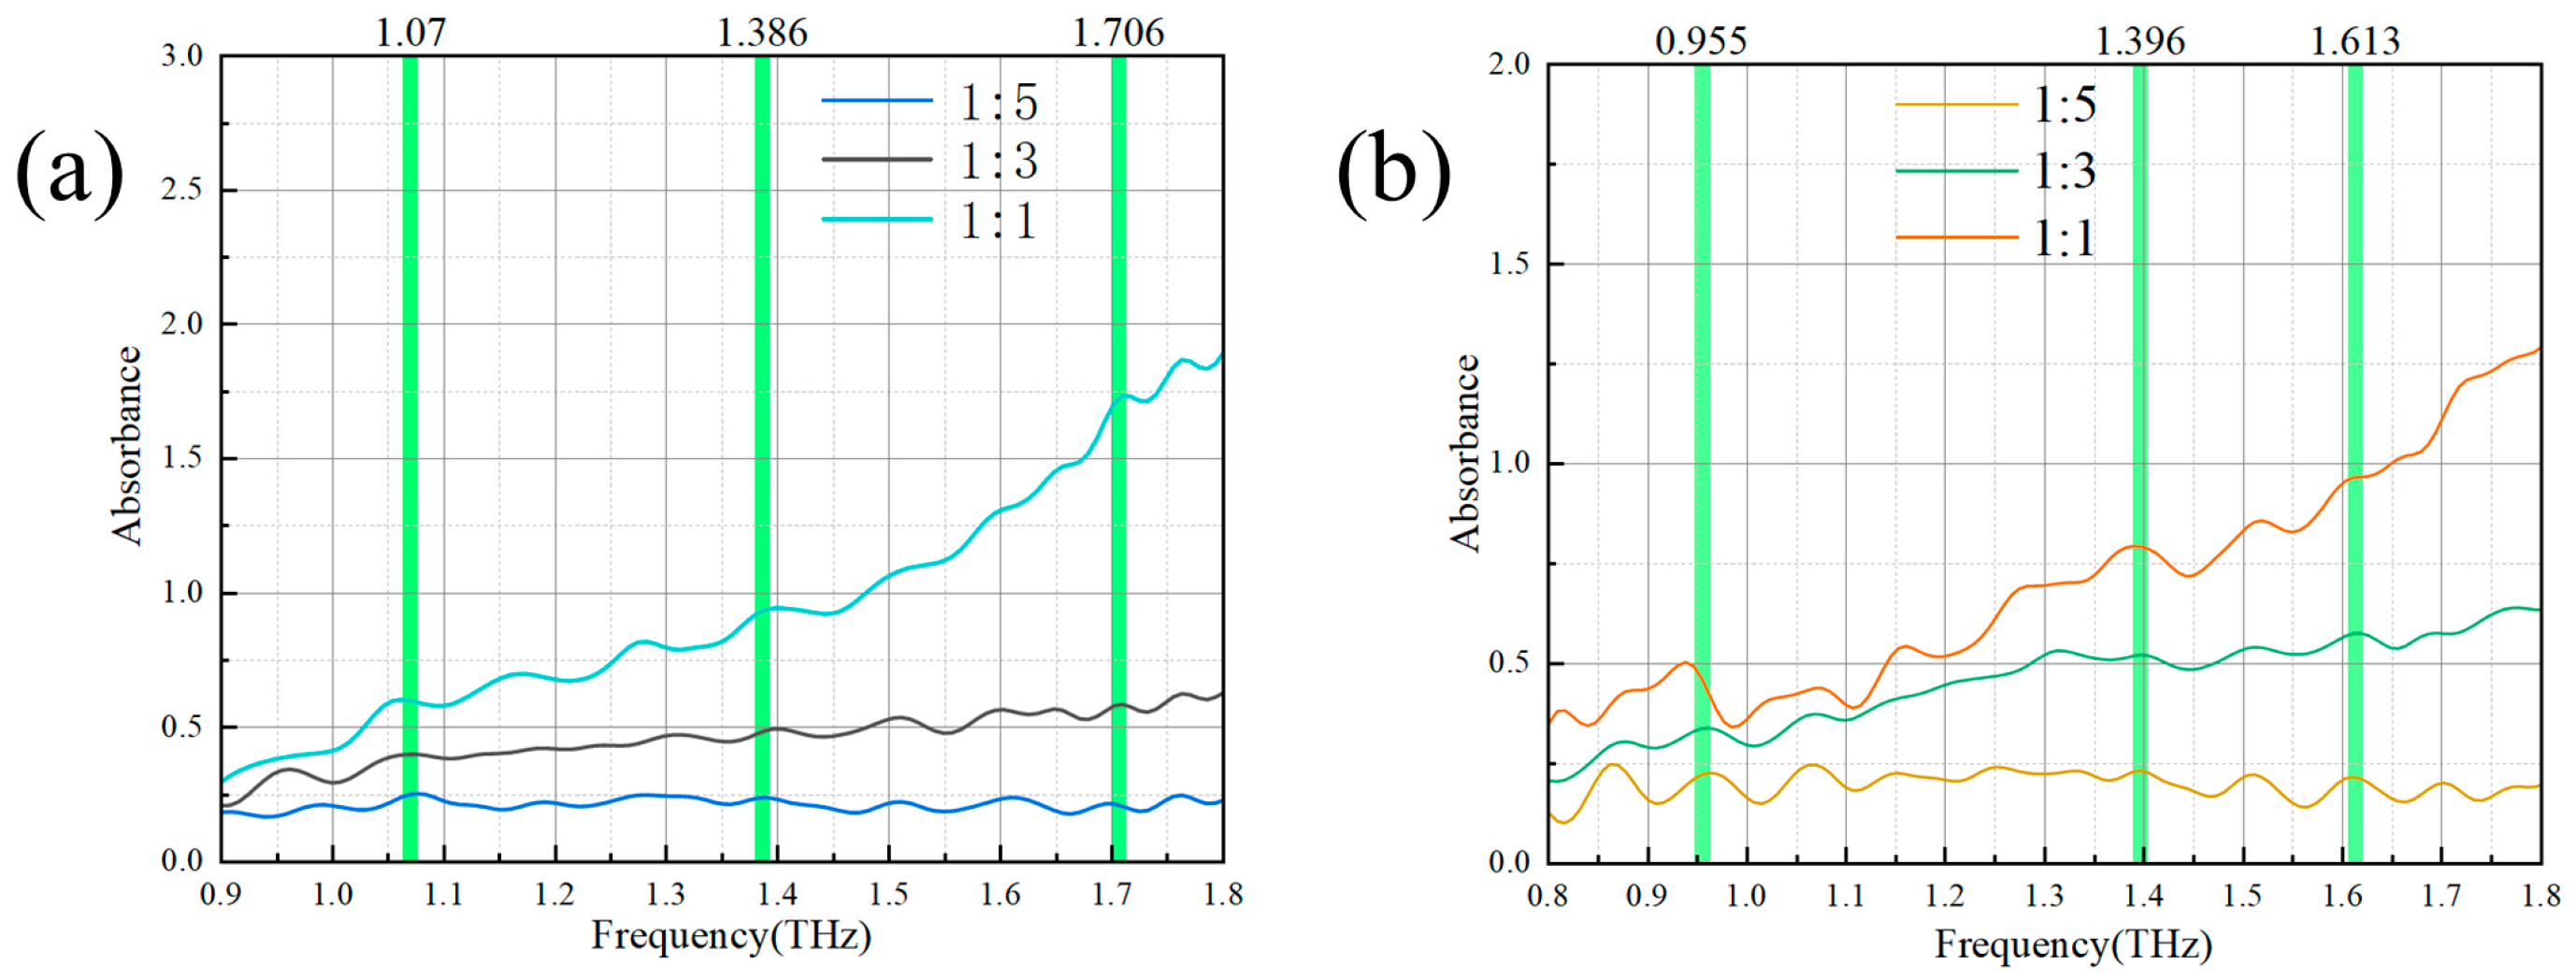
3.1. Fingerprint Peak Analysis of Gibberellic Acid and ABA Based on DFT

Experimental fingerprint spectra of pressed tablets of different ratios of polyethylene and abscisic acid, and pressed tablets of polyethylene and gibberellic acid, were obtained by using the terahertz time-domain spectrometer. From the experimental absorption spectra, the fingerprint peaks of abscisic acid were identified at 1.07 THz, 1.386 THz, and 1.706 THz, while those of gibberellic acid were at 0.955 THz, 1.396 THz, and 1.613 THz. Figure 6 illustrates the experimental fingerprint spectra and peak positions.
To investigate the origin of THz fingerprint peaks in the samples (abscisic acid and gibberellic acid), the VEDA4** program was employed to perform potential energy distribution (PED) analysis on the theoretical results. The vibrations of molecules in the terahertz frequency region mainly originate from bond length stretching (STRE, S), bond angle bending (BEND, B), dihedral angle twisting (TORS, T) [35], etc., and different vibrations lead to changes in the position of the fingerprint peak. Whereas the DFT simulation is based on a single molecule of gibberellic acid and abscisic acid, the simulation ignores the effects of crystal field effects, crystal resonance, and anharmonic effects [34,36]. This makes the theoretical frequency larger than the experimental frequency; therefore, the theoretical frequency needs to be corrected by multiplying it by a correction factor. By referring to the Computational Chemistry Comparison and Benchmark DataBase (CCCBDB), the correction factor for the 6-311G (d,p) basis set was determined to be 0.967.
After analysis, the vibration modes of gibberellic acid and abscisic acid at various frequencies were determined, and the vibration modes of the fingerprint peaks were assigned, as presented in Table 2. The fingerprint peak of abscisic acid at 1.07 THz is primarily attributed to the torsion of the dihedral angle of C9C10C11C13. The fingerprint peak at 1.386 THz is mainly due to the variation in the angle between the O6C3 vector and the plane of C2C4C3. The fingerprint peak at 1.706 THz is predominantly caused by the torsion of the dihedral angle of C3C2C1O14 and the bending of the bond angle of C5C7C9. Regarding gibberellic acid, the fingerprint peak at 0.955 THz is mainly due to the torsion of the dihedral angle of C11C6C15C16 and the bending of the bond angle of C5C4C6. The fingerprint peak at 1.613 THz is predominantly caused by the torsion of the dihedral angle of O1C2C4C5.

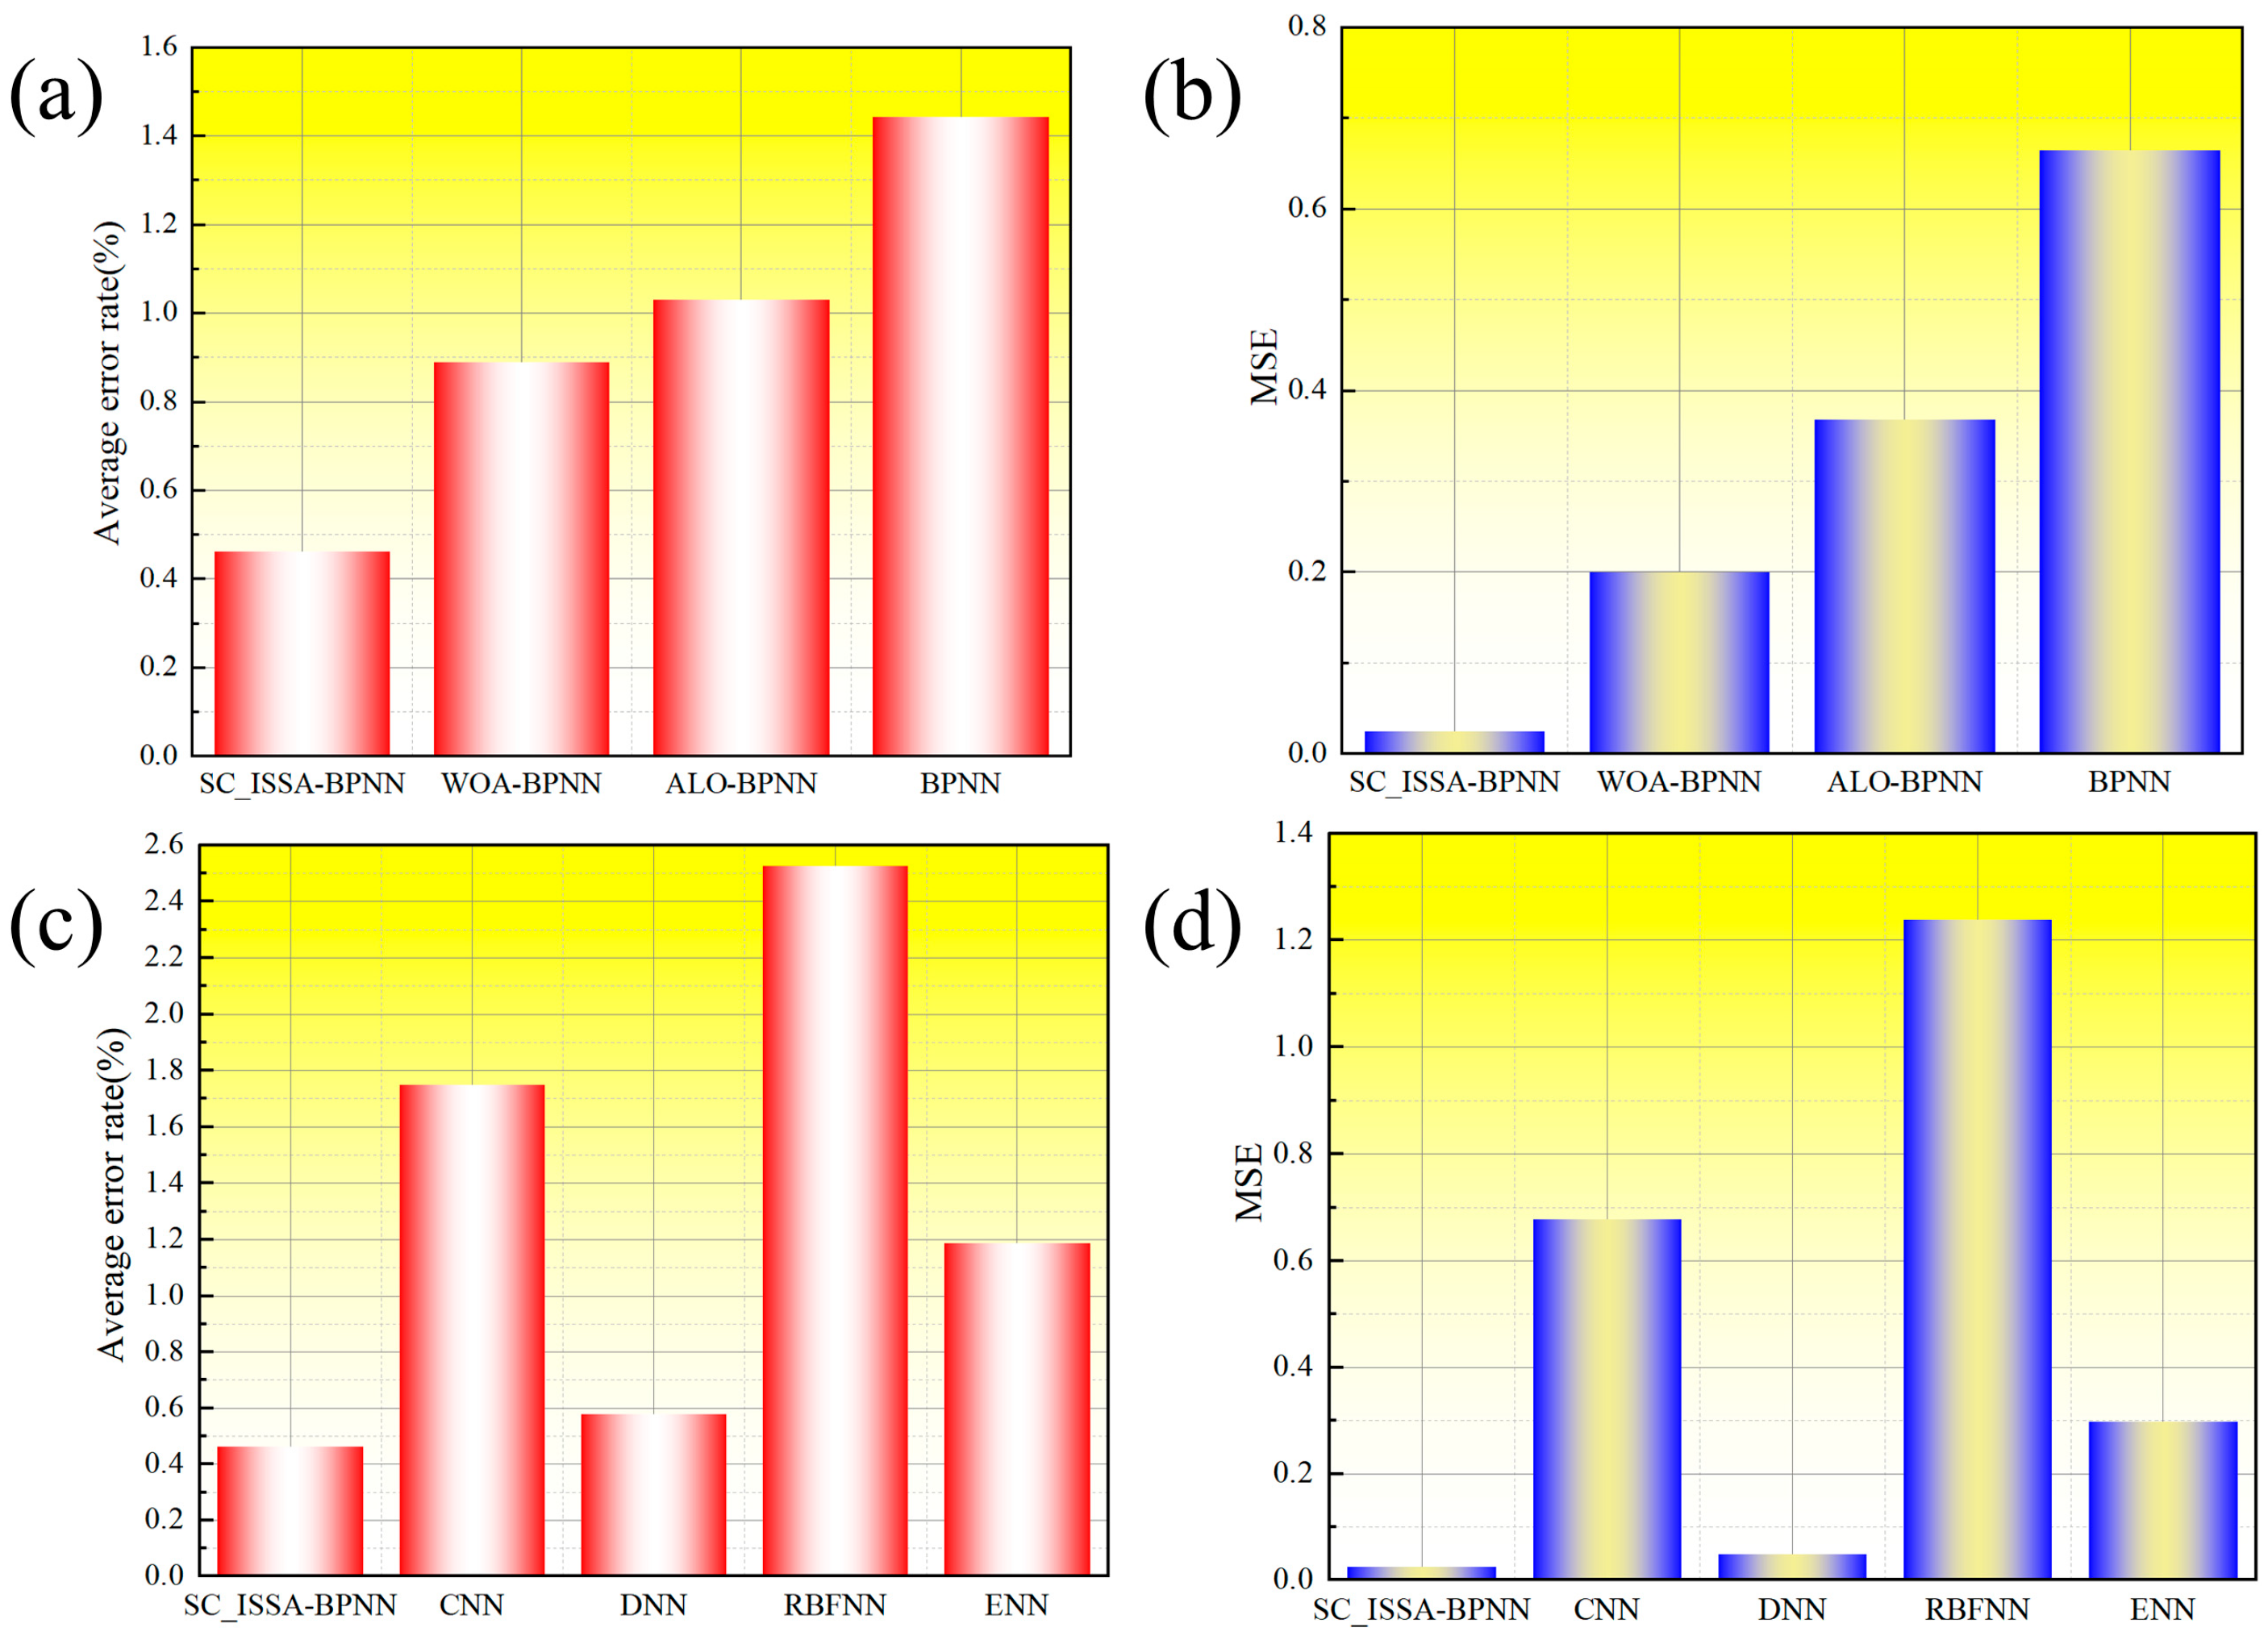
3.2. Comparison of On-Demand Design Algorithms

This study optimized BPNN using three algorithms and compared them with BPNN to identify the optimal method for enhancing neural network prediction accuracy and reducing errors. The optimized BPNN models retained the same structure as BPNN. The neural network models took inputs from the first resonant peak (A1, X1, FWHM1, Q1) and the second resonant peak (A2, X2, FWHM2, Q2), had 10 hidden layer nodes, and outputted four structural parameters of the metasurface sensor. Both the original and optimized BPNN were trained and tested using identical training and testing datasets. Finally, the most outstanding BPNN algorithm of optimization was compared with machine learning models (Elman neural network (ENN) and radial basis function neural network (RBFNN)) and deep learning models (convolutional neural network (CNN) and deep neural network (DNN)) to select the optimal algorithm model for establishing the complex mapping relationship between the performance indicators and structural parameters of the metasurface sensor.
This study selected three optimization algorithms to enhance BPNN, namely, the Whale Optimization Algorithm (WOA) [37], Ant Lion Optimizer (ALO) [38], and the Improved Sparrow Search Algorithm with a hybrid strategy integrating the Sine Cosine Algorithm and Lévy flight (SC_ISSA). The WOA simulates the predation behavior of humpback whales, updating the candidate solutions in the solution space by spiral swimming and circling around the prey, with strong global search capability. The ALO is derived from the ant lion’s behavior of preying on ants in nature, with a fast search speed and strong global optimization capability. The SC_ISSA integrates the Sine Cosine Algorithm with the Levy flight-based Sparrow Search Algorithm. By incorporating different optimization strategies, it boosts the algorithm’s search efficiency and global optimization capability. The introduction of the Sine Cosine Algorithm and Levy flight strategy allows SC_ISSA to handle complex optimization problems more flexibly and efficiently. This enables the algorithm to better balance exploration and exploitation during the search process, enhancing its ability to find optimal solutions. During BPNN training, issues like local optima trapping, slow convergence, and sensitivity to initial weights and learning rates are common [39]. Optimization algorithms such as the WOA, the ALO, and the SC_ISSA can effectively address these shortcomings.
To further assess the performance of the proposed algorithm models, firstly, two untrained datasets from the test set were randomly selected for evaluation. These datasets, designated as Structure 1 (a = 13.1, b = 10, c = 8.51, k = 2.5) and Structure 2 (a = 12.05, b = 8.41, c = 9.5, k = 4), served to validate the models’ generalization capability and overall performance. The actual performance indicators (resonant characteristic parameters (A, X, FWHM) and sensing performance indicator Q) of these two structures were then used as the target performance indicators as inputs to the BPNN, WOA-BPNN, ALO-BPNN, SC_ISSA-BPNN, ENN, RBFNN, CNN, and DNN. The structural parameters obtained from the models’ outputs were input into CST for simulation, yielding predicted absorption spectra. Figure 7a,b contrast the actual and predicted spectra, and the predicted performance indicators were derived from these spectra. Finally, the prediction outcomes of the BPNN, WOA-BPNN, ALO-BPNN, SC_ISSA-BPNN, ENN, RBFNN, CNN, and DNN were evaluated using RER and MSE.
Table S2 contains the target performance indicators of Structure 1 and Structure 2, with the predicted performance indicators of Structure 1 and Structure 2 predicted by BPNN, WOA-BPNN, ALO-BPNN, SC_ISSA-BPNN, ENN, RBFNN, CNN, and DNN.
A comprehensive assessment of the first resonance peak’s A1, X1, FWHM1, and Q1, and the second resonance peak’s A2, X2, FWHM2, Q2 from Annex Table S2 was conducted. Using the average RER as a metric for model performance, the results indicated that when predicting Structure 1, the average RERs for BPNN, WOA-BPNN, ALO-BPNN, and SC_ISSA-BPNN were 1.35%, 0.736%, 0.548%, and 0.647%, respectively. When predicting Structure 2, the average RER values were 1.54%, 1.04%, 1.51%, and 0.277%, as depicted in Figure 7c. In the prediction for Structure 1, the smallest average RER was ALO-BPNN, followed by SC_ISSA-BPNN, which had a slightly larger average RER than ALO-BPNN, which had the smallest average RER, while the difference between the two average RERs was very small. In the prediction for Structure 2, SC_ISSA-BPNN demonstrated a significantly better predictive performance than the other algorithms.
When evaluating the models using the average MSE as the performance metric, as shown in Figure 7d, the MSE values for predicting Structure 1 were 0.167 for BPNN, 0.068 for WOA-BPNN, 0.0303 for ALO-BPNN, and 0.0359 for SC_ISSA-BPNN, with ALO-BPNN achieving the lowest MSE, followed closely by SC_ISSA-BPNN. For Structure 2, the MSE values were 1.16 for BPNN, 0.331 for WOA-BPNN, 0.705 for ALO-BPNN, and 0.0128 for SC_ISSA-BPNN. The results show that the average MSE of ALO-BPNN is the smallest in the prediction of Structure 1, followed by SC_ISSA-BPNN with a very small difference; in the prediction of Structure 2, SC_ISSA-BPNN predicts significantly better than the other algorithms.
The average RERs and average MSEs for structures 1 and 2 were further averaged. As shown in Figure 8a, the composite average RERs for BPNN, WOA-BPNN, ALO-BPNN, and SC_ISSA-BPNN when predicting structures 1 and 2 were 1.44%, 0.89%, 1.03%, and 0.462%, respectively. As shown in Figure 8b, the composite average MSEs for BPNN, WOA-BPNN, ALO-BPNN, and SC_ISSA-BPNN when predicting structures 1 and 2 were 0.664, 0.199, 0.368, and 0.0244, respectively.
From the above analysis, it can be seen that among the three optimized algorithms and the BPNN, the most outstanding BPNN algorithm of optimization was SC_ISSA-BPNN. Subsequently, SC_ISSA-BPNN was compared with ENN, RBFNN, CNN, and DNN to select the optimal algorithm model. First, we calculated the average RERs and average MSEs for the first resonance peak (A1, X1, FWHM1, Q1) and the second resonance peak (A2, X2, FWHM2, Q2) of structures 1 and 2 in Supplementary Table S2. Then, we averaged the average RERs and MSEs of structures 1 and 2 again to obtain the comprehensive average RERs and comprehensive average MSEs. The comprehensive average RERs values for SC_ISSA-BPNN, CNN, DNN, ENN, and RBFNN when predicting structures 1 and 2 were 0.462%, 1.75%, 0.579%, 2.53%, and 1.19%, respectively, as shown in Figure 8c. The comprehensive average MSEs for SC_ISSA-BPNN, CNN, DNN, ENN, and RBFNN when predicting Structure 1 and Structure 2 were 0.0243, 0.678, 0.0484, 1.234, and 0.298, respectively, as shown in Figure 8d.
As can be clearly seen from Figure 8a,b, the three improved BPNN models all exhibited improved prediction accuracy compared to the standard BPNN, with SC_ISSA-BPNN achieving the highest prediction accuracy. As shown in Figure 8c,d, in the comparative analysis of SC_ISSA-BPNN, CNN, DNN, ENN, and RBFNN, RBFNN demonstrated the lowest prediction accuracy, followed by CNN. DNN, being a fully connected deep neural network, is highly suitable for modeling multiobjective physical systems and joint indicator estimation for various complex systems. It can also effectively establish the complex mapping relationship between target performance indicators and metasurface sensors. However, compared to SC_ISSA-BPNN, its prediction accuracy is still slightly lower. The SC_ISSA-BPNN algorithm integrates Lévy flight and the Sine Cosine Algorithm, enhancing global search capabilities and resistance to local optima. It supports the co-optimization of multiple resonance peak parameters, accelerates convergence, stabilizes predictions, accurately fits high Q-factor resonance peaks and wide spectrum responses, and is compatible with multiphysics field coupling and inverse design. This greatly improves the efficiency of on-demand design of metasurface sensors, enables better establishment of complex mapping relationships between target performance metrics and metasurface sensors, and provides a better algorithmic basis for the development of metasurface sensors.

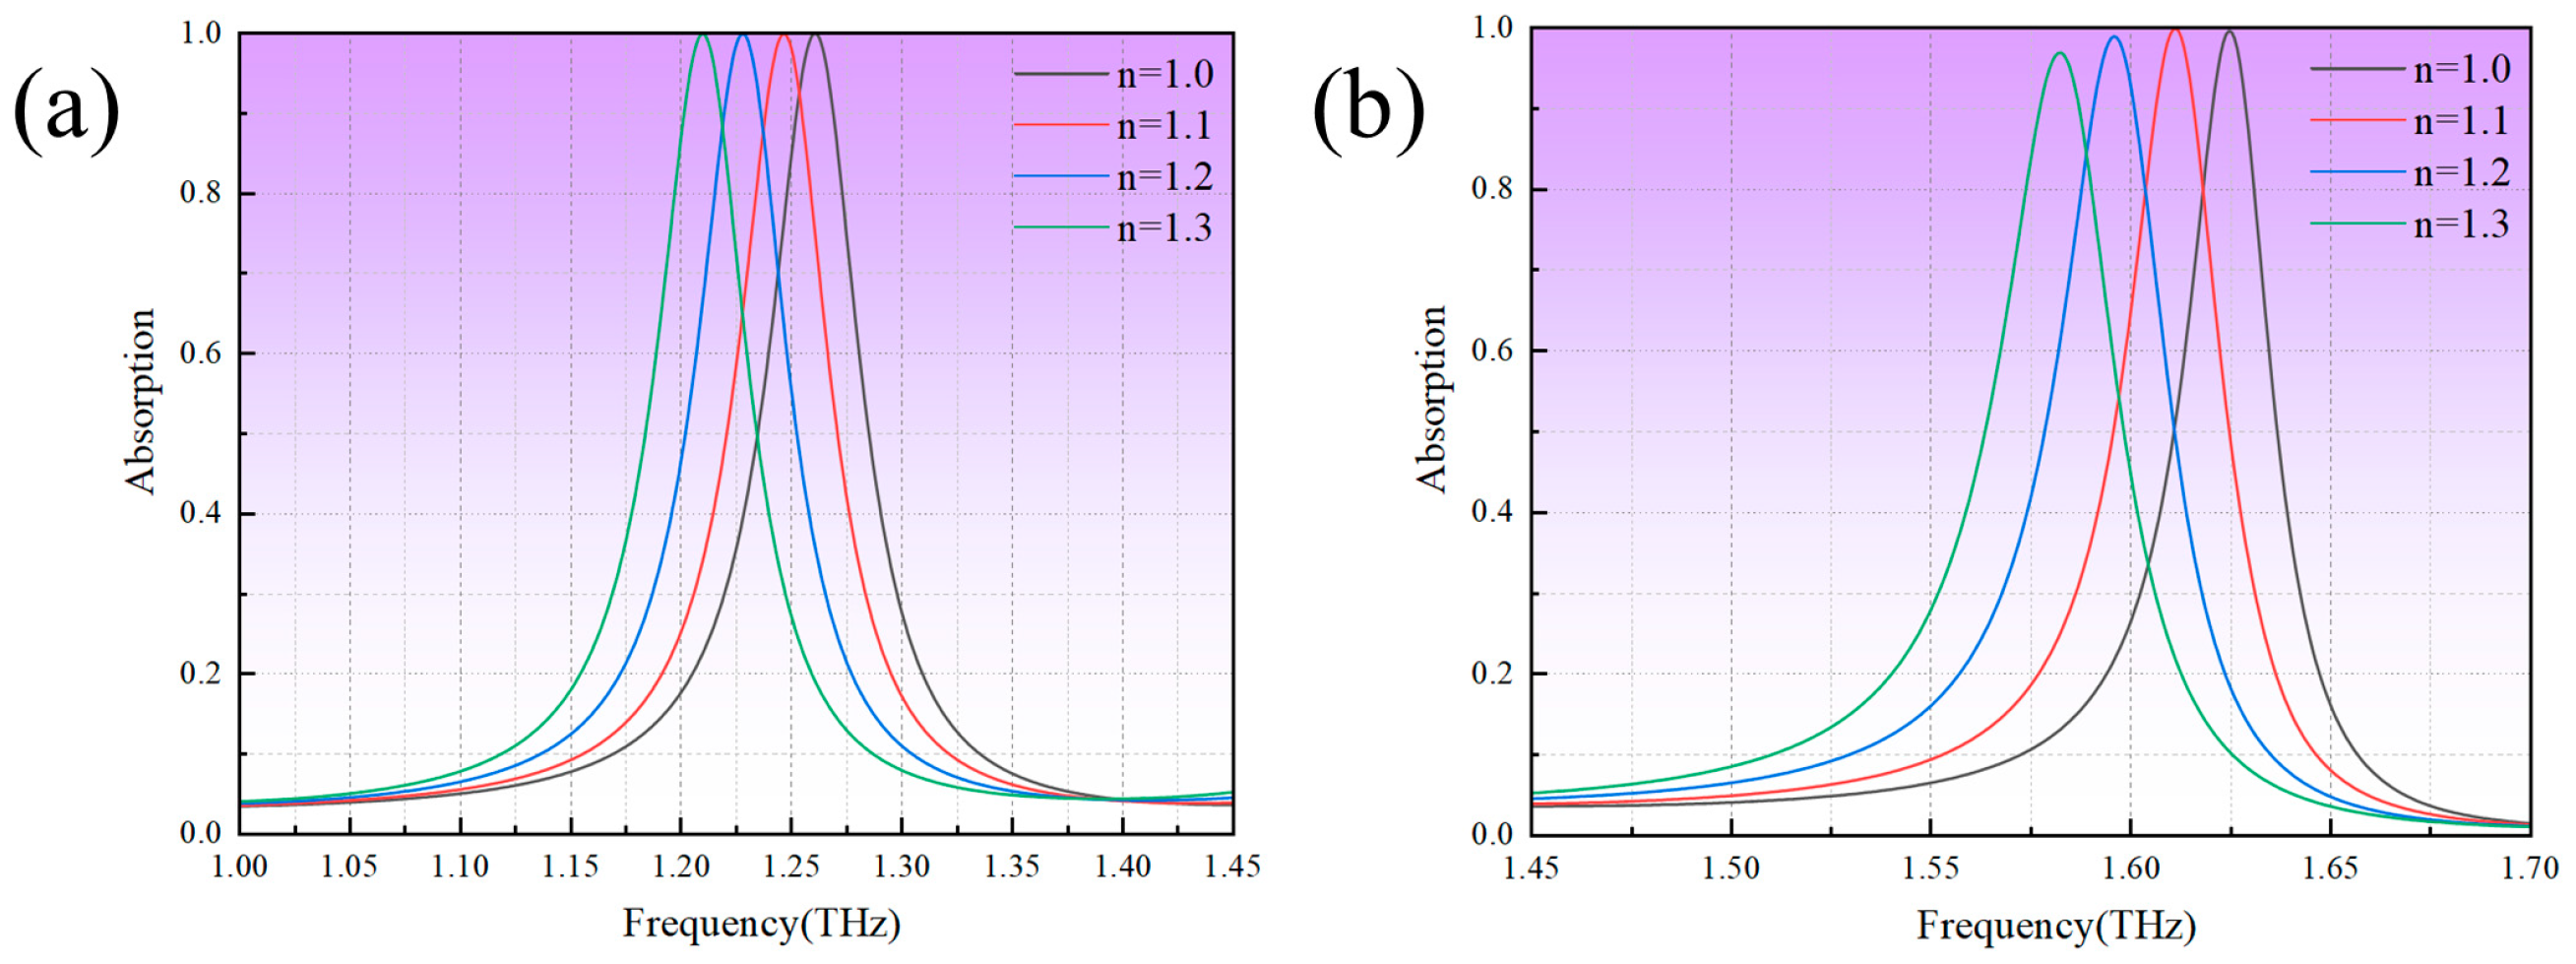
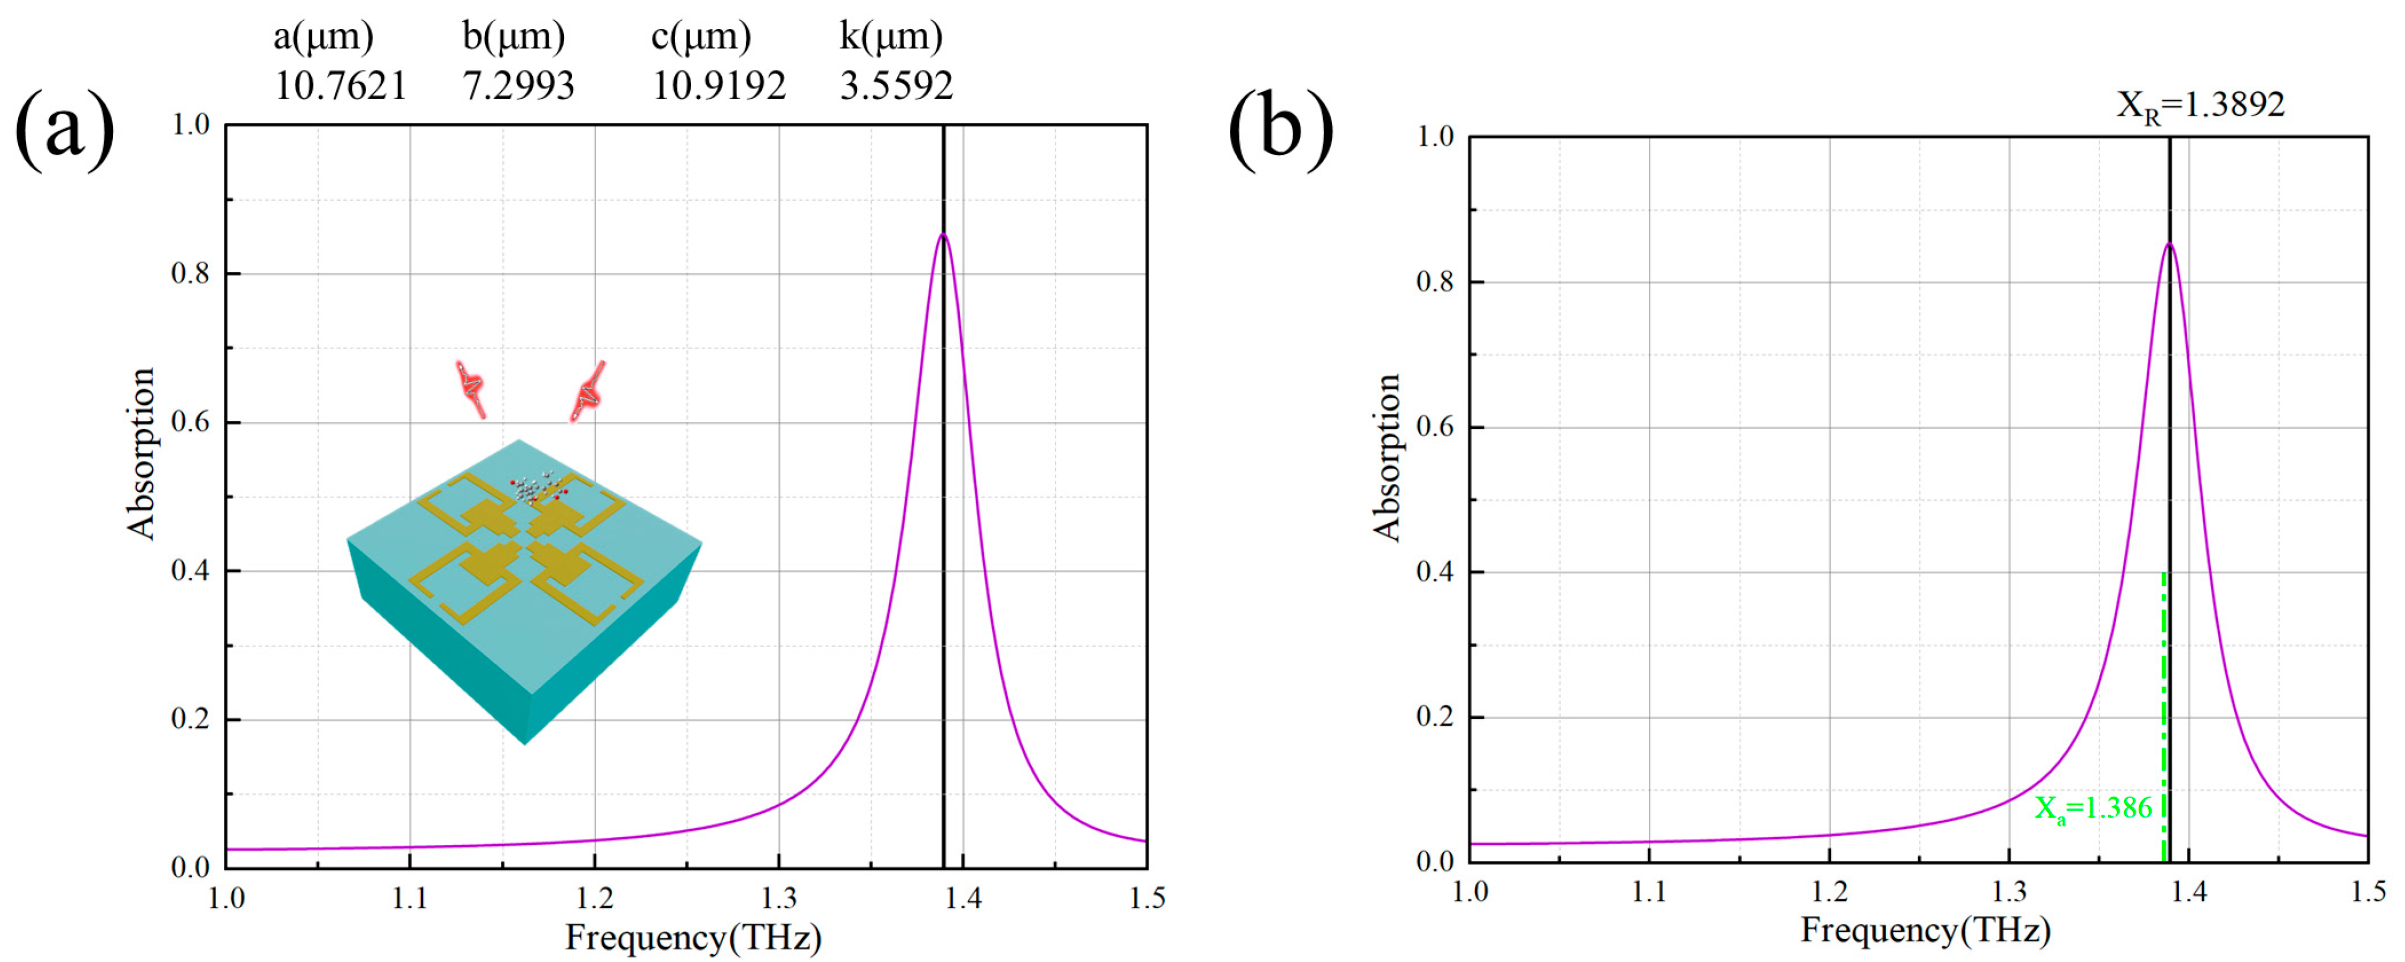
3.3. Verification and Evaluation of the Performance of the On-Demand Design Single Resonance Peak Sensors

High sensitivity is crucial for ensuring sensor responsiveness to low-concentration targets. The greater the sensitivity, the smaller the minimum concentration change the sensor can detect, which means a lower limit of detection (LOD) [40,41]. From the sensitivity calculation results (Table S1), it is evident that at any frequency, the sensitivity fluctuates significantly. For the training set of metasurface sensors, the maximum S near 1.645 THz reaches 146.2 GHz/RIU, while the minimum is as low as 63.8 GHz/RIU. To investigate the relationship between parameters of resonance characteristics and sensing performance indicators, a correlation analysis was conducted between A1, X1, and FWHM1 of the first resonant peak and S1 and Q1 of the first resonant peak, as well as between A2, X2, and FWHM2 of the second resonant peak and S2 and Q2 of the second resonant peak. The results are shown in Figure 9a,b.
The results indicate that A1, FWHM1, and S1 exhibit a negative correlation, as do A2, FWHM2, and S2. Notably, FWHM1 shows a stronger negative correlation with S1 than A1 does, and A2 demonstrates a more significant negative correlation with S2 than FWHM2. Given that a stronger correlation with S is desirable for controlling the magnitude of S, the neural network models SC_ISSA-BPNN1 and SC_ISSA-BPNN2 for abscisic acid and gibberellic acid sensors were trained using X1 and FWHM1, and A2 and X2 as inputs, respectively, with the output being the sensor’s structural parameters and the hidden layer comprising 10 nodes. In practical sensor design, it is often challenging to obtain all the required target performance indicators. This approach reduces the model’s input parameters from eight to two while maintaining four outputs, significantly lowering the difficulty of acquiring the necessary input parameters.
In the trained SC_ISSA-BPNN1 model, to achieve a high-sensitivity sensor at the abscisic acid fingerprint peak characteristic frequency of 1.613 THz, the target performance indicators input were Pinput = [X1, FWHM1]T = [1.386, 0.04232]T, and the output structural parameters were Ttarget = [a, b, c, k]T = [10.7621, 7.2993, 10.9192, 3.5592]T. These structural parameters were input into CST software for simulation. The simulated first resonant peak of the sensor is shown in Figure 10a. A comparison between the simulation results and the target fingerprint peak characteristic frequency is presented in Figure 10b. The resonant peak of the predicted metasurface sensor nearly perfectly matches the abscisic acid fingerprint peak, with an average RER of 0.167% and an average MSE of 5.66 × 10⁻⁶ between the predicted and target values. Sensitivity calculations for the designed sensor reveal a sensitivity of 155.2 GHz/RIU at the characteristic frequency of 1.386 THz. In the sensitivity dataset (Table S1), the average sensitivity of sensors with a resonant frequency near 1.386 THz is 126.8 GHz/RIU. Thus, the sensor designed using the neural network model exhibits significantly enhanced sensitivity compared to the average value.
Similarly, in the trained SC_ISSA-BPNN2 model, to achieve a high-sensitivity sensor at the gibberellic acid fingerprint peak characteristic frequency of 1.613 THz, the target performance indicators input were Pinput = [A2, X2]T = [0.997, 1.613]T, and the output structural parameters were Ttarget = [a, b, c, k]T = [12.4087, 7.3181, 9.9085, 2.7870]T. These structural parameters were input into CST software for simulation. The simulated second resonant peak of the sensor is shown in Figure 11a. A comparison between the simulation results and the target fingerprint peak characteristic frequency is presented in Figure 11b. The resonant peak of the predicted metasurface sensor matches the abscisic acid fingerprint peak with a very high degree of accuracy, with an average RER of 0.086% and an average MSE of 8 × 10⁻⁷ between the predicted A2 and X2 values and the target values. Sensitivity calculations for the designed sensor reveal a sensitivity of 150.1 GHz/RIU at the characteristic frequency of 1.616 THz. In the sensitivity dataset (Table S1), the average sensitivity of sensors with a resonant frequency near 1.613 THz is 139.1 GHz/RIU. Thus, the sensor designed using the neural network model exhibits a significant improvement in sensitivity compared to the average value.
The metasurface sensors designed in the aforementioned study demonstrate an extremely high degree of matching between their resonant peaks and the fingerprint peaks of abscisic acid and gibberellic acid, which are very suitable for specific detection. By utilizing the correlations between FWHM1 and S1, A2, and S2, and employing a neural network model, the sensor sensitivity is effectively controlled, achieving remarkable sensitivity levels of 156.7 and 150.1 GHz/RIU, respectively. By conducting comparisons with other references in the literature (Table 3), it is evident that the two designed sensors exhibit high sensitivity. Notably, even sensors with lower sensitivity than the aforementioned two can still perform trace detection. This serves as further validation of the significant superiority of the two designed sensors in trace detection. The findings indicate that these two sensors are capable of facilitating specific and trace detection of the two substances.
The generalization ability in the face of new data is one of the key indicators for assessing the performance of neural network models. SC_ISSA-BPNN1 and SC_ISSA-BPNN2 performed well in the face of the test set during training and accurately obtained high-sensitivity metasurface sensor structures for the specific detection of abscisic acid and gibberellic acid, which demonstrates that the abovementioned neural network models have a certain degree of generalization ability. In addition, other plant endogenous and exogenous molecules were used as inputs in this study to further validate its generalization ability. The literature reveals that β-carotene [48] has a fingerprint peak at 1.62 THz and carbendazim [49] at 1.347 THz. Using the trained models, we obtained high-sensitivity sensors for the specific detection of these substances, and their absorption spectra are shown in Figure 12. This demonstrates the superior generalization ability of SC_ISSA-BPNN1 and SC_ISSA-BPNN2 trained above.

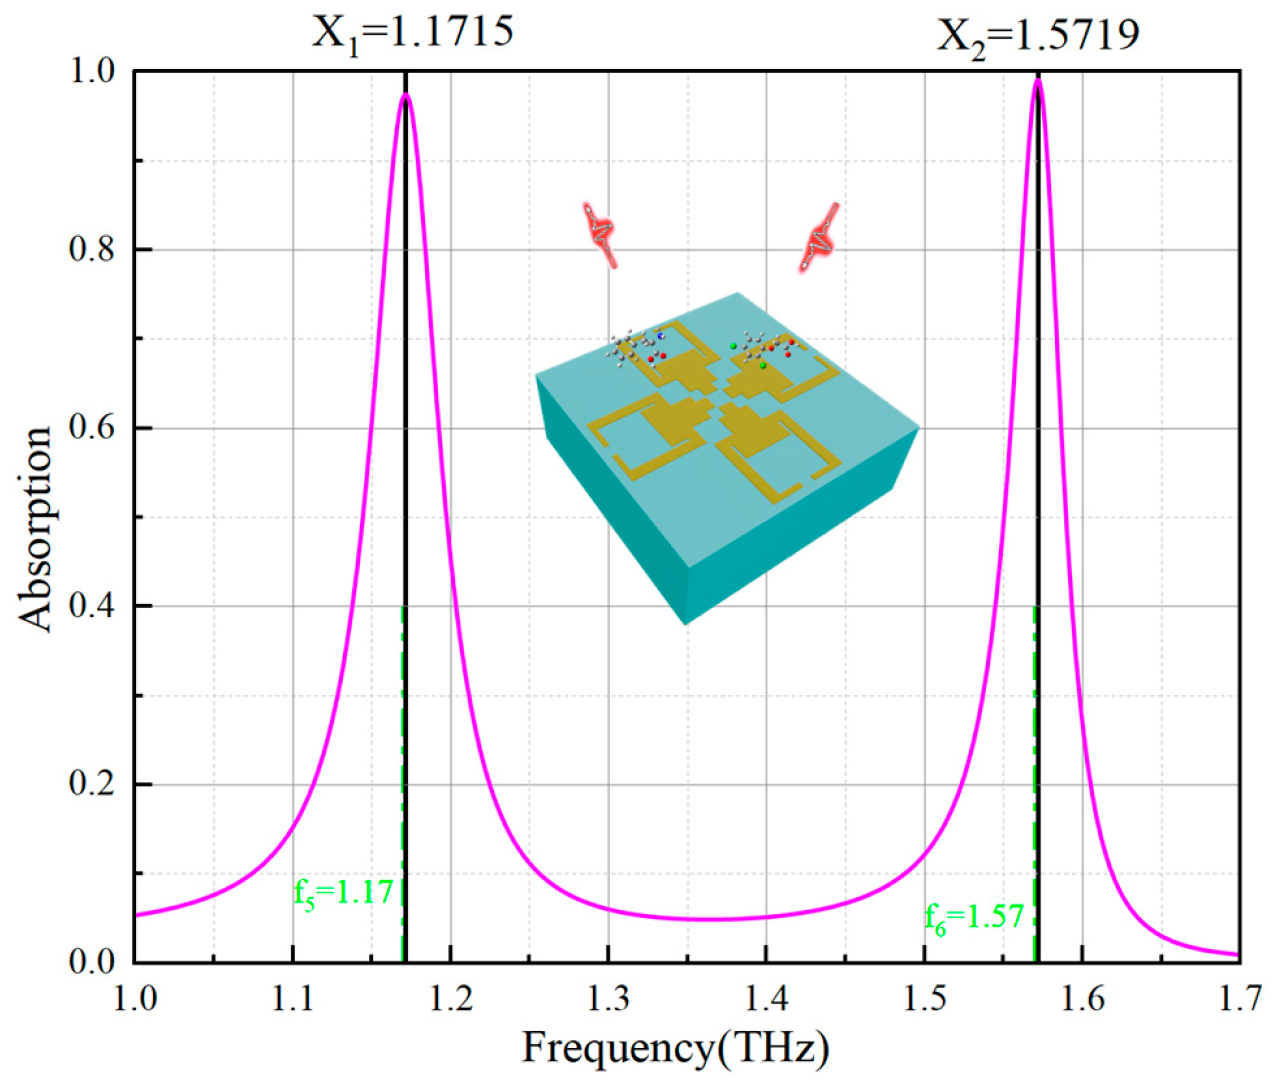
3.4. Verification and Evaluation of the Performance of the On-Demand Design Dual Resonance Peak Sensors

In order to detect two substances simultaneously or to improve the specificity of detecting one substance, a dual-peak terahertz metasurface sensor was designed in this paper. Using chlorophyll and folpet as examples, their fingerprint peak characteristic frequencies are listed in Table 4 [50,51]. The SC_ISSA-BPNN model was employed for the sensor’s dual resonance peak design. In the model, the inputs were the two fingerprint peak characteristic frequencies X1 and X2, and the output was the sensor’s structural parameters [a, b, c, k]T, with 10 hidden layer nodes, and this was used to train the neural network model SC_ISSA-BPNN3.
When inputting the desired target performance indicators as input1 = [1.23, 1.59]T and input2 = [1.277, 1.60]T, sensors can be constructed to improve the specificity of detecting chlorophyll and folpet, respectively; when inputting the desired target performance indicators as input3 = [1.23, 1.60]T, sensors can be constructed to detect both chlorophyll and folpet sensors. The structural parameters of the sensor to improve the specificity of chlorophyll detection were output1 = [13.0091, 8.1794, 9.5229, 2.6714]T, the structural parameters of the sensor to improve the specificity of folpet detection were output2 = [13.023, 8.6993, 10.7207, 3.8731]T, and the structural parameters of the sensor for the detection of chlorophyll and folpet at the same time were output3 = [12.6828, 8.0168, 9.1607, 2.3424]T. The absorption spectra of the three sensors are shown in Figure 13a,c,e.
The simulation results of the three sensors and the comparison with the target substance fingerprint peak characteristic frequencies are shown in Figure 13b,d,f. The results show that the sensor resonance peaks and the substance fingerprint peaks are nearly perfectly matched. The average RERs for the three sensors were 0.27%, 0.088%, and 0.20%, and the average MSE values were 1.4 × 10⁻⁵, 1.6 × 10⁻⁶, and 1.35 × 10⁻⁵, respectively.
The SC_ISSA-BPNN3 model trained in this study is not limited to designing metasurface sensors based on the aforementioned target substance fingerprint peaks. For instance, phenylalanine [52] has a fingerprint peak characteristic frequency at f5 = 1.17 THz, and 2,4-dichlorophenoxyacetic acid (2,4-d) [53] has a fingerprint peak characteristic frequency at f6 = 1.57 THz. The model can also be employed to design metasurface sensors tailored to simultaneously detect phenylalanine and 2,4-d, etc., as needed. The sensors and their absorption spectra, obtained using SC_ISSA-BPNN3, are shown in Figure 14, demonstrating the superior generalization ability of the trained neural network model and its promising application prospects.
As each substance has its unique fingerprint peak in the terahertz band, under normal circumstances, at most one fingerprint peak overlap occurs within the same system, and it is rare for two fingerprint peaks to overlap. If there is an overlap between two fingerprint peaks, this on-demand design method can be used to match the two resonance peaks of the metasurface sensor with the two fingerprint peaks of the target substance, thereby improving the specificity of the target object and increasing the likelihood of detecting it from a complex system. Additionally, this research significantly reduces production costs and enables multifunctional use of a single device, providing a technical foundation for the widespread application of terahertz devices in the agricultural sector.

4. Discussion

This paper presents an efficient and accurate method for on-demand design of terahertz metasurface sensors. Comparisons among eight algorithm models show that SC_ISSA-BPNN outperforms BPNN, ALO-BPNN, WOA-BPNN, CNN, DNN, RBFNN, and ENN in establishing the complex mapping between metasurface sensor structural parameters and performance indicators. At the fingerprint peaks of abscisic acid and gibberellic acid, the on-demand-designed metasurface sensors achieved high sensitivity. The mean MSE and mean RER of the metasurface sensor for detecting abscisic acid were 5.66 × 10⁻⁶ and 0.167%, respectively, and the metasurface sensor for detecting gibberellic acid was 8 × 10⁻⁷ and 0.086%, respectively. The metasurface sensor resonant peaks perfectly match the fingerprint peaks of the two substances, enabling specific detection, with high sensitivities of 156.7 GHz/RIU and 150.1 GHz/RIU, respectively, sufficient for trace detection. Three metasurface sensors were further designed that could improve the specificity of detecting chlorophyll and folpet, respectively, and that could detect both substances simultaneously. These three metasurface sensors have average MSE values of 1.4 × 10⁻⁵, 1.6 × 10⁻⁶, and 1.35 × 10⁻⁵, and average RER values of 0.27%, 0.088%, and 0.2%, respectively. To verify the model’s generalization ability, three additional metasurface sensors were designed for the specific detection of carbendazim and β-carotene, and for the simultaneous detection of phenylalanine and 2,4-D.
Manufacturing errors are inevitable, and such errors inevitably cause the resonant peak of the metasurface sensor to shift relative to the fingerprint peak of the target object being measured. Additionally, during actual detection, interference from non-target substances may occur, further causing the resonant peak of the metasurface sensor to shift relative to the fingerprint peak of the target substance. These factors all impact target detection, so it is essential to ensure high matching between the resonant peak of the metasurface sensor and the fingerprint peak of the target substance during the design phase. Even with disturbances, this matching ensures the resonant peak of the metasurface sensor aligns with the fingerprint peak of the target substance, thereby achieving the detection objective. In this study, the optimal algorithm model was used to design the metasurface sensor, and the MSE between its resonance frequency and the characteristic frequency of the target substance’s fingerprint peak was below the 10−5 level. Such a high degree of matching can minimize the impact of the aforementioned disturbances during the design phase.
The neural network model trained in this paper can be widely transplanted in the future to construct metasurface sensors for the detection of endogenous and exogenous plant molecules such as plant hormones, growth regulators, proteins, sugars, lipids, etc. The on-demand design method in this study can output the desired metasurface structure in seconds or minutes by using a well-trained neural network model as long as the fingerprint peaks of the substances are known, which can reduce a lot of computational cost, simulation optimization, and time, and can be used to build a large number of metasurface sensors for detecting various biochemical molecules related to agriculture in the future. This will provide more possibilities and guidance ideas for the wide application of terahertz devices in agriculture.

Supplementary Materials

The following supporting information can be downloaded at: https://www.mdpi.com/article/10.3390/agriculture15141481/s1. Sensitivity calculations were carried out on 1050 metasurface sensors covered with sample layers, obtaining the sensitivity dataset (Supporting Information for Publication (Table S1)). Comparison of target performance indicators with the predicted performance indicators by BPNN, WOA-BPNN, ALO-BPNN, SC_ISSA-BPNN, ENN, RBFNN, CNN, and DNN (Supporting Information for Publication (Table S2)). Detailed results of DFT calculation of abscisic acid and gibberellic acid; parameter setting of neural network structure; training process of SC_ISSA-BPNN (Supporting Information for Publication).

Author Contributions

Y.L. designed the study; Y.L., H.G., G.L. and H.L. performed the experiments; Y.L., H.G., G.L. and H.L. performed the terahertz time-domain spectrometer detection experiments; Y.L. processed the experimental data and the simulation data; Supervision Y.S. and Z.M.; Y.L. and H.G. wrote the paper. All authors have read and agreed to the published version of the manuscript.

Funding

This study was funded by the Key Technologies Research and Development Program of China (grant number 2022YFD2002302); A Project Funded by the Priority Academic Program Development of Jiangsu Higher Education Institutions (PAPD-2023-87).

Institutional Review Board Statement

Not applicable.

Data Availability Statement

All datasets generated during the course of this study are included in this paper.

Conflicts of Interest

The authors declare that they have no conflicts of interest.

Abbreviations

A1 is the maximum absorption at the first resonant peak; X1 is the resonance frequency of the first resonant peak; FWHM1 is the full width at half maximum of absorption at the first resonant peak; Q1 is the quality factor of the first resonant peak.
A2 is the maximum absorption at the second resonance peak; X2 is the resonance frequency of the second resonance peak, and FWHM2 is the full width at half maximum of absorption at the second resonance peak. Q2 is the quality factor of the second resonance peak.
XR is the resonant frequency of the resonant peak of the metasurface sensor; Xa is the characteristic frequency of the abscisic acid fingerprint peak; XG is the characteristic frequency of the gibberellic acid fingerprint peak; XC is the characteristic frequency of the carbendazim fingerprint peak; and Xβ is the characteristic frequency of the β-carotene fingerprint peak.
The fi is the characteristic frequency of the sample’s fingerprint peaks (samples were chlorophyll, folpet, phenylalanine, and 2,4-d).

References

  1. Yan, K.; Bian, T.; He, W.; Han, G.; Lv, M.; Guo, M.; Lu, M. Root Abscisic Acid Contributes to Defending Photoinibition in Jerusalem Artichoke (Helianthus tuberosus L.) under Salt Stress. Int. J. Mol. Sci. 2018, 19, 3934. [Google Scholar] [CrossRef]
  2. Yuan, J.; Zhang, T.; Hu, Y.; Bai, L.; Zhang, L.; Yang, J.; Zheng, Y.; Qin, Y.; Xu, Z.; Han, T.; et al. Effects of Plant Growth Regulators and Endogenous Phytohormone Profiles on the Rooting of Tissue Culture Raised Shoots of Persimmon (Diospyros Kaki Thunb.). Sci. Hortic. 2025, 339, 113917. [Google Scholar] [CrossRef]
  3. Zhao, X.; Wu, Y.; Qian, J.; Bian, G.; Zhang, X.; Su, B.; Tian, Y.; Huang, D. Investigation of Endogenous Phytohormones and Critical Flowering Genes during Flower Development in Iris Germanica. Sci. Hortic. 2024, 336, 113401. [Google Scholar] [CrossRef]
  4. Kamboj, A.; Sangha, M.K.; Devi, V.; Kumar, P.; Pathak, M.; Singla, D. Enhancing Germination and Growth in Wild Okra Genotypes through Gibberellic Acid Priming. Sci. Hortic. 2024, 334, 113332. [Google Scholar] [CrossRef]
  5. Pan, W.; Cheng, X.; Du, R.; Zhu, X.; Guo, W. Detection of Chlorophyll Content Based on Optical Properties of Maize Leaves. Spectrochim. Acta Part A 2024, 309, 123843. [Google Scholar] [CrossRef]
  6. Sun, H.; Zhang, X.; Zuo, W.; Dai, Z.; Zhou, L.; Luo, F.; Yang, M.; Wang, X.; Lou, Z.; Chen, Z. Concentrations, Generation and Risk Characterization of Phthalimide in Tea-Derived from Folpet or Not? Sci. Total Environ. 2022, 852, 158194. [Google Scholar] [CrossRef]
  7. Luo, Z.; Zhang, L.; Mou, Y.; Cui, S.; Gu, Z.; Yu, J.; Ma, X. Multi-Residue Analysis of Plant Growth Regulators and Pesticides in Traditional Chinese Medicines by High-Performance Liquid Chromatography Coupled with Tandem Mass Spectrometry. Anal. Bioanal. Chem. 2019, 411, 2447–2460. [Google Scholar] [CrossRef]
  8. Chen, Y.; Wu, X.; Li, Y.; Yang, Y.; Yang, D.; Yin, S.; Liu, L.; Sun, C. Simultaneous Determination of Seven Plant Growth Regulators in Melons and Fruits by Modified QuEChERS Coupled with Capillary Electrophoresis. Food Anal. Methods 2018, 11, 2788–2798. [Google Scholar] [CrossRef]
  9. Lee, D.G.; Lee, J.; Kim, K.-T.; Lee, S.-W.; Kim, Y.-O.; Cho, I.-H.; Kim, H.-J.; Park, C.-G.; Lee, S. High-Performance Liquid Chromatography Analysis of Phytosterols in Panax Ginseng Root Grown under Different Conditions. J. Ginseng Res. 2018, 42, 16–20. [Google Scholar] [CrossRef]
  10. Yazici, A.; Tiryaki, G.Y.; Ayvaz, H. Determination of Pesticide Residual Levels in Strawberry (Fragaria) by near-Infrared Spectroscopy. J. Sci. Food Agric. 2020, 100, 1980–1989. [Google Scholar] [CrossRef]
  11. Fan, H.; Smuts, J.; Walsh, P.; Harrison, D.; Schug, K.A. Gas Chromatography–Vacuum Ultraviolet Spectroscopy for Multiclass Pesticide Identification. J. Chromatogr. A 2015, 1389, 120–127. [Google Scholar] [CrossRef] [PubMed]
  12. Guo, Z.; Wang, M.; Wu, J.; Tao, F.; Chen, Q.; Wang, Q.; Ouyang, Q.; Shi, J.; Zou, X. Quantitative Assessment of Zearalenone in Maize Using Multivariate Algorithms Coupled to Raman Spectroscopy. Food Chem. 2019, 286, 282–288. [Google Scholar] [CrossRef]
  13. Jiang, H.; He, Y.; Xu, W.; Chen, Q. Quantitative Detection of Acid Value during Edible Oil Storage by Raman Spectroscopy: Comparison of the Optimization Effects of BOSS and VCPA Algorithms on the Characteristic Raman Spectra of Edible Oils. Food Anal. Methods 2021, 14, 1826–1835. [Google Scholar] [CrossRef]
  14. Li, H.; Haruna, S.A.; Wang, Y.; Mehedi Hassan, M.; Geng, W.; Wu, X.; Zuo, M.; Ouyang, Q.; Chen, Q. Simultaneous Quantification of Deoxymyoglobin and Oxymyoglobin in Pork by Raman Spectroscopy Coupled with Multivariate Calibration. Food Chem. 2022, 372, 131146. [Google Scholar] [CrossRef]
  15. Sun, Y.; Tang, H.; Zou, X.; Meng, G.; Wu, N. Raman Spectroscopy for Food Quality Assurance and Safety Monitoring: A Review. Curr. Opin. Food Sci. 2022, 47, 100910. [Google Scholar] [CrossRef]
  16. Auner, G.W.; Koya, S.K.; Huang, C.; Broadbent, B.; Trexler, M.; Auner, Z.; Elias, A.; Mehne, K.C.; Brusatori, M.A. Applications of Raman Spectroscopy in Cancer Diagnosis. Cancer Metastasis Rev. 2018, 37, 691–717. [Google Scholar] [CrossRef]
  17. Fakhlaei, R.; Babadi, A.A.; Sun, C.; Ariffin, N.M.; Khatib, A.; Selamat, J.; Xiaobo, Z. Application, Challenges and Future Prospects of Recent Nondestructive Techniques Based on the Electromagnetic Spectrum in Food Quality and Safety. Food Chem. 2024, 441, 138402. [Google Scholar] [CrossRef] [PubMed]
  18. Mao, H.; Du, X.; Yan, Y.; Zhang, X.; Ma, G.; Wang, Y.; Liu, Y.; Wang, B.; Yang, X.; Shi, Q. Highly Sensitive Detection of Daminozide Using Terahertz Metamaterial Sensors. Int. J. Agric. Biol. Eng. 2022, 15, 180–188. [Google Scholar] [CrossRef]
  19. Lu, Y.; Asante, E.A.; Duan, H.; Hu, Y. Quantitative Assessment of Cold Injury in Tea Plants by Terahertz Spectroscopy Method. Agronomy 2023, 13, 1376. [Google Scholar] [CrossRef]
  20. Tong, Y.; Wang, S.; Han, K.; Song, X.; Zhang, W.; Ye, Y.; Ren, X. Development of a Novel Metal Grating and Its Applications of Terahertz Spectroscopic Detection of CuSO4 in Fruit. Food Anal. Methods 2021, 14, 1590–1599. [Google Scholar] [CrossRef]
  21. Yan, Z.; Zhu, L.-G.; Meng, K.; Huang, W.; Shi, Q. THz Medical Imaging: From in Vitro to in Vivo. Trends Biotechnol. 2022, 40, 816–830. [Google Scholar] [CrossRef] [PubMed]
  22. Baek, S.H.; Kang, J.H.; Hwang, Y.H.; Ok, K.M.; Kwak, K.; Chun, H.S. Detection of Methomyl, a Carbamate Insecticide, in Food Matrices Using Terahertz Time-Domain Spectroscopy. J. Infrared Millim. Terahertz Waves 2016, 37, 486–497. [Google Scholar] [CrossRef]
  23. Fu, X.; Liu, Y.; Chen, Q.; Fu, Y.; Cui, T.J. Applications of Terahertz Spectroscopy in the Detection and Recognition of Substances. Front. Phys. 2022, 10, 869537. [Google Scholar] [CrossRef]
  24. Zhang, Z.; Wang, Z.; Zhang, C.; Yao, Z.; Zhang, S.; Wang, R.; Tian, Z.; Han, J.; Chang, C.; Lou, J.; et al. Advanced Terahertz Refractive Sensing and Fingerprint Recognition through Metasurface-Excited Surface Waves. Adv. Mater. 2024, 36, 2308453. [Google Scholar] [CrossRef]
  25. Lyu, J.; Shen, S.; Chen, L.; Zhu, Y.; Zhuang, S. Frequency Selective Fingerprint Sensor: The Terahertz Unity Platform for Broadband Chiral Enantiomers Multiplexed Signals and Narrowband Molecular AIT Enhancement. Photonix 2023, 4, 28. [Google Scholar] [CrossRef]
  26. Ma, S.; Zhang, Y.; Li, Z.; Wang, Z.; Liang, L.; Yan, X.; Yao, H.; Hu, X.; Wu, G.; Huai, F.; et al. Specific Recognition of L-Threonine by a Terahertz Metasurfaces Biosensor Based on Fingerprint Peaks. Opt. Express 2024, 32, 34764. [Google Scholar] [CrossRef] [PubMed]
  27. Zhao, R.; Ye, Y.; Dai, Z.; Mu, T.; Ren, X. Research on Specific Identification Method of Substances through Terahertz Metamaterial Sensors. Results Phys. 2022, 43, 106055. [Google Scholar] [CrossRef]
  28. Han, B.; Han, Z.; Qin, J.; Wang, Y.; Zhao, Z. A Sensitive and Selective Terahertz Sensor for the Fingerprint Detection of Lactose. Talanta 2019, 192, 1–5. [Google Scholar] [CrossRef]
  29. Zhao, Q.; Liang, Y.; Lv, Y.; Li, X. Design of Terahertz Metasurface Structures for Biosensing Applications Based on Deep Learning Methods. Results Phys. 2024, 61, 107804. [Google Scholar] [CrossRef]
  30. Hu, Y.; Xiong, Y.; Tian, P.; Zhou, X.; Sun, Q. On-Demand Design of Dual-Band Electromagnetically Induced Transparency Metamaterials Based on Improved Convolutional Neural Network. Opt. Commun. 2024, 566, 130689. [Google Scholar] [CrossRef]
  31. Son, H.; Kim, S.-J.; Hong, J.; Sung, J.; Lee, B. Design of Highly Perceptible Dual-Resonance All-Dielectric Metasurface Colorimetric Sensor via Deep Neural Networks. Sci. Rep. 2022, 12, 8512. [Google Scholar] [CrossRef]
  32. Dorney, T.D.; Baraniuk, R.G.; Mittleman, D.M. Material Parameter Estimation with Terahertz Time-Domain Spectroscopy. J. Opt. Soc. Am. A 2001, 18, 1562–1571. [Google Scholar] [CrossRef]
  33. Duvillaret, L.; Garet, F.; Coutaz, J.-L. A Reliable Method for Extraction of Material Parameters in Terahertz Time-Domain Spectroscopy. IEEE J. Sel. Top. Quantum Electron. 1996, 2, 739–746. [Google Scholar] [CrossRef]
  34. Du, X.; Wang, Y.; Zhang, X.; Ma, G.; Liu, Y.; Wang, B.; Mao, H. A Study of Plant Growth Regulators Detection Based on Terahertz Time-Domain Spectroscopy and Density Functional Theory. RSC Adv. 2021, 11, 28898–28907. [Google Scholar] [CrossRef]
  35. Chen, T.; Zhang, Q.; Li, Z.; Hu, F. Intermolecular Weak Interactions of Crystalline Purine and Uric Acid Investigated by Terahertz Spectroscopy and Theoretical Calculation. J. Lumin. 2020, 223, 117198. [Google Scholar] [CrossRef]
  36. Qu, F.; Lin, L.; He, Y.; Nie, P.; Cai, C.; Dong, T.; Pan, Y.; Tang, Y.; Luo, S. Spectral Characterization and Molecular Dynamics Simulation of Pesticides Based on Terahertz Time-Domain Spectra Analyses and Density Functional Theory (DFT) Calculations. Molecules 2018, 23, 1607. [Google Scholar] [CrossRef] [PubMed]
  37. Mirjalili, S.; Lewis, A. The Whale Optimization Algorithm. Adv. Eng. Softw. 2016, 95, 51–67. [Google Scholar] [CrossRef]
  38. Sharifi, M.R.; Akbarifard, S.; Madadi, M.R.; Qaderi, K.; Akbarifard, H. Optimization of Hydropower Energy Generation by 14 Robust Evolutionary Algorithms. Sci. Rep. 2022, 12, 7739. [Google Scholar] [CrossRef]
  39. Jiang, G.; Luo, M.; Bai, K.; Chen, S. A Precise Positioning Method for a Puncture Robot Based on a PSO-Optimized BP Neural Network Algorithm. Appl. Sci. 2017, 7, 969. [Google Scholar] [CrossRef]
  40. Anushkannan, N.K.; Wekalao, J.; Patel, S.K.; Al-Zahrani, F.A. Design of Encoded and Tunable Graphene-Gold Metasurface-Based Surface Plasmon Resonance Sensors for Glucose Detection in the Terahertz Regime. Plasmonics 2024, 19, 2827–2846. [Google Scholar] [CrossRef]
  41. Jadeja, R.; Surve, J.; Parmar, T.; Patel, S.K.; Al-Zahrani, F.A. Detection of Peptides Employing a THz Metasurface Based Sensor. Diam. Relat. Mater. 2023, 132, 109675. [Google Scholar] [CrossRef]
  42. Xu, J.; Liao, D.; Gupta, M.; Zhu, Y.; Zhuang, S.; Singh, R.; Chen, L. Terahertz Microfluidic Sensing with Dual-Torus Toroidal Metasurfaces. Adv. Opt. Mater. 2021, 9, 2100024. [Google Scholar] [CrossRef]
  43. Gupta, M.; Singh, R. Terahertz Sensing with Optimized Q/Veff Metasurface Cavities. Adv. Opt. Mater. 2020, 8, 1902025. [Google Scholar] [CrossRef]
  44. Liu, X.; Liu, G.; Qin, J. Feasibility of Using Terahertz Toroidal Metasurface Sensor for Detection and Quantification of Chlorothalonil in Water. IEEE Sens. J. 2023, 23, 30360–30367. [Google Scholar] [CrossRef]
  45. Aptamer HB5 Modified Terahertz Metasurface Biosensor Used for Specific Detection of HER2. Sens. Actuators B 2022, 355, 131337. [CrossRef]
  46. Tang, X.; Jia, H.; Li, L.; Li, M.; Wu, D.; Zhou, K.; Li, P.; Wang, W.; Li, J.; Yang, D. Hollow-Structured All-Silicon Terahertz Metasurface Supporting Quasi-Bound States in the Continuum for Refractive Index Based Auramine O Concentration Sensing. Photonics Res. 2024, 12, 1574. [Google Scholar] [CrossRef]
  47. Zhong, Y.; Du, L.; Liu, Q.; Zhu, L.; Meng, K.; Zou, Y.; Zhang, B. Ultrasensitive Specific Sensor Based on All-Dielectric Metasurfaces in the Terahertz Range. RSC Adv. 2020, 10, 33018–33025. [Google Scholar] [CrossRef]
  48. Yan, W.; Ma, M.; Dai, Z.; Gu, Y.; Zhu, H.; Liu, Y.; Xu, X.; Han, S.; Peng, Y. Experimental and theoretical study on terahertz spectra of all-trans β-carotene. Acta Phys. Sin. 2017, 66, 322–328. [Google Scholar] [CrossRef]
  49. Wang, X.; Wang, Q. Study on Terahertz Spectra of Benzimidazole Molecular. In Proceedings of the 2011 Chinese Control and Decision Conference (CCDC), Mianyang, China, 23–25 May 2011; pp. 2828–2832. [Google Scholar]
  50. Wang, X.; Wang, Q. The Vibrational Spectra of Bactericide Molecules: Terahertz Spectroscopy and Density Functional Theory Calculations. J. Phys. Conf. Ser. 2011, 276, 12224. [Google Scholar] [CrossRef]
  51. Liu, Y.; Liu, Y.; Xu, X.; Yan, W.; Ma, M.; Zhu, H.; Ma, C.; Zou, R.; Ding, L.; Luo, M. Morphologies, compositions and spectrum features of palm leaves. Acta Phys. Sin. 2015, 64, 390–397. [Google Scholar] [CrossRef]
  52. Xie, M.; Jiang, L.; Che, T.; He, J. Application of terahertz technology in detecting protein organic compounds. J. Lanzhou Univ. (Med. Sci.) 2018, 44, 70–75. [Google Scholar] [CrossRef]
  53. Qu, F.; Lin, L.; Cai, C.; Dong, T.; He, Y.; Nie, P. Molecular Characterization and Theoretical Calculation of Plant Growth Regulators Based on Terahertz Time-Domain Spectroscopy. Appl. Sci. 2018, 8, 420. [Google Scholar] [CrossRef]
Figure 1. (a) Samples prepared by the tableting method. (b) Terahertz time-domain spectrometer.
Agriculture 15 01481 g001
Figure 2. (a) Abscisic acid. (b) Gibberellic acid.
Agriculture 15 01481 g002
Figure 3. Overall design concept diagram.
Agriculture 15 01481 g003
Figure 4. (a) Top view of the metasurface sensor. (b) Front view of the metasurface sensor. (c) Schematic of periodic structure. (d) Schematic of parameters of resonance characteristics.
Agriculture 15 01481 g004
Figure 5. (a) First resonance peaks of absorption spectra at various refractive indices. (b) Second resonance peaks of absorption spectra at various refractive indices.
Agriculture 15 01481 g005
Figure 6. (a) Experimental fingerprint spectra of abscisic acid. (b) Experimental fingerprint spectra of gibberellic acid.
Agriculture 15 01481 g006
Figure 7. (a) Comparison of actual and predicted spectrograms for Structure 1. (b) Comparison of actual and predicted spectrograms for Structure 2. (c) Comparison of average RERs when BPNN, WOA-BPNN, ALO-BPNN, and SC_ISSA-BPNN predicted Structure 1 and Structure 2. (d) Comparison results of MSEs when BPNN, WOA-BPNN, ALO-BPNN, and SC_ISSA-BPNN predicted Structure 1 and Structure 2.
Agriculture 15 01481 g007
Figure 8. (a) Comparison of the comprehensive average RERs when BPNN, WOA-BPNN, ALO-BPNN, and SC_ISSA-BPNN predicted for Structure 1 and Structure 2. (b) Comparison of combined the comprehensive average MSEs when BPNN, WOA-BPNN, ALO-BPNN, and SC_ISSA-BPNN predicted for Structure 1 and Structure 2. (c) Comparison of the comprehensive average RERs of SC_ISSA-BPNN, CNN, DNN, ENN, and RBFNN when predicting structures 1 and 2. (d) Comparison of the average MSEs of SC_ISSA-BPNN, CNN, DNN, ENN, and RBFNN when predicting structures 1 and 2.
Agriculture 15 01481 g008
Figure 9. (a) Pearson correlation analysis between 3 resonant characteristic parameters and 2 sensing performance indicators for the first resonant peak. (b) Pearson correlation analysis between 3 resonant characteristic parameters and 2 sensing performance indicators for the second resonant peak.
Agriculture 15 01481 g009
Figure 10. (a) Absorption spectrum of metasurface sensor for detecting abscisic acid. (b) Comparison of simulated spectra and target fingerprint peak characteristic frequency.
Agriculture 15 01481 g010
Figure 11. (a) Absorption spectrum of metasurface sensor for detecting gibberellic acid. (b) Comparison of simulated spectra and target fingerprint peak characteristic frequency.
Agriculture 15 01481 g011
Figure 12. (a) Absorption spectrum of metasurface sensor for detecting carbendazim. (b) Absorption spectrum of metasurface sensor for detecting β-carotene.
Agriculture 15 01481 g012
Figure 13. (a) Absorption spectrum of metasurface sensor for detecting the chlorophyll. (b) Comparison of chlorophyll fingerprint peaks and metasurface sensor resonance peaks. (c) Absorption spectrum of metasurface sensor for detecting the folpet. (d) Comparison of folpet fingerprint peak and metasurface sensor resonance peaks. (e) Absorption spectrum of metasurface sensor for simultaneously detecting chlorophyll and folpet. (f) Comparison of chlorophyll and folpet fingerprint peaks and metasurface sensor resonance peaks.
Agriculture 15 01481 g013
Figure 14. Absorption spectrum of metasurface sensor for simultaneously detecting phenylalanine and 2,4-d.
Agriculture 15 01481 g014
Table 1. Structural parameter sweeping range.
Geometric ParameterMin (um)Max (um)Step
a11.013.450.35
b6.010.00.8
c8.011.00.5
k1.54.00.5
Table 2. Vibration mode assignment of fingerprint peaks of abscisic acid and gibberellic acid.
SpecimenExperimental (THz)Theory (THz)Main Vibration Modes
Abscisic acid1.071.06T: C9C10C11C13
1.3861.489O: C6C2C4C3
1.7061.722T: C3C2C1O14, B: C5C7C9
Gibberellic acid0.9550.88T: C11C6C15C16, B: C5C4C6
1.396--
1.6131.61T: O1C2C4C5
Note: B: bond angle bending; T: dihedral angle twisting; O: angle between vector and plane.
Table 3. Comparison of sensor sensitivity with available metasurface sensors.
RefStructuref0 (THz)S (GHz/RIU)Minimum Detection Limit
[42]double ring configuration0.55124.3-
[43]“i” shape0.618-
[44]ring configuration0.741410.001 mg/L
[45]“smiley face” structure0.8511080.1 ng/mL
[46]hollow structure0.331201 mg/mL
[47]“zigzag” construction0.968776.7 ug/cm2
Table 4. Fingerprint peak information of chlorophyll and folpet.
CategoryFingerprint Peak Characteristic Frequency 1 (THz)Fingerprint Peak Characteristic Frequency 2 (THz)
Chlorophyllf1 = 1.23f2 = 1.59
Folpetf3 = 1.277f4 = 1.60
Disclaimer/Publisher’s Note: The statements, opinions and data contained in all publications are solely those of the individual author(s) and contributor(s) and not of MDPI and/or the editor(s). MDPI and/or the editor(s) disclaim responsibility for any injury to people or property resulting from any ideas, methods, instructions or products referred to in the content.

