Article

Crushing Modeling and Crushing Characterization of Silage Caragana korshinskii Kom.

College of Mechanical and Electrical Engineering, Inner Mongolia Agricultural University, Hohhot 010018, China
*
Author to whom correspondence should be addressed.
Agriculture 2025, 15(13), 1449; https://doi.org/10.3390/agriculture15131449
Submission received: 20 May 2025 / Revised: 26 June 2025 / Accepted: 3 July 2025 / Published: 5 July 2025
(This article belongs to the Section Agricultural Technology)

Abstract

Caragana korshinskii Kom. (CKB), widely cultivated in Inner Mongolia, China, has potential for silage feed development due to its favorable nutritional characteristics, including a crude protein content of 14.2% and a neutral detergent fiber content below 55%. However, its vascular bundle fiber structure limits the efficiency of lactic acid conversion and negatively impacts silage quality, which can be improved through mechanical crushing. Currently, conventional crushing equipment generally suffers from uneven particle size distribution, high energy consumption, and low processing efficiency. In this study, a layered aggregate model was constructed using the discrete element method (DEM), and the Hertz–Mindlin with Bonding contact model was employed to characterize the heterogeneous mechanical properties between the epidermis and the core. Model accuracy was enhanced through reverse engineering and a multi-particle-size filling strategy. Key parameters were optimized via a Box–Behnken experimental design, with a core normal stiffness of 7.37 × 10¹¹ N·m−1, a core shear stiffness of 9.46 × 10¹⁰ N·m−1, a core shear stress of 2.52 × 10⁸ Pa, and a skin normal stiffness of 4.01 × 10⁹ N·m−1. The simulated values for bending, tensile, and compressive failure forces had relative errors of less than 10% compared to experimental results. The results showed that rectangular hammers, due to their larger contact area and more uniform stress distribution, reduced the number of residual bonded contacts by 28.9% and 26.5% compared to stepped and blade-type hammers, respectively. Optimized rotational speed improved dynamic crushing efficiency by 41.3%. The material exhibited spatial heterogeneity, with the mass proportion in the tooth plate impact area reaching 43.91%, which was 23.01% higher than that in the primary hammer crushing area. The relative error between the simulation and bench test results for the crushing rate was 6.18%, and the spatial distribution consistency reached 93.6%, verifying the reliability of the DEM parameter calibration method. This study provides a theoretical basis for the structural optimization of crushing equipment, suppression of circulation layer effects, and the realization of low-energy, high-efficiency processing.

1. Introduction

Caragana korshinskii Kom. (CKB), widely cultivated in Inner Mongolia, China, has a total planting area of 875 million acres [1]. Its nutritional characteristics, including a crude protein content of 14.2% and a neutral detergent fiber (NDF) content below 55%, suggest that it can be used as a high-quality silage feed material [2]. However, the vascular bundle fiber structure of CKB reduces the efficiency of lactic acid conversion during silage fermentation, thereby affecting the quality of silage feed. Previous studies have shown that appropriate grinding treatment can shorten fiber length and increase specific surface area, thereby significantly improving the quality of silage feed [3]. However, current grinding equipment still faces issues such as uneven particle size distribution, high energy consumption, and low processing efficiency [4], and further optimization is needed. To further optimize the crushing process, it is essential to first accurately characterize the complex dynamic behavior during crushing. However, traditional testing methods struggle to effectively capture the true dynamic properties of materials under conditions such as high-speed airflow transportation and multi-form collision fragmentation. Therefore, there is an urgent need to establish a numerical simulation model for dynamic crushing to accurately reveal the movement patterns of materials and the crushing mechanism and systematically analyze the influence mechanisms of structural parameters and operating conditions on energy efficiency.
With the improvement of numerical simulation technology, the discrete element method (DEM) has been promoted in crushing processing and agricultural machinery [5,6,7] and has been widely used in the simulation of plant stalk crushing, such as cotton stalks [8,9], corn stalks [10], and rice stalks [11,12]. Current stalk crushing simulation models can generally be categorized into rigid-body models and flexible, crushable models. Rigid-body models based on the Hertz–Mindlin (no slip) contact formulation [13] are capable of capturing the overall kinematic behavior of stalks but fail to simulate the crushing process itself due to the absence of material failure mechanisms [14]. In contrast, crushable models employing the Hertz–Mindlin with Bonding contact model [15,16] allow for fracture simulation; however, their underlying homogenization assumption overlooks the distinct mechanical differences between the epidermis (highly lignified thick-walled tissue) and the inner core (thin-walled pith). This simplification limits the model’s ability to reproduce critical behaviors such as interfacial delamination in heterogeneous materials during crushing, thereby compromising the physical fidelity and predictive accuracy of the simulation. Xu et al. [17] carried out a numerical simulation study on the crushing process of cucumber straw by using EDEM and observed the effect of changing the number of hammers, hammer thickness, and hammer screen gap on the crushing efficiency. Hu et al. [18] quantitatively analyzed the flow of material particles in the operation of a hammer mill and explored the influence of the spindle speed on the crushing efficiency. Shi et al. [19] used the discrete element method (DEM) to establish a three-dimensional numerical simulation model of a multi-functional straw crusher for crushing straw, simulating the straw crushing process. The results indicate that the rotational speed of the crushing shaft is a key factor influencing the uniformity of straw crushing. As the shaft speed increases, the straw undergoes more intense impact within the machine chamber, while also improving the balance of the number of impacts and force distribution exerted by the blades on the straw. This results in a more uniform and consistent particle size distribution of the crushed straw material.
In this paper, taking flat stubble CKB as the research object, a discrete element model of layered aggregates based on the Hertz–Mindlin with Bonding contact model is proposed for the difference in mechanical properties between its skin and inner core. And the model parameters were calibrated and verified by bending, tensile, compression, and bench tests. Based on the model, the effects of different rotational speeds and hammer configurations on the crushing efficiency and material distribution were analyzed, which provided a theoretical basis for further structural optimization of the crushing device and the breaking of the annular layer.

2. Materials and Methods

2.1. Test Materials

In this study, the CKB planting area in Helinger County, Hohhot City, Inner Mongolia (geographic coordinates: 40°9′36″ N, 111°48′00″ E), which belongs to the mid-temperate continental climate zone and is one of the main production areas of CKB crops in China, was selected as the test site. CKB plants with a growth period of 3–4 years were used as test samples. The test used a standard five-point sampling method, with five 10 m2 sample plots set up at the geometric center and four corners of the rectangular test plot. The center sample plot was sampled in its entirety, while the four corner sample plots were sampled using the diagonal method to select representative plants. Actual measurements showed that the natural height of the plants was 2–2.5 m. During the sampling process, the stalks were segmented: from the base (near ground level) to the tip, they were divided into the tail part, the middle part, and the tip part according to their morphological characteristics, with the diameter of each segment decreasing in a gradient. To maintain the integrity of the samples, lateral branches were removed immediately after sampling and transported in sealed polythene bags to prevent moisture loss.
The cross-sectional anatomical structure of CKB stems reveals their layered structure: epidermis, phloem, xylem, and pith. It is the significant difference in lignification between the epidermis and pith that leads to their markedly different biomechanical properties. Drawing on previous modeling methods for rapeseed stems and ramie stems [20,21], this study similarly simplifies the stem structure into two functional complexes: an epidermis complex combining the green layer and phloem and an inner core complex comprising the xylem and pith. These two complexes will be used, respectively, for subsequent discrete element modeling and mechanical performance testing studies.
In order to guarantee the reliability of the data, the moisture content was tested immediately after sampling using a rapid moisture tester, and all mechanical tests were completed within 48 h of sampling. During this period, the samples were stored in a temperature-controlled, humidity-controlled chamber to maintain their initial moisture content. The average moisture content of the samples was measured to be 50.64%. Based on the measured data of the physical samples, the average diameter was 8.00 ± 0.76 mm, so the diameter parameter in the discrete element model was set to 8 mm. The results of the material density measurements showed that the density of the epidermal tissue was 1147.32 kg/m3, and the density of the inner core tissue was 984.69 kg/m3 (Figure 1).

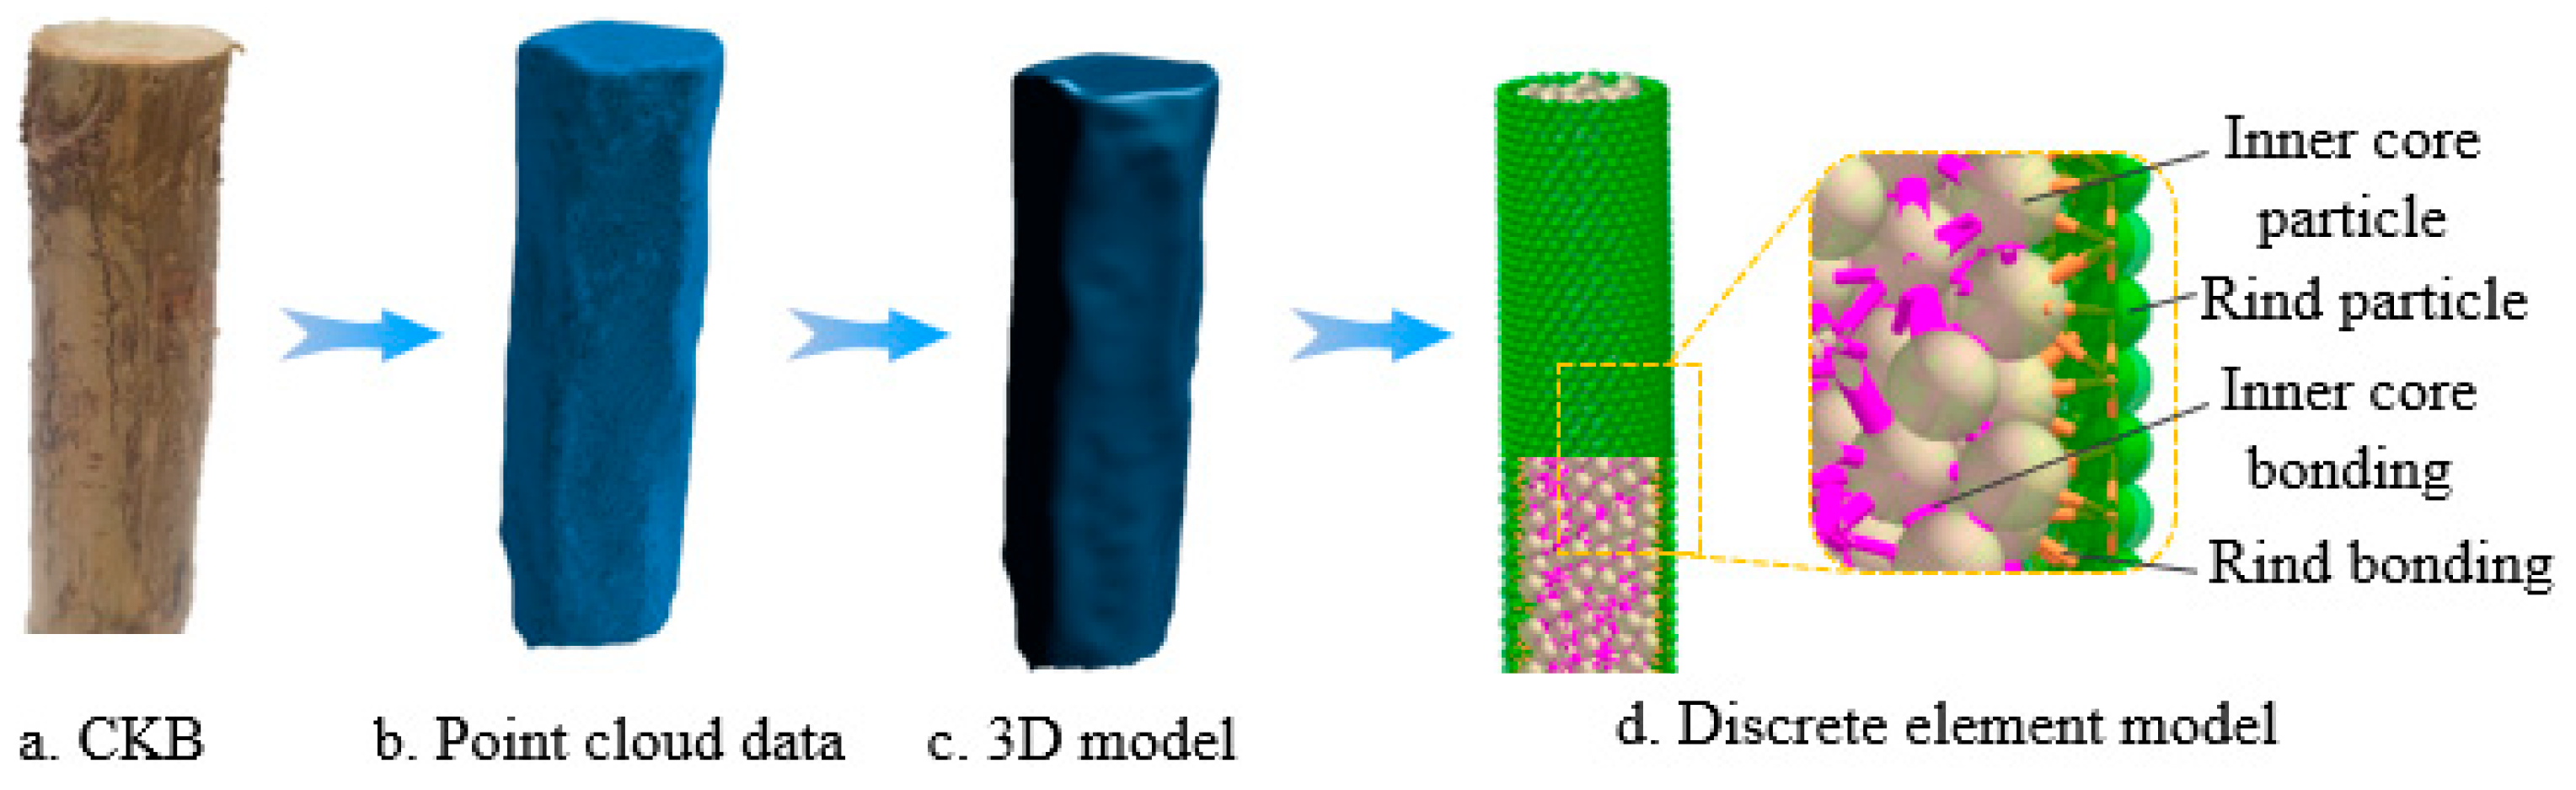
2.2. Model Construction Based on Reverse Engineering

In order to overcome the limitations of traditional modeling methods in portraying the complex 3D features of CKB, this study adopted the reverse engineering technique [20] to construct a high-precision 3D model of CKB to enhance the realism and accuracy of the simulation test. As shown in Figure 2a, a CKB sample with a diameter close to the average value was selected in this study and scanned on its all-round surface with the help of a high-precision 3D laser scanner (SHINING3D-FreeScan EP, Hangzhou, China) to achieve high-precision digital conversion. As shown in Figure 2b, the scanned data are presented in the form of a point cloud and processed with noise removal and edge sharpening to ensure the fine representation of the model. The surface mesh structure and solid kernel were parameterized using SolidWorks 2024 software (Dassault Systèmes America, Waltham, MA, USA), as shown in Figure 2c, and the optimized 3D model STL file was finally imported into the EDEM 2022 software. To more accurately simulate the complexity of the epidermal and inner core structures in CKB stems, we employed a patch-based multi-diameter particle filling method (as shown in Figure 2d), with inner core particles having a diameter of 1 mm and epidermal particles having a diameter of 0.5 mm. During the modeling process, the CKB structure was divided into epidermal and inner core regions along the normal direction. During the filling process, the position and orientation of each layer of particles were randomly distributed to better reproduce the natural randomness and anisotropy of plant tissue. In the EDEM software, we set the density values and connected them using the Hertz–Mindlin with Bonding contact model, ensuring that various mechanical responses such as shear force, normal pressure, and bending moment could be transmitted during loading. This strategy balances pore volume control with structural authenticity and computational feasibility, with particle interactions accurately reflecting the mechanical behavior within the stem.

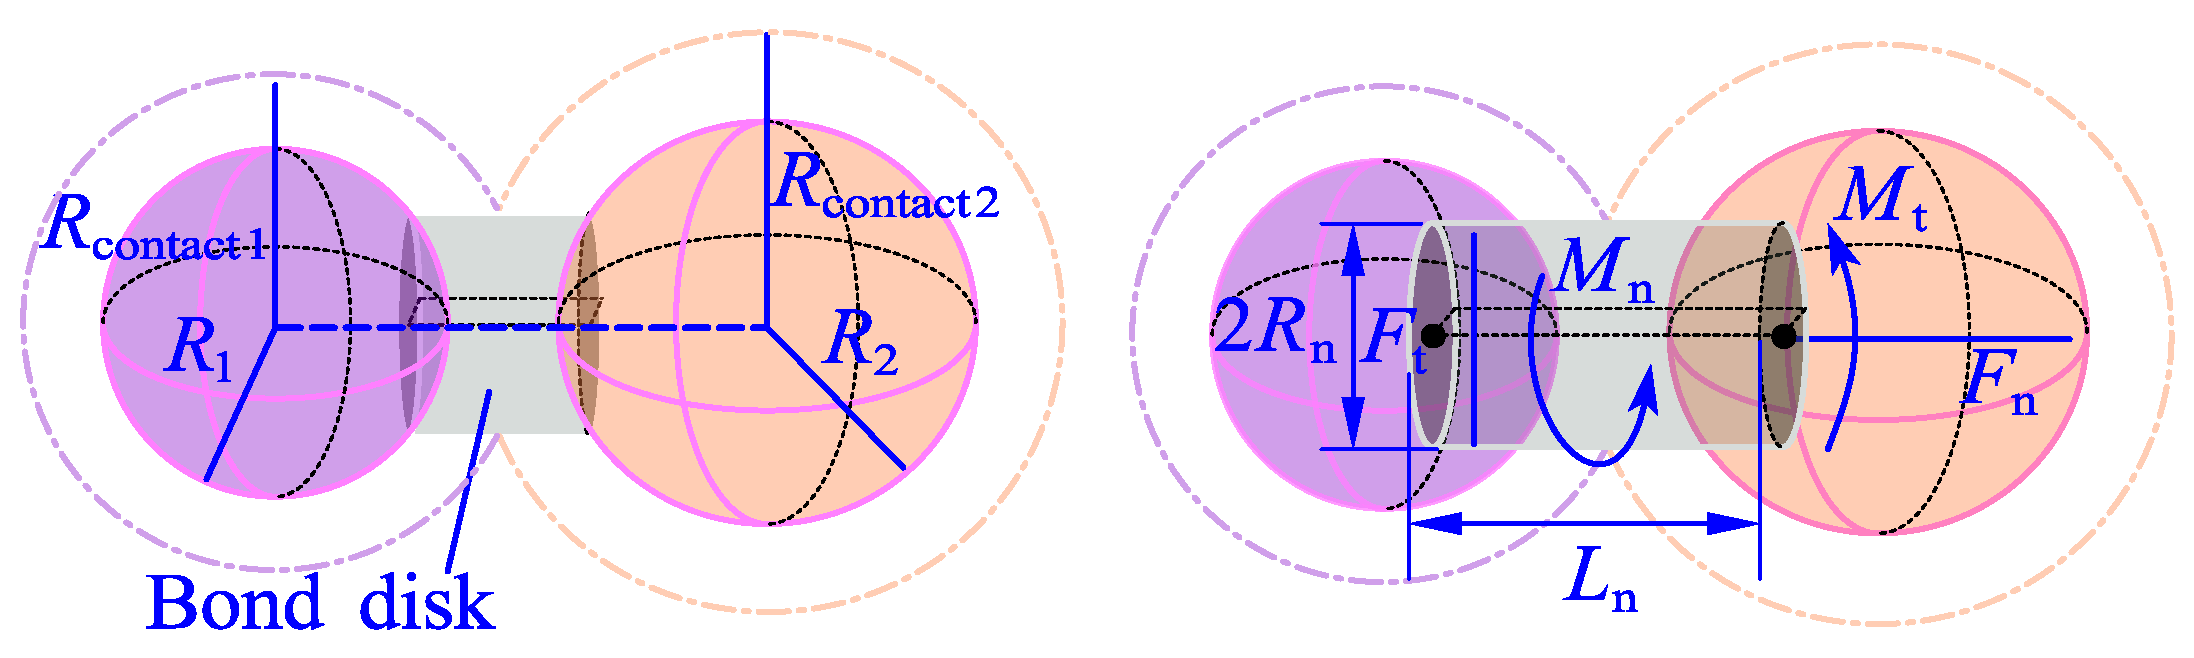
2.3. Bonding Model Destruction Criteria

During the machining process, cutting, impacting, and crushing of CKB can cause significant damage to their internal coarse fiber structure and bonding pattern. In order to accurately simulate this damage, the Hertz–Mindlin with Bonding (i.e., BPM, bonded particle model) bonded contact model in discrete elemental modeling was used, which has shown excellent applicability. Studies have been conducted to model ramie, maize, and rapeseed shoot stalks [21,22,23], and a two-layer mechanical bonding model was constructed, which was successfully applied to the simulation and analysis of cutting, crushing, and harvesting processes. As shown in Figure 3, the model determines bonding formation based on particle-to-particle contact: when the distance between the centers of two particles is less than the sum of their contact radii, a bonding bond is triggered [24]. The formed bonding bond can simultaneously withstand shear force, normal tensile/compressive force, and bending moment; when the stress or strain in any direction reaches the critical threshold, the bond fails and fractures. In the contact area, “bonds” are automatically generated, which can simultaneously withstand normal forces, tangential forces, bending moments, and torques until they exceed their ultimate strength and break. Based on the physical testing methods used by previous researchers to model the research object, the shear behavior in this model is determined by the tangential strength and tangential stiffness of the adhesive bonds. As shown in Equations (1)–(4), the bond radius factor (λ) is a dimensionless parameter used to define an expanded “bond” range when calculating interparticle contact forces. When calculating the contact force between particles 1 and 2, the effective range RB is set to λ·min (R1, R2). It is important to note that once a bond is broken, the system does not re-establish new bonds. This feature enables the model to accurately capture the damage evolution patterns of CKB during mechanical processing.
δ F n = ν n S n A δ t δ F t = ν t S t A δ t   δ M n = ω n S t J δ t δ M t = ω t S n J 2 δ t
σ max < F n A + 2 M t J R B τ max < F t A + M n J R B
A = π R B 2 J = 1 2 π R B 4
R B = λ min ( R 1 , R 2 )
In these equations, δFn is the individual time-step normal force, N; δFt is the individual time-step shear force, N; δMn is the individual time-step normal moment, N·m−1; δMt is the individual time-step shear moment, N·m−1; vn is the normal velocity, m/s; vt is the shear velocity, m/s; ωn is the normal angular velocity, rad/s; ωt is the shear angular velocity, rad/s; Sn is the normal stiffness per unit area, N·m−1; St is shear stiffness per unit area, N·m−1; δt is the time step, s; J is the moment of inertia, m4; σmax is the critical normal stress, Pa; τmax is the critical shear stress, Pa; A is the bond cross-sectional area, mm2; and λ is the coefficient of bonding radius.

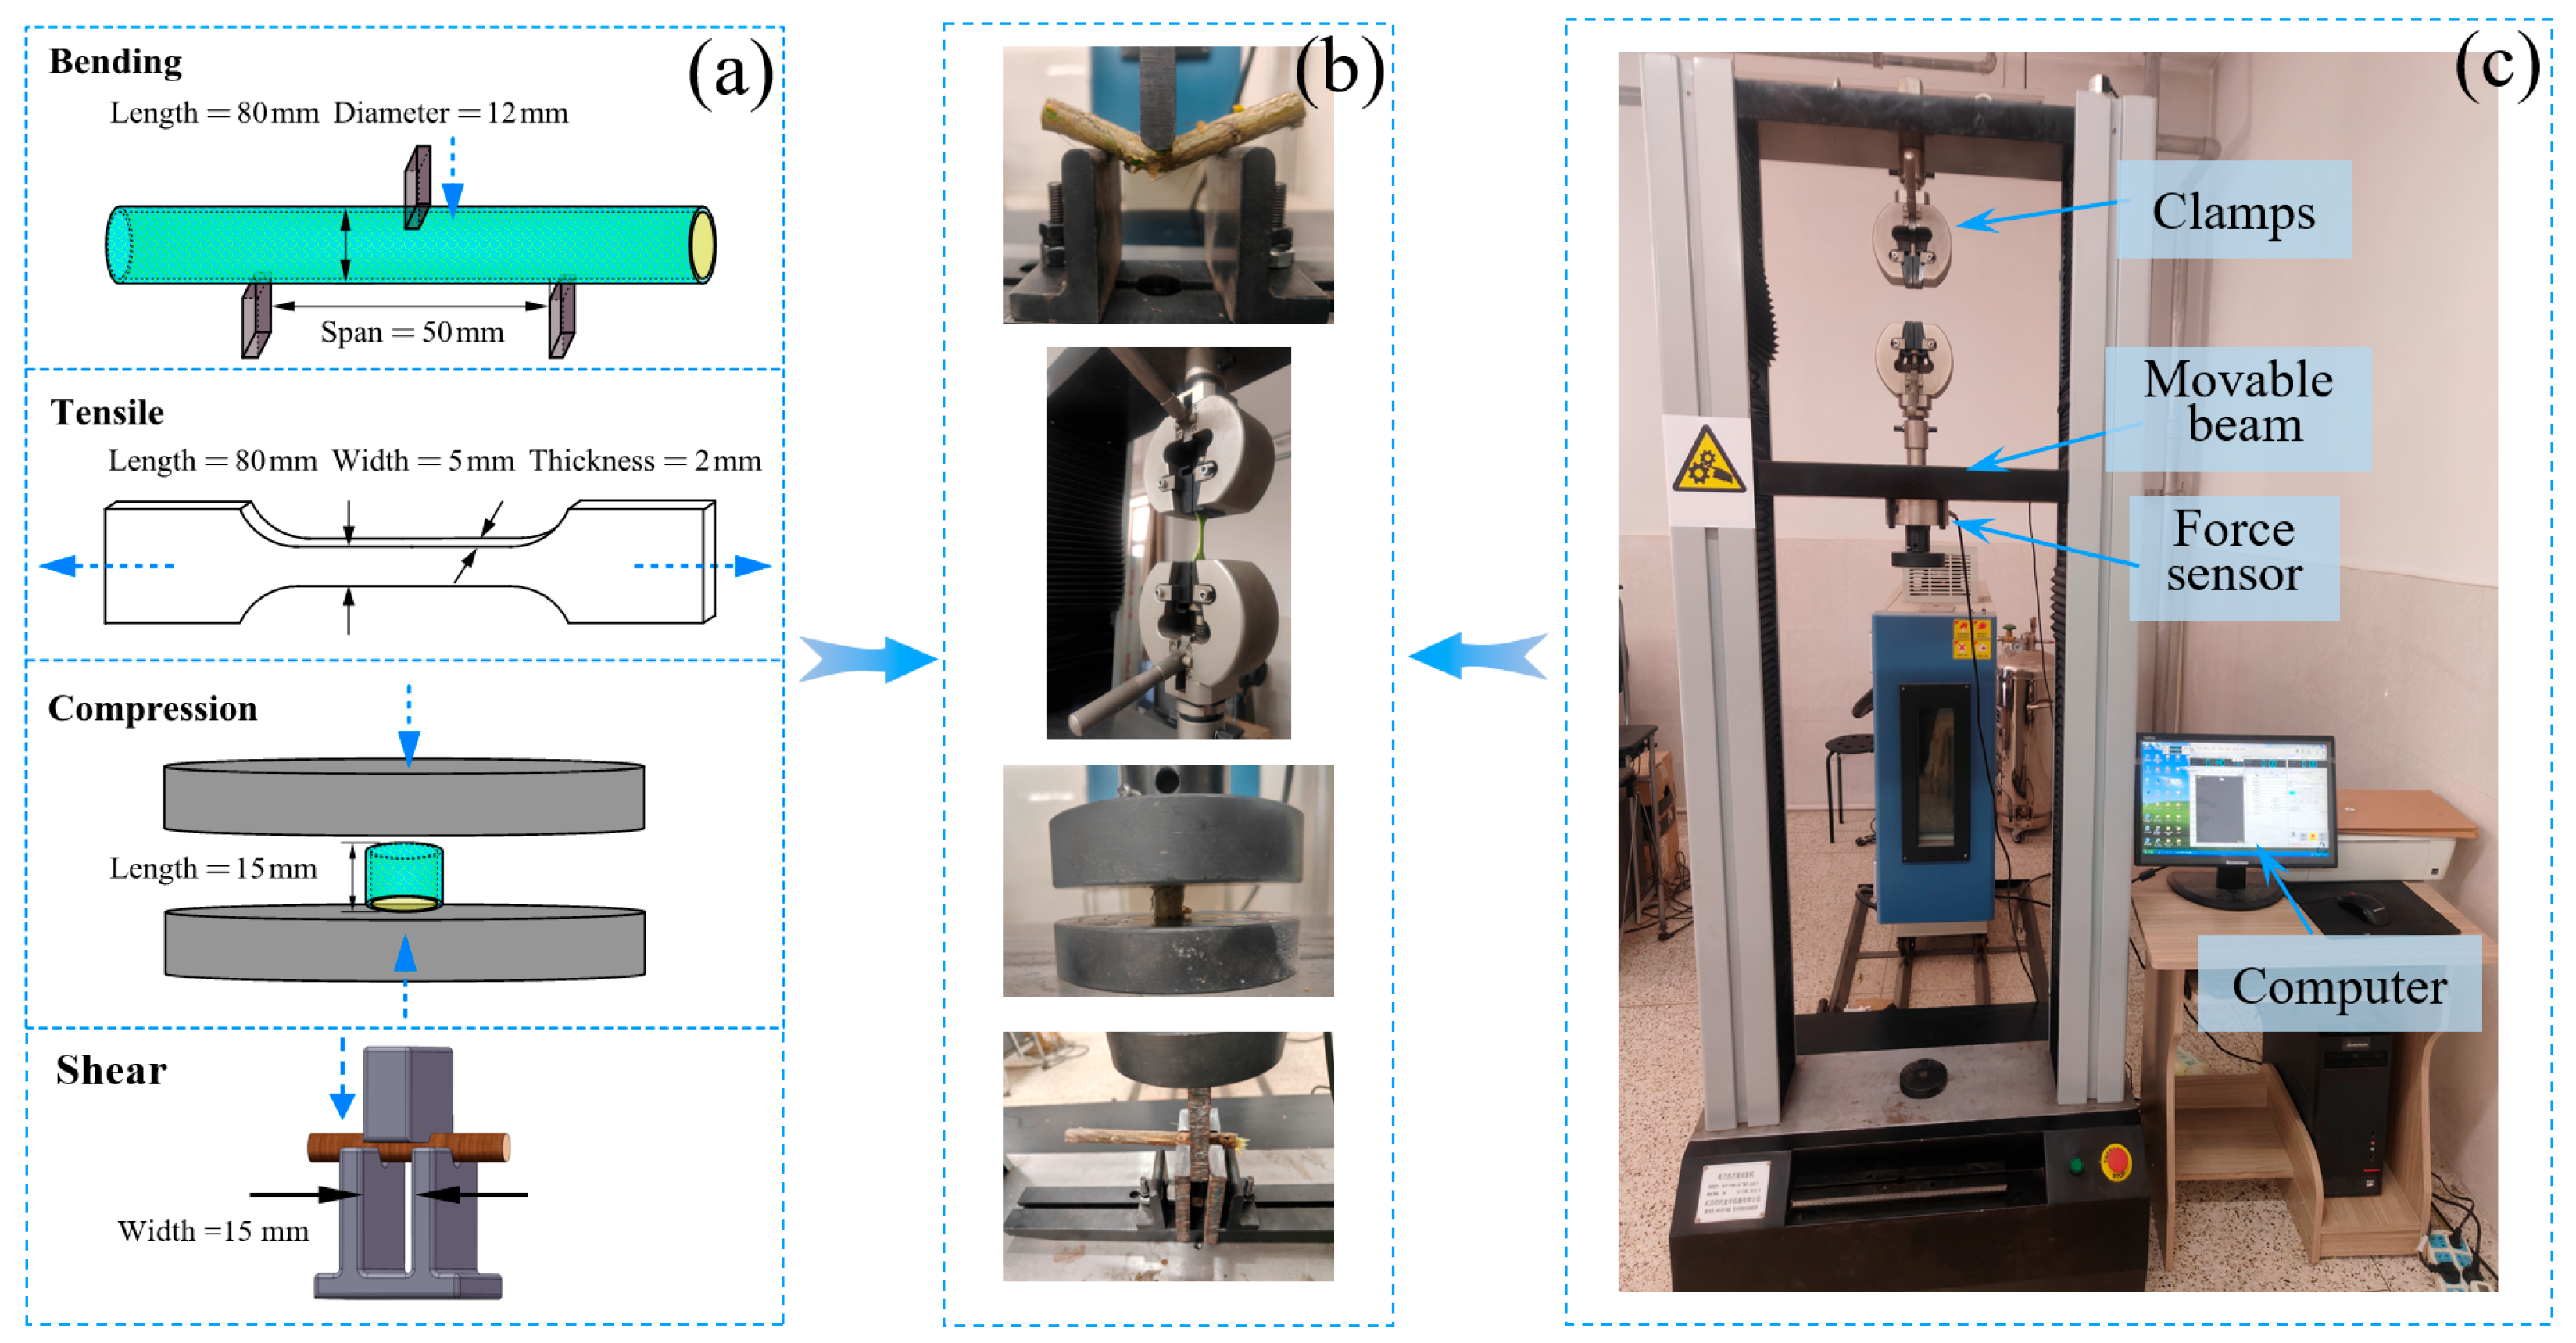
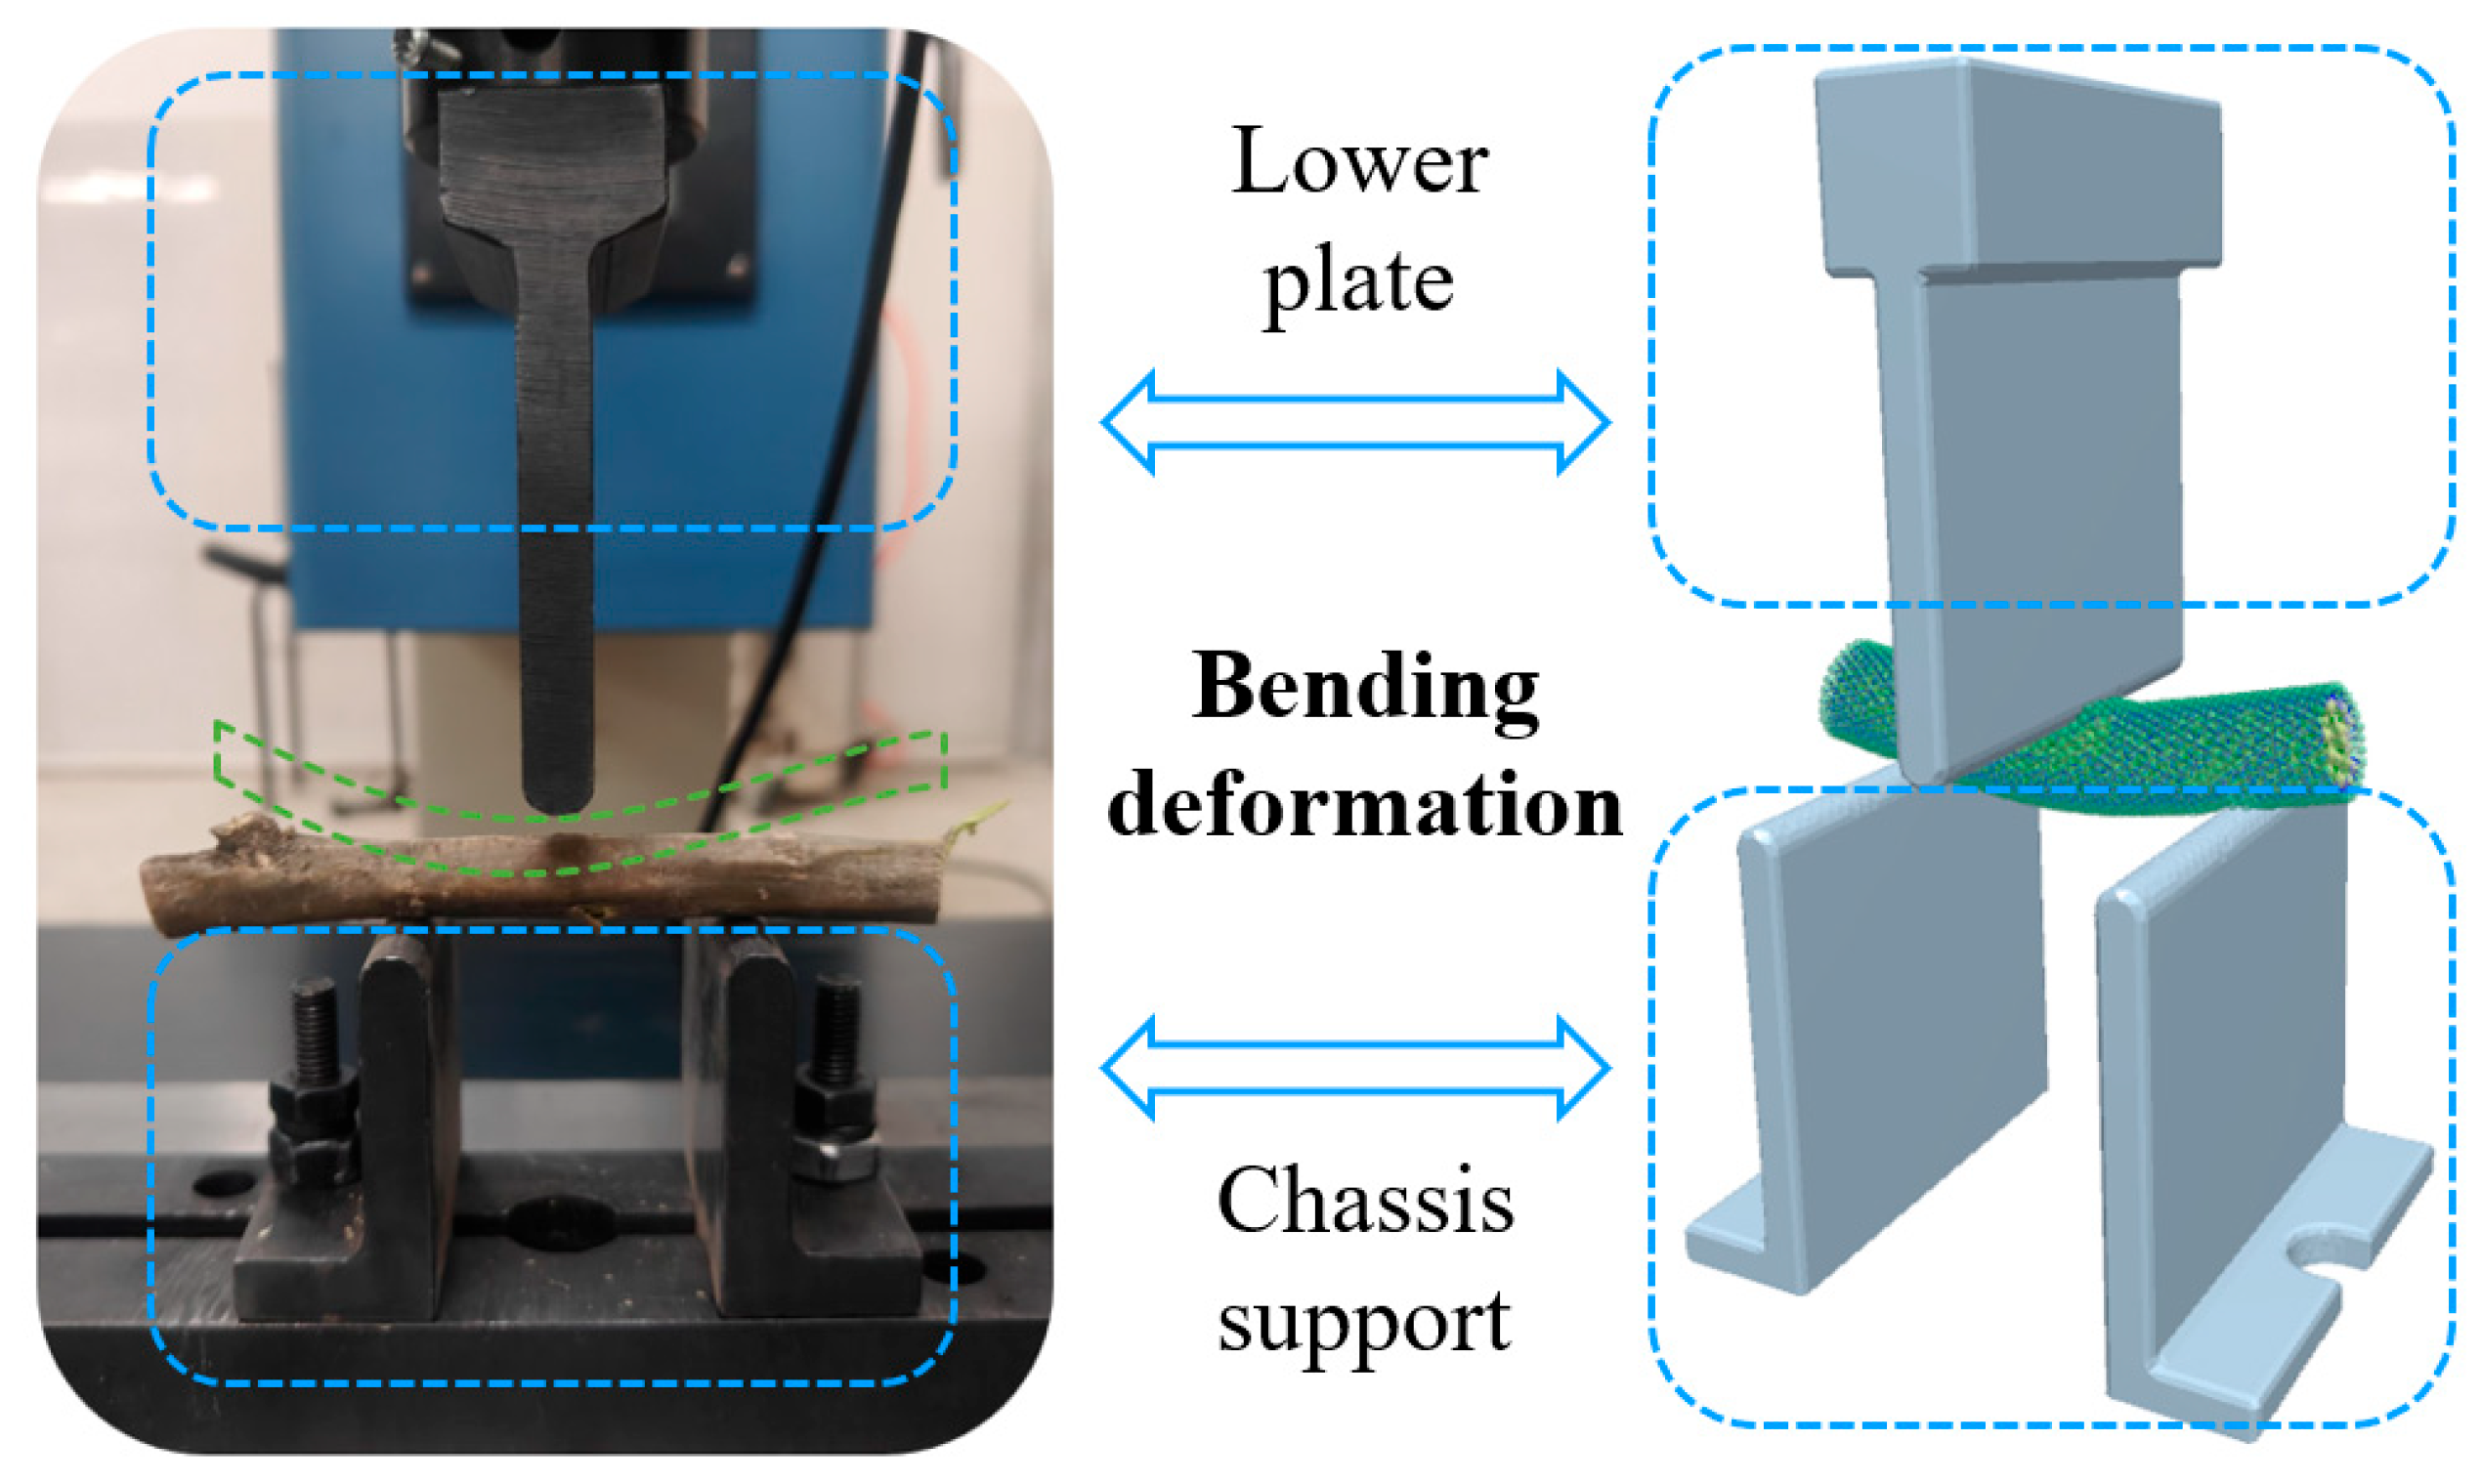
2.4. Mechanical Characteristic Parameter Test

Before conducting in-depth research and constructing the numerical model of CKB, this study first acquires and analyzes its detailed biomechanical characteristics through systematic physical testing methods. According to the sample design scheme shown in Figure 4a, four types of samples with different loading paths were prepared to comprehensively evaluate the mechanical response of CKB under different stress states. Subsequently, experiments were carried out using the SDJF-30 kN high-precision electronic universal testing machine (Wuhan Times Jinfeng Instrument Co., LTD., Wuhan, China, with a load measurement accuracy of ±0.5%). As shown in Figure 4b, four key mechanical tests were conducted on CKB: a three-point bending test, an axial tensile test, an axial compression test, and a shear test [25,26,27].
To ensure the accuracy and repeatability of the tests, seamless switching between different loading modes was achieved by precisely adjusting the fixture device of the testing machine. All tests strictly followed the quasi-static loading principle, and the loading rate was set at 5 mm/min to minimize the influence of the inertia effect on the test results. In addition, the experiments under each loading condition were repeated three times independently to enhance the validity and statistical significance of the data, so as to provide a reliable experimental basis for subsequent numerical modeling. As shown in Figure 4c, during the test, the computer equipped with the test rig recorded and processed the force–displacement data generated during the loading process in real time, which provided solid data support for the subsequent data analysis and model validation.

2.5. Calibration Process for Bonding Parameters

Based on physical test results, it was found that the fracture mechanics contribution of core–epidermis interactions is relatively small compared to core–core and epidermis–epidermis interactions. Therefore, to simplify the model and avoid over-parameterization, its bonding parameters were set to be consistent with the epidermis–epidermis parameters. Similarly, in previous DEM studies on the stems of fiber plants such as corn and ramie, this modeling strategy was also adopted, assuming that the influence of heterogeneous interlayer interfaces on the overall failure mechanism is relatively minor [28,29]. A systematic evaluation of the mechanical properties of CKB tested by a three-point bending test setup was carried out as shown in Figure 5. During the bending test, the inner side of the CKB stalk was subjected to radial compression, while the outer side experienced tensile effects until the tensile stress reached its limit and initiated fracture. This phenomenon not only reveals the local radial compression characteristics of CKB stalks but also reflects the fracture mechanism and local axial tensile characteristics of the inner core and skin structures. Through comparative analysis, it was found that the bending test demonstrated higher accuracy in the mechanical property assessment compared with the tensile and compression tests. Therefore, the bending test was selected as the main simulation scheme, while the tensile, compressive, and shear tests were used as auxiliary means for parameter verification. In the physical bending test, the peak destructive force (Fb) and force–displacement (F-D) curves of CKB were accurately measured, and systematic simulation tests were carried out based on this. Firstly, the CKB bending simulation test was implemented for the target value of Fb, and the Plackett–Burman design method was used to screen out the factors that had a significant effect on Fb [27]. The optimal value intervals of these significant influencing factors were further determined by the steepest climb test. In addition, a regression model describing the relationship between the significant influencing factors and the peak bending force (Fb) was developed based on the Box–Behnken design. By solving this model, the optimal combination of key parameters was determined. Subsequently, a CKB three-point bending simulation model was established, and the calibrated results were rigorously validated and refined.

2.5.1. Plackett–Burman Test

The Plackett–Burman (PB) experimental design method can be used to differentiate multiple experimental variables that have a significant effect on the evaluation index and to screen out the key parameters that have a significant effect on the peak bending damage force Fb of CKB stalks. With reference to the range of values of the bonding parameters of hybrid conifers [28] and double-layered banana stalks [29], multiple pre-tests were conducted to reduce the range of the order of magnitude of the bonding parameters to within two orders of magnitude, and the coding table of the factor levels is shown in Table 1.

2.5.2. Steepest Climb Test

The steepest climb test plays a key role in exploring the effects of factor levels on the evaluation indexes and helps to further define the range of factor levels precisely. Based on the results of the PB (Plackett–Burman) test, the factors with significant effects on the peak destructive force of the inner core and epidermis of CKB stalks were identified, and then the steepest climbing test was carried out to address these significant factors. This test analyzed the influence of these factors on the force–displacement (F-D) curve characteristics. The specific methodology of the steepest climb test and the results of its bonding parameters are listed in Table 2, while the values of the relative error (RE) were calculated using Equation (5) [30].
R E = | F b F bA | F bA × 100 %
Here, FbA is the average value of Fb and N.

2.5.3. Box–Behnken Experimental Design

To obtain the optimal combination of bonding parameters, a Box–Behnken experimental design with four factors and three levels was conducted using Design-Expert software, based on the significant factors identified through the Plackett–Burman test and the steepest ascent method. A regression model was established to describe the relationship between these significant factors and the peak failure force. The coded levels of the simulation parameters are listed in Table 3. Three replicates were included in the experimental design to evaluate the experimental error. As a result, a total of 27 experimental runs were carried out in the Box–Behnken design. The parameter settings and corresponding output results are shown in Table 4.

2.6. Test Validation

Based on the calibrated discrete elemental model of CKB, the crushing process in the crushing device was simulated, and the crushing rate and the distribution characteristics of the rejects were comparatively analyzed under different rotational speeds (2100 rpm, 2800 rpm, and 3500 rpm). By comparing with the actual test results, the accuracy of the CKB stem modeling and parameter calibration was verified, which provided a basis for the reliability assessment of the model.
As shown in Figure 6, the simulation model is simplified based on the CKB stem cutting and powdering integrated machine test stand built by the group, and only the crushing device is retained as the research object in order to construct the simulation geometric model. A virtual particle source is set in the feeding inlet of the crushing device, so that the particle generation rate is equivalent to the feeding amount of the bench test, and the continuous crushing process within 0.6 s is simulated to reproduce the crushing phenomenon as completely as possible. The time step used in the simulation calculation was rigorously tested and set to 5% of the critical Rayleigh time step calculated. After extensive convergence testing, the final time step was determined to be 5 × 10⁻⁷ s. This value has been thoroughly validated to ensure the accuracy of the numerical calculation and the long-term stability of the simulation, thereby ensuring that the complete dynamic process of the system reaching a steady state or target phenomenon can be fully captured [20]. The calculator can enhance computational simulation speed when using an Intel® Core™ i9-14900X CPU, RTX 5070 GPU, and 64 GB of memory.

3. Results and Discussion

3.1. Physical Test Analysis

The force–displacement relationship of some CKB samples during the bending force process is shown in Figure 7a. Analyzing the bending curves, it can be found that the process is affected by plastic deformation and permanent fracture, and the whole process can be divided into three main stages: the apparent elasticity stage, the linear elasticity stage, and the yield damage stage. In the apparent elasticity stage, the bending force tends to increase slowly, which is mainly due to the fact that the flexible tissue of the outermost skin of the CKB can absorb part of the loading force, resulting in a low rate of increase in the loading curve. As the loading continued, the linear elasticity stage began, and the epidermal structure was compressed to its limit, at which time the xylem of the inner core began to dominate the force. Due to the hardness and toughness of the xylem, its resistance to external forces is strong, resulting in an approximately linear increase in the loading curve at this stage. After entering the yield damage stage, when the force reached the yield point of CKB, the stem fractured at the loading, showing obvious anisotropy, a phenomenon consistent with the theoretical prediction of the Hertz contact problem. To further analyze the damage mechanism, a complete bending fracture simulation of the CKB was carried out, and the force–time curve results are shown in Figure 7b. By comparing the entire simulated force process, it is found that the inner core is the main structure of CKB that resists deformation, which directly determines its mechanical response characteristics. In addition, the bending characteristics of CKB are highly consistent with the findings of other stems reported in the existing literature [31,32,33], which have similar trends in the change in the force process, and the main difference is reflected in the peak destructive force during the damage process, which may be related to the material composition, organizational structure, and loading conditions of different stems.

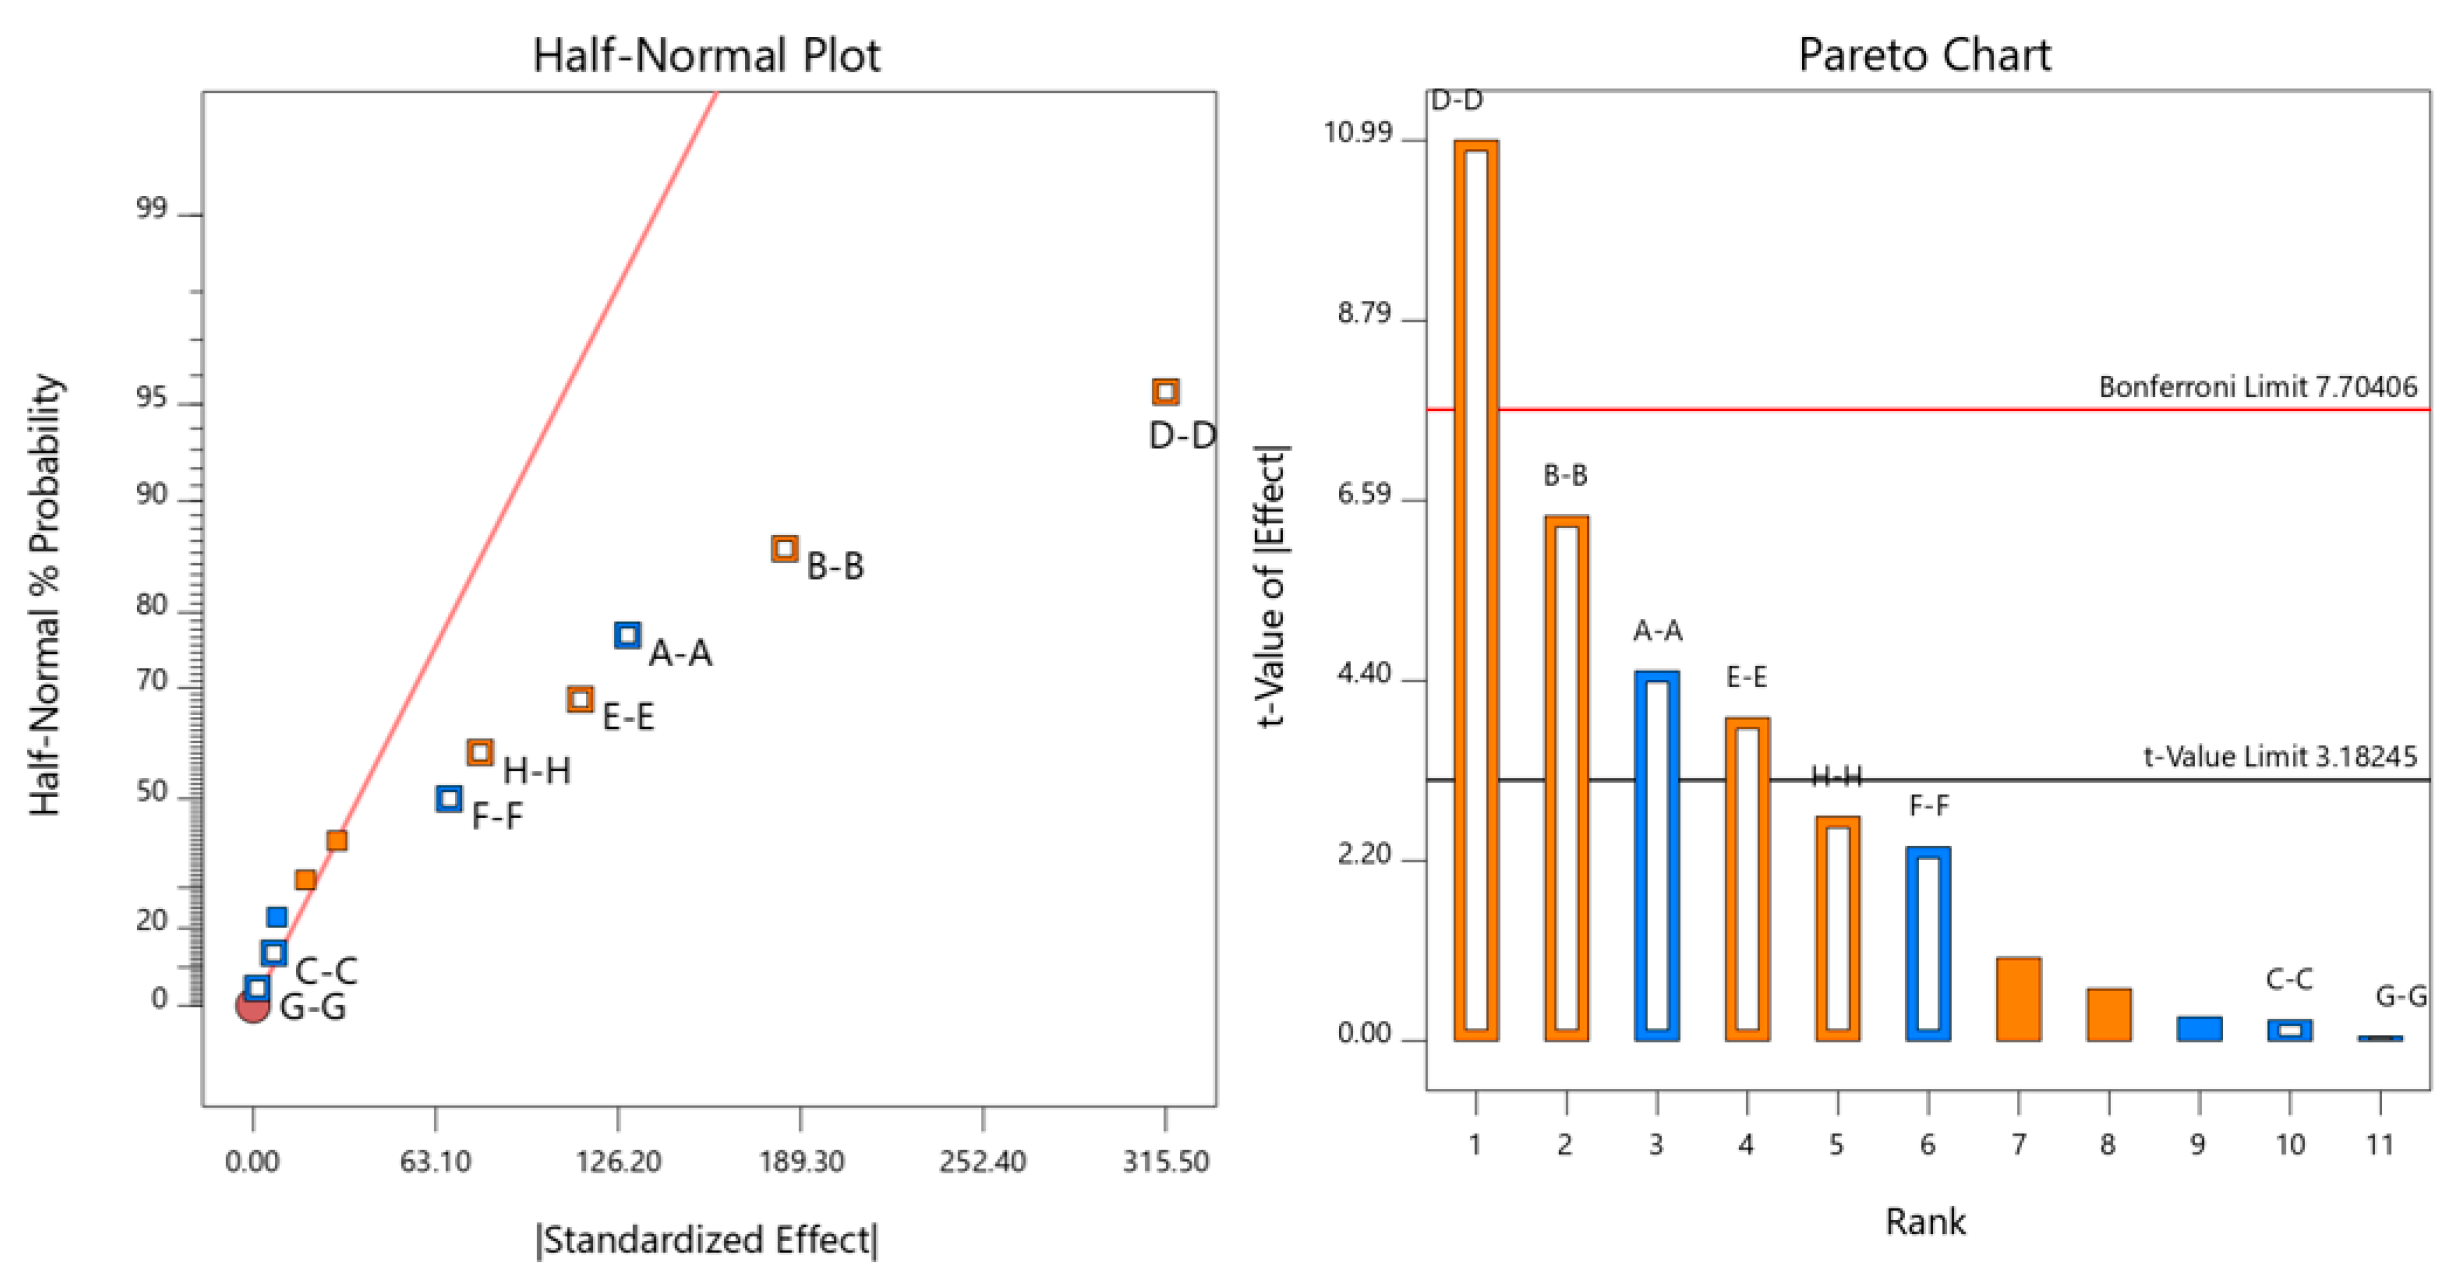
3.2. PB Test Analysis

The significance levels of the effects of the factors on the peak destructive force Fb were analyzed by Pareto charts based on the Plackett–Burman experimental design with the Design-Expert 11 software platform, as shown in Figure 8. The Bonferroni correction (α = 0.05) was used to define the significance thresholds, and the factor effects were judged to be significant when they exceeded the Bonferroni limits [34]. An analysis of Table 5 yielded the following orders of magnitude of the effect of CKB bonding parameters on Fb: D, B, A, E, H, F, C, and G. The CKB bonding parameters D, B, A, and E had a significant positive effect on Fb, indicating that Fb increased with their levels; the effect values of the parameters H, F, C, and G were below the Bonferroni limit value (p > 0.05) and did not show statistical significance. The interaction term has a relatively small impact. To quickly screen out a few significant influencing factors from a large number of potential factors and to reduce the number of experiments, its mathematical model defaults that high-order interactions can be ignored. This analysis reveals the dominant role of the bonding parameters on the crushing force and provides a basis for key parameter screening for subsequent response surface optimization.

3.3. Analysis of the Steepest Climb Test

The steepest climbing test can effectively narrow down the scope of the parameter study and improve the evaluation index by optimizing the level combinations of significant factors. Based on the screening test results of the Plackett–Burman design, it was determined that four key parameters in bonded particles have a significant effect on the bending destructive force of CKB, and therefore, the appropriate ranges of these parameters were selected to conduct five sets of the steepest climbing tests. The remaining non-significant parameters were kept at intermediate levels: the inner core normal stress was 9.25 × 10⁷ Pa, the skin shear stiffness was 5.22 × 10⁸ N·m−1, the skin normal stiffness was 2.26 × 10⁷ Pa, and the skin shear stiffness was 2.26 × 10⁶ Pa. The actual design results of the steepest climb tests are shown in Table 6. The actual design results of the steepest climb test are shown in Table 6.
The test data show that when the values of the four key parameters, i.e., inner core normal stiffness, inner core shear stiffness, inner core shear stress, and skin normal stiffness, are gradually increased, the bending damage force of the CKB exhibits a nonlinear response, which is characterized by a monotonically increasing and then gradually decreasing trend. Among them, the bending damage force obtained in the fourth test has the smallest deviation rate from the actual test target value, which shows that the parameter combination has the optimal matching characteristics. In the central combination test design, the optimization interval of the significance parameter was set to the test level adjacent to the fourth. By analyzing the change rule of the parameter gradient from the third to the fifth test, it was determined that this interval should be taken as the parameter value of the central combination.

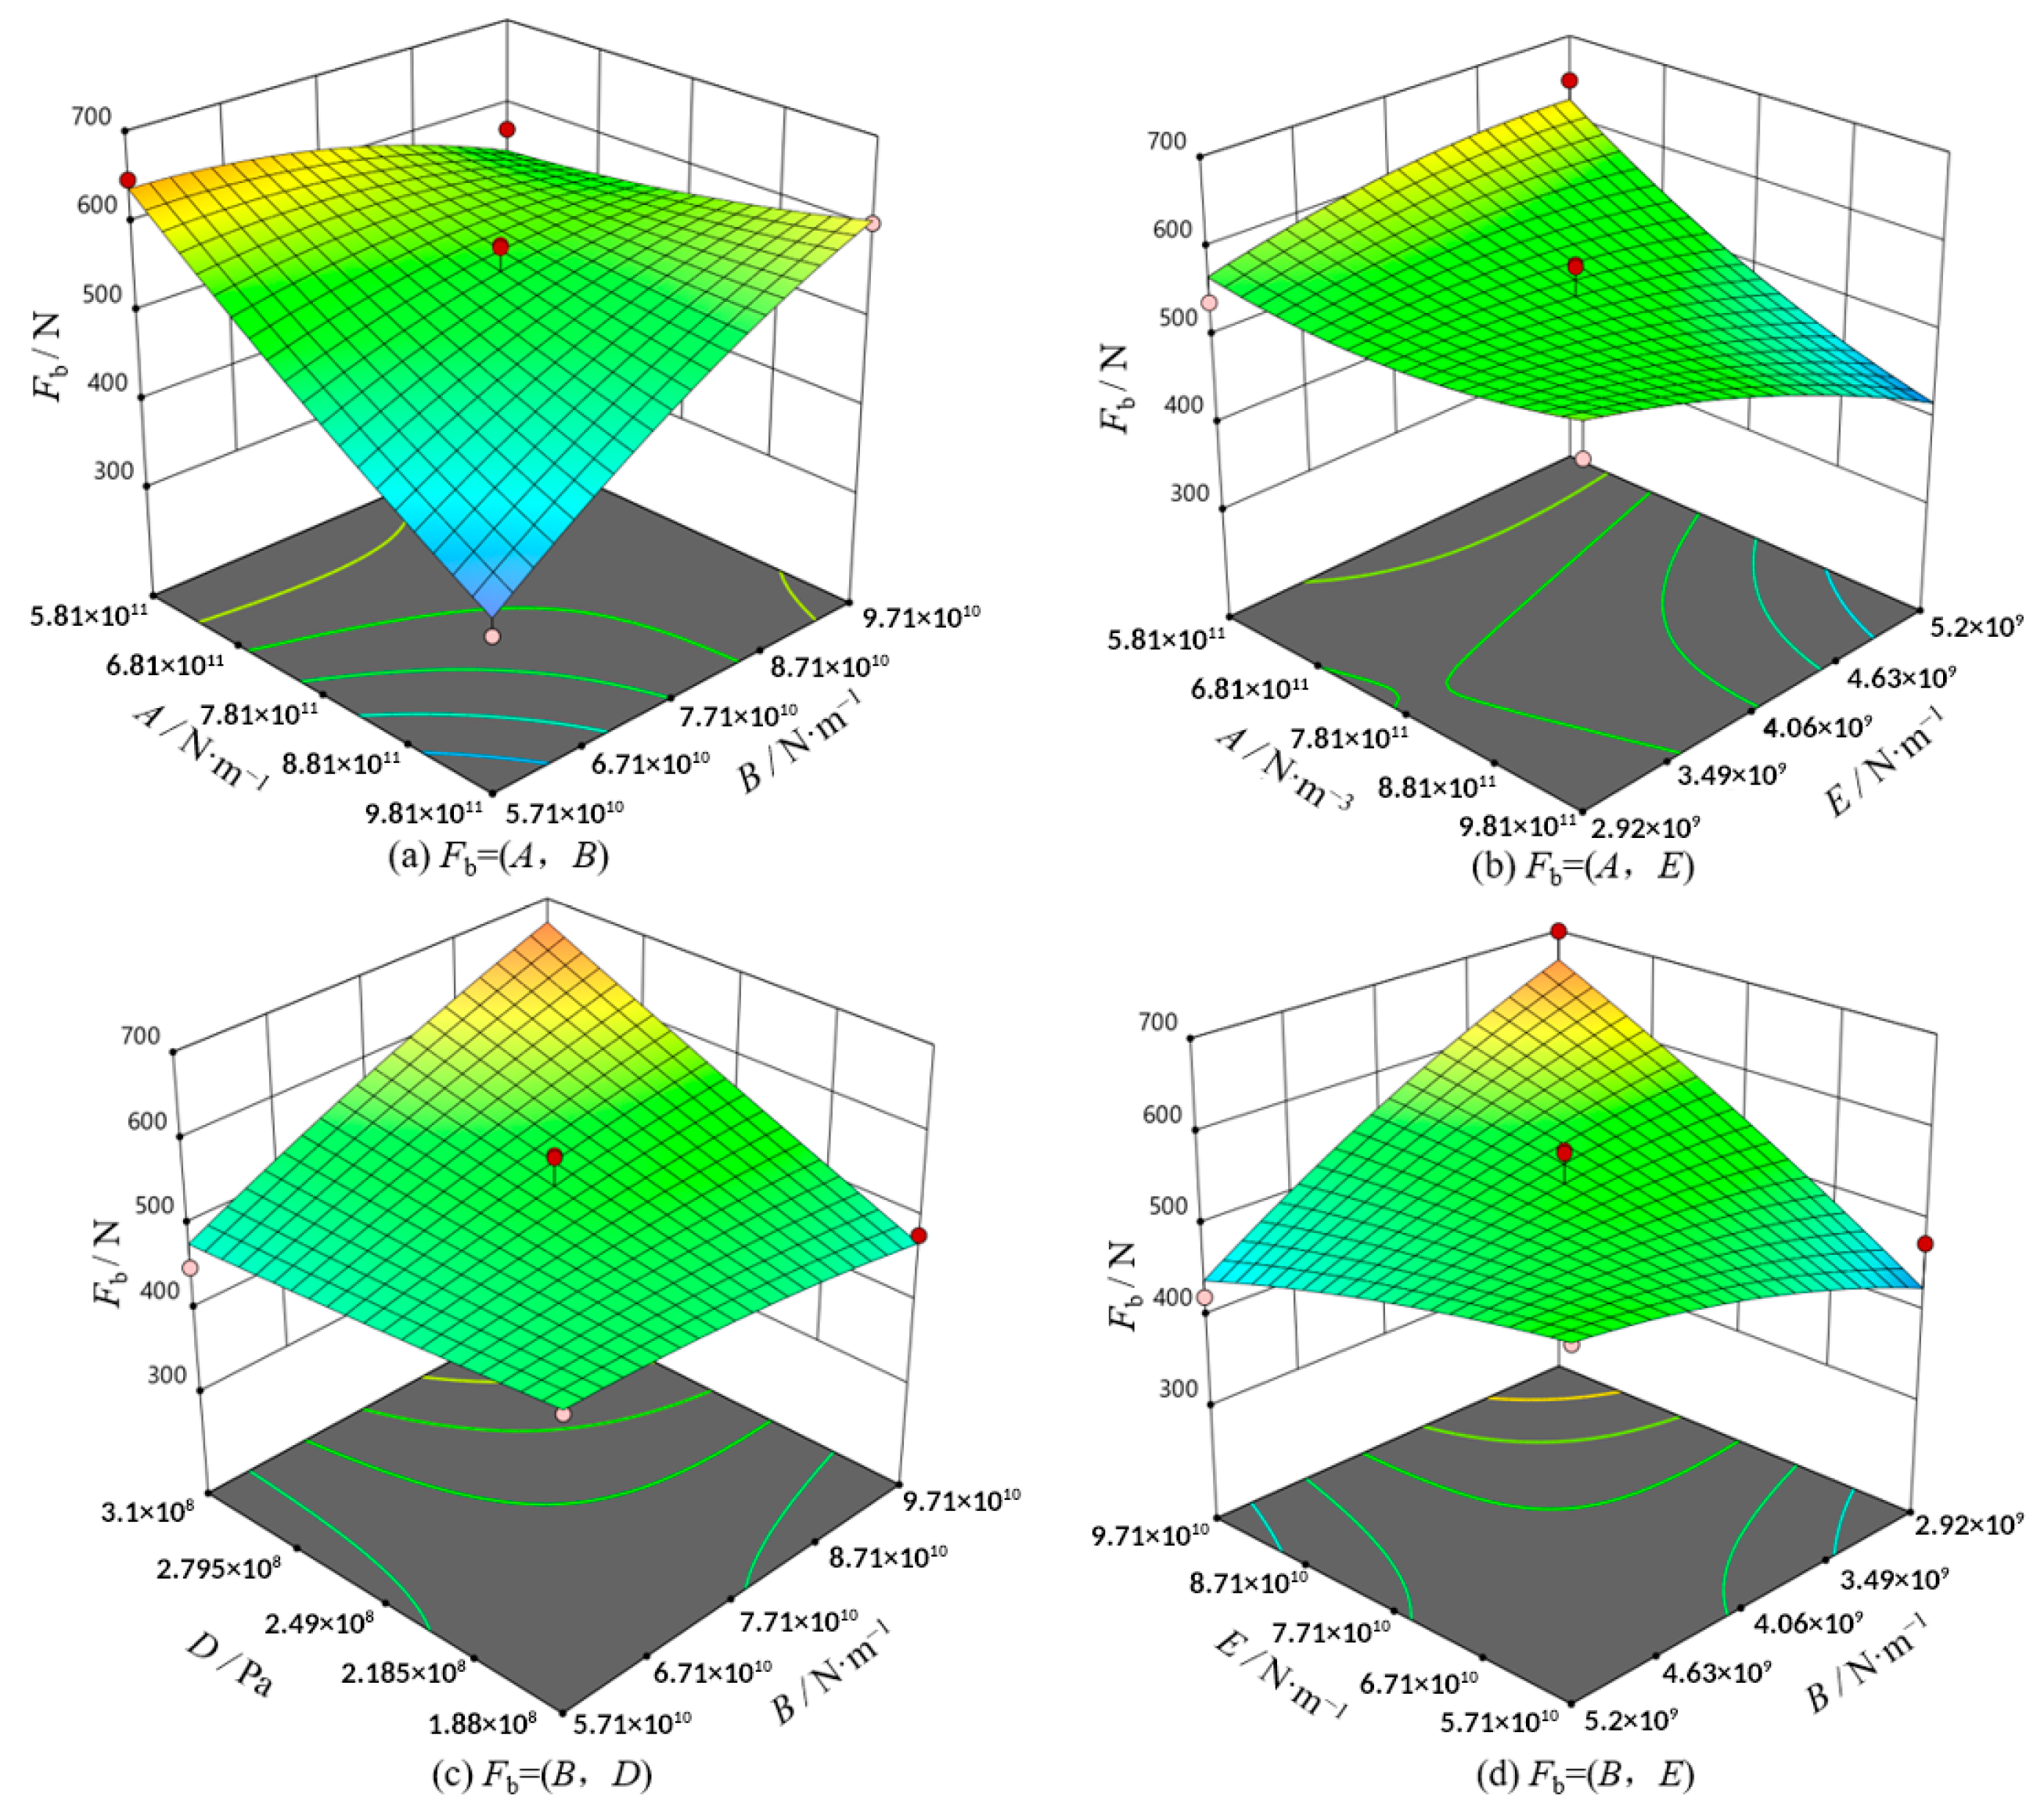
3.4. Analysis of the Box–Behnken Test Results

The second-order regression model of CKB bending test destructive force and influencing factors was constructed based on Design-Expert software (Equation (6)), and the ANOVA results are shown in Table 7, which was highly significant at the p < 0.01 level, with the coefficient of determination R2 = 0.9014 confirming the model’s high prediction accuracy and reliability.
F b = 543.89 46.44 A + 35 . 62 B + 39 . 85 D 28 . 53 E + 76 AB 3 . 66 AD 56 . 21 AE + 60 . 12 BD 84 . 67 BE 23 . 24 DE + 22 . 53 A 2 9 . 52 B 2 + 1 . 78 D 2 16 . 43 E 2
Parametric significance tests revealed that the inner core normal stiffness (A), inner core tangential stiffness (B), inner core tangential stress (D), and their interaction terms AE and BD exerted highly significant effects on the bending destructive force (p < 0.01), whereas the epidermal normal stiffness (E) and the interaction terms AB and BE showed significant effects (p < 0.05).
The results of the response surface analysis of the interaction terms on the bending damage force of the CKB model are shown in Figure 9.
The response surface analyses in Figure 9a,b show that the peak bending destructive force exhibits a significant correlation with the inner core stiffness parameter when the other bonding parameters take intermediate values: the peak destructive force exhibits a monotonically increasing tendency as the shear stiffness of the inner core (B) is increased, whereas an increase in the inner core normal stiffness (A) leads to an increase in the peak destructive force at a much higher rate, and the strength of its influence is significantly stronger than that of the shear stiffness parameter. It is noteworthy that the variation in the skin normal stiffness (E) did not have a significant effect on the peak destructive force, indicating that this parameter is a secondary influence in the mechanical response of the CKB model. Figure 9c,d further reveal the parameter interaction effect: the synergistic enhancement of inner core shear stress (D) and inner core shear stiffness (B) increases the peak destructive force while maintaining the intermediate values of the other parameters, while the increase in inner core shear stiffness (B) is accompanied by a decrease in skin normal stiffness (E) to increase the peak destructive force. The comprehensive analysis shows that the inner core normal stiffness (A), inner core shear stiffness (B), and inner core shear stress (D) constitute the inner core parameter set affecting the mechanical properties of the CKB model, while the skin normal stiffness (E) is a secondary parameter. The parameter sensitivity distribution characteristics verify that the discrete element model of double-layer bonded CKB can effectively reproduce the mechanical behavior characteristics of the actual CKB structure, which provides a reliable theoretical model for subsequent parameter optimization.
By integrating micro-mechanical principles with macro-stress transfer effects, a parameter analysis of the model reveals underlying patterns: the core normal stiffness (A), tangential stiffness (B), and tangential strength (D) are the key parameters governing the bending failure performance of the stem. Higher A values enhance energy storage in the compression zone and delay slip, while increasing B and D strengthen the shear resistance of the neutral layer, collectively increasing the peak bending force and promoting fracture initiation at the outer epidermis. In contrast, the epidermal normal stiffness (E) exhibits lower sensitivity, as outer layer failure primarily results from fiber pull-out [16]. Optimizing parameter combinations can not only suppress premature delamination by having the core bear the main stress and alleviating interlayer mismatch [35,36,37], but it can also achieve the target particle size while significantly reducing energy consumption by using higher speeds or sharper hammer blades for highly lignified areas and lower speeds for less lignified areas.

3.5. Determination of Optimal Parameter Combinations and Model Validation Tests

In order to determine the optimal combination of bonding parameters, this study uses the bending destructive force Fb as the target response value for a multi-parameter optimization design. Based on the experimental principle of taking the intermediate value of non-significant factors, the constrained optimization model shown in Equation (7) was constructed using Design-Expert software. By setting the target value of a peak bending damage force of 628 N, the software’s built-in constraint solver is used for parameter optimization, and the optimal solution set with a relative error of ≤10% of the measured value of peak bending damage force of CKB is screened. The optimal parameter combinations were finally obtained: A = 7.37 × 10¹¹; B = 9.46 × 10¹⁰; D = 2.52 × 10⁸; and E = 4.01 × 10⁸.
F b = 628 5.81 × 10 11 A 9.81 × 10 11 5.71 × 10 10 B 9.71 × 10 10 1.88 × 10 8 D 3.10 × 10 8 2.92 × 10 9 E 5.20 × 10 9
In order to verify the reliability of the parameters, a series of physical tests is carried out based on the optimization results: a CKB bending test, a skin/inner core tensile test, and an axial compression test. As shown in Table 8, the validation data indicate that the relative errors between the simulated and measured values for the three types of tests are 10%, 8%, 7%, and 9%, respectively, which meet the engineering tolerance range. Figure 7 further shows the “time–load” curves of the bending, axial compression, and tensile tests under the optimal parameters, which shows that the simulation results are in good agreement with the physical test curves, confirming the effectiveness of the parameter optimization method.
As shown in Figure 10, the simulated and measured curves show a high degree of consistency in the overall change trend, and there is no significant difference between the damage patterns of CKB specimens under different test conditions and the actual physical test results. In Figure 10a, both the simulated and physical specimens of the bending test were completely fractured under the composite effect of radial compression and axial tension, and the skin of the specimen showed a filamentary stretching phenomenon, which indicated that the CKB skin material had significant toughness characteristics. In Figure 10b, both the simulated and physical specimens of the axial compression test showed local damage patterns, and the interface between the skin and the inner core appeared to be separated, which effectively characterized the distribution of axial compressive stress and the failure mechanism of interfacial bonding. In Figure 10b, the simulated and measured curves showed a high degree of consistency in overall trends. The distribution of axial compressive stress and the failure mechanism of interfacial bonding are effectively characterized. In Figure 10c, the CKB skin shows progressive fracture due to its toughness, and its stress–time curve shows a nonlinear increase until the peak stress and then a slow decay, whereas the inner core, which is rich in fibrous/half-cellulosic components, shows brittle fracture, and the stress rises to the peak and then decreases abruptly to zero. This phenomenon may be caused by the roughness of the cell surface in the low-moisture-content specimens, which leads to microfibril tearing and a large number of residual fibrils on the fracture surface, whereas in the high-moisture-content specimens, the lubrication of the water film reduces the bonding force at the cell interface, and the fracture surface tends to be smooth. This moisture-mediated difference in interfacial behavior explains the mechanism of correlation between material toughness and fracture mode at the microscopic level. As shown in Figure 10d, the material exhibits a mechanical response of nonlinear growth to the peak stress and then a stepwise gradual decrease under shear load, typically presenting the characteristics of ductile fracture. This fracture behavior stems from the residual strength contributed by the fiber bridging effect during the shearing process, as well as the mutual meshing and sequential tearing among the microfilaments of the cell wall under the condition of low water content. It is worth noting that this shear failure mode is highly similar to the fracture evolution trend observed in the tensile test of CKB materials, jointly confirming the universal mechanism of progressive failure at the fiber/tissue level.

3.6. Simulation Verification and Performance Analysis

3.6.1. Crushing Simulation and Actual Test Verification

As shown in Figure 11, this study analyzes the variation rule of crushing rate between physical tests and numerical simulations by comparing three groups of rotational speed conditions, namely 2100, 2800, and 3500 r/min. The study shows that the CKB crushing rate is significantly positively correlated with the rotor speed of the hammers, and its mechanism can be attributed to the increase in the linear velocity of the hammers caused by the increase in the rotational speed, which significantly improves the high-frequency impact on the CKB particles per unit of time, thus strengthening the crushing effect. When the rotational speed is increased from 2100 r/min to 3500 r/min, the increase in the linear velocity of the hammer blade end reaches 66.7%, which directly leads to an increase in the effective impact frequency by about 1.63 times. Figure 11 shows the quantitative comparison; the relative error of the crushing rate between the simulation and the physical test is 6.18%, which fully meets the requirements of the engineering analysis and effectively verifies the parameter reliability and calculation accuracy of the simulation model.

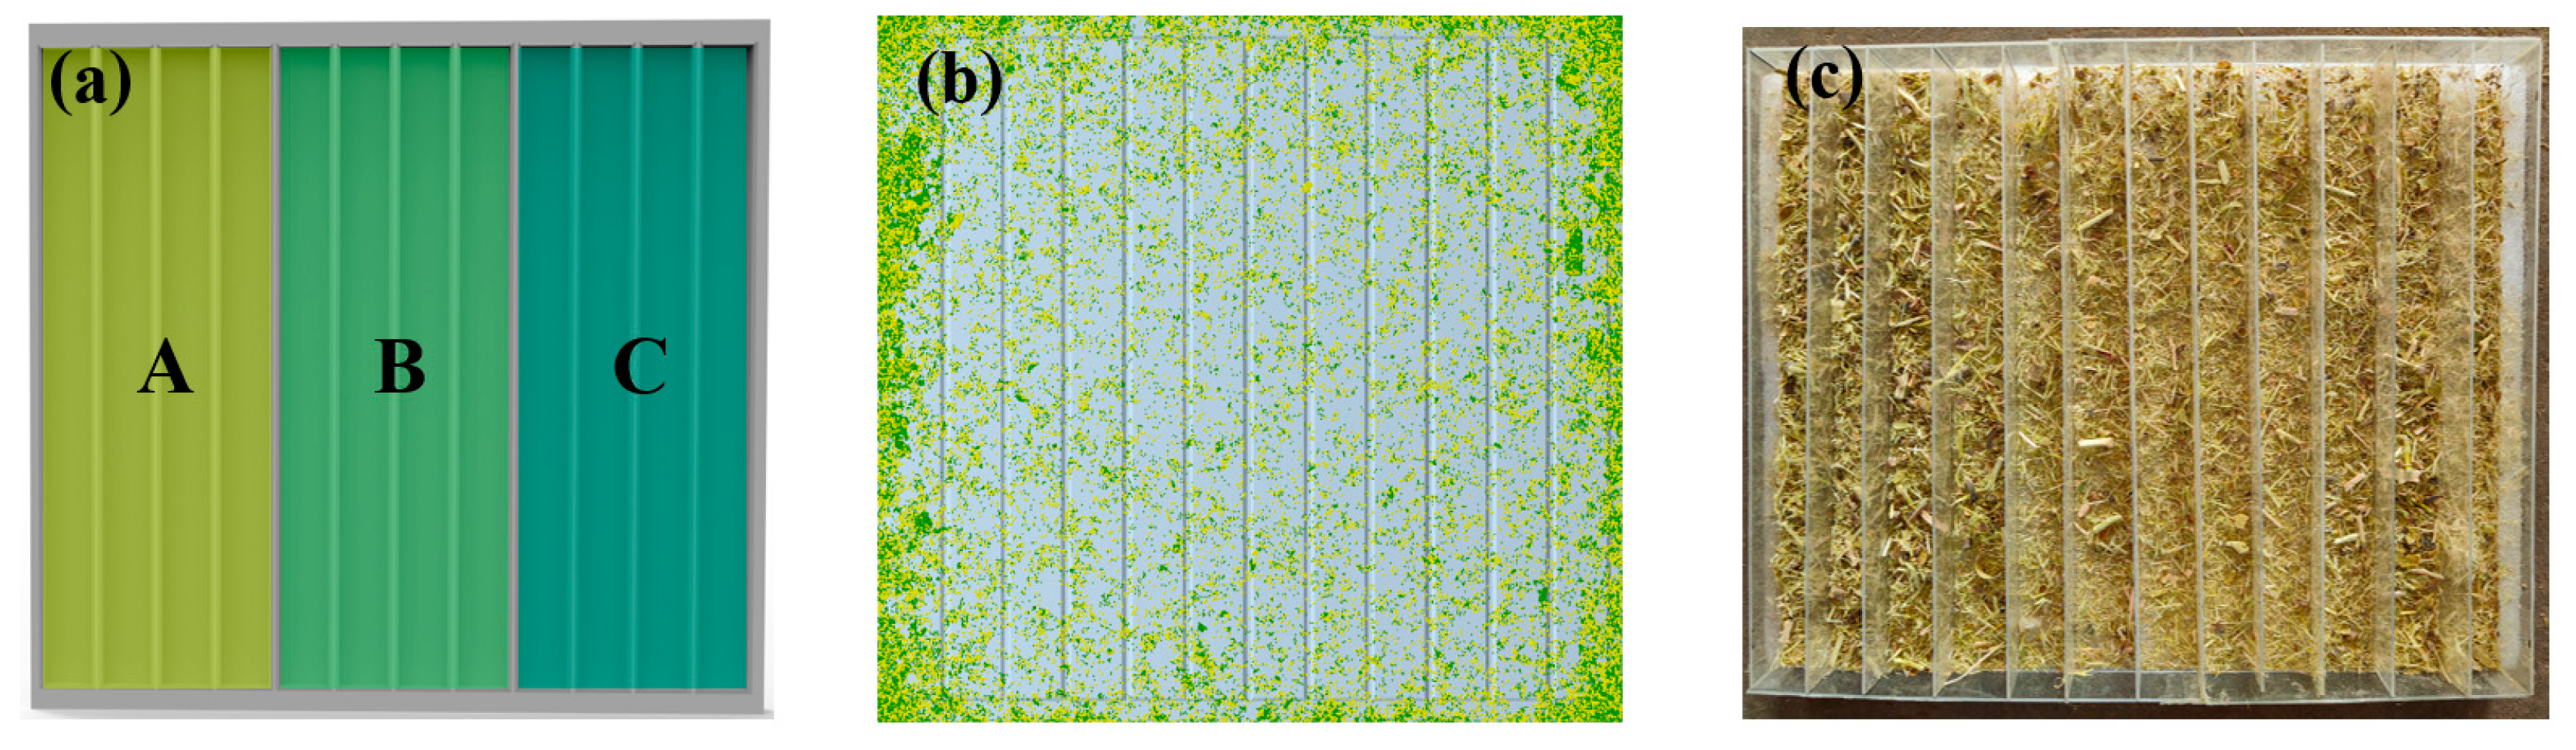
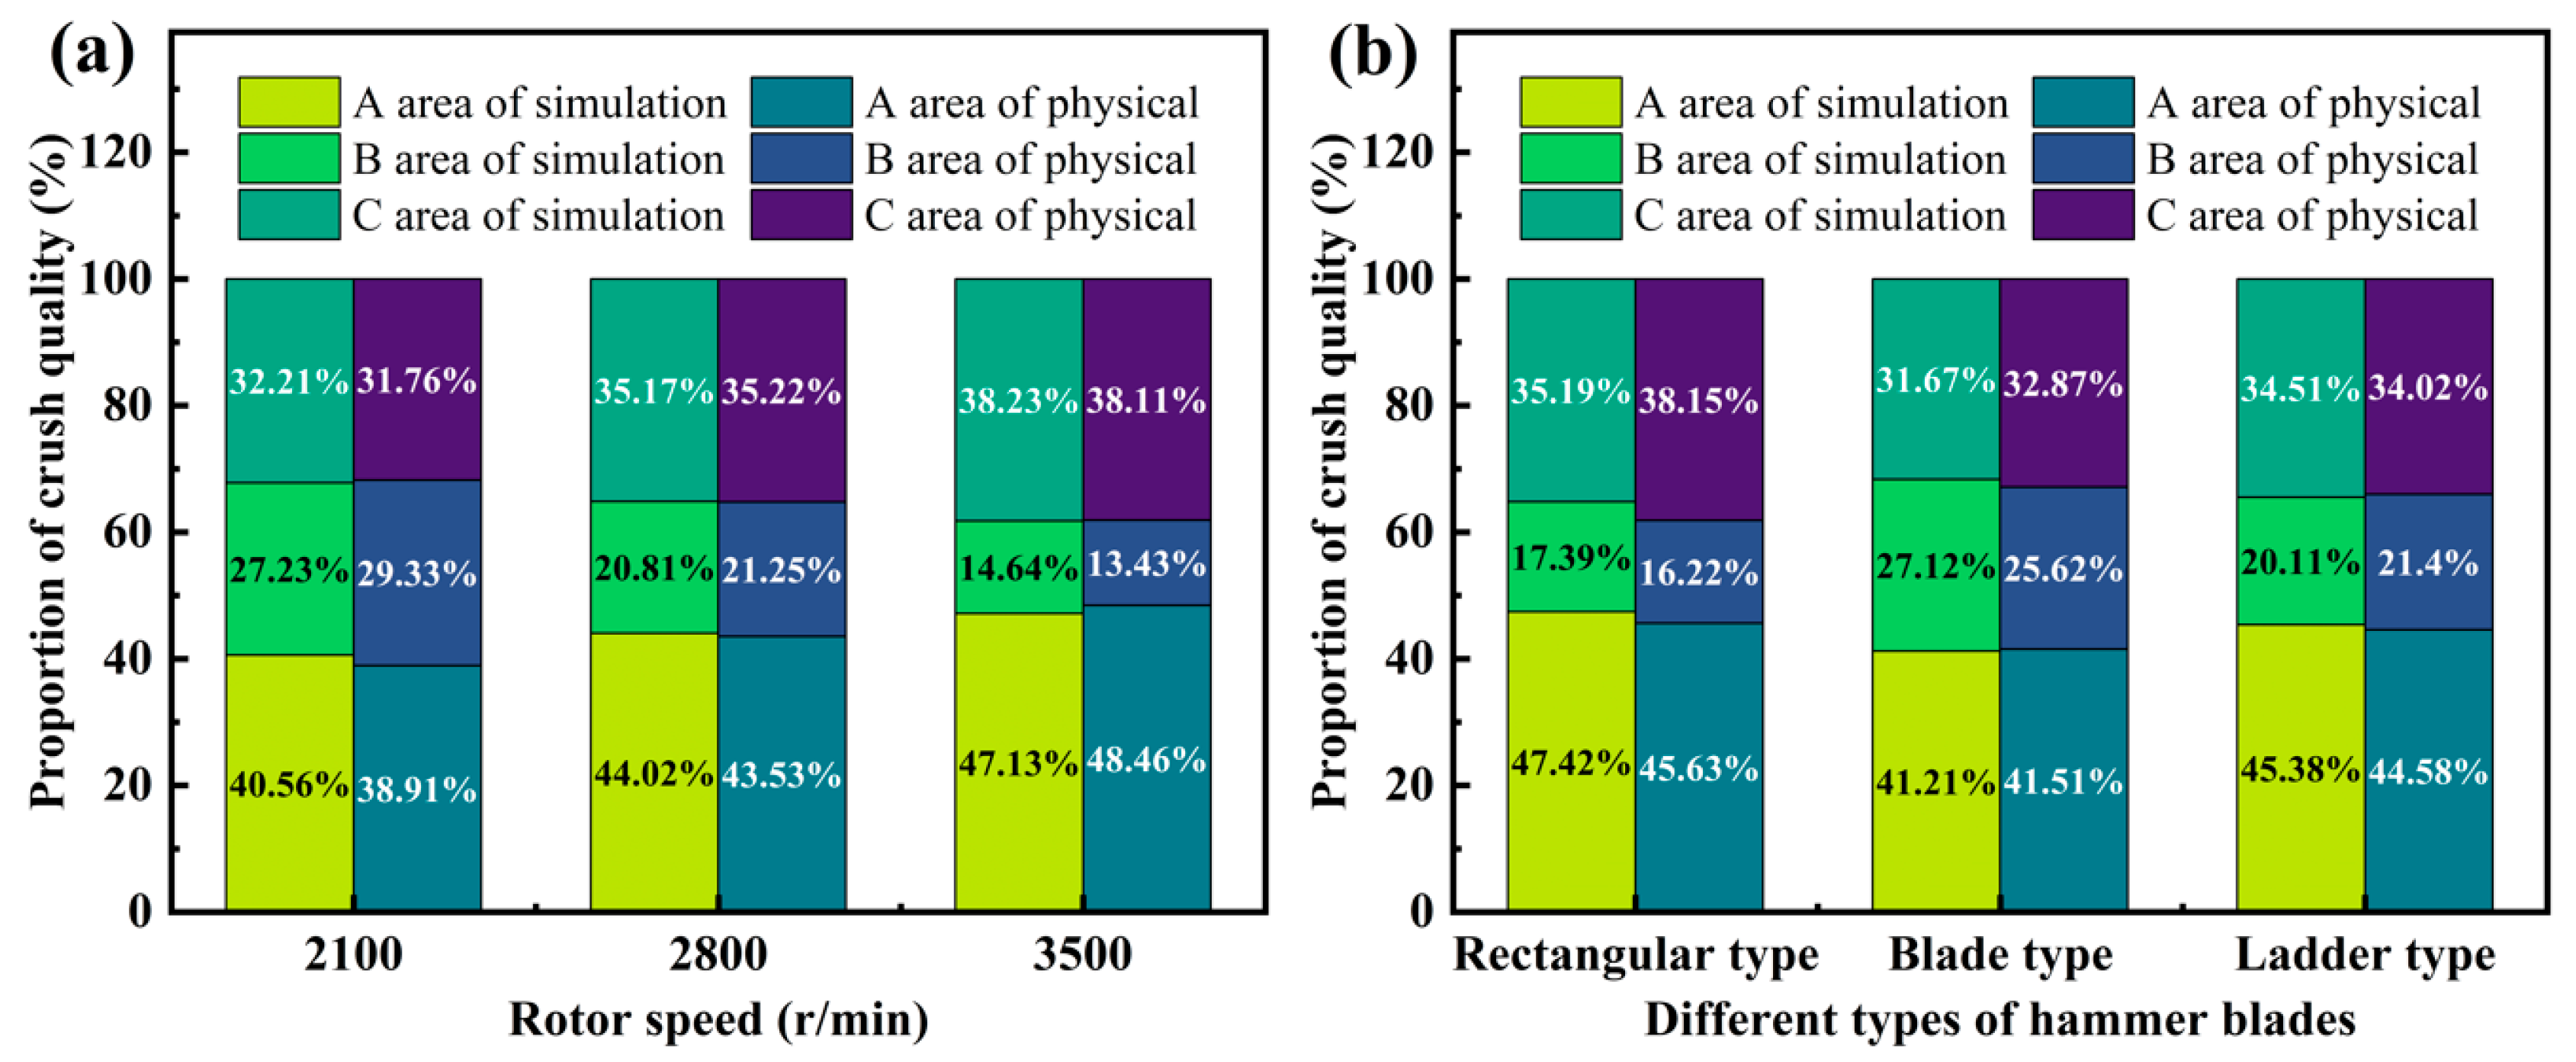
3.6.2. Analysis of the Radial Mass Distribution of Crushed Material

By systematically analyzing the distribution pattern of crushed CKB powder, the optimal installation position of the compound powder device can be accurately determined, thus effectively eliminating the phenomenon of circulating layers inside the hammer mill and improving the processing efficiency of the equipment. As shown in Figure 12a of the test device partition model, the A area (tooth plate impact crushing area) is used to achieve the primary crushing, the B area (hammer blade primary crushing area) is used for secondary crushing, and the C area (separation of the end of the area) is used to complete the final separation; Figure 12b,c show the obtained crushed material distribution rule of change.
The linear velocity of the hammer blade of the crusher is positively correlated with the kinetic energy of the impact; the mechanical kinetic energy input is insufficient in the case of low rotational speed; and the impact force of the hammer blade on the CKB, the impact strength of the tooth plate, and the frequency of the impact per unit of time are all significantly reduced, which results in a decrease in the energy efficiency ratio of the crushing of the material. As shown in Figure 13a, the mass ratio of the A area peaked at 47.13% at 3500 rpm, which was 9.55% higher than that at 2100 rpm, indicating that the impact of high speed effectively improves the initial crushing efficiency, and at the same time, it shows that the high rotational speed optimizes the coarse crushing effect by enhancing the impact force of the tooth plate. However, the annular layer effect formed by high speed promotes the migration of the CKBs along the surface of the screen mesh, which leads to the relatively low crushing of the material in the B area, and the material is affected by the secondary impact and gravity. The material falls from the C area by secondary impact and gravity.
Figure 13b shows that the influence of different hammer blade types on the distribution of crushed material is similar to the distribution characteristics under different rotational speed conditions. Rectangular hammers have strong single-instance impact kinetic energy, making the material in the first impact and tooth plate collision achieve crushing, but due to the effect of the annular layer of part of the material’s migration to the screen surface, in the second impact and gravity, the centrifugal force synergistic effect of the final value from the C area makes the A area of the mass of the material significantly account for this value compared to the two areas of B and C. In contrast, bladed hammers mainly rely on cutting action to achieve material fragmentation, and their impact characteristics are similar to the distribution of different speed conditions. In comparison, the bladed hammer mainly relies on cutting to achieve material crushing, and its impact crushing efficiency is significantly reduced, especially because the impact crushing efficiency of the material and the tooth plate is obviously weakened, so the distribution of crushing mass in the three areas of A, B, and C presents a relatively balanced characteristic. It can also be seen that the crushing simulation is highly consistent with the trend in the CKB crushing mass distribution of the physical test, which verifies the reliability of the proposed model in crushing dynamics simulation.

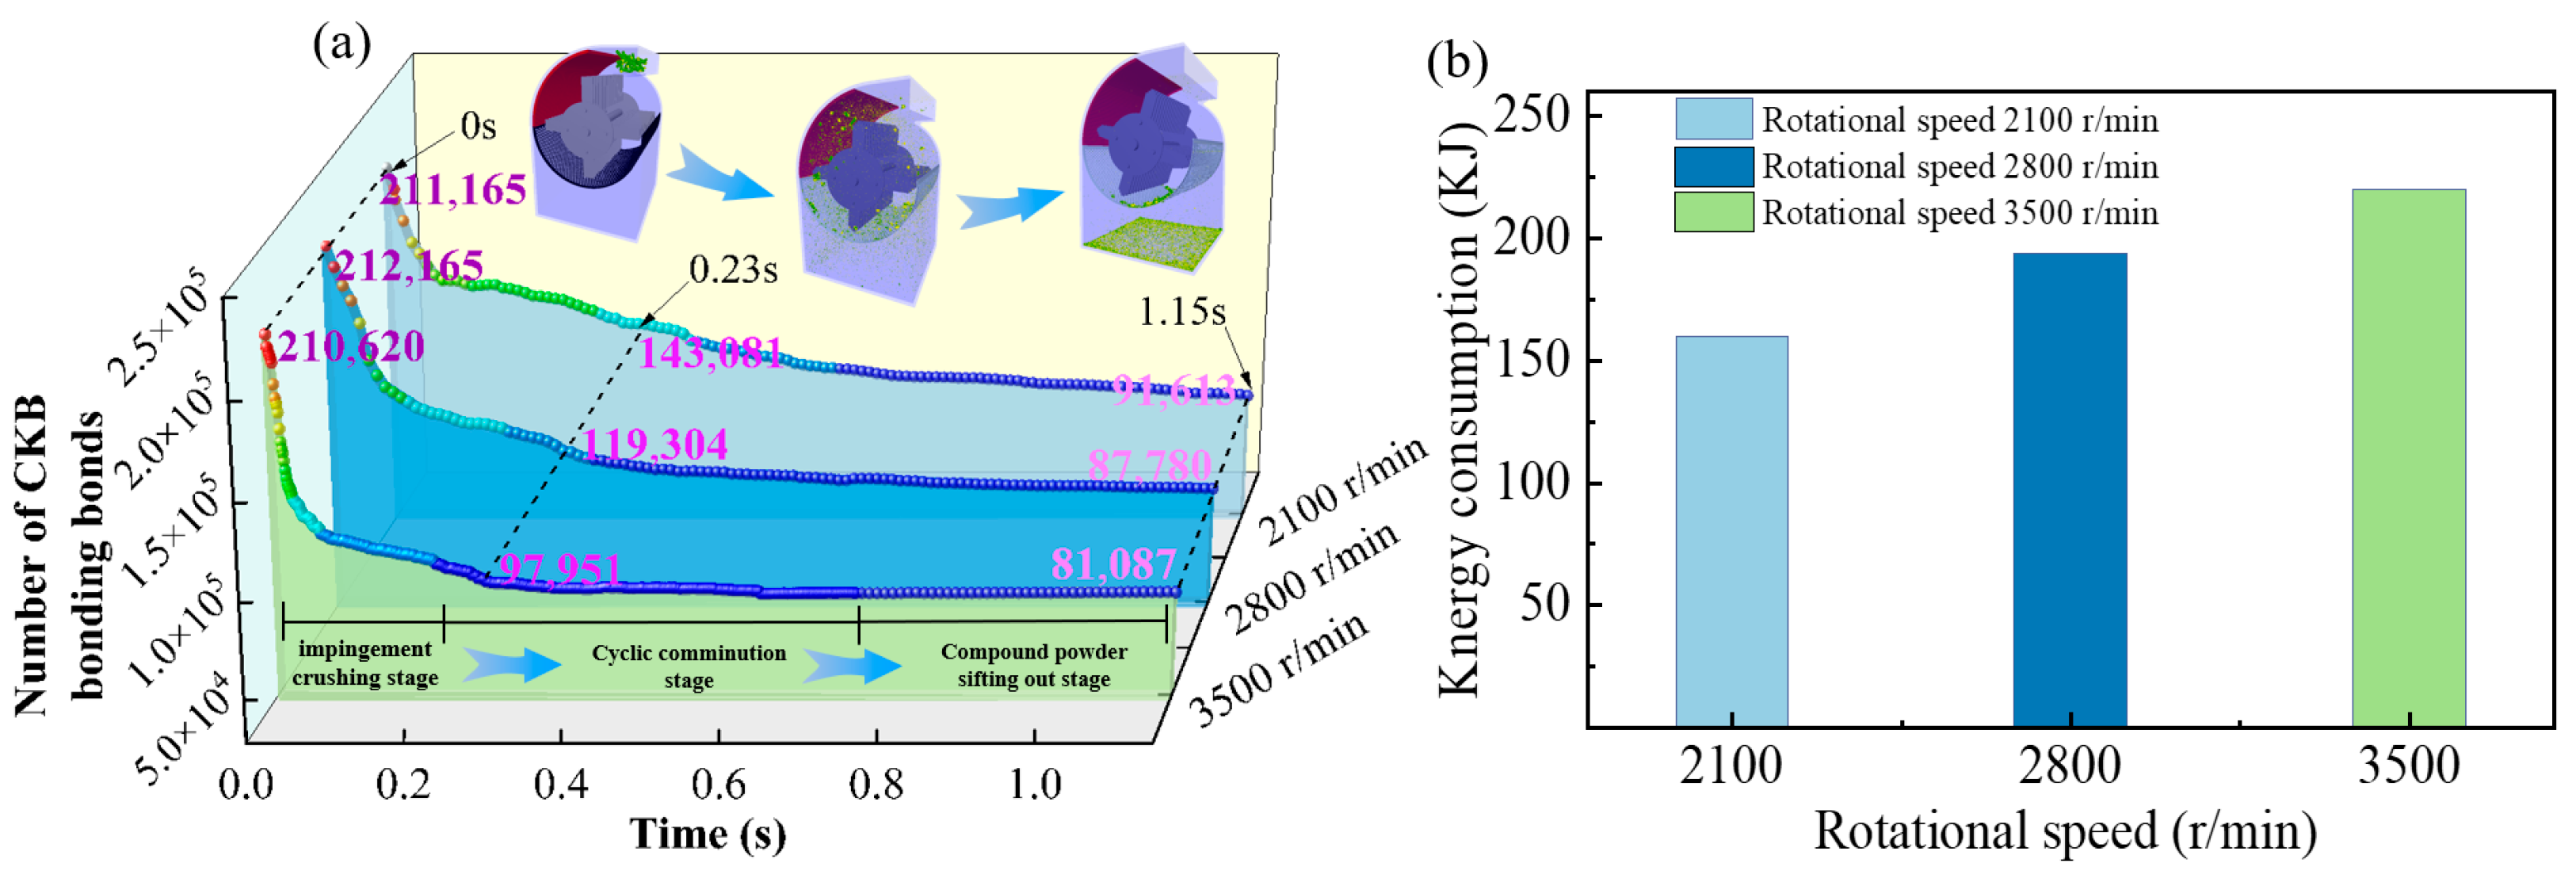
3.6.3. Effect of Different Rotational Speeds on Crushing Rate

As shown in Figure 14a, this study quantitatively characterized the crushing process of CKB from long stalks to target particle sizes by tracking the dynamic evolution of the bonding between inner core–skin particles. The numerical simulation results show that the total number of bonding bonds under the three rotational speeds presents a three-phase characteristic of “rapid decay–slow decline–stable plateau”: the bonding number reaches the peak at the initial moment (t = 0 s), which originates from the instantaneous generation of all the bonding bonds during the initialization of the discrete element model; with the high-speed impact of the hammers, the number of bonding bonds enters into the exponential decay phase. Especially at 3500 r/min, the evolution of the bonding number shows a significant phase transition: the decay rate of the bonding number reaches ΔN/Δt = 1.25 × 10⁵ s−1 in the stage of 0–0.2 s, which corresponds to the high-frequency contact between large-size materials and hammer blades in the initial crushing stage; the decay rate decreases to ΔN/Δt = 4.32 × 10⁴ s−1 in the stage of 0.2–0.69 s, which characterizes the reduction in collision probability due to the reduction in particle size in the cyclic crushing stage. After t > 0.69 s, the bonding number stabilized at 8.1 × 10⁴, indicating that the particle size of the material met the screening requirements and entered the discharging stage.
As shown in Figure 14b, as the rotor speed gradually increases from 2100 rpm to 3500 rpm, the energy consumption of the crusher exhibits a significant upward trend. High-speed rotation leads to a significant increase in the frequency of material–hammer collisions and impact kinetic energy, with a substantial amount of energy being consumed in high-frequency impact and particle friction loss processes. The results indicate that increasing the rotational speed enhances the impact crushing intensity, thereby significantly improving the material’s crushing fineness. However, this is accompanied by a sharp increase in energy consumption. Therefore, it is urgent to conduct a coordinated optimization of the target crushing particle size and operating rotational speed to significantly reduce energy consumption per unit of production capacity while ensuring product particle size.

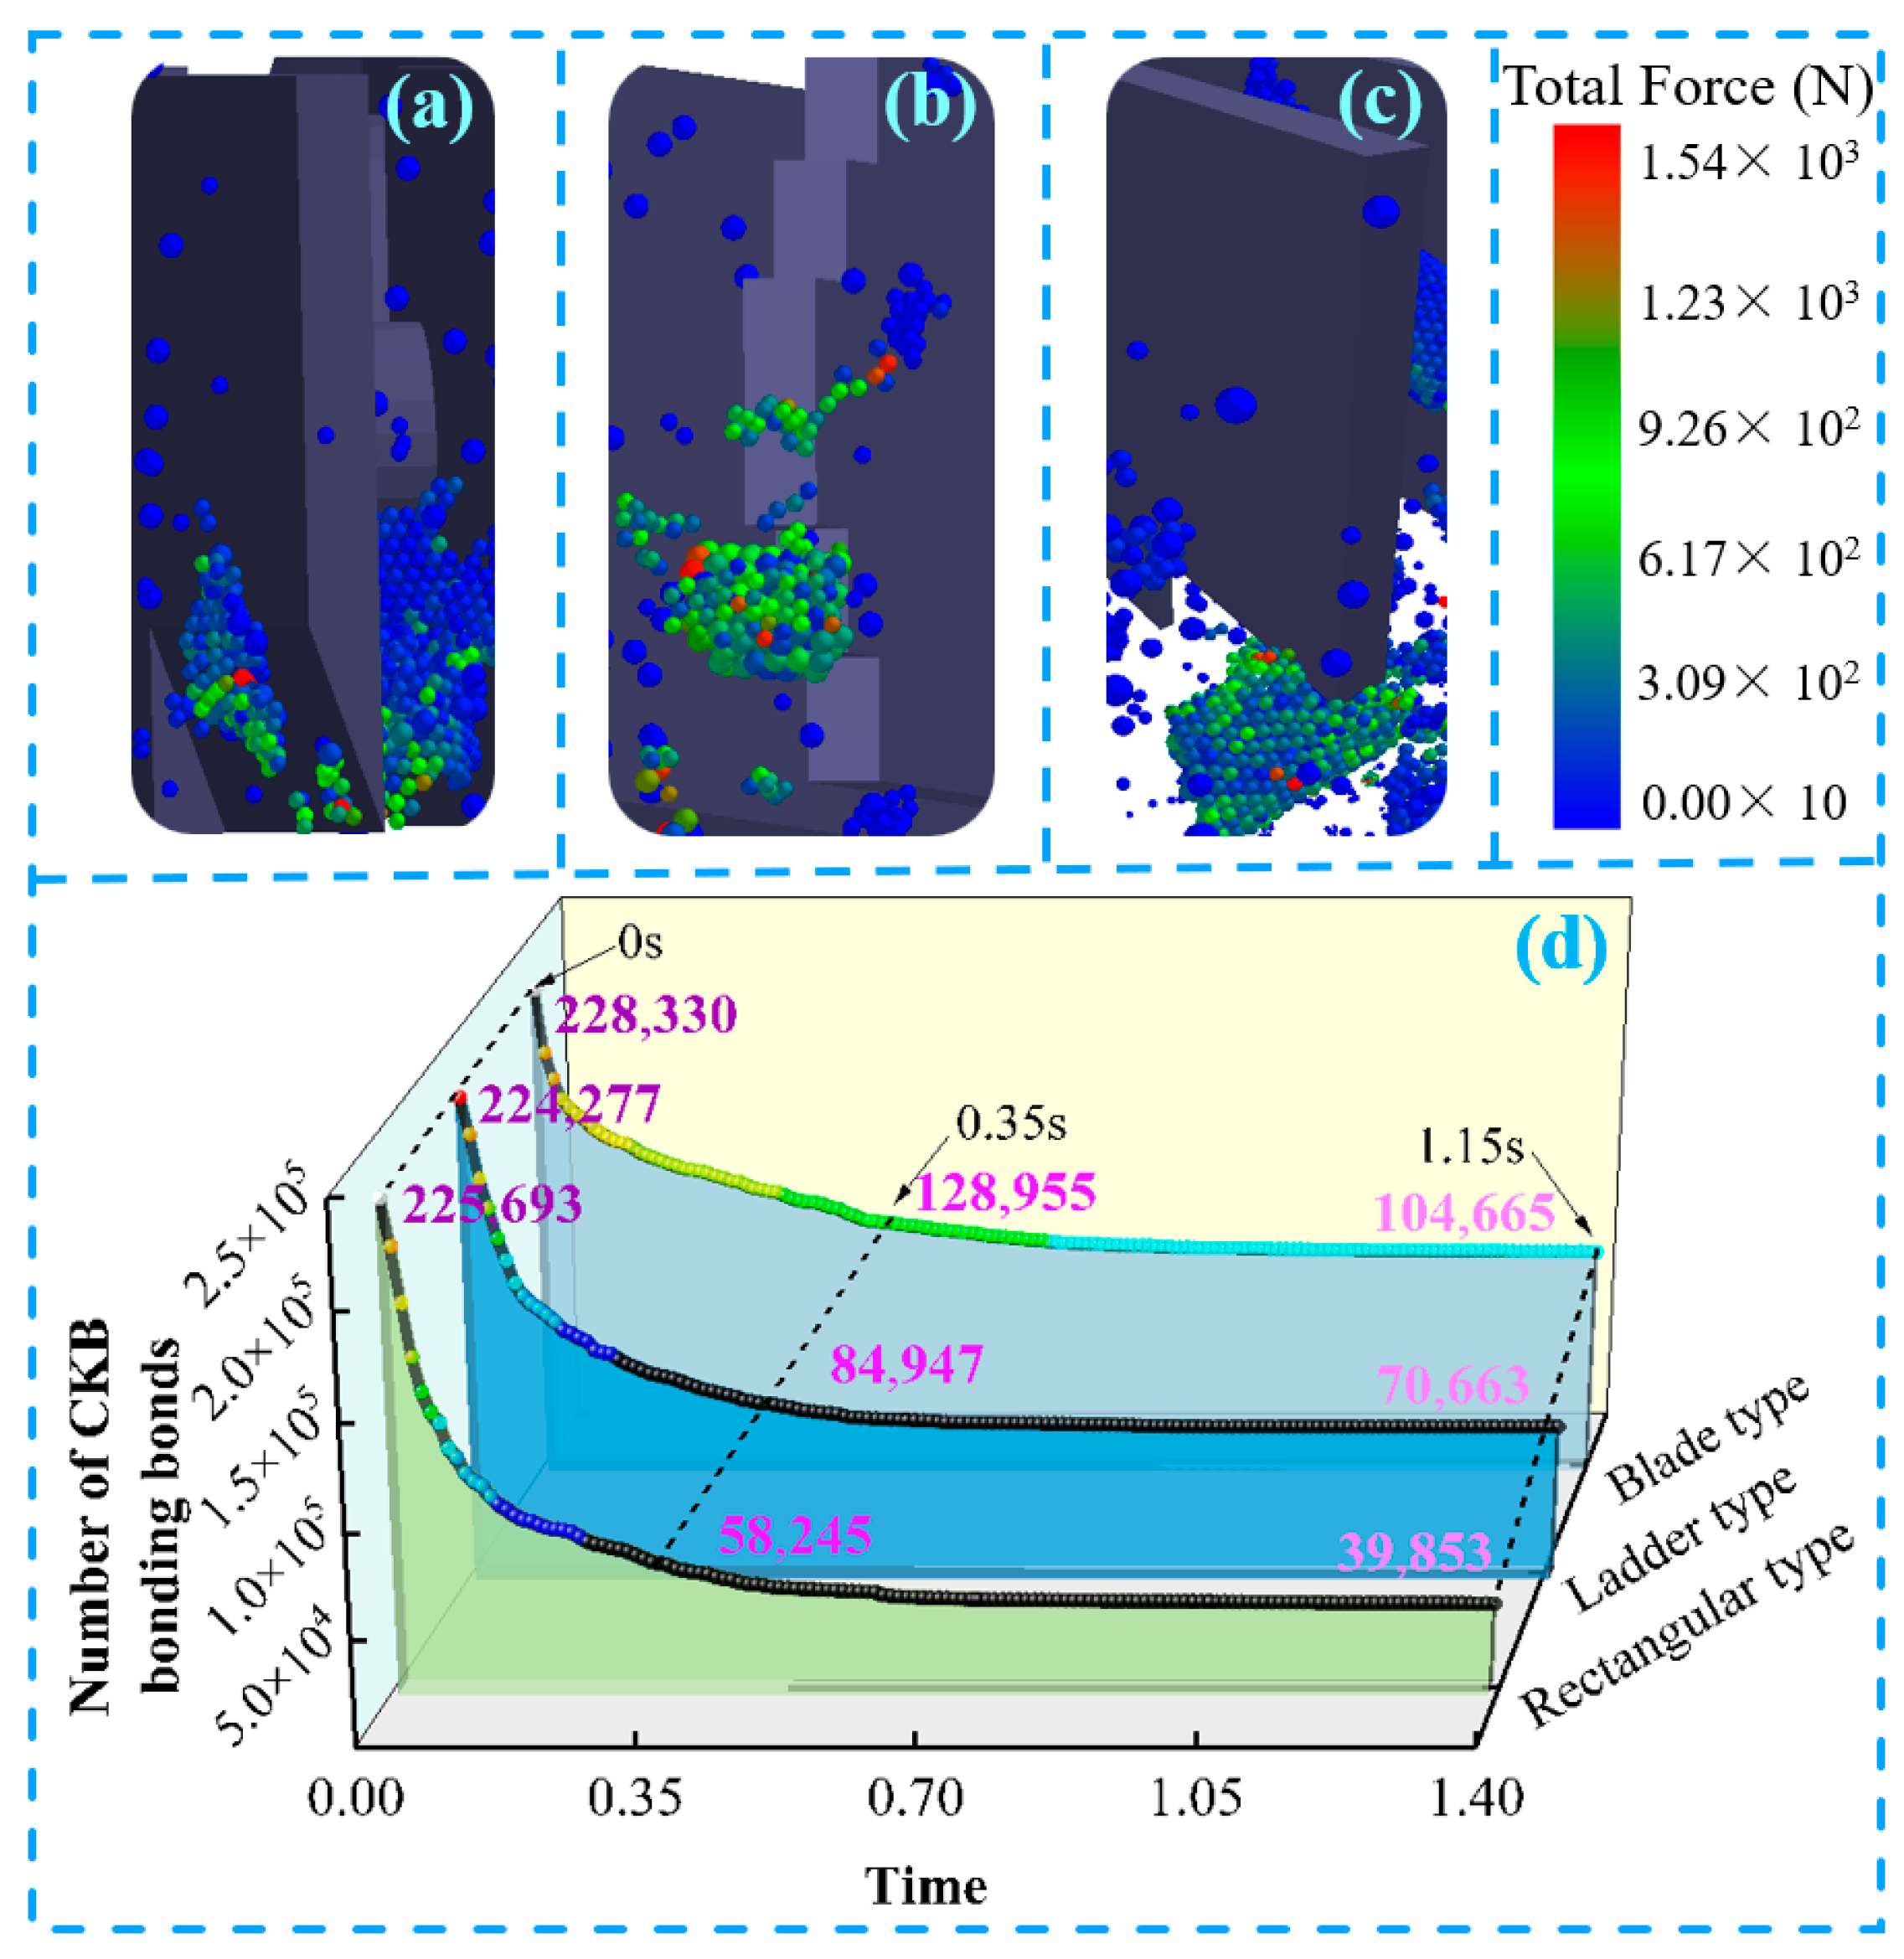
3.6.4. Effect of Different Hammer Blades on Crushing Rate

The three types of hammers showed significant mechanistic differentiation in the crushing process of CKB materials, and their crushing efficiencies and energy transfer modes could be systematically interpreted through the contact interface characteristics and dynamic bonding evolution laws.
As shown in Figure 15a, the sharp-edged hammer blade forms a local high stress concentration area based on the acute-angle geometrical configuration, and the crushing process is dominated by the shearing effect at the leading edge of the edge, which presents a typical cutting dissociation mode due to the small contact area. In contrast, the stepped and rectangular hammers (Figure 15b,c) realize a composite crushing mechanism through an enlarged planar contact interface, where the compressive stress generated by the normal component of the contact surface and the shear strain induced by the shear component act synergistically to significantly enhance the energy transfer efficiency. This difference is further quantified by the dynamic bond evolution data in Figure 15d, where the number of bonds under the action of the rectangular hammer blade plummets to 58,245 at the critical time point of 0.35 s, which is 26.5% and 28.9% less than that of the stepped (79,432) and edged (81,905) types, respectively.
This difference may stem from the wide-domain distribution of the impact load of the rectangular hammers, which is more efficient in disrupting the viscoelastic bonding energy of the CKB material by expanding the range of stresses applied. In the late quasi-steady state phase of crushing (t = 1.15 s), the residual bonding bonds of the rectangular hammer blade group were stable at 23,150, indicating that a more balanced crushing effect was achieved by optimizing the spatiotemporal energy distribution. The results suggest that the geometric features of the hammers can significantly affect the crushing dynamics of viscoelastic materials by regulating the stress field distribution pattern and energy dissipation path.
Building on the current research, future studies will focus on the coupled relationship among hammer plate structure, output particle size distribution, and unit energy consumption. By further introducing an energy-tracking algorithm, the effective crushing energy transmitted to the material by different hammer types (such as straight blade, stepped, and curved) within a unit of time will be analyzed and correlated with the final particle size distribution through modeling, thereby clarifying the synergistic control mechanism between factors such as “structure–energy consumption–particle size.” Additionally, the model will be extended to apply to various types of straw materials (such as corn straw, alfalfa, and sugarcane bagasse) and will be combined with multi-objective optimization methods to explore the parameter domain for optimized hammer design suitable for different biomass materials, aiming to develop a universal silage crushing device with low energy consumption, high efficiency, and controllable particle size.

4. Conclusions

  • This study focuses on the key issues in the crushing process of Caragana korshinskii Kom. during silage processing. A layered aggregate model of the epidermis–core structure was constructed using the discrete element method (DEM), and the Hertz–Mindlin with Bonding contact model was employed to characterize its heterogeneous mechanical properties. Reverse engineering and a multi-particle-size filling strategy were combined to effectively improve the modeling accuracy. Based on the simulation model, the effects of different hammer types and rotational speeds on crushing performance were analyzed. The specific research results are as follows:
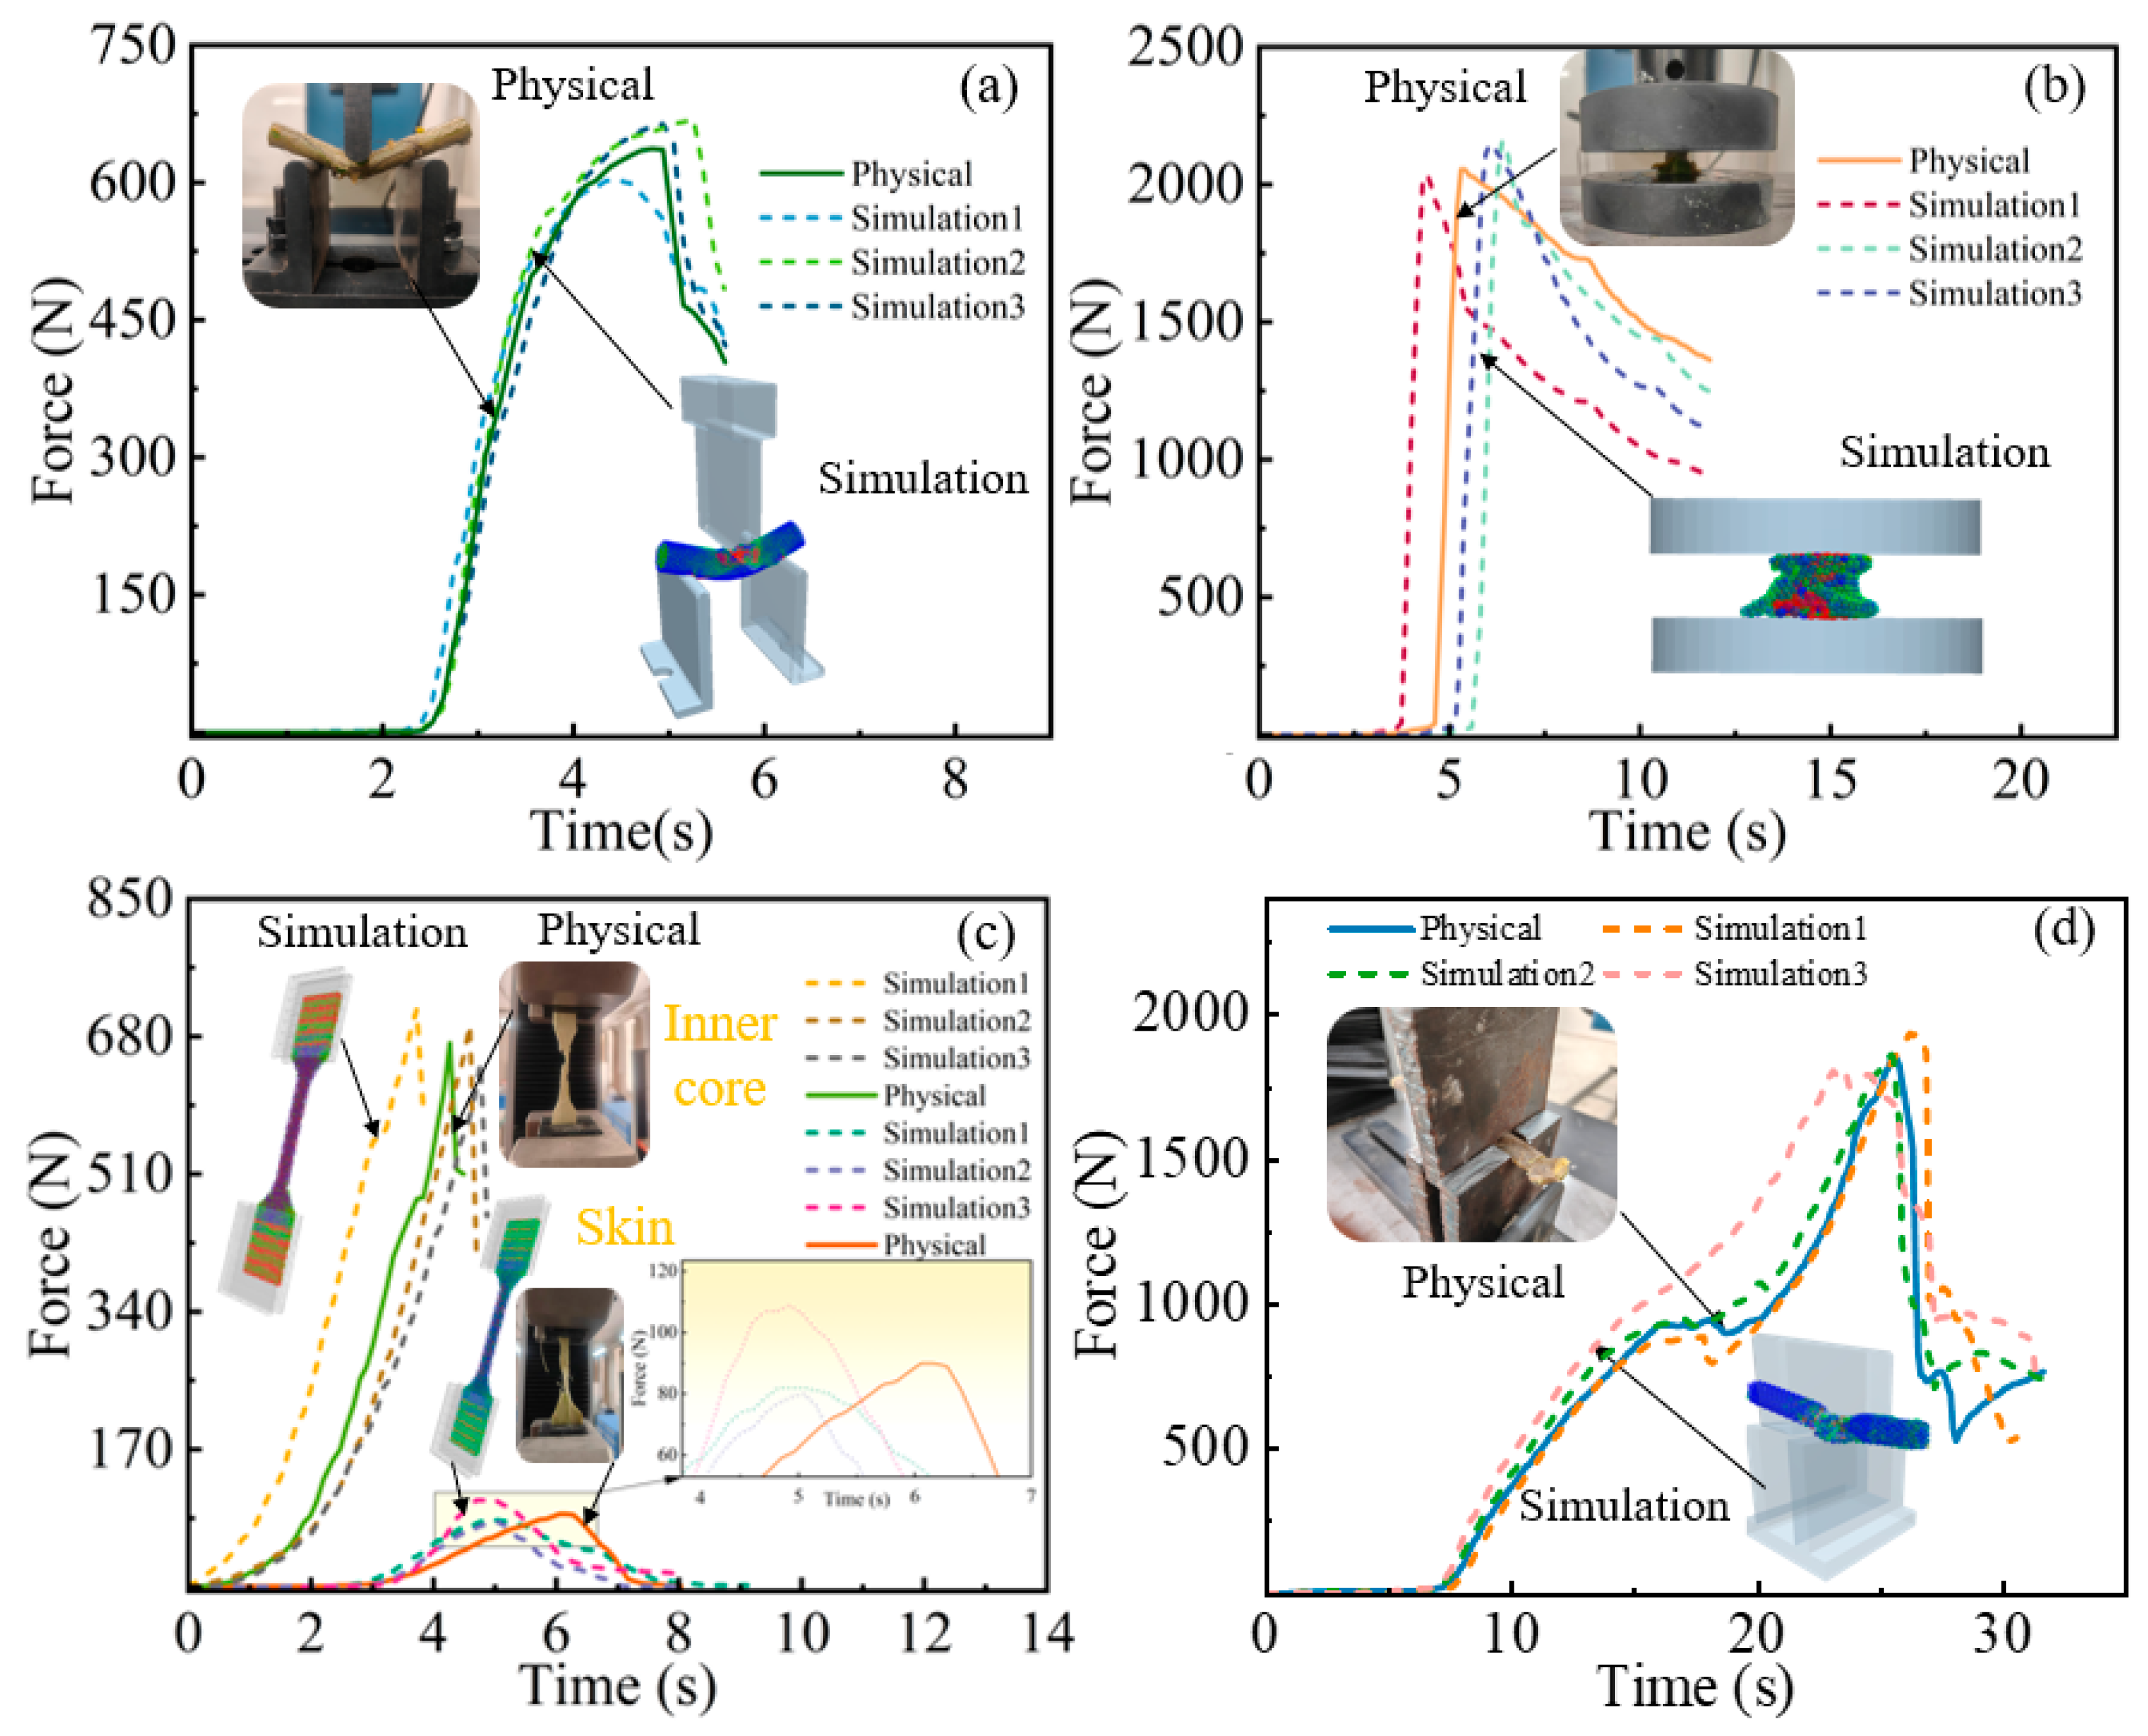
  • The Box–Behnken test was used to establish the second-order regression equation between the bending damage force and the significance parameter, and the measured bending damage force was used as the optimized solution objective to obtain the best combination of simulation parameters, i.e., the inner core normal stiffness (A) is 7.37 × 10¹¹ N·m−1, the inner core shear stiffness (B) is 9.46 × 10¹⁰ N·m−1, the inner core shear stress (D) is 2.52 × 10⁸ Pa, and the skin normal stiffness (E) is 4.01 × 10⁹ N·m−1. The relative error between the simulated and measured bending damage force under the optimal parameter combination is 5.6%, and the errors of both tensile and compression tests are less than 9%, which verifies the accuracy of the model.
  • The rotational speed is positively correlated to the crushing efficiency, and the bond decay rate is the highest at 3500 rpm (ΔN/Δt = 1.25 × 10⁵ s−1). The relative error of the crushing rate between the simulation and the bench test has an average value of 6.18%, and the material distribution pattern is consistent, which verifies the feasibility of the discrete element model in the optimal design of the CKB crushing device, and it can effectively guide the research and development of the crushing equipment with low consumption and high efficiency.
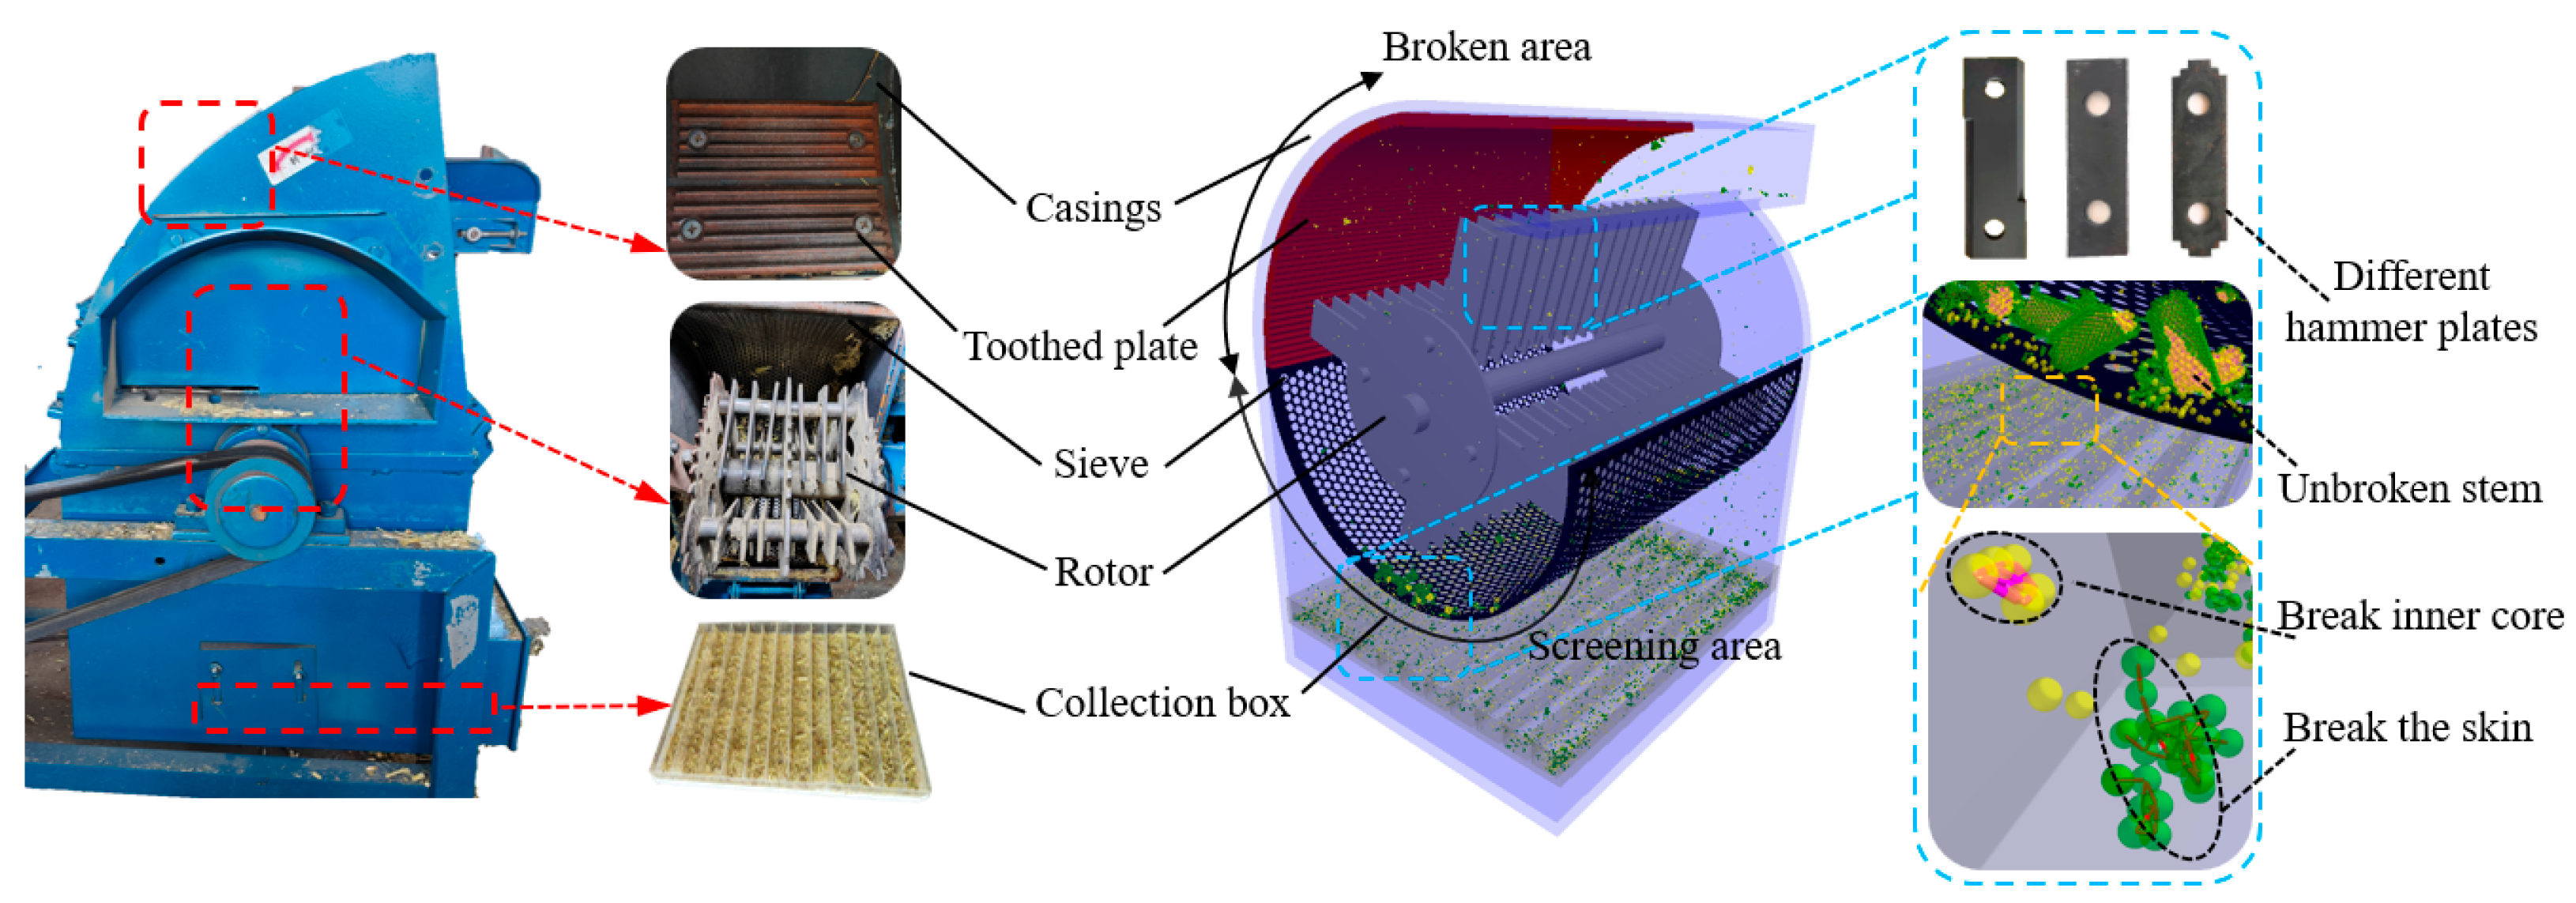
  • The total amount of bonding bonds under the action of rectangular hammers (58,245) is 26.5% and 28.9% lower than that of stepped (79,432) and edged (81,905) hammers, which is more effective in destroying the viscoelastic bonding energy through the composite stress mode. The mass distribution of the crushed material shows a significant radial gradient of tooth plate impact zone > separation end zone > hammer’s initial crushing zone, which provides a key design parameter for the optimization of the annular flow layer structure of the crushing equipment.

Author Contributions

Conceptualization, W.L. and Z.Y.; methodology, W.L.; software, W.L.; validation, W.L.; formal analysis, Z.Y.; investigation, Z.Y.; resources, Z.Y. and A.; data curation, W.L. and Q.S.; writing—original draft preparation, W.L. and Z.L.; writing—review and editing, W.L.; visualization, W.L.; supervision, X.M.; project administration, A. and X.M.; funding, Z.Y. All authors have read and agreed to the published version of the manuscript.

Funding

This work was supported by the National Natural Science Foundation of China (52265035) and the Inner Mongolia Autonomous Region Natural Science Foundation (2022MS05049).

Institutional Review Board Statement

Not applicable.

Data Availability Statement

Data are contained within the article.

Conflicts of Interest

The authors declare no conflicts of interest.

References

  1. Liu, W.; Yu, Z.; Zhu, Q.; Zhou, X.; Peng, C. Assessment of Biomass Utilization Potential of Caragana Korshinskii and Its Effect on Carbon Sequestration on the Northern Shaanxi Loess Plateau, China. Land Degrad. Dev. 2020, 31, 53–64. [Google Scholar] [CrossRef]
  2. Zhao, Y.; Wang, L.; Knighton, J.; Evaristo, J.; Wassen, M. Contrasting Adaptive Strategies by Caragana Korshinskii and Salix Psammophila in a Semiarid Revegetated Ecosystem. Agric. For. Meteorol. 2021, 300, 108323. [Google Scholar] [CrossRef]
  3. Kratky, L.; Jirout, T. Modelling of Particle Size Characteristics and Specific Energy Demand for Mechanical Size Reduction of Wheat Straw by Knife Mill. Biosyst. Eng. 2020, 197, 32–44. [Google Scholar] [CrossRef]
  4. Wang, X.; Tian, H.; Xiao, Z.; Zhao, K.; Li, D.; Wang, D. Numerical Simulation and Experimental Study of Corn Straw Grinding Process Based on Computational Fluid Dynamics–Discrete Element Method. Agriculture 2024, 14, 325. [Google Scholar] [CrossRef]
  5. Yang, X.; Sun, X.; Li, B.; Liu, Y.; Wang, S.; Gao, X.; Dong, Y. Design and Experimental Study of a Cleaning Device for Edible Sunflower Harvesting. Agriculture 2024, 14, 1344. [Google Scholar] [CrossRef]
  6. Lei, X.; Hu, H.; Wu, W.; Liu, H.; Liu, L.; Yang, W.; Zhou, Z.; Ren, W. Seed Motion Characteristics and Seeding Performance of a Centralised Seed Metering System for Rapeseed Investigated by DEM Simulation and Bench Testing. Biosyst. Eng. 2021, 203, 22–33. [Google Scholar] [CrossRef]
  7. Wu, J.; Tang, Q.; Mu, S.; Yang, X.; Jiang, L.; Hu, Z. Design and Test of Self-Leveling System for Cleaning Screen of Grain Combine Harvester. Agriculture 2023, 13, 377. [Google Scholar] [CrossRef]
  8. Zhao, W.; Chen, M.; Xie, J.; Cao, S.; Wu, A.; Wang, Z. Discrete Element Modeling and Physical Experiment Research on the Biomechanical Properties of Cotton Stalk. Comput. Electron. Agric. 2023, 204, 107502. [Google Scholar] [CrossRef]
  9. Jiang, P.; Li, Y.; Li, J.; Meng, H.; Peng, X.; Zhang, B.; He, J.; Kan, Z. Experimental Research on the Bending and Fracture Characteristics of Cotton Stalk. Trans. Asabe 2021, 64, 1771–1779. [Google Scholar] [CrossRef]
  10. Liu, W.; Su, Q.; Fang, M.; Zhang, J.; Zhang, W.; Yu, Z. Parameters Calibration of Discrete Element Model for Corn Straw Cutting Based on Hertz-Mindlin with Bonding. Appl. Sci. 2023, 13, 1156. [Google Scholar] [CrossRef]
  11. Liu, Y.; Li, Y.; Dong, Y.; Huang, M.; Zhang, T.; Cheng, J. Development of a Variable-Diameter Threshing Drum for Rice Combine Harvester Using MBD-DEM Coupling Simulation. Comput. Electron. Agric. 2022, 196, 106859. [Google Scholar] [CrossRef]
  12. Ma, Z.; Traore, S.N.; Zhu, Y.; Li, Y.; Xu, L.; Lu, E.; Li, Y. DEM Simulations and Experiments Investigating of Grain Tank Discharge of a Rice Combine Harvester. Comput. Electron. Agric. 2022, 198, 107060. [Google Scholar] [CrossRef]
  13. Chen, X.; Bai, J.; Wang, X.; Fang, W.; Hong, T.; Zang, N.; Fang, L.; Wang, G. Calibration and Testing of Discrete Elemental Simulation Parameters for Pod Pepper Seeds. Agriculture 2024, 14, 831. [Google Scholar] [CrossRef]
  14. Schramm, M.; Tekeste, M.Z. Wheat Straw Direct Shear Simulation Using Discrete Element Method of Fibrous Bonded Model. Biosyst. Eng. 2022, 213, 1–12. [Google Scholar] [CrossRef]
  15. Li, S.; Huan, X.; Wang, T.; Hui, Y.; You, Y.; Wang, D. Biomechanical Properties and Discrete Element Modeling of PSR Stalks during Silage Harvest. Comput. Electron. Agric. 2024, 217, 108644. [Google Scholar] [CrossRef]
  16. Hu, Y.; Xiang, W.; Duan, Y.; Yan, B.; Ma, L.; Liu, J.; Lyu, J. Calibration of Ramie Stalk Contact Parameters Based on the Discrete Element Method. Agriculture 2023, 13, 1070. [Google Scholar] [CrossRef]
  17. Xu, Y.; Zhang, X.; Wu, S.; Chen, C.; Wang, J.; Yuan, S.; Chen, B.; Li, P.; Xu, R. Numerical Simulation of Particle Motion at Cucumber Straw Grinding Process Based on EDEM. Int. J. Agric. Biol. Eng. 2020, 13, 227–235. [Google Scholar] [CrossRef]
  18. Hu, L.; Zhu, H.; Hua, J. DEM Simulation of Energy Transitions in a Hammer Mill: Effect of Impeller Configurations, Agitation Speed, and Fill Level. Powder Technol. 2021, 394, 1077–1093. [Google Scholar] [CrossRef]
  19. Shi, Y.; Xin, S.; Wang, X.; Hu, Z.; Newman, D.; Ding, W. Numerical Simulation and Field Tests of Minimum-Tillage Planter with Straw Smashing and Strip Laying Based on EDEM Software. Comput. Electron. Agric. 2019, 166, 105021. [Google Scholar] [CrossRef]
  20. Wei, X.; Lei, P.; Pin, J.; De, M. Discrete Element Model Building and Optimization of Double-layer Bonding of Rape Shoots Stems at Harvest Stage. Trans. Chin. Soc. Agric. Mach. 2023, 54, 112–120. (In Chinese) [Google Scholar]
  21. Peng, C.; Chen, J.; He, X.; Sun, S.; Yin, Y.; Chen, Z. Discrete Element Modeling and Verification of the Simulation Parameters for Chopped Hybrid Broussonetia Papyrifera Stems. Int. J. Agric. Biol. Eng. 2024, 17, 23–32. [Google Scholar] [CrossRef]
  22. Wang, S.; Yu, Z.; Aorigele; Zhang, W. Study on the Modeling Method of Sunflower Seed Particles Based on the Discrete Element Method. Comput. Electron. Agric. 2022, 198, 107012. [Google Scholar] [CrossRef]
  23. Shu, Z.; Gong, S.; Yun, S. Simulation optimization and experiment of separation device for ramie stalks based on discrete element method. J. Chin. Agric. Mech. 2017, 38, 60–67. [Google Scholar]
  24. Yu, L.; Feng, Z.; Song, X.F.; Wang, F.; Zhang, F.Y.; Li, X.Z.; Cao, X.Q. Study on mechanical properties for corn straw of double-layer bonding model based on discrete element method. J. Northeast Agric. Univ. 2022, 53, 45–54. [Google Scholar]
  25. Su, Y.; Xu, Y.; Cui, T.; Gao, X.; Xia, G.; Li, Y.; Qiao, M. Determination and Interpretation of Bonded-Particle Model Parameters for Simulation of Maize Kernels. Biosyst. Eng. 2021, 210, 193–205. [Google Scholar] [CrossRef]
  26. Ren, J.; Wu, T.; Mo, W.; Li, K.; Hu, P.; Xu, F.; Liu, Q. Discrete Element Simulation Modeling Method and Parameters Calibration of Sugarcane Leaves. Agronomy 2022, 12, 1796. [Google Scholar] [CrossRef]
  27. Yi, L.; Zai, W.; Qing, L.; Xing, W.; Yu, Z. Calibration of Discrete Element Model Parameters of Forage Rape Stalk at Early Pod Stage. Trans. Chin. Soc. Agric. Mach. 2020, 51, 236–243. (In Chinese) [Google Scholar]
  28. Kun, W.; Yue, S. Research Progress Analysis of Crop Stalk Cutting Theory and Method. Trans. Chin. Soc. Agric. Mach. 2020, 53, 1–20. (In Chinese) [Google Scholar]
  29. Su, Q.; Ma, X.; Liu, W.; Zhang, J.; Yu, Z.; Liu, Z. Elastoplastic fracture behavior of Caragana korshinskii Kom. branches: A discrete element model for biomechanical insights into shrub resource utilization. Front. Plant Sci. 2025, 16, 1590054. [Google Scholar] [CrossRef]
  30. Chen, X.; Wang, X.; Bai, J.; Fang, W.; Hong, T.; Zang, N.; Wang, G. Virtual Parameter Calibration of Pod Pepper Seeds Based on Discrete Element Simulation. Heliyon 2024, 10, 31686. [Google Scholar] [CrossRef]
  31. Guo, J.; Karkee, M.; Yang, Z.; Fu, H.; Li, J.; Jiang, Y.; Jiang, T.; Liu, E.; Duan, J. Discrete Element Modeling and Physical Experiment Research on the Biomechanical Properties of Banana Bunch Stalk for Postharvest Machine Development. Comput. Electron. Agric. 2021, 188, 106308. [Google Scholar] [CrossRef]
  32. Zhang, J.; Zhang, P.; Zhang, H.; Tan, C.; Wan, W. Calibration of Simulation Parameters of Xinjiang Cotton Straw Based on Discrete Element Method. Trans. Chin. Soc. Agric. Mach. 2024, 55, 76–84. [Google Scholar]
  33. Leblicq, T.; Smeets, B.; Vanmaercke, S.; Ramon, H.; Saeys, W. A Discrete Element Approach for Modelling Bendable Crop Stems. Comput. Electron. Agric. 2016, 124, 141–149. [Google Scholar] [CrossRef]
  34. Liu, F.; Zhang, J.; Chen, J. Modeling of Flexible Wheat Straw by Discrete Element Method and Its Parameters Calibration. Int. J. Agric. Biol. Eng. 2018, 11, 42–46. [Google Scholar] [CrossRef]
  35. Kovács, Á.; Kerényi, G. Physical Characteristics and Mechanical Behaviour of Maize Stalks for Machine Development. Int. Agrophys. 2019, 33, 427–436. [Google Scholar] [CrossRef]
  36. Kim, Y.-S.; Lee, S.-D.; Baek, S.-M.; Baek, S.-Y.; Jeon, H.-H.; Lee, J.-H.; Siddique, M.A.A.; Kim, Y.-J.; Kim, W.-S.; Sim, T.; et al. Development of DEM-MBD Coupling Model for Draft Force Prediction of Agricultural Tractor with Plowing Depth. Comput. Electron. Agric. 2022, 202, 107405. [Google Scholar] [CrossRef]
  37. Liu, F.; Zhang, J. Modeling Flexible Wheat Straw by DEM and its Parameter Calibration. Int. J. Agric. Biol. Eng. 2018, 11, 42–46. [Google Scholar]
Figure 1. Schematic diagram of CKB growth and specimen sampling.
Agriculture 15 01449 g001
Figure 2. CKB discrete metamodel construction process.
Agriculture 15 01449 g002
Figure 3. Bonding contact model. Here, R1 is the physical radius of particle 1, mm; R2 is the physical radius of particle 2, mm; Rcontact1 is the contact radius of particle 1, mm; Rcontact2 is the contact radius of particle 2, mm; Rn is the radius of the bonding bond, mm; Fn is the normal force, N; Ft is the shear force, N; Mn is the normal moment, N·m−1; Mt is shear moment, N·m−1; and Ln is bond axial length, mm.
Agriculture 15 01449 g003
Figure 4. Specimens and test rigs for different loading methods. (a) Test schematic diagram; (b) Physical test; (c) Universal test bench.
Agriculture 15 01449 g004
Figure 5. Simulated bending test.
Agriculture 15 01449 g005
Figure 6. CKB crush simulation schematic.
Agriculture 15 01449 g006
Figure 7. Prediction of the damage evolution process of CKB under bending force. (a) Physical test destructive force curve; (b) Simulation test destructive force curve.
Agriculture 15 01449 g007
Figure 8. Half-normal and Pareto charts of orthogonal test results of NN.
Agriculture 15 01449 g008
Figure 9. Effect of interaction terms on bending destructive forces.
Agriculture 15 01449 g009
Figure 10. Comparison of simulation test and mechanical test results. (a) Comparison of Bending tests; (b) Comparison of Compression tests; (c) Comparison of Tensile Tests; (d) Comparison of Shear tests.
Agriculture 15 01449 g010
Figure 11. Comparison of simulation test and mechanical test results. Comparison of DEM simulation and physical test for CKB crushing rate.
Agriculture 15 01449 g011
Figure 12. Comparison of particle distribution in different regions. (a) Collection from different regions; (b) Collection from simulation tests; (c) Collection from physical tests.
Agriculture 15 01449 g012
Figure 13. The quality distribution of CKB after crushing. (a) Material distribution at different rotational speeds; (b) Material distribution at different hammer pieces.
Agriculture 15 01449 g013
Figure 14. Variation in the number of bonding bonds during the simulated crushing process with different hammer blades. (a) Changes in the number of bonding bonds at different speeds; (b) Changes in energy consumption at different speeds.
Agriculture 15 01449 g014
Figure 15. Bending test setup and geometric model. (a) the blade type hammer; (b) the ladder type hammer; (c) the rectangular type hammer; (d) The variation of the number of bonding bonds under different hammer pieces.
Agriculture 15 01449 g015
Table 1. Plackett–Burman test factor coding table.
ParametersMeansCode
−11
AInner core–inner core normal stiffness/(N·m−1)1.8 × 10119.81 × 1011
BInner core–inner core shear stiffness/(N·m−1)1.7 × 10109.71 × 1010
CInner core–inner core normal stress/Pa5.5 × 1071.3 × 108
DInner core–inner core shear stress/Pa6.5 × 1073.1 × 108
ESkin–skin normal stiffness/(N·m−1)6.4 × 1085.2 × 109
FSkin–skin shear stiffness/(N·m−1)6.8 × 1075.9 × 108
GSkin–skin normal stress/Pa5.4 × 1062.8 × 107
HSkin–skin shear stress/Pa5.4 × 1052.8 × 106
Table 2. Plackett–Burman test results.
No.ABCDEFGHFb/N
11−1111−1−1−1565
2−11−111−111990
31−111−1111502
4111−1−1−11−1307
5−1−1−11−111−1480
611−1111−1−1690
7−1−1−1−1−1−1−1−1314
8−1−11−1111−1507
911−1−1−11−11338
1011−1−11−111308
11−1−11−111−11378
12−1−111−1−1−11818
Table 3. Box–Behnken significance level parameter table.
CodeABDE
−15.81 × 10115.71 × 10101.88 × 1082.92 × 109
07.81 × 10117.71 × 10102.49 × 1084.06 × 109
19.81 × 10119.71 × 10103.10 × 1085.20 × 109
Table 4. Box–Behnken test simulation parameters and results.
No.ABDEFb/N
100−11405
210−11373.8
310−10519.4
4−1−100647.6
50011581
6−1010646
70110657
8−1100569.8
900−1−1515.2
100−10−1475.8
110−101536.8
121010585
130000481.5
14−100−1540
1501−10481.1
160000576.8
171100606.3
180−110451.7
190000579.7
201−100380.1
21100−1549.3
220101421.9
23010−1699.6
240−1−10516.3
25−1001647
26001−1585.6
27−10−10578.4
Table 5. Plackett–Burman test analysis of variance.
SourceSum of SquaresdfMean SquareF-Valuep-Value
Model5.212 × 105865,148.4226.350.0106 *significant
A-A50,310.75150,310.7520.350.0204 *
B-B1.014 × 10511.014 × 10541.000.0077 **
C-C154.081154.080.06230.8190
D-D2.986 × 10512.986 × 105120.780.0016 **
E-E38,420.08138,420.0815.540.0291 *
F-F13,804.08113,804.085.580.0991
G-G6.7516.750.00270.9616
H-H18,486.75118,486.757.480.0717
Residual7417.5832472.53
Cor Total5.286 × 10511
Note: * indicates that the term is significant, p < 0.05; ** indicates that the term is highly significant, p < 0.01; coefficient of determination R2 = 0.9860; adjusted determination coefficient R2 adj = 0.9485.
Table 6. Steepest climb test method and results of contact parameters.
No.X1X2X4X5Fb/N
11.80 × 10111.70 × 10106.50 × 1076.40 × 108431
23.80 × 10113.70 × 10101.26 × 1081.78 × 109742
35.81 × 10115.71 × 10101.88 × 1082.92 × 109680
47.81 × 10117.71 × 10102.49 × 1084.06 × 109649
59.81 × 10119.71 × 10103.10 × 1085.20 × 109589
Table 7. Box—Behnken experimental analysis of variance.
Source of
Variation
Mean Sum of SquaresDegree of FreedomMean
Square
F-Valuep-Value
Model1.765 × 1051412,607.606.380.0013 **
A32,434.36132,434.3616.410.0016 **
B18,205.23118,205.239.210.0104 *
D18,714.18118,714.189.470.0096 **
E1442.4111442.410.72980.4097
AB29,584.00129,584.0014.970.0022 **
AD161.221161.220.08160.7800
AE15,473.99115,473.997.830.0161 *
BD25,680.06125,680.0612.990.0036 **
BE16,731.42116,731.428.470.0131 *
DE396.111396.110.20040.6624
A2490.691490.690.24830.6273
B22590.1812590.181.310.2746
D20.912210.91220.00050.9832
E2249.681249.680.12630.7284
Residual23,716.85121976.40
Lack of Fit17,472.27101747.230.55960.7830
Pure Error6244.5823122.29
Cor Total2.002 × 10526
Note: ** indicates extremely significant impact (p < 0.01), * indicates significant impact (p < 0.05).
Table 8. Simulation verification test results when obtaining the optimal combination of b.
No.Relative Error of Bending Destructive Force/%Relative Error of Axial Compression Force/%Relative Error of Shear ForceRelative Error of Tensile Breaking Force/%
Inner CoreSkin
15.0%4.5%6.1%6.3%8.5%
24.0%4.0%5.2%3.4%8.9%
35.6%2.1%3.8%3.6%9.6%
Disclaimer/Publisher’s Note: The statements, opinions and data contained in all publications are solely those of the individual author(s) and contributor(s) and not of MDPI and/or the editor(s). MDPI and/or the editor(s) disclaim responsibility for any injury to people or property resulting from any ideas, methods, instructions or products referred to in the content.

