Article

Soybean Fermentation Broth Value-Added Phosphorus Fertilizer Boosts Crop Growth via Improved Soil Phosphorus Availability and Rhizosphere Microbial Activity

College of Natural Resources and Environment, South China Agricultural University, Guangzhou 510642, China
*
Author to whom correspondence should be addressed.
Agriculture 2025, 15(13), 1440; https://doi.org/10.3390/agriculture15131440
Submission received: 23 May 2025 / Revised: 24 June 2025 / Accepted: 2 July 2025 / Published: 4 July 2025
(This article belongs to the Section Agricultural Soils)

Abstract

Excessive application of phosphate fertilizers exacerbates water pollution, while the low phosphorus availability in acidic soils results in diminished phosphorus utilization efficiency of crops. This study conducted a maize pot experiment to investigate the effects of soybean fermentation broth value-added phosphorus fertilizer (SFB-VAPF) on soil phosphorus availability and microbial communities in acidic lateritic red soils during the 31-day seedling stage to determine its growth promotion efficacy. Conducted in Guangzhou, China, under greenhouse conditions, the experimental design comprised 11 treatments: CK (no fertilizer), treatments with P alone at two levels (0.05 and 0.15 g·kg−1), and eight SFB-VAPF treatments combining each P level with four dilutions of soybean fermentation broth (SFB; 100-, 300-, 500-, and 700-fold dilutions). Each treatment had five replications. Application of SFB-VAPF significantly improved the soil chemical attributes, enzyme activities, and promoted maize growth and nutrient accumulation. Compared to the high-P treatments (0.15 g·kg−1 P), low-P SFB-VAPF demonstrated superior enhancement of the soil organic matter (SOM), available nutrients, maize biomass, and nutrient accumulation. The treatment combining 0.05 g·kg−1 P and 100-fold diluted SFB significantly increased the acid phosphatase activity (ACP) by 28.01% and the AP content by 69.63%, while achieving the highest maize biomass. Although SFB-VAPF application reduced the microbial species richness, the combinations of low P with high SFB and high P with low SFB enhanced both the community structural diversity and distribution evenness. SFB-VAPF application reduced the abundance of Alphaproteobacteria, while the Gammaproteobacteria abundance significantly increased in the low-P SFB-VAPF groups. The microbial beta diversity analysis demonstrated that combining 0.05 g·kg−1 P with SFB significantly altered the microbial community structure. The key driving factors included soil EC and SOM, AP, Al-P, and Fe-P contents, with AP content exerting an extremely significant influence on the bacterial community composition and structure (p ≤ 0.001). This study demonstrates that SFB-VAPF enhances soil phosphorus availability, and improves the structural diversity and distribution evenness of microbial communities, thereby promoting crop growth. Critically, SFB synergistically enhances the efficiency of low-concentration phosphorus fertilizers.

1. Introduction

Phosphorus, an essential nutrient for plant growth and development, participates in the formation of biological macromolecules such as nucleic acids, phospholipids, and ATP. Additionally, P promotes root development and reproductive growth and enhances stress resistance through metabolic regulation [1]. However, it is estimated that over 40% of the world’s cultivated land suffers from low P availability [2]. It is generally believed that in acidic soils, phosphates are gradually converted into highly crystalline Fe–P and Al–P via ligand exchange [3,4], which makes the available P content of the soil lower than the critical value for crops. The utilization rate of traditional phosphate fertilizers is only 5% to 25% [5]. Excessive application of phosphorus fertilizers not only leads to the waste of phosphate rock resources but also triggers environmental pollution issues such as eutrophication [6]. In this context, how to activate the soil’s inherent P pool and improve P utilization efficiency through environmentally friendly technologies has become the key to sustainable agricultural development.
Proteins and peptides in organic matter are easily degraded by soil microorganisms into small-molecular-weight amino acids that can be directly absorbed by plants, which makes them potential sources of plant-available nutrients [7]. With the development of the chemical industry, the methods for using waste resources such as animal blood, dairy waste, and plant trimmings to extract various amino acids to make amino acid fertilizers and enhancers are becoming increasingly diverse [8,9]. Numerous studies have shown that the use of amino acid fertilizers as additional fertilizers or amino acid-based synergists can effectively improve plant resistance [10,11]; increase the efficiency of plant uptake of nitrogen, phosphorus, potassium, and other nutrients; and improve the quality of agricultural products [12].
Notably, exogenous amino acids also can activate soil P pools by indirectly modulating the microbial metabolic networks. Soil microorganisms can directly take up small-molecule amino acids from soil as carbon or nitrogen sources [13]. When amino acids are used as carbon sources, microorganisms can remove α-amino nitrogen through deamidation or transamidation after transporting amino acids into cells and use them to obtain energy or synthesize lipids in the form of pyruvic acid [14,15]. When amino acids are used as a nitrogen source, microorganisms convert them into other amino acids or synthesize them into macromolecular organic materials such as proteins and purines after taking them up into their cells [16]. Microorganisms are highly active in absorbing amino acids, and as many as 12 kinetically related amino acid transport systems have been found in bacteria [13]. Additionally, microorganisms play a crucial role in the soil phosphorus cycle [17]. The P transformation process mediated by microorganisms mainly involves three major gene groups: genes involved in inorganic P solubilization and organic P mineralization, genes responsible for P uptake and transport, and gene groups regulating the P starvation response [18]. Among them, microorganisms possessing genes related to inorganic P solubilization and organic P mineralization can solubilize inorganic P through the release of organic anions or secretion of enzymes to mineralize organic P [19,20].
Studies have shown that agricultural byproduct fermentation broths exhibit unique advantages in improving soil nutrient conditions due to their richness in amino acids, functional enzymes, and microbial metabolites [21,22]. As an important economic crop, soybean processing byproducts can produce small-molecule amino acids such as glutamic acid and aspartic acid, as well as bioactive substances like peptides, through microbial fermentation. However, previous studies on amino acid synergists have mainly focused on extracting and concentrating amino acids and did not fully and efficiently utilize the waste. Moreover, the existing studies still lack systematic investigations of the synergistic mechanism of soybean fermentation broth in the soil–microbe–plant system, especially in red soil regions, where the phosphorus activation and synergistic mechanism remains unclear, and for phosphorus-sensitive gramineous plants like maize.
Previous studies have confirmed that amino acids can bind with phosphorus to form phosphoramide bonds (O=P-N) [23]. We hypothesize that amino acids produced by the fermentation of soybean by-products may have a certain relationship with P, thereby enhancing the bioavailability of phosphorus. Additionally, they may act as organic matter to improve the soil environment, thus promoting plant growth.
Maize is a phosphorus-sensitive crop, with the first phosphorus-sensitive period being the V6 stage, followed immediately by the V10 stage. Application of P fertilizer at the V6 stage is beneficial for increasing the maize biomass and P content [24], whereas P deficiency at the nodulation stage (V10 stage) affects maize cob formation, and even if supplemental P fertilizer is initiated at this time, it will ultimately have a negative impact on the maize yield [25].
Therefore, this study focused on the acidic lateritic red soil in southern China as the research object. Using maize as the test material and through pot experiments with maize at the seedling stage, the study systematically analyzed the influence mechanism of soybean fermentation broth on the transformation of soil phosphorus forms, phosphatase activity, and phosphorus uptake by the maize. It emphasized the regulatory role of soybean fermentation broth on the structure of rhizosphere microbial communities, and, combined with high-throughput sequencing technology, aimed to clarify the functional response characteristics of rhizosphere bacterial communities. This study innovatively combined the resource utilization of soybean fermentation broth with phosphate fertilizer synergism, proposing a new scheme for enhancing phosphorus nutrition in red soil. It considers both environmental sustainability and agricultural production efficiency.

2. Materials and Methods

2.1. Test Material

The test fertilizers included soybean fermentation broth (SFB, purchased from Jinbang Biotechnology Co., Ltd., Rizhao, China; basic properties: 4% amino acids, 1% total N, 2.24% total P, and 0.022% total K) and KH2PO4 (trial P source containing 52.2% P2O5). The maize cultivar used in the trial was Zhen 958. The N fertilizers and K fertilizers used were CO(NH2)2, KH2PO4, and KCl. The test soil was taken from the experimental base of South China Agricultural University (without any additional treatment); it is characterized as reddish soil, with the following basic chemical properties: pH of 5.70, electrical conductivity (EC) of 0.5 mS/cm, soil organic matter (SOM) content of 8.01 g·kg−1, alkaline hydrolyzable nitrogen (AHN) content of 45.59 mg·kg−1, available phosphorus (AP) content of 0.94 mg·kg−1, and available potassium (AK) content of 24 mg·kg−1.

2.2. Experimental Design

The SFB was diluted at a certain time point and added to P fertilizers with different concentrations of P (maintaining the total water volume at 100 mL). After thorough mixing, the mixture was applied during the V6 stage of maize (the first critical period for P fertilizer application). The potted plants were watered the evening before the experiment, and then a single leaching was conducted the next morning when the soil was slightly moist. The SFB was diluted 100-, 300-, 500-, and 700-fold, and the fertilizer P levels were 0.05 g·kg−1 and 0.15 g·kg−1. The experiment included 11 treatments: CK, the L group (5 treatments: L0, L1, L3, L5, L7, and L0 without SFB), and H group (5 treatments: H0, H1, H3, H5, H7, and H0 without SFB). Table 1 shows the treatment combinations with different concentrations and fertilizer application rates.
The two-phase pre-test in spring 2024 (April–June) and the formal trial in fall 2024 (October–November) were conducted at the No. 21 Experimental Greenhouse of the College of Resources and Environment, South China Agricultural University (23°09′31.70″ N, 113°21′45.85″ E). During the experiment, the greenhouse had a maximum temperature of 31 °C, minimum temperature of 20 °C, average temperature of 25.5 °C, and average relative humidity of 76.3%. We used plastic pots (diameter: 27.5 cm; bottom diameter: 22 cm; height: 31 cm) for the experiment. For each treatment, we set up 5 replicates, with one plant and 4 kg of soil per pot, and randomly arranged all the treatments.

2.3. Sample Collection and Measurements

The agronomic traits and nutrient content of the maize, including plant height (cm), stem diameter (mm), SPAD (chlorophyll content expressed in SPAD units), fresh weight (g), root total length (cm), and surface area (cm2) were measured on the 35th day after transplanting. Plant height was measured using a tape measure, stem diameter (at 1 cm above the substrate) was measured using a Vernier caliper, and SPAD values were measured using a chlorophyll meter (SPAD-502). After harvesting, the plant stems and roots were cleaned, air-dried until the surface was dry, and then weighed with a balance to determine the fresh weight. Root surface area and total length was determined using a root analyzer (RHIZO 2008 Operator). The total NPK content was determined using the automatic Kjeldahl method for the nitrogen content, the vanadium–molybdenum yellow colorimetric method for the phosphorus content, and a flame spectrophotometer for the potassium content.
The soil samples for analysis were first air-dried, and then sieved through a 2 mm mesh to ensure uniformity. Electrical conductivity (EC) and pH were measured using a glass electrode with a soil–water mixture (soil/water = 1:2.5). The Soil Organic Matter (SOM), alkaline hydrolyzable nitrogen (AHN), available potassium (AK), and available phosphorus (AP) contents were determined using the potassium dichromate–concentrated sulfuric acid external heating method, the alkaline hydrolytic diffusion technique, NH4OAC extraction-flame photometry, and NH4F-HCl extraction–molybdenum antimony colorimetry, respectively. The soil Al-P and Fe-P contents were measured using Chang’s soil inorganic phosphorus fractionation method [26]. Acid phosphatase (ACP) activity was determined using a Solarbio kit (BC0145; Solarbio Technology Co., Ltd., Beijing, China) and urease (URE) activity was measured via the indigo colorimetric method.
The microbial diversity of the maize rhizosphere soil was measured by 16S rDNA high-throughput sequencing. The specific steps were as follows: total soil DNA was extracted using the MJ-soil DNA kit (Yu Hua Co., Ltd., Shanghai, China); the extracted genomic DNA was detected by 1% agarose gel electrophoresis; the bacterial 16SrRNA gene was amplified by PCR using the 338F/806R primers; after the PCR products were purified, quantified, and normalized, the PE library was constructed and then analyzed by the Illumina MiSeq platform (Majorbio Bio-Pharm Technology Co., Ltd., Shanghai, China). Microbial species composition, alpha diversity, beta diversity, differential species, and the effects of environmental factors on the soil community structure were analyzed using the Majorbio Cloud Platform (https://cloud.majorbio.com, accessed on 30 January 2025).

2.4. Data Analysis

The experimental data were processed with Excel 2019 and analyzed (ANOVA, significance test) using SPSS 27, and the differences between the treatments were evaluated using Duncan’s multiple comparisons (p < 0.05). All data are from the formal experiment and are presented as the mean ± standard deviation (SEM) unless otherwise specified. The plots were generated using Origin 2024b.

3. Results and Discussions

3.1. Soil Chemical Attributes

From the soil chemical attributes presented in Table 2. The application of soybean fermentation broth-value-added phosphorus fertilizer (SFB-VAPF) significantly improved the soil chemical attributes in the maize pots. Compared to treatment with P fertilizer alone, the soil pH in the L group increased significantly by 1.31–2.89%, with the highest increase observed with L1. In the H group, the soil pH was significantly higher in three of the four treatments (H3, H5, and H7) than in H0, with an increase of 2.53–6.17%, indicating that the application of SFB as an amino acid synergist can effectively mitigate soil acidification caused by chemical P fertilizers. This pH elevation could be attributed to the hydrolysis of carboxyl groups on amino acids, which generate anions, enabling amino acids to chelate soil cations and thereby raise the soil pH [27]. Zhang et al. also reported a significant rise in soil pH after amino acid application in their study on the effects of amino acids on plant growth [28]. The EC value serves as a salinity indicator. An excessive salt content can severely impact plant growth and the soil–water balance. A range of 0–0.9 dS·m−1 is generally acceptable for the growth of most crops [29], and in this experiment, the EC values of all the treatments fell within this range.
Furthermore, SFB-VAPF application effectively increased the SOM, AHN, AK, and AP contents. Compared with L0, the increases in the SOM and AHN contents in the L group reached 6.82–31.37% and 12.73–47.01%, respectively, consistently exceeding those observed in the H group. This demonstrates that SFB can improve soil fertility by supplying nitrogen and organic carbon sources. Additionally, SFB stimulates microbially mediated nutrient bio-fixation, minimizes leaching losses, and facilitates biological nutrient transformation in soils [30]. In acidic soils, when the SOM and AK contents range from 10 to 30 g·kg−1 and 60 to 100 mg·kg−1, respectively, the soil is classified as a medium fertility level and can adequately support crop growth [31].
Notably, the SFB-VAPF had an obvious promotion effect on soil P transformation. In acidic soil, Al-P and Fe-P are potential sources of AP [32,33]. The SFB-VAPF treatments exhibited 34.7–69.63% and 4.29–22.94% higher Al-P and Fe-P contents than the single P-fertilizer treatments (L0 and H0) in the L and H groups, respectively, with the highest AP content in L1. This demonstrates the SFB-VAPF’s capacity to promote the conversion of soil AP and increase the bioavailable nutrients under the lower input of P fertilizer. Mechanistically, amino acid-fortified phosphorus fertilizers elevate the soil AP content [34] and reduce soil fixation of P through the formation of phosphoramidite (O=P-N) with the addition of P fertilizers [23], which are the key to improving phosphorus fertilizer utilization and promoting plant growth.

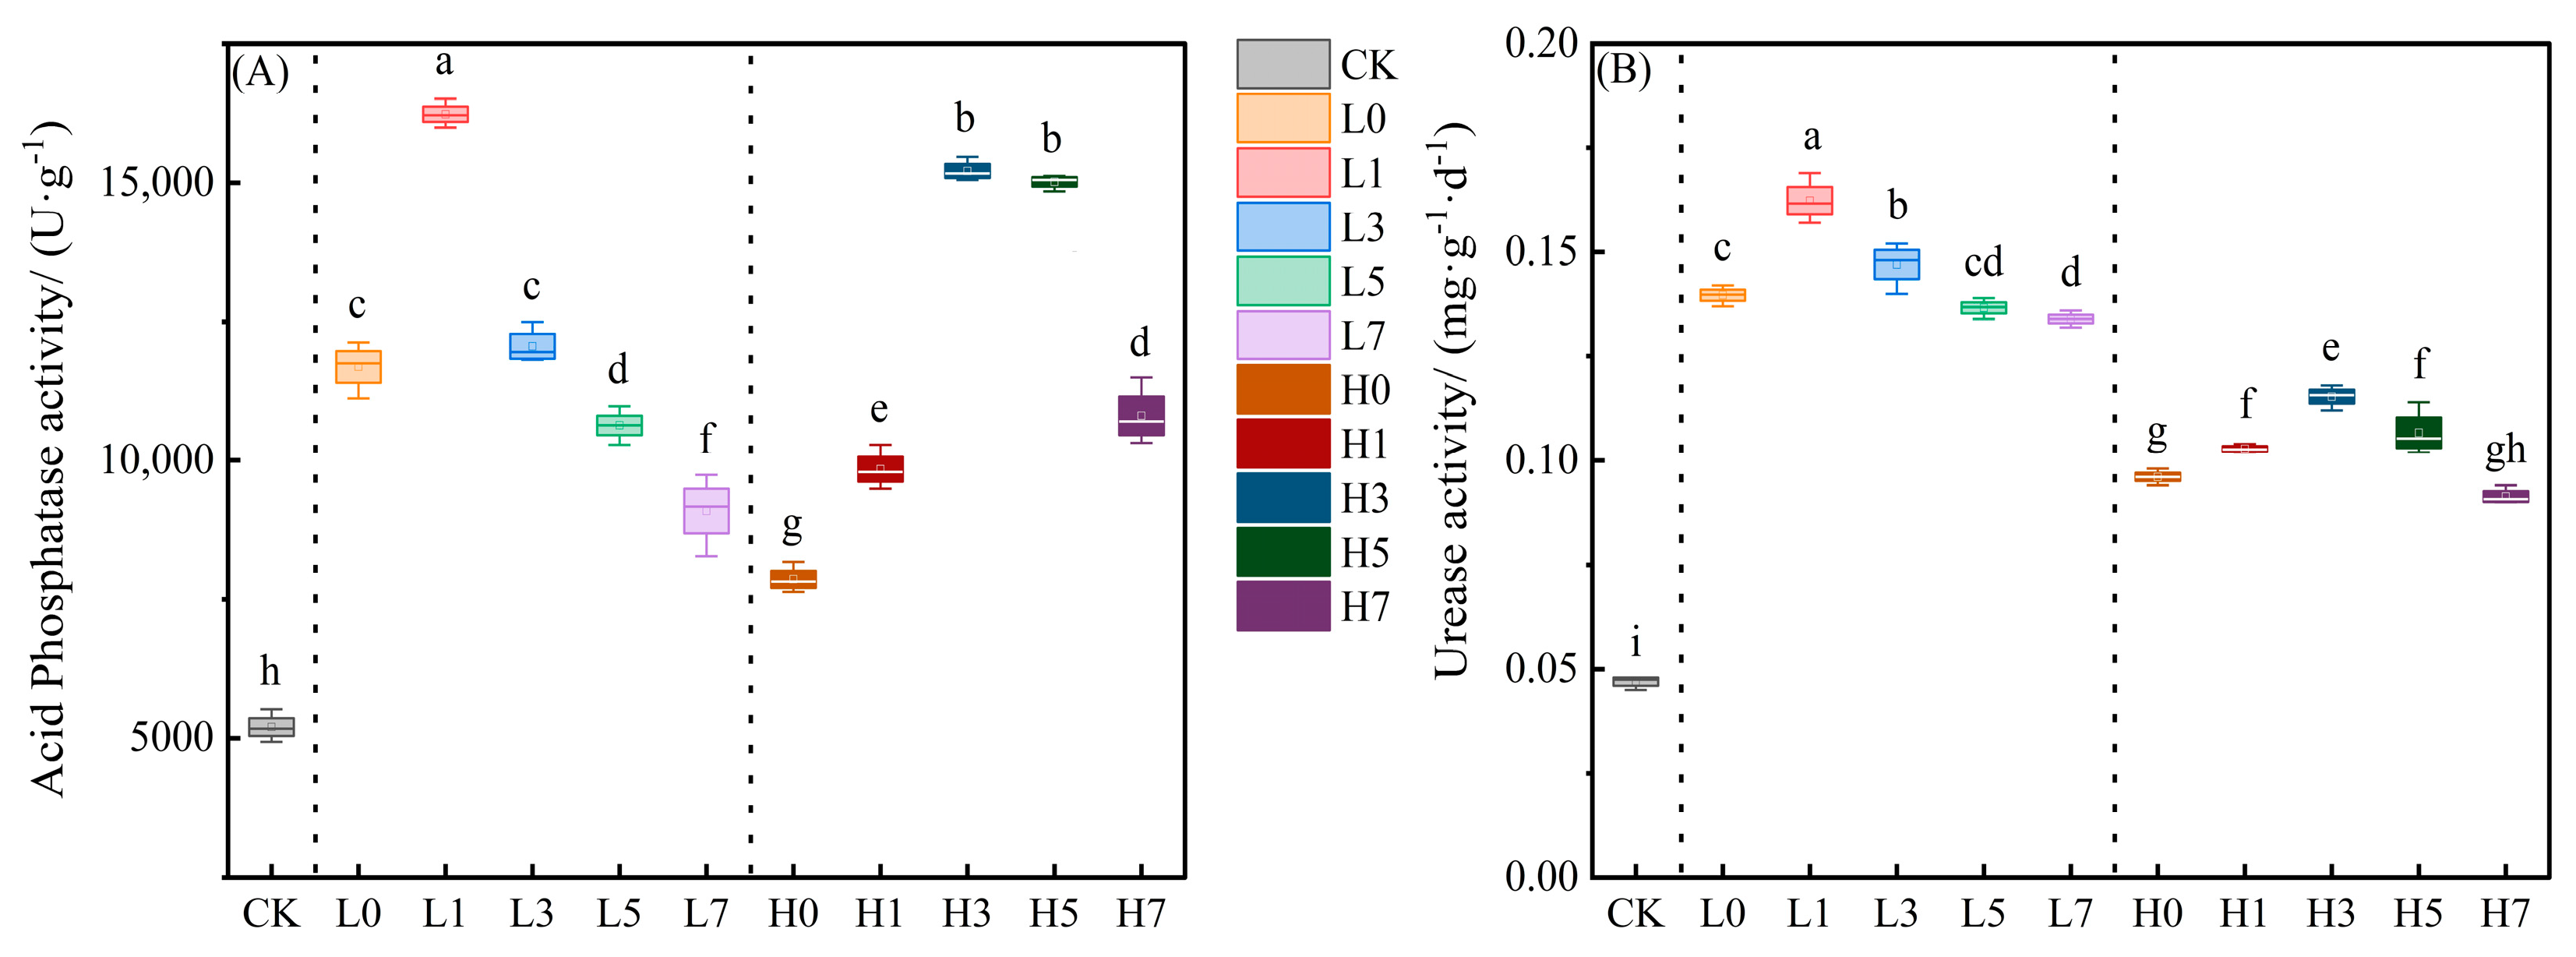
3.2. Soil Acid Phosphatase (ACP) and Urease (URE) Activities

As shown in Figure 1, SFB-VAPF application was beneficial for increasing the activities of soil ACP and URE. Compared to treatment with P fertilizer alone, L1 demonstrated the most pronounced stimulation of soil ACP and URE activities, showing increases of 28.01% and 13.96%. L1 also exhibited the highest AP content elevation (Table 2). This suggests that one of the ways through which SFB-VAPF promotes the increase in soil AP content is by enhancing soil enzyme activity.
Soil phosphatases, which are secreted by plants and fungi, hydrolyze phospholipid bonds (organic P) and insoluble phosphate compounds, thereby elevating the soluble phosphorus levels in soil to enhance plant P uptake [2]. Phosphatase activity is extremely sensitive to changes in soil environmental factors, such as soil organic matter and pH [35]. In the plant rhizosphere, increases in Al-P and Fe-P can stimulate fungi to produce more phosphatase [36]. In addition, the SOM content is significantly correlated with phosphatase activity [37]. Organic fertilizer application can enhance acid phosphatase activity, particularly in soils with a low inorganic phosphorus content [38], a phenomenon potentially linked to soil pH alterations induced by P fertilizer application [39]. The lower concentration of P fertilizer with SFB increased the soil pH and SOM content (Table 2), which promoted the increase in ACP activity, which in turn promoted soil P nutrient transformation and improved P availability. SFB-VAPF is rich in amino acids and peptides, which can promote an increase in URE activity to hydrolyze N applied to the soil, which in turn leads to an increase in the soil pH [35].

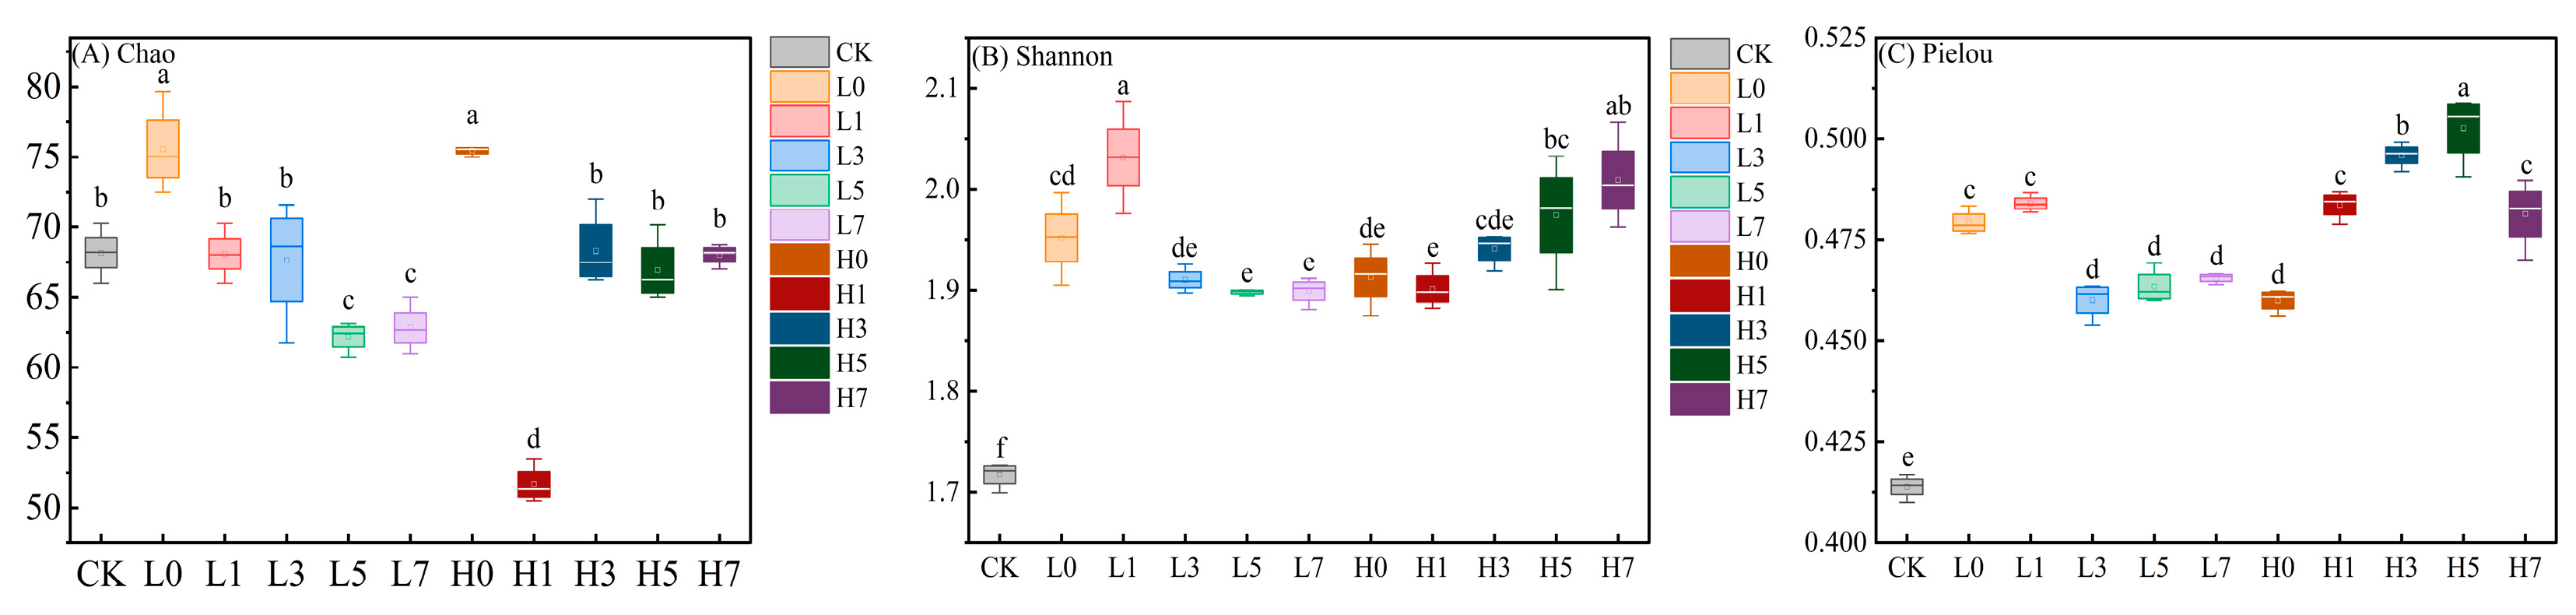
3.3. Soil Microbial Diversity

The microbial community diversity was analyzed for each treatment using Venn analysis (Figure 2A) and alpha diversity indices (Figure 3). The Venn analysis showed that at the OTU level, the number of common species was 668 among the treatments, while the number of unique species showed different degrees of variation. Among the alpha diversity indices, the Chao index indicates species richness and is sensitive to changes in rare species [40]; the Shannon index is used to measure the diversity of the community; and the Pielou index indicates the evenness of the community. In CK, the number of unique OTUs was 93, and the Chao, Shannon, and Pielou indices were 68.17, 1.72, and 0.41, respectively. These values established the baseline for the microbial diversity in the untreated soil.
In the L group, SFB application reduced the unique OTU counts and Chao indices relative to L0, while the Shannon and Pielou indices declined in L3, L5, and L7. This implies that SFB may reduce the abundances of soil-specific sensitive taxa and reduce the overall community diversity and evenness. It is worth noting that the Shannon and Pielou indices were slightly higher in L1 compared to L0, indicating a more even distribution of the remaining species, suppression of the original dominant species, homogenization of the community, and a slight increase in the overall diversity due to the increase in evenness.
In the H group, SFB application slightly increased the unique OTUs counts compared to H0 (which only slightly different from CK), yet reduced the Chao index across all the treatments. This indicates that SFB combined with high-P fertilizer can attenuate the reduction in the number of unique species in the soil, but it still reduced the number of rare species and decreased the species richness. Conversely, the elevated Shannon index and Pielou index demonstrate that SFB application under a high P concentration can increase the community diversity and distribution evenness. High-P fertilizer may exert a more selective pressure on microorganisms by altering the soil pH or osmotic pressure, while the addition of SFB may alleviate this pressure by providing a carbon source or buffering effect.
In addition, we found that SFB application reduced both species richness and endemic OUT counts, which are potentially linked to the balance of NPK in the soil. Although SFB promotes the effectiveness of soil nutrients, it is rich in amino acids and other nutrients, which may cause a temporary imbalance of soil nutrients in the case when P fertilizer is also added. The application time and method may also have an effect in a short period of time [41], potentially reducing the richness of soil microorganism species. The integrated analysis revealed that applying a high concentration of SFB and a low concentration of P fertilizer and a low concentration of SFB with a high concentration of P fertilizer had a promoting effect on the diversity and distribution evenness of the microbial communities. Therefore, SFB, as a fertilizer enhancer applied exogenously to the soil, may positively affect microbial diversity by regulating the community structure and species distribution.
The Circos analysis and heatmap analysis results showed the trends in the species composition with the different treatments (Figure 2B,C). Alphaproteobacteria, Gammaproteobacteria, and Actinobacteria were the three most dominant species, with average abundances of 35.27%, 23.91%, and 13.18%, respectively. The abundance of Alphaproteobacteria decreased in all the treatments compared to CK, while the abundance of Gammaproteobacteria increased to varying degrees. Researchers have found that the nitrogen fixation efficiency of rhizobia is regulated by the microbial abundance rather than microbial diversity, and that nitrogen-fixing genes (e.g., nifH genes) are predominantly distributed in Alphaproteobacteria [42].
Proteobacteria, which are among the most abundant prokaryotes [43], encompass Alphaproteobacteria as the major group. Many species in this group play important roles in soil, such as Rhizobium, Bradyrhizobium, Mesorhizobium, and other rhizobacteria, which are able to fix atmospheric nitrogen and convert it into plant-available NH4+-N [44]. However, while the SFB treatments showed slightly higher Alphaproteobacteria abundances than the P-only treatment, it remained lower than that of CK. This may be because the amino-acid-rich SFB provides nitrogen that can be directly absorbed and utilized for plant growth. When the soil N supply is sufficient, plants are more inclined to directly use the N in the soil rather than rely symbiotic nitrogen fixation [45], thus reducing the abundance of nitrogen-fixing bacteria. In addition, the relative abundance of the microbiota in this taxon may be affected by the soil pH, which was found to increase to different degrees in all the treatments compared to CK, while the relative abundance of some Alphaproteobacteria bacterial groups decreased with the increase in soil pH [46].
Gammaproteobacteria, which evolved from Alphaproteobacteria [47,48], is the largest class within Proteobacteria. Members of this class exhibit a wide range of aerobic and nutritive properties, including chemoautotrophic and photosynthetic autotrophic traits [49]. In the L group, applying SFB increased the abundance of Gammaproteobacteria compared with L0, whereas the H group exhibited the opposite trend. This discrepancy may be due to the SFB providing a carbon source and soil organic P, alleviating the low P stress and promoting the metabolic activity of Gammaproteobacteria. Under low P conditions, Gammaproteobacteria may dominate the ecological niche via chemoautotrophy or efficient utilization of organic carbon. In contrast, under high P levels, excessive input of P fertilizers may cause a relative carbon shortage in soil, preventing Gammaproteobacteria from meeting their carbon demand, leading to growth inhibition. Additionally, a higher P concentration may promote the proliferation of other phosphorus-preferring bacteria, thus crowding out the survival space of Gammaproteobacteria [50].

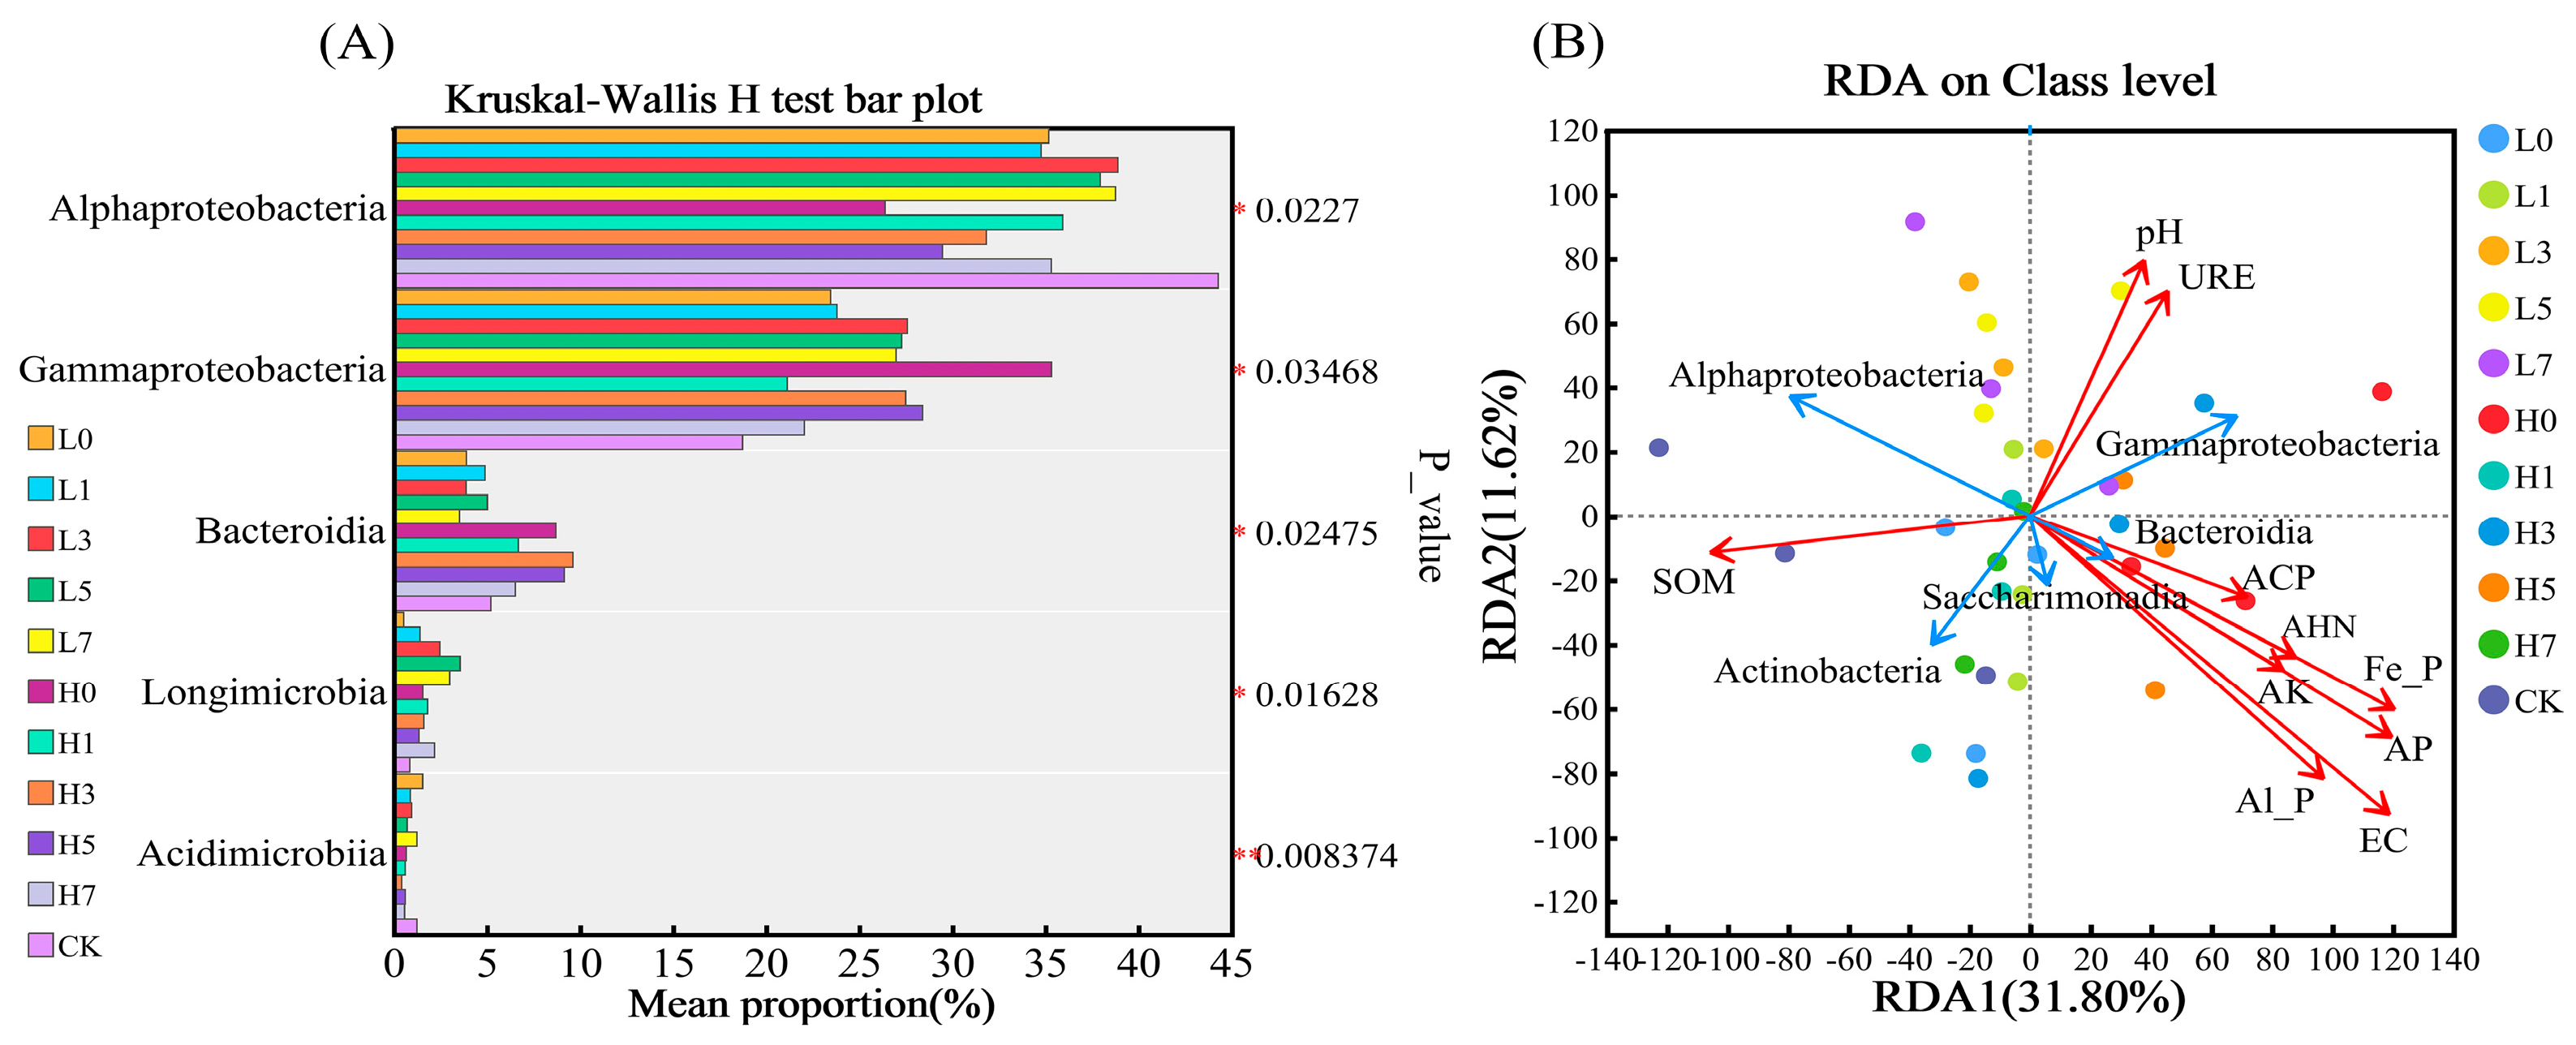
3.4. Soil Microbial Community Structure

Microbial beta diversity is an important metric for understanding the distribution of and changes in microbial communities under different environmental conditions. This study evaluated the effects of CK and SFB-VAPF on the bacterial community structure in the maize rhizosphere using principal component analysis (PCA) based on Euclidean distances and principal coordinate analysis (PCoA) based on Bray–Curtis distances. The results showed that the CK and L groups were clearly separated, indicating that applying SFB with 0.05 g·kg−1 P significantly altered the structure of the microbial communities (Figure 4). Notably, CK and L0 overlapped at this application level, further confirming that the SFB application significantly influenced the structural composition of the microbial communities.
The intergroup significance test analyzed whether the microbial composition differed between the CK and treatment groups and identified microorganisms with significant differences (Figure 5). Alphaproteobacteria, Gammaproteobacteria, Bacteroidia, Longimicrobia, and Acidimicrobiia exhibited significant differences between the treatments, with Acidimicrobiia showing a very significant difference. These microorganisms with difference abundances may be keystone species that respond to environmental changes. The redundancy analysis (RDA) of the environmental factors indicated that soil EC and SOM, AP, Al-P, and Fe-P contents were the key factors influencing the soil community structure (p ≤ 0.05, Figure 5). Specifically, the SOM content showed positive correlations with Actinobacteria and Alphaproteobacteria, suggesting that SOM promotes the abundance of these two taxa. Gammaproteobacteria, Bacteroidia, and Saccharimonadia correlated positively with EC and the AHN, AK, AP, Al-P, Fe-P, and ACP contents; additionally, Gammaproteobacteria also showed positive correlations with soil pH and URE activity, significantly contributing to their increased abundance.
Appropriate concentrations of SFB-VAPF enhanced the diversity and evenness of beneficial soil microorganisms, largely due to the improved soil conditions. Additionally, the RDA revealed that the AP content significantly influenced the bacterial community composition and structure (p ≤ 0.001). Among the various soil attributes, AP content exhibits a close relationship with bacterial communities and plays a key role in driving microbial growth [51]. SFB-VAPF may stimulate soil enzyme activities and influence the abundance of microbial communities by promoting soil nutrient cycling, particularly by enhancing phosphorus availability. SFB supplies abundant carboxyl groups to facilitate the solubilization of soil insoluble salts and compete with Al3+ and Fe3+ for phosphate adsorption sites in the soil [52]. Additionally, ACP activity has been shown to be the more critical form of phosphatase activity in acidic soils [38]. Phosphate-solubilizing microorganisms convert soil-fixed phosphorus into bioavailable forms by secreting ACP [53], thereby increasing phosphorus availability.
Our results showed that SFB with 0.05 g·kg−1 P fertilizer increased the abundance of Gammaproteobacteria. ACP is mainly encoded by the phoC gene [54]. In acidic soils, microorganisms that possess the phoC gene include Bradyrhizobium, Stenotrophomonas, Xanthomonas, Klebsiella, Yersinia, Pantoea, and Pseudomonas [55]. Bradyrhizobium predominantly occurs in Alphaproteobacteria and the others are mainly found in Gammaproteobacteria [49,56]. The RDA results indicated a positive correlation between Alphaproteobacteria and SOM content, but negative or no correlations between Alphaproteobacteria and the other soil attributes (Figure 5). This suggests that although Alphaproteobacteria are influenced by the SOM content, EC and other soil attributes are the key factors affecting their abundance, leading to a decrease in their abundance with the addition of SFB or P fertilizer. Additionally, we observed that the Alphaproteobacteria abundance increased when treated with SFB and 0.05 g kg−1 P fertilizer but decreased when treated with SFB and 0.15 g kg−1 P fertilizer. This demonstrates the importance of SFB in improving soil environmental conditions and enhancing microbial community abundance and evenness—specifically, low P levels in acidic soils support the growth of microorganisms carrying the phoC gene [57].

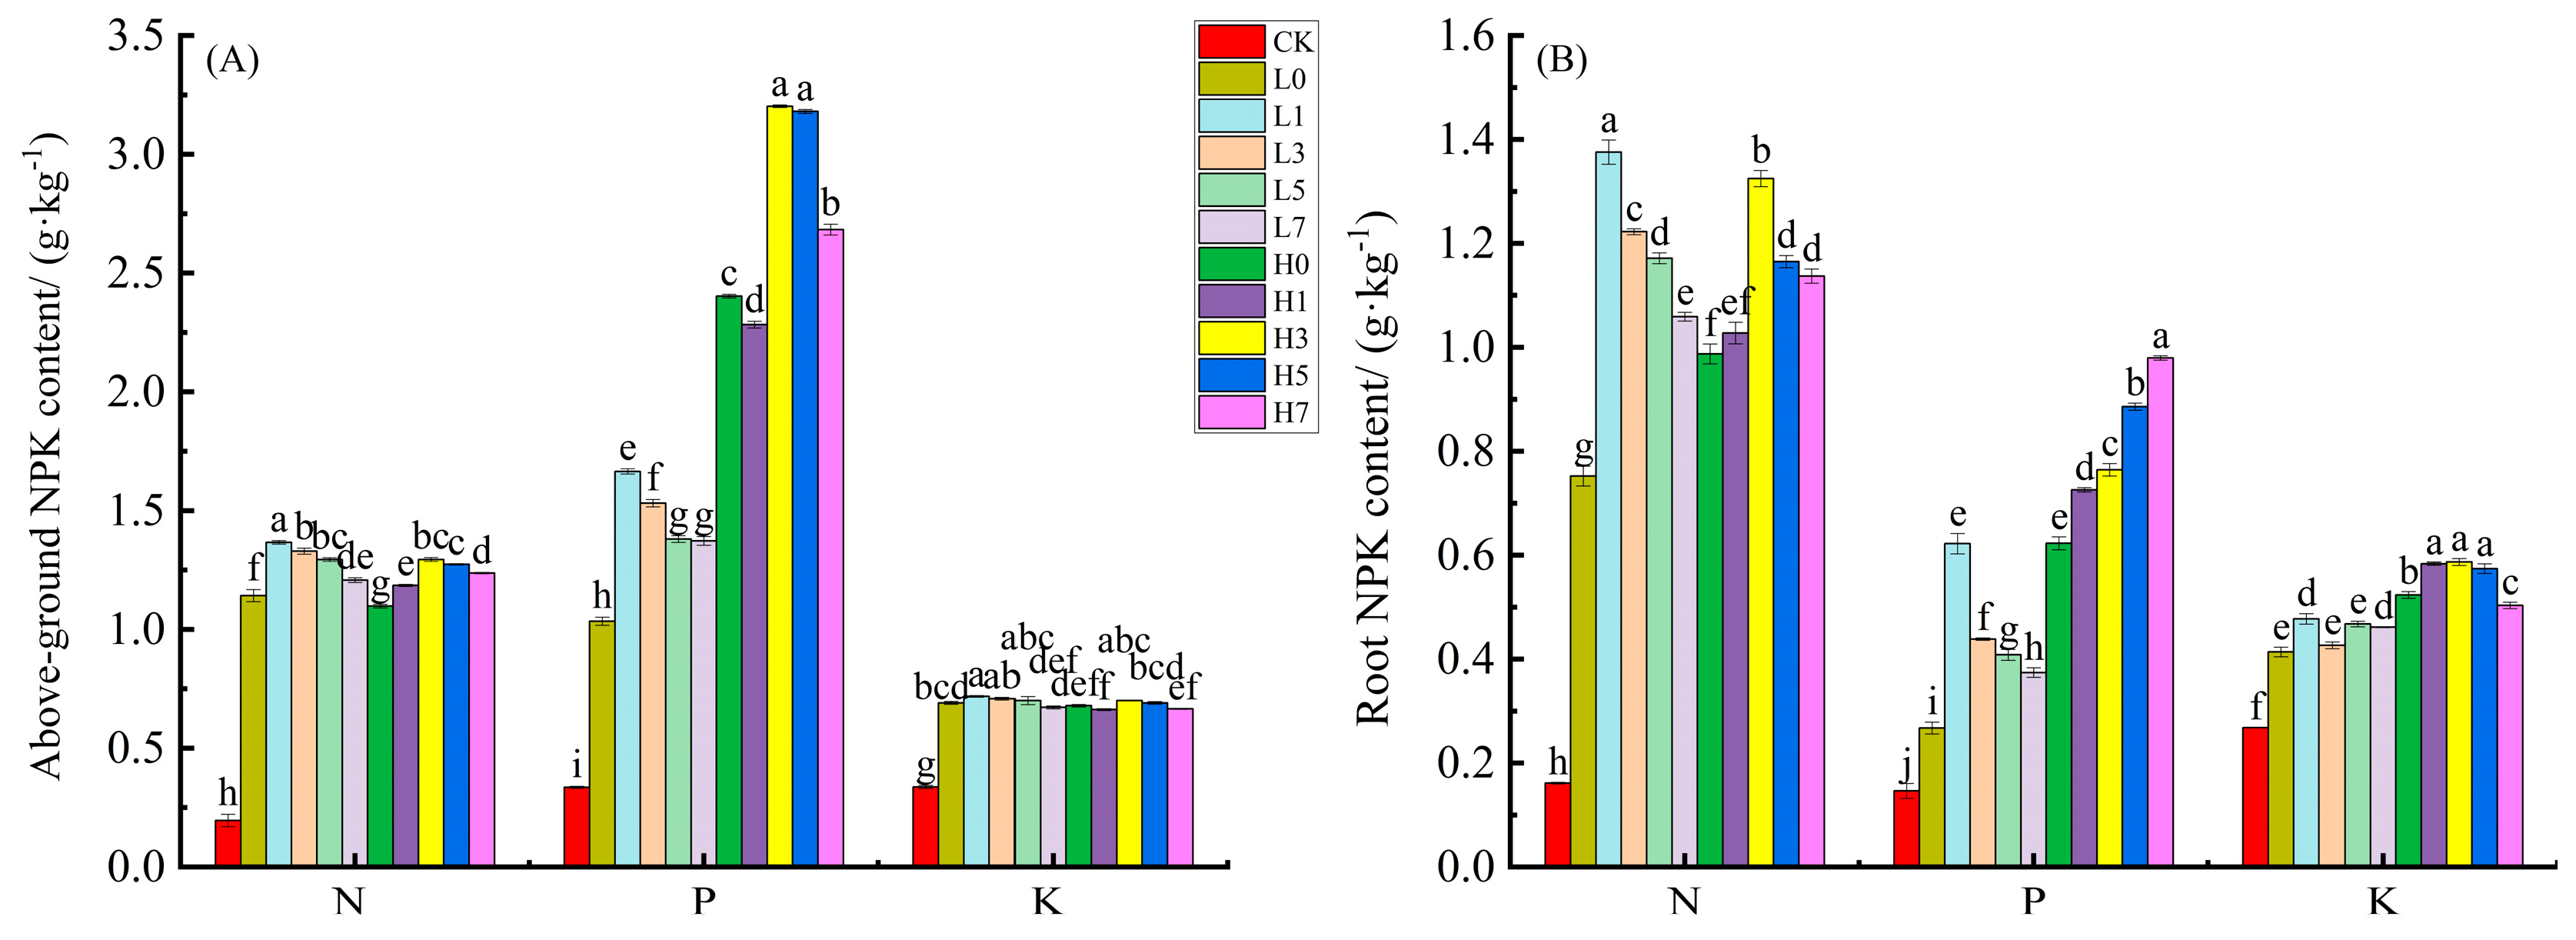
3.5. Seedling Growth and Nutrient Content in Maize

The application of SFB-VAPF significantly enhances maize growth at the seedling stage, as shown in Table 3. In the L group, compared with L0, the maize plant height and stem diameter increased by 2.39–8.48% and 1.35–14.50%, respectively, with L1 showing the largest increase. In the H group, compared with H0, the overall maize plant height and stem diameter increased by 1.87–10.10% and 0.82–13.60%, respectively. The chlorophyll content influences maize photosynthesis. The SPAD values in the L and H groups significantly increased by 2.90–14.16% and 20.49–29.62%, respectively, compared with those treated with P fertilizer alone. Studies have shown that P promotes cell division and growth [58], plays an important role in increasing plant stem nodes, and acts synergistically with Mg [59]. When plants absorb P, this absorption promotes Mg absorption; together, P and Mg enhance chlorophyll synthesis and photosynthesis This indicates that SFB-VAPF indirectly promotes increases in maize plant height, stem diameter, and leaf photosynthesis by improving soil nutrient availability, particularly P availability.
In terms of biomass, the fresh weight increase was more prominent in the L group than in the H group. Compared with L0, the above-ground and root fresh weights in the L group increased by 5.03–22.80% and 1.39–35.07%, respectively, with L1 showing the largest increase. This indicates that applying SFB with 0.05 g·kg−1 P fertilizer can significantly enhance the early-stage maize biomass. As a P fertilizer synergist, SFB provides small-molecule amino acids that maize can directly absorb and utilize for growth, thereby influencing plant C and N metabolism [27].
Root morphology and size can influence crop nutrient uptake. In the L group, compared with L0, the total root length and surface area increased significantly by 18.81–26.92% and 0.94–13.58%, respectively; in the H group, compared with H0, the surface area increased by 15.66–43.58%, and the total length increased by 6.40–13.58% (except for H1). Root system growth promotes P absorption in maize [60]. Root hairs in plant root systems contribute 70% of the total surface area [61]. As the primary site of plant nutrient uptake, root hairs account for 90% of the total plant P uptake [62]. ACP is mainly secreted by plant roots and mycorrhizal fungi. Under conditions of exogenous P fertilizer application, a significant increase in root biomass may promote root phosphatase production [37] and stimulate phosphatase activity [54]. As shown in Table 3, four treatments (L1, L3, H3, and H5) exhibited a significant increase in root length, and their corresponding ACP activities were also higher. This indicates that the application of SFB most likely promotes root growth, thereby stimulating roots to secrete more ACP, which in turn increases soil available P.
Figure 6 shows that SFB-VAPF increased the NPK content in maize seedlings. Although the graph indicates higher NPK contents in the H group, the nutrient content increases were modest compared with H0. In contrast, the NPK content increases were more pronounced in the L group compared with L0. This suggests that applying SFB with 0.05 g·kg−1 P fertilizer can effectively improve fertilizer utilization and enhance the plant nutrient content. Compared with L0, the L group exhibited above-ground NPK content increases of 5.40–16.40%, 24.69–37.90%, and 2.36–3.80%, respectively, while the root system NPK content increases were 29.00–45.30%, 28.52–57.03%, and 3.00–13.30%, respectively. L1 showed the highest NPK content increase in both the above-ground parts and root systems.
A study showed that the above-ground N content in maize increases with N supply at the V6 stage [63]. As the SFB concentration decreased, the N accumulation in the plants also decreased. This indicates that SFB provides amino nitrogen that maize can directly absorb and utilize for growth, thereby enhancing the maize N content. When plant N uptake increases, this accelerates P uptake due to enhanced physiological activity [64]. Our results found that the SFB-VAPF treatment in the L group induced the highest biomass, but the above-ground and root P and K contents were lower than those in the H group. This discrepancy could be attributed to the nutrient dilution effect. Researchers believe that as maize growth and biomass increase, the nutrient demand rises. When the nutrient uptake efficiency fails to keep pace with biomass growth, this mismatch leads to nutrient dilution in plants. Consequently, the content of certain nutrients (e.g., P and K) in plant tissues may decline with increasing biomass [65,66].
SFB-VAPF promotes maize seedling growth by enhancing soil nutrients, increasing beneficial microbial abundance, and improving the diversity and evenness of soil microbial communities. Soil is essential for plant growth and development: changes in the soil environment directly affect plant growth and the composition and function of the microbial communities [67]. The feedback in soil–plant–microbe interactions depends entirely on the performance of soil enzymes [68]. Fungi and bacteria further activate soil nutrients. Plant root secretions attract soil microorganisms (e.g., rhizobacteria) to the rhizosphere and facilitate plant uptake of insoluble nutrients [69]. In return, plants provide shelter for microorganisms in extracellular spaces, on root surfaces, and within the rhizosphere [70].

4. Conclusions

The soybean fermentation broth as a phosphorus fertilizer enhancer significantly improved the phosphorus use efficiency and enhanced crop nutrient uptake. This aligns with our hypothesis. The soybean fermentation broth value-added phosphorus fertilizer primarily promoted crop growth through ameliorating the soil chemical attributes, enhancing the soil nutrient transformation capacity, optimizing the soil microbial community structural diversity and distribution evenness, and increasing the abundance of beneficial microorganisms. The effects of SFB-VAPF varied depending on the concentration of the P fertilizer. Therefore, future applications of SFB-VAPF require location-specific adaptation to maximize its performance.

Author Contributions

Conceptualization, L.D., X.Z. and D.H.; methodology, X.Z. and D.H.; formal analysis, X.Z., D.H., W.H. and T.W.; data curation, XZ. and D.H.; writing—original draft preparation, X.Z. and D.H.; writing—review and editing, D.H., T.W. and L.D.; visualization, X.Z.; supervision, L.D. All authors have read and agreed to the published version of the manuscript.

Funding

This research was funded by the National Natural Science Foundation of China (No. 42377211) and the National Key Research and Development Program of China (No. 2023YFD2300805).

Institutional Review Board Statement

Not applicable.

Data Availability Statement

The experimental data generated in this study will be made available from the corresponding author upon reasonable request.

Conflicts of Interest

The authors declare no conflicts of interest.

References

  1. Zhang, Z.; Liao, H.; Lucas, W.J. Molecular mechanisms underlying phosphate sensing, signaling, and adaptation in plants. J. Integr. Plant Biol. 2014, 56, 192–220. [Google Scholar] [CrossRef]
  2. Balemi, T.; Negisho, K. Management of Soil Phosphorus and Plant Adaptation Mechanisms to Phosphorus Stress for Sustainable Crop Production: A Review. J. Soil Sci. Plant Nutr. 2012, 12, 547–562. [Google Scholar] [CrossRef]
  3. Redel, Y.; Cartes, P.; Demanet, R.; Velásquez, G.; Poblete-Grant, P.; Bol, R.; Mora, M.L. Assessment of Phosphorus Status Influenced by Al and Fe Compounds in Volcanic Grassland Soils. J. Soil Sci. Plant Nutr. 2016, 16, 490–506. [Google Scholar] [CrossRef]
  4. Sun, D.; Yang, X.; Wang, C.; Hao, X.; Hong, J.; Lin, X. Dynamics of Available and Enzymatically Hydrolysable Soil Phosphorus Fractions during Repeated Freeze-Thaw Cycles. Geoderma 2019, 345, 1–4. [Google Scholar] [CrossRef]
  5. Zhu, J.; Li, M.; Whelan, M. Phosphorus Activators Contribute to Legacy Phosphorus Availability in Agricultural Soils: A Review. Sci. Total Environ. 2018, 612, 522–537. [Google Scholar] [CrossRef]
  6. Akinnawo, S.O. Eutrophication: Causes, Consequences, Physical, Chemical and Biological Techniques for Mitigation Strategies. Environ. Chall. 2023, 12, 100733. [Google Scholar] [CrossRef]
  7. Hofmockel, K.S.; Fierer, N.; Colman, B.P.; Jackson, R.B. Amino Acid Abundance and Proteolytic Potential in North American Soils. Oecologia 2010, 163, 1069–1078. [Google Scholar] [CrossRef]
  8. Gil, F.; Taf, R.; Mikula, K.; Skrzypczak, D.; Izydorczyk, G.; Moustakas, K.; Chojnacka, K. Advancing Sustainable Agriculture: Converting Dairy Wastes into Amino Acid Fertilizers. Sustain. Chem. Pharm. 2024, 42, 101782. [Google Scholar] [CrossRef]
  9. Jeon, Y.-W.; Jeon, M.-J. Large-Scale Conversion of Livestock Blood into Amino Acid Liquid Fertilizer and Dry Protein Feedstuff: A Case Study. Processes 2024, 12, 1183. [Google Scholar] [CrossRef]
  10. García-Sánchez, F.; Simón-Grao, S.; Navarro-Pérez, V.; Alfosea-Simón, M. Scientific Advances in Biostimulation Reported in the 5th Biostimulant World Congress. Horticulturae 2022, 8, 665. [Google Scholar] [CrossRef]
  11. Van Oosten, M.J.; Pepe, O.; De Pascale, S.; Silletti, S.; Maggio, A. The Role of Biostimulants and Bioeffectors as Alleviators of Abiotic Stress in Crop Plants. Chem. Biol. Technol. Agric. 2017, 4, 5. [Google Scholar] [CrossRef]
  12. Hu, S.; Li, K.; Zhang, X.; Yang, C.; Zhang, R.; Guo, H. The Impact of the Foliar Application of Amino Acid Aqueous Fertilizer on the Flavor of Potato Tubers. Foods 2023, 12, 3951. [Google Scholar] [CrossRef]
  13. Geisseler, D.; Horwath, W.R.; Joergensen, R.G.; Ludwig, B. Pathways of Nitrogen Utilization by Soil Microorganisms—A Review. Soil Biol. Biochem. 2010, 42, 2058–2067. [Google Scholar] [CrossRef]
  14. Chubukov, V.; Gerosa, L.; Kochanowski, K.; Sauer, U. Coordination of Microbial Metabolism. Nat. Rev. Microbiol. 2014, 12, 327–340. [Google Scholar] [CrossRef] [PubMed]
  15. Hill, P.W.; Farrell, M.; Jones, D.L. Bigger May Be Better in Soil N Cycling: Does Rapid Acquisition of Small l-Peptides by Soil Microbes Dominate Fluxes of Protein-Derived N in Soil? Soil Biol. Biochem. 2012, 48, 106–112. [Google Scholar] [CrossRef]
  16. Redmile-Gordon, M.; Brookes, P.; Evershed, R.; Goulding, K.; Hirsch, P. Measuring the Soil-Microbial Interface: Extraction of Extracellular Polymeric Substances (EPS) from Soil Biofilms. Soil Biol. Biochem. 2014, 72, 163–171. [Google Scholar] [CrossRef]
  17. Dai, Z.; Liu, G.; Chen, H.; Chen, C.; Wang, J.; Ai, S.; Wei, D.; Li, D.; Ma, B.; Tang, C.; et al. Long-Term Nutrient Inputs Shift Soil Microbial Functional Profiles of Phosphorus Cycling in Diverse Agroecosystems. ISME J. 2020, 14, 757–770. [Google Scholar] [CrossRef]
  18. Bergkemper, F.; Schöler, A.; Engel, M.; Lang, F.; Krüger, J.; Schloter, M.; Schulz, S. Phosphorus Depletion in Forest Soils Shapes Bacterial Communities towards Phosphorus Recycling Systems. Environ. Microbiol. 2016, 18, 1988–2000. [Google Scholar] [CrossRef]
  19. Elias, M.; Tanaka, M.; Sakai, M.; Toyama, H.; Matsushita, K.; Adachi, O.; Yamada, M. C-Terminal Periplasmic Domain of Escherichia Coli Quinoprotein Glucose Dehydrogenase Transfers Electrons to Ubiquinone. J. Biol. Chem. 2001, 276, 48356–48361. [Google Scholar] [CrossRef]
  20. Li, Y.; Wang, J.; He, L.; Xu, X.; Wang, J.; Ren, C.; Guo, Y.; Zhao, F. Different Mechanisms Driving Increasing Abundance of Microbial Phosphorus Cycling Gene Groups along an Elevational Gradient. iScience 2022, 25, 105170. [Google Scholar] [CrossRef]
  21. Wang, X.; Zhang, Y.; Xu, W.; Cheng, J.; Liu, J.; Pei, W.; Wang, J.; Chuang, S. Amino Acid Fertilizer Strengthens Its Effect on Crop Yield and Quality by Recruiting Beneficial Rhizosphere Microbes. J. Sci. Food Agric. 2023, 103, 5970–5980. [Google Scholar] [CrossRef] [PubMed]
  22. He, X.; Zhang, J.; Ren, Y.; Sun, C.; Deng, X.; Qian, M.; Hu, Z.; Li, R.; Chen, Y.; Shen, Z.; et al. Polyaspartate and Liquid Amino Acid Fertilizer Are Appropriate Alternatives for Promoting the Phytoextraction of Cadmium and Lead in Solanum nigrum L. Chemosphere 2019, 237, 124483. Chemosphere 2019, 237, 124483. [Google Scholar] [CrossRef] [PubMed]
  23. Zhang, Y.; Zhang, S.; Zhao, B.; Li, Y.; Xu, M.; Yan, Y.; Jing, J.; Yuan, L. Glutamic Acid-Enhanced Phosphate Fertilizer Increases Phosphorus Availability in Fluvo-Aquic Soil via Phosphamide (O=P-N) Formation, Decreasing Phosphate Fixation and Increasing Soil Microbial Diversity. J. Soil Sci. Plant Nutr. 2024, 24, 2748–2760. [Google Scholar] [CrossRef]
  24. Gordon, W.B.; Pierzynski, G.M. Corn Hybrid Response to Starter Fertilizer Combinations. J. Plant Nutr. 2006, 29, 1287–1299. [Google Scholar] [CrossRef]
  25. Barry, D.A.J.; Miller, M.H. Phosphorus Nutritional Requirement of Maize Seedlings for Maximum Yield. Agron. J. 1989, 81, 95–99. [Google Scholar] [CrossRef]
  26. Chang, S.C.; Jackson, M.L. Fractionation of Soil Phosphorus. Soil Sci. 1957, 84, 133–144. [Google Scholar] [CrossRef]
  27. Ho, G.-H.; Ho, T.-I.; Hsieh, K.-H.; Su, Y.-C.; Lin, P.-Y.; Yang, J.; Yang, K.-H.; Yang, S.-C. γ-Polyglutamic Acid Produced by Bacillus Subtilis (Natto): Structural Characteristics, Chemical Properties and Biological Functionalities. J. Chin. Chem. Soc. 2006, 53, 1363–1384. [Google Scholar] [CrossRef]
  28. Zhang, L.; Yang, X.; Gao, D.; Wang, L.; Li, J.; Wei, Z.; Shi, Y. Effects of Poly-γ-Glutamic Acid (γ-PGA) on Plant Growth and Its Distribution in a Controlled Plant-Soil System. Sci. Rep. 2017, 7, 6090. [Google Scholar] [CrossRef]
  29. Friedman, S. Soil Properties Influencing Apparent Electrical Conductivity: A Review. Comput. Electron. Agri. 2005, 46, 45–70. [Google Scholar] [CrossRef]
  30. Xu, Z.; Wan, C.; Xu, X.; Feng, X.; Xu, H. Effect of Poly (γ-Glutamic Acid) on Wheat Productivity, Nitrogen Use Efficiency and Soil Microbes. J. Soil Sci. Plant Nutr. 2013, 13, 744–755. [Google Scholar] [CrossRef]
  31. Lu, X.; Xie, Y. Soil and Fertilizer Science; Agricultural University Press: Beijing, China, 2011; 350p, ISBN 978-7-5655-0298-9. [Google Scholar]
  32. Chen, X.; Yan, X.; Wang, M.; Cai, Y.; Weng, X.; Su, D.; Guo, J.; Wang, W.; Hou, Y.; Ye, D.; et al. Long-Term Excessive Phosphorus Fertilization Alters Soil Phosphorus Fractions in the Acidic Soil of Pomelo Orchards. Soil Tillage Res. 2022, 215, 105214. [Google Scholar] [CrossRef]
  33. Zhu, X.; Fang, X.; Wang, L.; Xiang, W.; Alharbi, H.A.; Lei, P.; Kuzyakov, Y. Regulation of Soil Phosphorus Availability and Composition during Forest Succession in Subtropics. For. Ecol. Manag. 2021, 502, 119706. [Google Scholar] [CrossRef]
  34. Li, Z.; Lin, Z.; Zhao, B.; Yuan, L.; Li, Y.; Wen, Y. Effects of value-added phosphate fertilizers on transformation of inorganic phosphorus in calcareous soils. J. Plant Nutr. Fertil. 2013, 19, 1183–1191. [Google Scholar] [CrossRef]
  35. Gabasawa, A.I. Phosphorus Cycle Enzymes to Remedy Soil Phosphorus Deficiency. In Sustainable Agriculture Reviews 58: Phosphorus Use Efficiency for Sustainable Agriculture; Iqbal, A., Iqbal, M., Alamzeb, M., Meizhen, S., Xiling, Z., Arif, M., Du, X., Lichtfouse, E., Eds.; Springer International Publishing: Cham, Switzerland, 2023; pp. 177–205. ISBN 978-3-031-16155-1. [Google Scholar] [CrossRef]
  36. Wu, M.; Wei, Q.; Xu, L.; Li, H.; Oelmüller, R.; Zhang, W. Piriformospora Indica Enhances Phosphorus Absorption by Stimulating Acid Phosphatase Activities and Organic Acid Accumulation in Brassica Napus. Plant Soil 2018, 432, 333–344. [Google Scholar] [CrossRef]
  37. Tian, J.; Wei, K.; Condron, L.M.; Chen, Z.; Xu, Z.; Chen, L. Impact of Land Use and Nutrient Addition on Phosphatase Activities and Their Relationships with Organic Phosphorus Turnover in Semi-Arid Grassland Soils. Biol. Fertil. Soils 2016, 52, 675–683. [Google Scholar] [CrossRef]
  38. Nannipieri, P.; Giagnoni, L.; Landi, L.; Renella, G. Role of Phosphatase Enzymes in Soil. In Phosphorus in Action: Biological Processes in Soil Phosphorus Cycling; Bünemann, E., Oberson, A., Frossard, E., Eds.; Springer: Berlin/Heidelberg, Germany, 2011; pp. 215–243. ISBN 978-3-642-15271-9. [Google Scholar] [CrossRef]
  39. Gou, X.; Ren, Y.; Qin, X.; Wei, X.; Wang, J. Global Patterns of Soil Phosphatase Responses to Nitrogen and Phosphorus Fertilization. Pedosphere 2024, 34, 200–210. [Google Scholar] [CrossRef]
  40. Wang, C.; Liu, D.; Bai, E. Decreasing Soil Microbial Diversity Is Associated with Decreasing Microbial Biomass under Nitrogen Addition. Soil Biol. Biochem. 2018, 120, 126–133. [Google Scholar] [CrossRef]
  41. de Vries, F.T.; Hoffland, E.; van Eekeren, N.; Brussaard, L.; Bloem, J. Fungal/Bacterial Ratios in Grasslands with Contrasting Nitrogen Management. Soil Biol. Biochem. 2006, 38, 2092–2103. [Google Scholar] [CrossRef]
  42. Li, Y.; Pan, F.; Yao, H. Response of Symbiotic and Asymbiotic Nitrogen-Fixing Microorganisms to Nitrogen Fertilizer Application. J. Soils Sediments 2019, 19, 1948–1958. [Google Scholar] [CrossRef]
  43. Gupta, R.S. The Phylogeny of Proteobacteria: Relationships to Other Eubacterial Phyla and Eukaryotes. FEMS Microbiol. Rev. 2000, 24, 367–402. [Google Scholar] [CrossRef]
  44. Sharma, V.; Vashishtha, A.; Jos, A.L.M.; Khosla, A.; Basu, N.; Yadav, R.; Bhatt, A.; Gulani, A.; Singh, P.; Lakhera, S.; et al. Phylogenomics of the Phylum Proteobacteria: Resolving the Complex Relationships. Curr. Microbiol. 2022, 79, 224. [Google Scholar] [CrossRef] [PubMed]
  45. Pérez-Fernández, M.A.; Lamont, B.B. Competition and Facilitation between Australian and Spanish Legumes in Seven Australian Soils. Plant Species Biol. 2016, 31, 256–271. [Google Scholar] [CrossRef]
  46. Lauber, C.; Hamady, M.; Knight, R.; Fierer, N. Pyrosequencing-Based Assessment of Soil pH as a Predictor of Soil Bacterial Community Structure at the Continental Scale. Appl. Environ. Microbiol. 2009, 75, 5111–5120. [Google Scholar] [CrossRef]
  47. Gupta, R.S. Protein Phylogenies and Signature Sequences: A Reappraisal of Evolutionary Relationships among Archaebacteria, Eubacteria, and Eukaryotes. Microbiol. Mol. Biol. Rev. 1998, 62, 1435–1491. [Google Scholar] [CrossRef] [PubMed]
  48. Gupta, R.S.; Mukhtar, T.; Singh, B. Evolutionary Relationships among Photosynthetic Prokaryotes (Heliobacterium chlorum, Chloroflexus aurantiacus, Cyanobacteria, Chlorobium tepidum and Proteobacteria): Implications Regarding the Origin of Photosynthesis. Mol. Microbiol. 1999, 32, 893–906. [Google Scholar] [CrossRef]
  49. Williams, K.P.; Gillespie, J.J.; Sobral, B.W.S.; Nordberg, E.K.; Snyder, E.E.; Shallom, J.M.; Dickerman, A.W. Phylogeny of Gammaproteobacteria. J. Bacteriol. 2010, 192, 2305–2314. [Google Scholar] [CrossRef]
  50. Niepceron, M.; Martin-Laurent, F.; Crampon, M.; Portet-Koltalo, F.; Akpa-Vinceslas, M.; Legras, M.; Bru, D.; Bureau, F.; Bodilis, J. GammaProteobacteria as a Potential Bioindicator of a Multiple Contamination by Polycyclic Aromatic Hydrocarbons (PAHs) in Agricultural Soils. Environ. Pollut. 2013, 180, 199–205. [Google Scholar] [CrossRef]
  51. Wang, J.L.; Liu, K.L.; Zhao, X.Q.; Zhang, H.Q.; Li, D.; Li, J.J.; Shen, R.F. Balanced Fertilization over Four Decades Has Sustained Soil Microbial Communities and Improved Soil Fertility and Rice Productivity in Red Paddy Soil. Sci. Total Environ. 2021, 793, 148664. [Google Scholar] [CrossRef] [PubMed]
  52. Gypser, S.; Freese, D. Phosphorus Release from Vivianite and Hydroxyapatite by Organic and Inorganic Compounds. Pedosphere 2020, 30, 190–200. [Google Scholar] [CrossRef]
  53. Li, H.-Z.; Bi, Q.; Yang, K.; Zheng, B.-X.; Pu, Q.; Cui, L. D2O-Isotope-Labeling Approach to Probing Phosphate-Solubilizing Bacteria in Complex Soil Communities by Single-Cell Raman Spectroscopy. Anal. Chem. 2019, 91, 2239–2246. [Google Scholar] [CrossRef]
  54. Fraser, T.D.; Lynch, D.H.; Gaiero, J.; Khosla, K.; Dunfield, K.E. Quantification of Bacterial Non-Specific Acid (phoC) and Alkaline (phoD) Phosphatase Genes in Bulk and Rhizosphere Soil from Organically Managed Soybean Fields. Appl. Soil Ecol. 2017, 111, 48–56. [Google Scholar] [CrossRef]
  55. Zheng, M.M.; Wang, C.; Li, W.X.; Song, W.F.; Shen, R.F. Soil Nutrients Drive Function and Composition of phoC-Harboring Bacterial Community in Acidic Soils of Southern China. Front. Microbiol. 2019, 10, 2654. [Google Scholar] [CrossRef]
  56. Garrity, G.M.; Bell, J.A.; Liburn, T. Class III. Gammaproteobacteria Class. Nov. In Bergey’s Manual of Systematic Bacteriology; Williams & Wilkins: London, UK, 1984; pp. 1–59. ISBN 0683041088. [Google Scholar] [CrossRef]
  57. Richardson, A.E.; Barea, J.-M.; McNeill, A.M.; Prigent-Combaret, C. Acquisition of Phosphorus and Nitrogen in the Rhizosphere and Plant Growth Promotion by Microorganisms. Plant Soil 2009, 321, 305–339. [Google Scholar] [CrossRef]
  58. Assuero, S.G.; Mollier, A.; Pellerin, S. The Decrease in Growth of Phosphorus-Deficient Maize Leaves Is Related to a Lower Cell Production. Plant Cell Environ. 2004, 27, 887–895. [Google Scholar] [CrossRef]
  59. Malhotra, H.; Vandana; Sharma, S.; Pandey, R. Phosphorus Nutrition: Plant Growth in Response to Deficiency and Excess. In Plant Nutrients and Abiotic Stress Tolerance; Springer: Singapore, 2018; pp. 171–190. ISBN 978-981-10-9044-8. [Google Scholar] [CrossRef]
  60. Barber, S.A.; Mackay, A.D. Root Growth and Phosphorus and Potassium Uptake by Two Corn Genotypes in the Field. Fertil. Res. 1986, 10, 217–230. [Google Scholar] [CrossRef]
  61. Jungk, A. Root Hairs and the Acquisition of Plant Nutrients from Soil. J. Plant Nutr. Soil Sci. 2001, 164, 121–129. [Google Scholar] [CrossRef]
  62. Foehse, D.; Claassen, N.; Jungk, A.; Foehse, D.; Claassen, N.; Jungk, A. Phosphorus Efficiency of Plants II. Significance of Root Radius Root Hairs and Cation Anion Balance for Phosphorus Influx in Seven Plant Species. Plant Soil 1991, 132, 261–272. [Google Scholar] [CrossRef]
  63. Bruns, H.; Ebelhar, M. Nutrient Uptake of Maize Affected by Nitrogen and Potassium Fertility in a Humid Subtropical Environment. Commun. Soil Sci. Plan 2006, 37, 275–293. [Google Scholar] [CrossRef]
  64. Bennett, W.F.; Pesek, J.; Hanway, J. Effect of Nitrogen on Phosphorus Absorption by Corn. Agron. J. 1962, 54, 437–442. [Google Scholar] [CrossRef]
  65. Bélanger, G.; Richards, J.E. Relationship between P and N Concentrations in Timothy. Can. J. Plant Sci. 1999, 79, 65–70. [Google Scholar] [CrossRef]
  66. Singh, R.; Sawatzky, S.K.; Thomas, M.; Akin, S.; Zhang, H.; Raun, W.; Arnall, D.B. Nitrogen, Phosphorus, and Potassium Uptake in Rain-Fed Corn as Affected by NPK Fertilization. Agronomy 2023, 13, 1913. [Google Scholar] [CrossRef]
  67. Tayyab, M.; Islam, W.; Noman, A.; Pang, Z.; Li, S.; Lin, S.; Lin, W.; Hua, Z. Sugarcane Cultivars Manipulate Rhizosphere Bacterial Communities’ Structure and Composition of Agriculturally Important Keystone Taxa. 3 Biotech 2022, 12, 32. [Google Scholar] [CrossRef] [PubMed]
  68. Bragazza, L.; Parisod, J.; Buttler, A.; Bardgett, R.D. Biogeochemical Plant-Soil Microbe Feedback in Response to Climate Warming in Peatlands. Nat. Clim. Change 2013, 3, 273–277. [Google Scholar] [CrossRef]
  69. Li, X.; Zeng, R.; Liao, H. Improving Crop Nutrient Efficiency through Root Architecture Modifications. J. Integr. Plant Biol. 2016, 58, 193–202. [Google Scholar] [CrossRef]
  70. Das, P.P.; Singh, K.R.; Nagpure, G.; Mansoori, A.; Singh, R.P.; Ghazi, I.A.; Kumar, A.; Singh, J. Plant-Soil-Microbes: A Tripartite Interaction for Nutrient Acquisition and Better Plant Growth for Sustainable Agricultural Practices. Environ. Res. 2022, 214, 113821. [Google Scholar] [CrossRef]
Figure 1. Soil acid phosphatase (ACP) (A) and urease (URE) (B) activities. Treatments L1, L3, L5, and L7 of the L group were treated with 100-fold, 300-fold, 500-fold, and 700-fold diluted SFB, respectively, and 0.05 g·kg−1 P, and L0 was only treated with 0.05 g·kg−1 P. Treatments H1, H3, H5, and H7 of the H group were treated with 100-fold, 300-fold, 500-fold, and 700-fold diluted SFB, respectively, and 0.15 g·kg−1 P, and H0 was only treated with 0.15 g·kg−1 P. The data in the graphs are the mean ± standard error of 5 replicates; the same lowercase letter indicates that the difference was not significant (Duncan’s multiple comparisons, p ≥ 0.05).
Agriculture 15 01440 g001
Figure 2. Soil bacterial community diversity. (A) Venn diagram of OTU numbers; (B) Circos plot on class level; (C) community heatmap analysis at class level. Treatments L1, L3, L5, and L7 of the L group were treated with 100-fold, 300-fold, 500-fold, and 700-fold diluted SFB, respectively, and 0.05 g·kg−1 P, and L0 was only treated with 0.05 g·kg−1 P; treatments H1, H3, H5, and H7 of the H group were treated with 100-fold, 300-fold, 500-fold, and 700-fold diluted SFB, respectively, and 0.15 g·kg−1 P, and H0 was only treated with 0.15 g·kg−1 P.
Agriculture 15 01440 g002
Figure 3. Alpha diversity indices: (A) Chao index; (B) Shannon index; (C) Pielou index. Treatments L1, L3, L5, and L7 of the L group were treated with 100-fold, 300-fold, 500-fold, and 700-fold diluted SFB, respectively, and 0.05 g·kg−1 P, and L0 was only treated with 0.05 g·kg−1 P. Treatments H1, H3, H5, and H7 of the H group were treated with 100-fold, 300-fold, 500-fold, and 700-fold diluted SFB, respectively, and 0.15 g·kg−1 P, and L0 was only treated with 0.15 g·kg−1 P. The data in the graphs are the mean ± standard error of 5 replicates; the same lowercase letter indicates that the difference was not significant (Duncan’s multiple comparisons, p ≥ 0.05).
Agriculture 15 01440 g003
Figure 4. Soil bacterial composition and structure at class level. (A) Principal component analysis (PCA); (B) principal coordinate analysis (PCoA). L1, L3, L5, and L7 of the L group were treated with 100-, 300-, 500-, and 700-fold diluted SFB, respectively, and 0.05 g·kg−1 P, and L0 was only treated with 0.05 g·kg−1 P. H1, H3, H5, and H7 of the H group were treated with 100-, 300-, 500-, and 700-fold diluted SFB, respectively, and 0.15 g·kg−1 P, and H0 was only treated with 0.15 g·kg−1 P. The X- and Y-axes represent the two selected principal component axes, and the percentage indicates the explanatory power of the principal components for sample compositional differences. The scales of the X- and Y-axes represent relative distances and lack practical significance.
Agriculture 15 01440 g004
Figure 5. Differences between species groups at the class level (A) and redundancy analysis (RDA) of different treatments in terms of environmental characteristics at the class level (B). In the L group, L1, L3, L5, and L7 were treated with 100-, 300-, 500-, and 700-fold diluted SFB and 0.05 g·kg−1 P, and L0 was only treated with 0.05 g·kg−1 P. In the H group, H1, H3, H5, and H7 were treated with 100-, 300-, 500-, and 700-fold diluted SFB and 0.15 g·kg−1 P, and H0 was only treated with 0.15 g·kg−1 P. (A) The Y-axis indicates the species name at a given taxonomic level, the X-axis indicates the mean relative abundance of the species in the different subgroups, and different colored columns indicate different subgroups. p-values are shown on the far right; * 0.01 < p ≤ 0.05, ** 0.001 < p ≤ 0.01, *** p ≤ 0.001.
Agriculture 15 01440 g005
Figure 6. NPK content of maize at seedling stage: (A) above-ground parts; (B) roots. Treatments L1, L3, L5, and L7 of the L group were treated with 100-fold, 300-fold, 500-fold, and 700-fold diluted SFB, respectively, and 0.05 g·kg−1 P, and L0 was only treated with 0.05 g·kg−1 P. Treatments H1, H3, H5, and H7 of the H group were treated with 100-fold, 300-fold, 500-fold, and 700-fold diluted SFB, respectively, and 0.15 g·kg−1 P, and H0 was only treated with 0.15 g·kg−1 P. The data in the graphs are the mean ± standard error of 5 replicates; the same lowercase letter indicates that the difference was not significant (Duncan’s multiple comparisons, p ≥ 0.05).
Agriculture 15 01440 g006
Table 1. Treatment combinations with different concentrations and fertilizer application rates.
TreatmentPhosphorus Levels (g·kg−1)Soybean Fermentation Broth Dilution Factor and Treatment NumberFertilizer Application Rates
0100-
Fold
300-
Fold
500-
Fold
700-
Fold
KH2PO4
(g·kg−1)
CO(NH2)2
(g·kg−1)
KCl
(g·kg−1)
L group0.05L0L1L3L5L70.09570.32690.19
H group0.15H0H1H3H5H70.2870.32690.084
CK0//////0.32690.25
Note: The phosphorus (P) was supplied by KH2PO4. Specifically, KH2PO4 served as the tested phosphorus source; it contains 52.2% P2O5, and its specific application rate was calculated based on the different phosphorus levels. Nitrogen (N) fertilizer was derived from urea (CO(NH2)2), while potassium (K) fertilizer was supplied by KH2PO4 and KCl.
Table 2. Chemical attributes of soil planted with maize at seedling stage.
TreatmentChemical attributes
pHEC (mS·cm−1)Soil Organic Matter (SOM) (g·kg−1)Alkaline Hydrolyzable Nitrogen (AHN) (mg·kg−1)Available Potassium (AK) (mg·kg−1)
CK 5.69 ± 0.01 h0.69 ± 0.01 f8.26 ± 0.24 g32.20 ± 0.81 j19.04 ± 0.52 h
L groupL06.04 ± 0.01 c0.66 ± 0.00 g10.24 ± 0.09 f46.43 ± 0.23 i65.92 ± 0.06 g
L16.22 ± 0.01 a0.74 ± 0.01 e14.92 ± 0.13 a62.77 ± 0.84 f67.47 ± 0.07 ef
L36.12 ± 0.02 b0.55 ± 0.01 i13.95 ± 0.06 b60.43 ± 0.62 g67.05 ± 0.11 f
L56.13 ± 0.01 b0.51 ± 0.01 j12.78 ± 0.10 c54.60 ± 0.00 h67.03 ± 0.10 f
L76.12 ± 0.02 b0.62 ± 0.01 h10.99 ± 0.06 e53.20 ± 0.81 h66.60 ± 0.01 f
H groupH05.77 ± 0.01 f1.06 ± 0.01 a11.13 ± 0.17 e79.10 ± 0.40 c68.19 ± 0.53 de
H15.70 ± 0.01 g0.89 ± 0.01 b12.62 ± 0.10 c99.40 ± 0.70 a68.73 ± 0.11 d
H36.00 ± 0.01 d0.89 ± 0.01 c14.13 ± 0.08 b82.13 ± 0.7 b70.75 ± 0.49 a
H56.15 ± 0.01 b0.79 ± 0.01 d14.35 ± 0.19 b73.03 ± 0.62 d69.71 ± 0.48 abc
H75.92 ± 0.01 e0.84 ± 0.00 f12.08 ± 0.06 d68.37 ± 0.93 e68.60 ± 0.41 cd
TreatmentChemical attributes
Available Phosphorus (AP) (mg·kg−1)Al-P
(mg·kg−1)
Fe-P
(mg·kg−1)
CK 0.98 ± 0.14 j2.17 ± 0.07 k7.93 ± 0.09 j
L groupL06.6 ± 0.08 i25.27 ± 0.07 h32.90 ± 0.11 i
L121.73 ± 0.22 e66.33 ± 0.07 d77.62 ± 0.29 c
L319.24 ± 0.13 f50.00 ± 0.12 f46.45 ± 0.19 g
L512.21 ± 0.29 g11.18 ± 0.127 i40.38 ± 0.11 h
L710.11 ± 0.17 h9.62 ± 0.07 j40.76 ± 0.09 h
H groupH039.26 ± 0.26 d46.82 ± 0.24 g61.14 ± 0.20 f
H141.02 ± 0.29 c62.94 ± 0.18 e75.83 ± 0.14 d
H350.95 ± 0.28 a111.63 ± 3.68 a85.23 ± 0.20 a
H550.71 ± 0.18 a91.87 ± 0.12 b79.30 ± 0.19 b
H742.59 ± 0.20 b71.82 ± 0.14 c64.23 ± 0.11 e
Note: Treatments L1, L3, L5, and L7 of the L group were treated with 100-fold, 300-fold, 500-fold, and 700-fold diluted SFB, respectively, and 0.05 g·kg−1 P, and L0 was only treated with 0.05 g·kg−1 P. Treatments H1, H3, H5, and H7 of the H group were treated with 100-fold, 300-fold, 500-fold, and 700-fold diluted SFB, respectively, and 0.15 g·kg−1 P, and H0 was only treated with 0.15 g·kg−1 P. The data in the table are the mean ± standard error of 5 replicates; the same lowercase letter in the same column indicates that the difference was not significant (Duncan’s multiple comparisons, p ≥ 0.05).
Table 3. Agronomic traits and biomass of maize at seedling stage.
TreatmentAbove-Ground GrowthBiomassRoot Growth
Plant Height (cm)Stem Diameter (mm)SPADFresh Weight (g)Total Length (cm)Surface Area (cm2)
Above-GroundRoot
CK 78.51 ± 0.74 h9.5 ± 0.18 i20.73 ± 0.33 i17.46 ± 0.47 j8.91 ± 0.67 i1070.90 ± 2.90 i366.35 ± 2.10 f
L groupL0137.80 ± 0.67 e22.98 ± 0.24 fg40.2 ± 0.55 d210.97 ± 0.56 e36.97 ± 1.24 de1657.59 ± 23.8 g1048.52 ± 15.2 c
L1150.57 ± 0.81 a26.82 ± 0.38 a46.83 ± 0.18 a273.28 ± 3.91 a56.94 ± 0.45 a2128.40 ± 13.16 d 1182.70 ±5.03 b
L3148.16 ± 1.81 a24.45 ± 0.15 cd44.03 ± 0.47 b225.86 ± 1.11 c49.09 ± 0.58 b2268.14 ± 23.56 c 1213.30 ± 22.07 b
L5143.69 ± 1.47 bc23.49 ± 0.19 def42.2 ± 0.31 c224.93 ± 3.45 c48.58 ± 1.13 b2041.74 ± 18.77 e 1068.16 ±2.18 c
L7141.17 ± 1.60 cd23.25 ± 0.18 ef41.4 ± 0.23 cd222.14 ± 2.81 d43.18 ± 1.36 c1536.40 ± 23.63 h1058.46 ± 6.12 c
H groupH0127.61 ± 1.27 fg22.02 ± 0.40 gh27.17 ± 0.56 h191.49 ± 3.81 h34.29 ± 0.72 fg2027.39 ± 4.55 e744.00 ± 6.52 e
H1135.86 ± 0.81 e21.94 ± 0.14 h38.2 ± 0.49 e194.41 ± 1.10 g37.97 ± 0.67 d1951.69 ± 5.73 f 885.89 ± 3.76 d
H3141.35 ± 1.42 bc25.49 ± 0.22 b38.6 ± 0.53 e243.89 ± 3.81 b49.39 ± 1.42 b2557.45 ± 16.44 b 1318.60 ± 6.48 a
H5138.43 ± 1.41 de24.59 ± 0.36 c36.8 ± 0.50 f199.40 ± 0.92 f35.66 ± 0.47 def 2852.01 ± 16.92 a1041.22 ± 9.00 c
H7130.04 ± 0.82 f22.20 ± 0.2 gh34.17 ± 0.19 g170.83 ± 2.31 i28.34 ± 1.17 h2165.95 ± 6.77 d 882.18 ± 7.53 d
Note: Chlorophyll content is expressed in SPAD units. Treatments L1, L3, L5, and L7 of the L group were treated with 100-fold, 300-fold, 500-fold, and 700-fold diluted SFB, respectively, and 0.05 g·kg−1 P, and L0 was only treated with 0.05 g·kg−1 P. Treatments H1, H3, H5, and H7 of the H group were treated with 100-fold, 300-fold, 500-fold, and 700-fold diluted SFB, respectively, and 0.15 g·kg−1 P, and H0 was only treated with 0.15 g·kg−1 P. The data in the table are the mean ± standard error of 5 replicates; the same lowercase letter in the same column indicates that the difference was not significant (Duncan’s multiple comparisons, p ≥ 0.05).
Disclaimer/Publisher’s Note: The statements, opinions and data contained in all publications are solely those of the individual author(s) and contributor(s) and not of MDPI and/or the editor(s). MDPI and/or the editor(s) disclaim responsibility for any injury to people or property resulting from any ideas, methods, instructions or products referred to in the content.

