Article

Combined Metagenomic and Metabolomic Analysis to Evaluate the Comprehensive Effects of Trichoderma and 6PP on Vineyard Ecosystems

by
Irene Dini
1,
Giada d’Errico
2,
Elisa Troiano
3,
Claudio Gigliotti
3,
Anastasia Vassetti
3,
Daria Lotito
4,
Alessia Staropoli
4,*,
Giuseppe Parrella
3,
Francesco P. d’Errico
2,
Matteo Lorito
2 and
Francesco Vinale
3,4
1
Department of Pharmacy, University of Naples Federico II, Via D. Montesano, 49, 80131 Naples, NA, Italy
2
Department of Agricultural Sciences, University of Naples Federico II, Via Università, 100, 80055 Portici, NA, Italy
3
Institute for Sustainable Plant Protection, National Research Council, Piazzale E. Fermi, 1, 80055 Portici, NA, Italy
4
Department of Veterinary Medicine and Animal Productions, University of Naples Federico II, Via F. Delpino, 1, 80138 Naples, NA, Italy
*
Author to whom correspondence should be addressed.
Agriculture 2025, 15(13), 1441; https://doi.org/10.3390/agriculture15131441
Submission received: 14 May 2025 / Revised: 28 June 2025 / Accepted: 3 July 2025 / Published: 4 July 2025
(This article belongs to the Section Crop Production)

Abstract

Viticulture is vital to Italy’s agricultural sector, since it significantly contributes to the global wine industry. Microflora and microfauna are considered important factors for soil quality, improving grapevine growth, and promoting resistance to biotic and abiotic stresses. This study examined the impact of selected Trichoderma strains (T. harzianum M10 and T. afroharzianum T22) and their secondary metabolite 6-pentyl-α-pyrone (6PP) on the soil microbiome, the metabolome, and physiological changes of grapevines. Before treatment application, low levels of plant-parasitic nematodes (Rotylenchulus spp., Xiphinema pachtaicum) were found in the soil, together with pathogens (Fusarium spp., Neonectria spp.) and beneficial microbes (Clonostachys rosea, Pseudomonas spp.). Metagenomic analysis revealed significant treatment impacts in the soil microbiome, with T22 and 6PP treatments increasing Proteobacteria abundance, while slight variations of fungal communities and no significant differences in nematofauna were found. Metabolomic analysis showed that treatments induced grapevines to produce antioxidant secondary metabolites able to boost plant defense against abiotic and biotic stresses and increase nutraceutical grapes’ value. Finally, T22 treatment increased the grapes’ winemaking value, raising their Brix grade. Our results demonstrate that microbial or metabolite-based treatments could affect the soil microbiome composition, grapevine health and resilience, and grapes’ oenological and nutraceutical properties.

Graphical Abstract

1. Introduction

Vine production is a key sector in Italy’s economy, making it one of the largest wine producers in the world. The wine industry contributes to Italy’s Gross Domestic Product (GDP), provides employment, and supports tourism, particularly in regions with strong wine cultures. Exports of Italian wine are also significant, with major markets including the US, Germany, and the UK. According to the latest records from UIV Vinitaly and Ismea, 38 and 40 million tons of fruit were harvested in 2023 and the volume of wine exported was 21.4 million hectoliters [1].
Several factors can impact grape production and, consequently, wine yield. These include environmental conditions (light exposure, temperature, humidity, wind, and water availability), soil characteristics (nutrient content, pH level, and soil microbiome), equilibrium between vegetative growth and fruit production, nutrient availability, hormones (i.e., auxin, gibberellin, and abscisic acid), which can regulate cell elongation and differentiation [2], and soil parasites [3]. Soil pathogens and pests, particularly plant parasitic nematodes (PPNs), affect vine production and, consequently, wine yield [3]. Severe economic losses and damages are caused to vineyards by several PPNs, the most harmful of which are root-knot nematodes (Meloidogyne spp.), the citrus nematode (Tylenchulus semipenetrans), the root lesion nematode (Pratylenchus vulnus) and several species of Dorilaimida (Xiphinema spp.) [4]. In Italy, the most frequently isolated PPN species in vineyards are the ring nematode Macroposthonia xenoplax [5] and the dagger nematode Xiphinema index, vectors of the Grapevine Fanleaf Virus (GFLV), which is the most economically important viral disease of grapevines worldwide [6,7].
Numerous other factors can affect grapevines, including climate changes and agricultural practices, leading to biodiversity loss. The increase in CO2 and meteorological extremes (heat waves, drought, floods, fires, and storms) significantly influence the distribution, abundance, survival, reproduction, and parasitic potential of PPNs and negatively impact the continuum of plant–nematode interactions [8].
Using beneficial microbes, such as fungi from the Trichoderma genus and their metabolites (i.e., secondary metabolites), is a promising strategy to improve plant fitness and quality. As previous studies have demonstrated, the application of these fungi stimulates bacterial and fungal richness and diversity, enhances soil fertility and plant growth [9,10,11], and decreases plant-parasitic nematode populations [12,13].
Moreover, filamentous fungi represent a prolific source of structurally diverse bioactive compounds, including antibiotics, enzymes, organic acids, toxins, and pigments, which can exert beneficial effects, making them of considerable interest in the search for novel bioactive molecules [14]. Trichoderma strains produce bioactive metabolites and enzymes [15,16,17], which can manage soil-borne diseases and specific diseases affecting leaves, stimulate plant growth and nutrient use efficiency, strengthen plant resistance, and reduce agrochemical pollution [18,19,20]. The symptomless colonization of plant tissue, named endophytism, is prevalent among microbial taxa, notably bacteria and fungi, which can enhance host growth, mitigate abiotic stress, and suppress pathogens. While endophytic associations have been confirmed for only a few Trichoderma species, many others likely display conditional endophytic potential [21]. Trichoderma’s transition to endophytism is attributed to three functional traits: the saprotrophic degradation of senescent plant material, the mycoparasitism of early fungal colonizers, and the establishment of mutualistic, non-pathogenic associations with living hosts, facilitating growth promotion and enhanced resistance to biotic and abiotic stressors [19]. Consortia of beneficial microbes and bioactive compounds can be synergistically combined with natural and inorganic products to create highly effective and reliable agricultural formulations [22].
Previous research has extensively documented the multifaceted beneficial effects of Trichoderma spp. in viticulture. For instance, certain strains, such as Trichoderma harzianum T39, T. asperellum T34 or T. atroviride SC1, have demonstrated the ability to induce grapevine resistance to significant fungal pathogens like downy mildew (Plasmopara viticola) through the release of VOCs [23]. Furthermore, studies have shown that Trichoderma application can positively influence soil quality, thus enhancing plant growth, grape productivity, and yield [24,25].
This research examined the impact in vineyards of two selected Trichoderma strains (T. harzianum strain M10 and T. afroharzianum T22) and 6-pentyl-α-pyrone (6PP), one of the metabolites the Trichoderma strains produce, on the nematofauna, microbial communities, plant growth, and metabolomic profiles of leaves and grapes.

2. Materials and Methods

2.1. Fungal Strains and Microbial Metabolites

Fungal cultures were obtained from the collection available at the Department of Agricultural Sciences of the University of Naples Federico II.
T. afroharzianum strain T22 and T. harzianum strain M10 were cultured on Potato Dextrose Agar (PDA-HiMedia Pvt. Ltd., Mumbai, India) and incubated at 25 °C until they reached complete sporulation. Conidia were collected with sterile distilled water by scraping the surface of the culture and concentration was calculated using a Thoma chamber (Sigma Aldrich, Milan, Italy). The suspension was diluted with sterile distilled water to obtain the final concentration required for the inoculum.
The secondary metabolite, 6-pentyl-α-pyrone (6PP), was extracted from the culture filtrate of T. atroviride strain P1 following previously described methods [26]. 6PP was solubilized in water to obtain the final concentration used for the treatments.

2.2. Experimental Trial

The experimental study of Vitis vinifera cv. Fiano di Avellino (approximately 15-year-old plants) was conducted in Irpinia vineyards (Contrada Campore, Chiusano di San Domenico-Avellino (AV), Campania Region, Italy). The cultivation of Vitis vinifera L. cv. Fiano in the Avellino province is typically performed on hilly terrains with favorable sun exposure and sufficient diurnal temperature variation, factors which enhance aromatic complexity and acidity retention in the grapes.
Treatments based on Trichoderma (M10, T22) and metabolite (6PP) were applied monthly by soil drenching (500 mL/plant of 1 × 10⁷ spores/mL for M10 and T22 and 500 mL/plant of 10−6 M for 6PP) from June 2022 until harvesting in October 2022. Controls consisted of water-treated plants. The experimental design consisted of 12 rows (each composed of 30 plants), divided into 4 randomized blocks, 1 for each treatment and control group, for a total of 3 rows (90 plants) per treatment. Plants were spaced at 1.5 m within rows and 2.4 m between rows. In accordance with the DOCG production specifications for Fiano di Avellino, neither irrigation nor fertilization were applied. Moreover, the physicochemical properties of the soil were strictly regulated as outlined in the DOCG guidelines.
The soil condition was evaluated before the application of treatments and at harvesting, while biological parameters and metabolomic analyses were investigated at harvesting only. Specifically, ten soil cores were collected at 30 and 60 cm depths per twenty-five plants; they were pooled and mixed to provide twenty-five composite samples for each depth and for each treatment and further processed to evaluate microbial composition (through culturomics and metagenomics) and nematofauna. Soil sampling was performed as follows: the vineyard was divided into sections characterized by similar soil texture, slope and drainage; samples were taken following a zigzag pattern, uniformly distributed over the entire sampled area, avoiding the outermost points, which can be influenced by uncontrollable environmental factors (wind, rain, and human activities).
Leaf number was measured for twenty plants per treatment, and the total soluble solid (TSS) content was assessed for ten fruits per treatment. TSS content was measured using a Brix hand refractometer (RF.5520 Euromex, Arnhem, The Netherlands), and results were recorded in Brix grades (°Brix). Each sample was cut into two halves, and the juice extracted from each half was used to measure the refractive index.
For metabolomic analysis, 5 biological replicates of leaves and fruits for each treatment were taken and frozen in liquid nitrogen.

2.3. Nematode Communities Extraction and Identification

Soil samples were collected at 30 cm and 60 cm depths during spring (before treatments) and only at 30 cm during autumn (at harvesting) seasons, as described in Section 2.2. Each soil sample was placed in a plastic bag, labeled, and stored in a cold chamber at 7 °C until nematode extraction. Individuals were extracted from 500 cm3 of soil using the centrifuge method, counted, and identified using a stereomicroscope Leica M125 (Leica Biosystems, Wetzlar, Germany).
The morphological identification of species, genus, or family level was based on the major diagnostic characteristics. Results were subjected to statistical analysis to evaluate differences between depths and treatments.

2.4. Microbial Communities Isolation and Identification

Microorganisms were isolated from soil samples, collected as described in Section 2.2, at 30 and 60 cm depths before treatment. Aliquots (100 µL) from the ten-fold serial dilution were spread onto selective solid substrates for fungi (Rose Bengal-Chloramphenicol agar, RBA, HiMedia), supplemented with 0.1% Igepal, (Sigma-Aldrich) and bacteria (Luria Bertani, LB, Sigma-Aldrich) to assess their abundance through the counting of colony-forming units (CFUs) per gram of soil after incubation for 3–7 days at 25 °C. The species were identified through the first morphological analysis of the fungal and bacterial colonies isolated, respectively, on PDA supplemented with 0.1% Ampicillin (Sigma-Aldrich) and LB agar (HiMedia).
The identification was confirmed with molecular analyses, which consisted of the amplification (polymerase chain reaction, PCR), followed by Sanger sequencing, of the fungal ITS regions with the primer pairs ITS1 (5′ TCCGTAGGTGAACCTGCGG 3′)/ITS4 (5′ TCCTCCGCTTATTGATATGC 3′) and of the bacterial 16S ribosomal RNA gene with the primer pairs V3 (5′ CCTACGGGNGGCWGCAG 3′) e V4 (5′ GACTACHVGGGTATCTAATCC 3′). The DNA was extracted from the single colonies using a commercial kit (PureLink™ Genomic DNA Mini Kit, Thermo Fisher Scientific, Waltham, MA, USA). Results obtained for each sample at each depth were averaged.

2.5. Metagenomic Analysis

Soil samples for metagenomic analysis were only collected, as described in Section 2.2, at a 30 cm depth at harvesting. Genomic DNA extraction was performed using NucleoSpin® Soil kits and following manufacturer instructions (Macherey-Nagel GmbH & Co., Duren, Germany). The quality and quantity of extracted DNA were evaluated through UV-Vis spectrophotometry (Infinite M200 Pro Nano-quant, TECAN, Grodig, Austria). Briefly, 2 µL of each sample was placed in a multiwell plate, and the absorbance between 230 and 1000 nm was measured. The DNA was acceptable when the values of A260/A280 and A260/A230 ratios were 1.8–1.9 and 2, respectively.
For each treatment, three biological replicates with the highest DNA quality and quantity were then subjected to shotgun metagenomic analysis. Specifically, DNA sequencing was performed on the Illumina NovaSeq 6000 platform, and taxonomic assignment was carried out with Kraken (v.2) system (Genomix4Life s.r.l., Baronissi, SA, Italy).

2.6. Metabolomic Analysis

Leaf and grape samples (5 biological replicates for each condition) were freeze-dried for 72 h and ground to obtain a fine powder, of which 50 mg was extracted for each sample and analyzed by GC-MS, as previously described by Lotito et al. (2024) [27]. Briefly, dry plant material was extracted with methanol, dichloromethane, and n-hexane (Sigma-Aldrich). After the addition of 500 µL of each solvent, the suspension was vortexed for 30 s and centrifuged at 12,000 rpm for 10 min at 4 °C. The supernatants were collected, pooled, and dried under a gentle nitrogen flow.
The dried extract was then derivatized with 1 mL of N, O bis(trimethylsilyl)trifluoroacetamide (BSTFA) (Merk, Milan, Italy) in an ultrasonic bath for 30 min at room temperature. The derivatives were analyzed using an Agilent 8890 GC instrument (Agilent Technologies, Santa Clara, CA, USA) connected to an Agilent 5977B Inert MS with an HP-5MS capillary column ((5%–phenyl)-methylpolysiloxane stationary phase). The GC program was set as follows: initial temperature of 90 °C, rising at 10 °C/min to 300 °C, then holding at 300 °C for 10 min; solvent delay time set at 5 min. The GC injector was set to splitless mode at 250 °C, and the carrier gas was helium at a flow rate of 1 mL/min. Measurements were carried out in full scan mode (m/z 35–550) with electron impact (EI) ionization (70 eV). The EI ion source and the quadrupole mass filter temperatures were fixed at 230 and 150 °C, respectively.
The identification of metabolites was carried out by comparing the deconvoluted mass spectra with the spectra of known compounds collected in the NIST 20 library.

2.7. Statistical Analysis

Biological parameter data and nematode relative abundance were statistically analyzed (One-way ANOVA) with GraphPad Prism software version 8.4 (GraphPad Software, Boston, MA, USA). Dunnett’s test for the variance analysis of multiple comparisons against CTRL group was used with a 0.05 significance level.
Metagenomics statistical analyses were carried out in R (4.5.0 version) environment and with RStudio (version 4.2.2). Specifically, alpha diversity, Shannon index (H), and beta diversity were calculated, and Principal Coordinate Analysis (PCoA) was performed, with vegan package version 2.7.1 and using Bray–Curtis distance (for PCoA). Stacked bar and PCoA plots were represented with ggplot2 package version 2.7.1. The statistical testing of alpha diversity and log10-normalized abundance of taxa (at phylum level) was carried out using the Kruskal–Wallis test (p < 0.05).
Untargeted metabolomic analysis was performed using Mass Profile Professional software version 13.1.1 (MPP, Agilent Technologies) and MetaboAnalyst version 6.0 [28]. Raw data were first deconvoluted and converted into ELU and FIN formats using AMDIS; then, mass spectra were aligned, and abundance was log10-normalized with MPP. Samples were grouped by the treatment applied and subjected to principal component analysis (PCA) and univariate statistical analyses (one-way ANOVA, Dunnett’s test for multiple comparisons against the control group, CTRL, with the FDR cut-off set as 0.05, and fold change > 2.0 calculated against CTRL) to evaluate differently accumulated metabolites. Finally, hierarchical clustering analysis was performed, using normalized abundance values, and results were reported as heatmaps.

3. Results

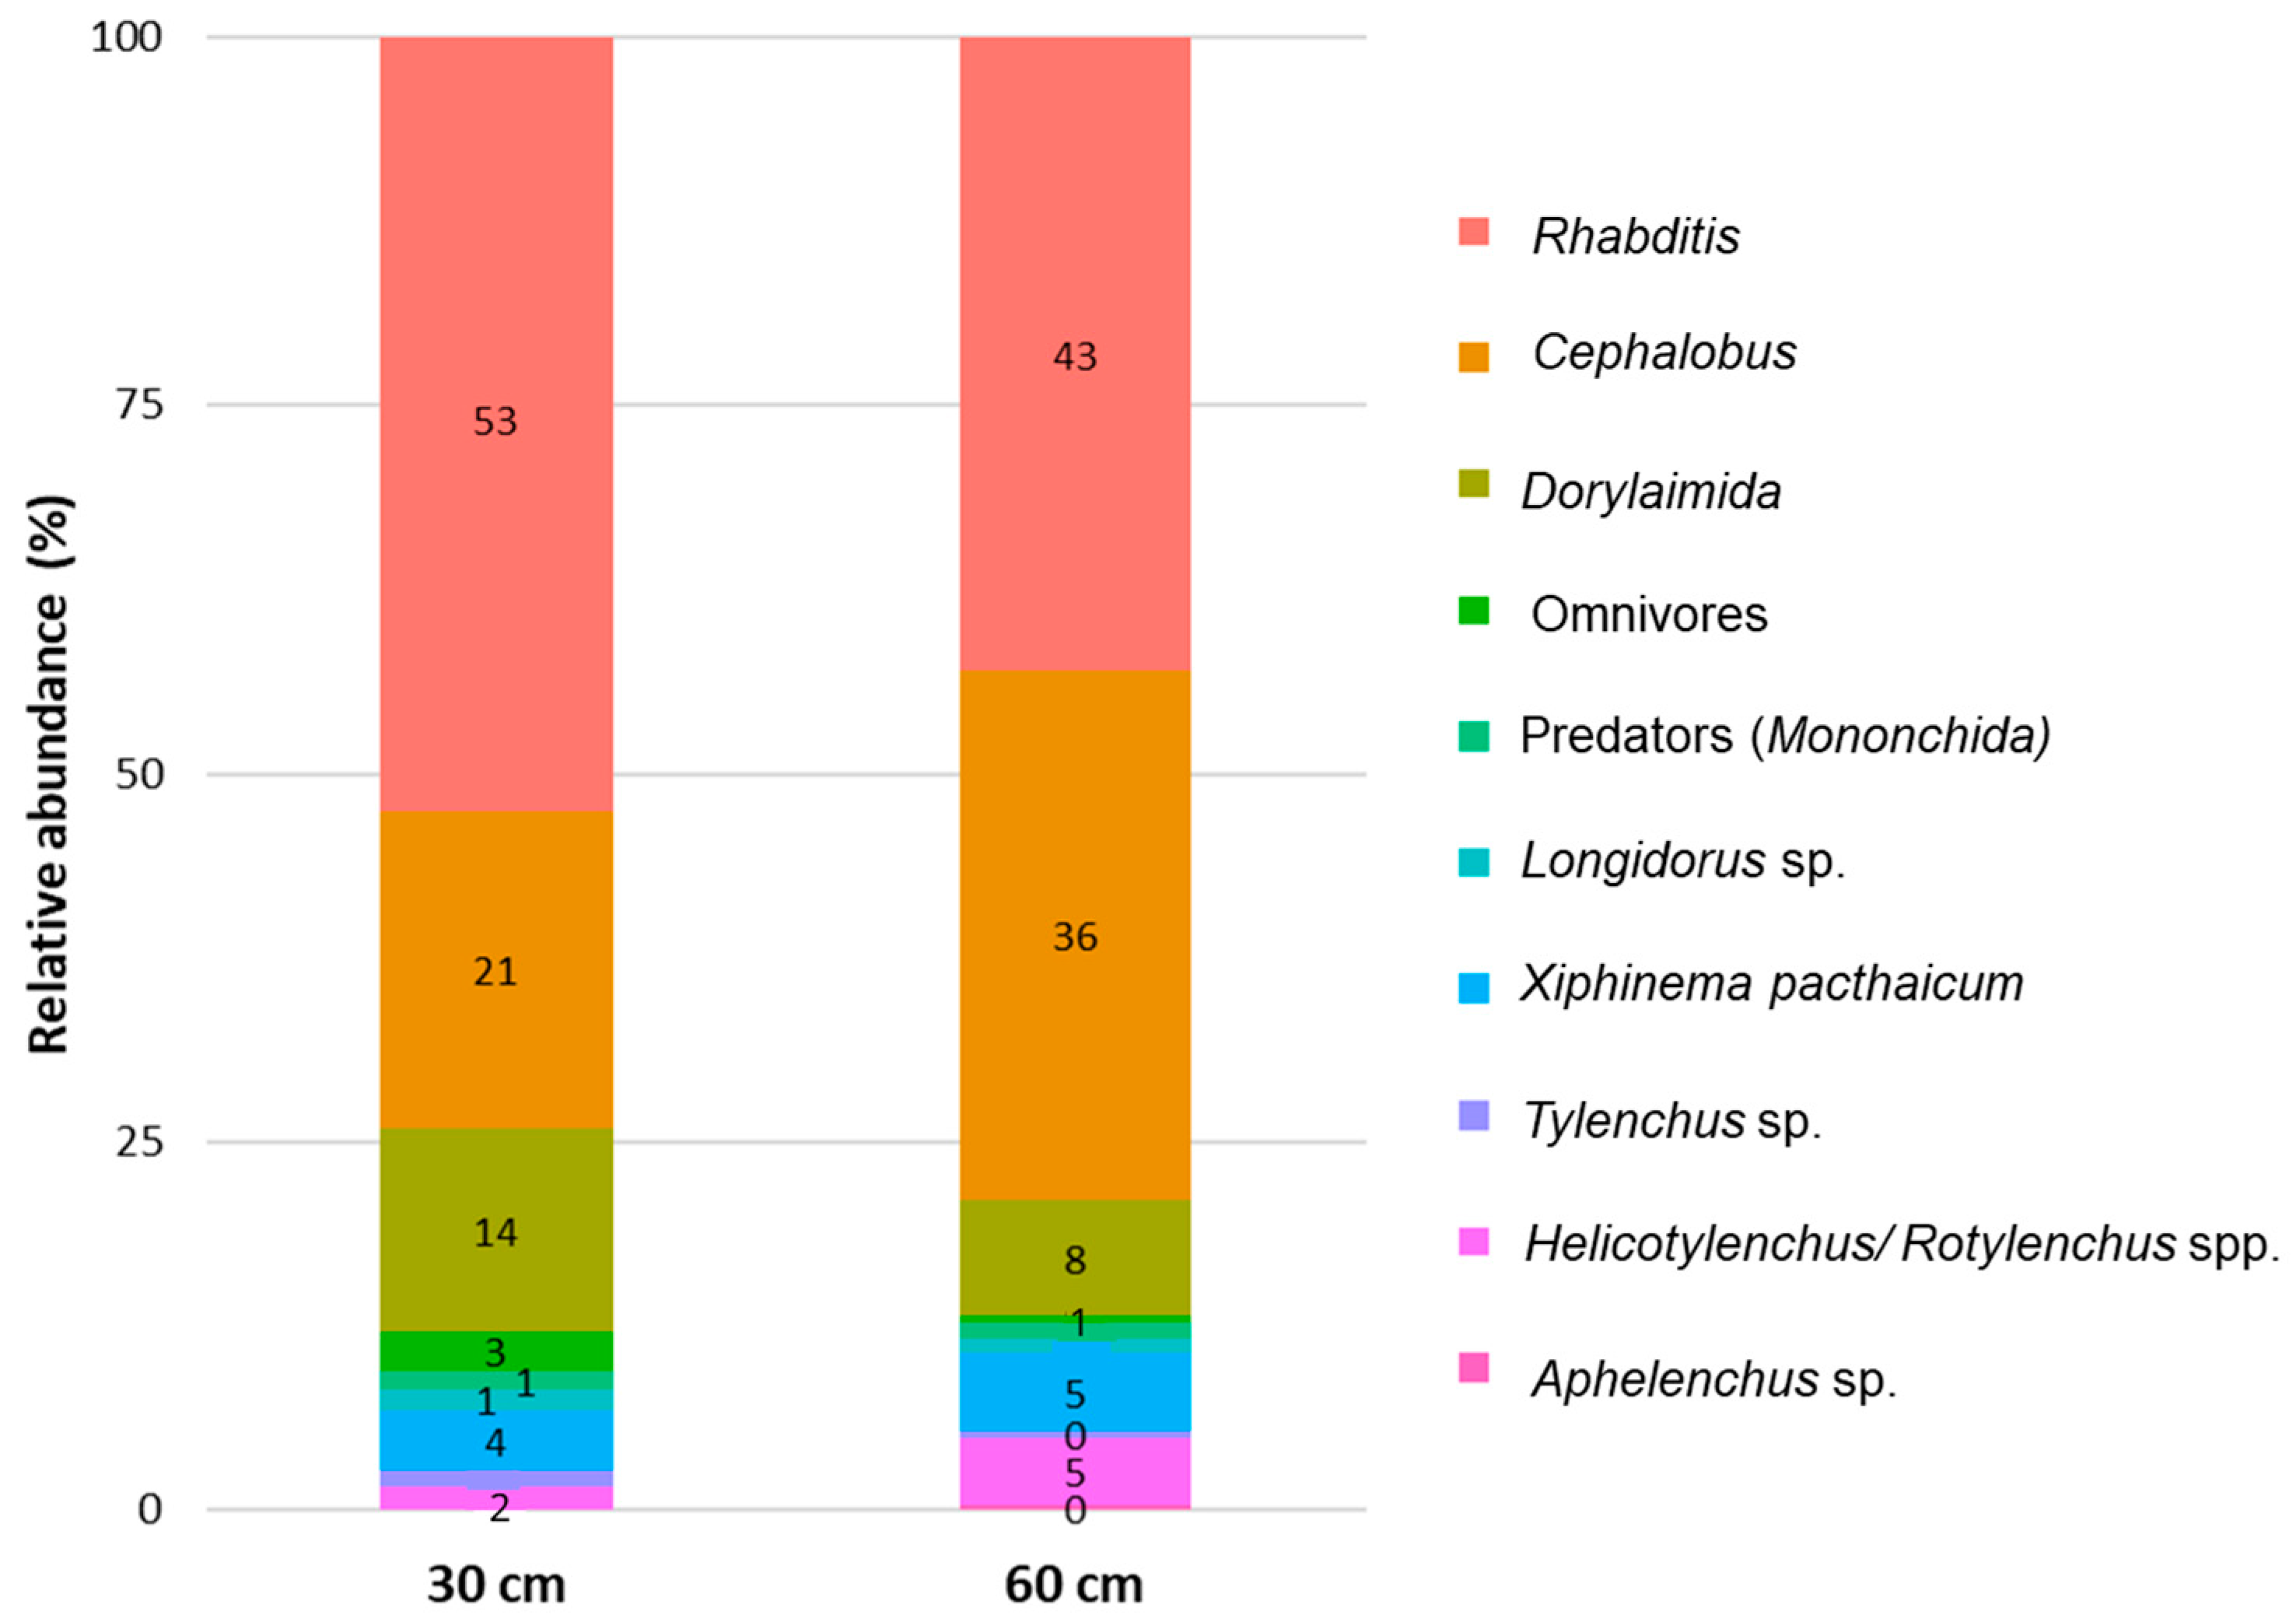
3.1. Nematodes and Microbial Communities Characterization

Soil microbial and nematode communities were analyzed before and after treatments with T. harzianum strain M10, T. afroharzianum T22, and the metabolite 6-pentyl-α-pyrone (6PP). Nine plant-parasitic and free-living nematode families were identified during spring sampling. The bacterial feeder nematodes belonging to the Rhabditidae and Cephalobidae families were the most representative, regardless of season and depth. The population of fungal feeders belonging to the Aphelenchidae family (detritivores) was low. The plant-parasitic relative communities generally showed no X. index, but X. pacthaicum was the most abundant species. However, no differential abundance in nematode communities were found between soil samples at 30 cm and 60 cm depths (Figure 1). During the autumn season, soil samples were only collected at 30 cm depths, and statistical analysis was performed to evaluate differences in nematode communities upon treatments. No significant differences were found among treatments and between spring and autumn sampling.
Alongside nematofauna analysis, cultivable fungal and bacterial species were isolated and characterized (Table 1). While the total abundance of bacteria was consistently higher compared to fungi (averaging 106 cfu/g of soil for bacteria compared to 105 cfu/g for fungi), the diversity of fungal species was greater compared to bacteria. This trend was particularly evident in the 30 cm depth soil samples, where a higher number of distinct fungal species were identified compared to only eight different bacterial species. Among the isolated microorganisms, various plant pathogens as well as several beneficial microbial species were identified.

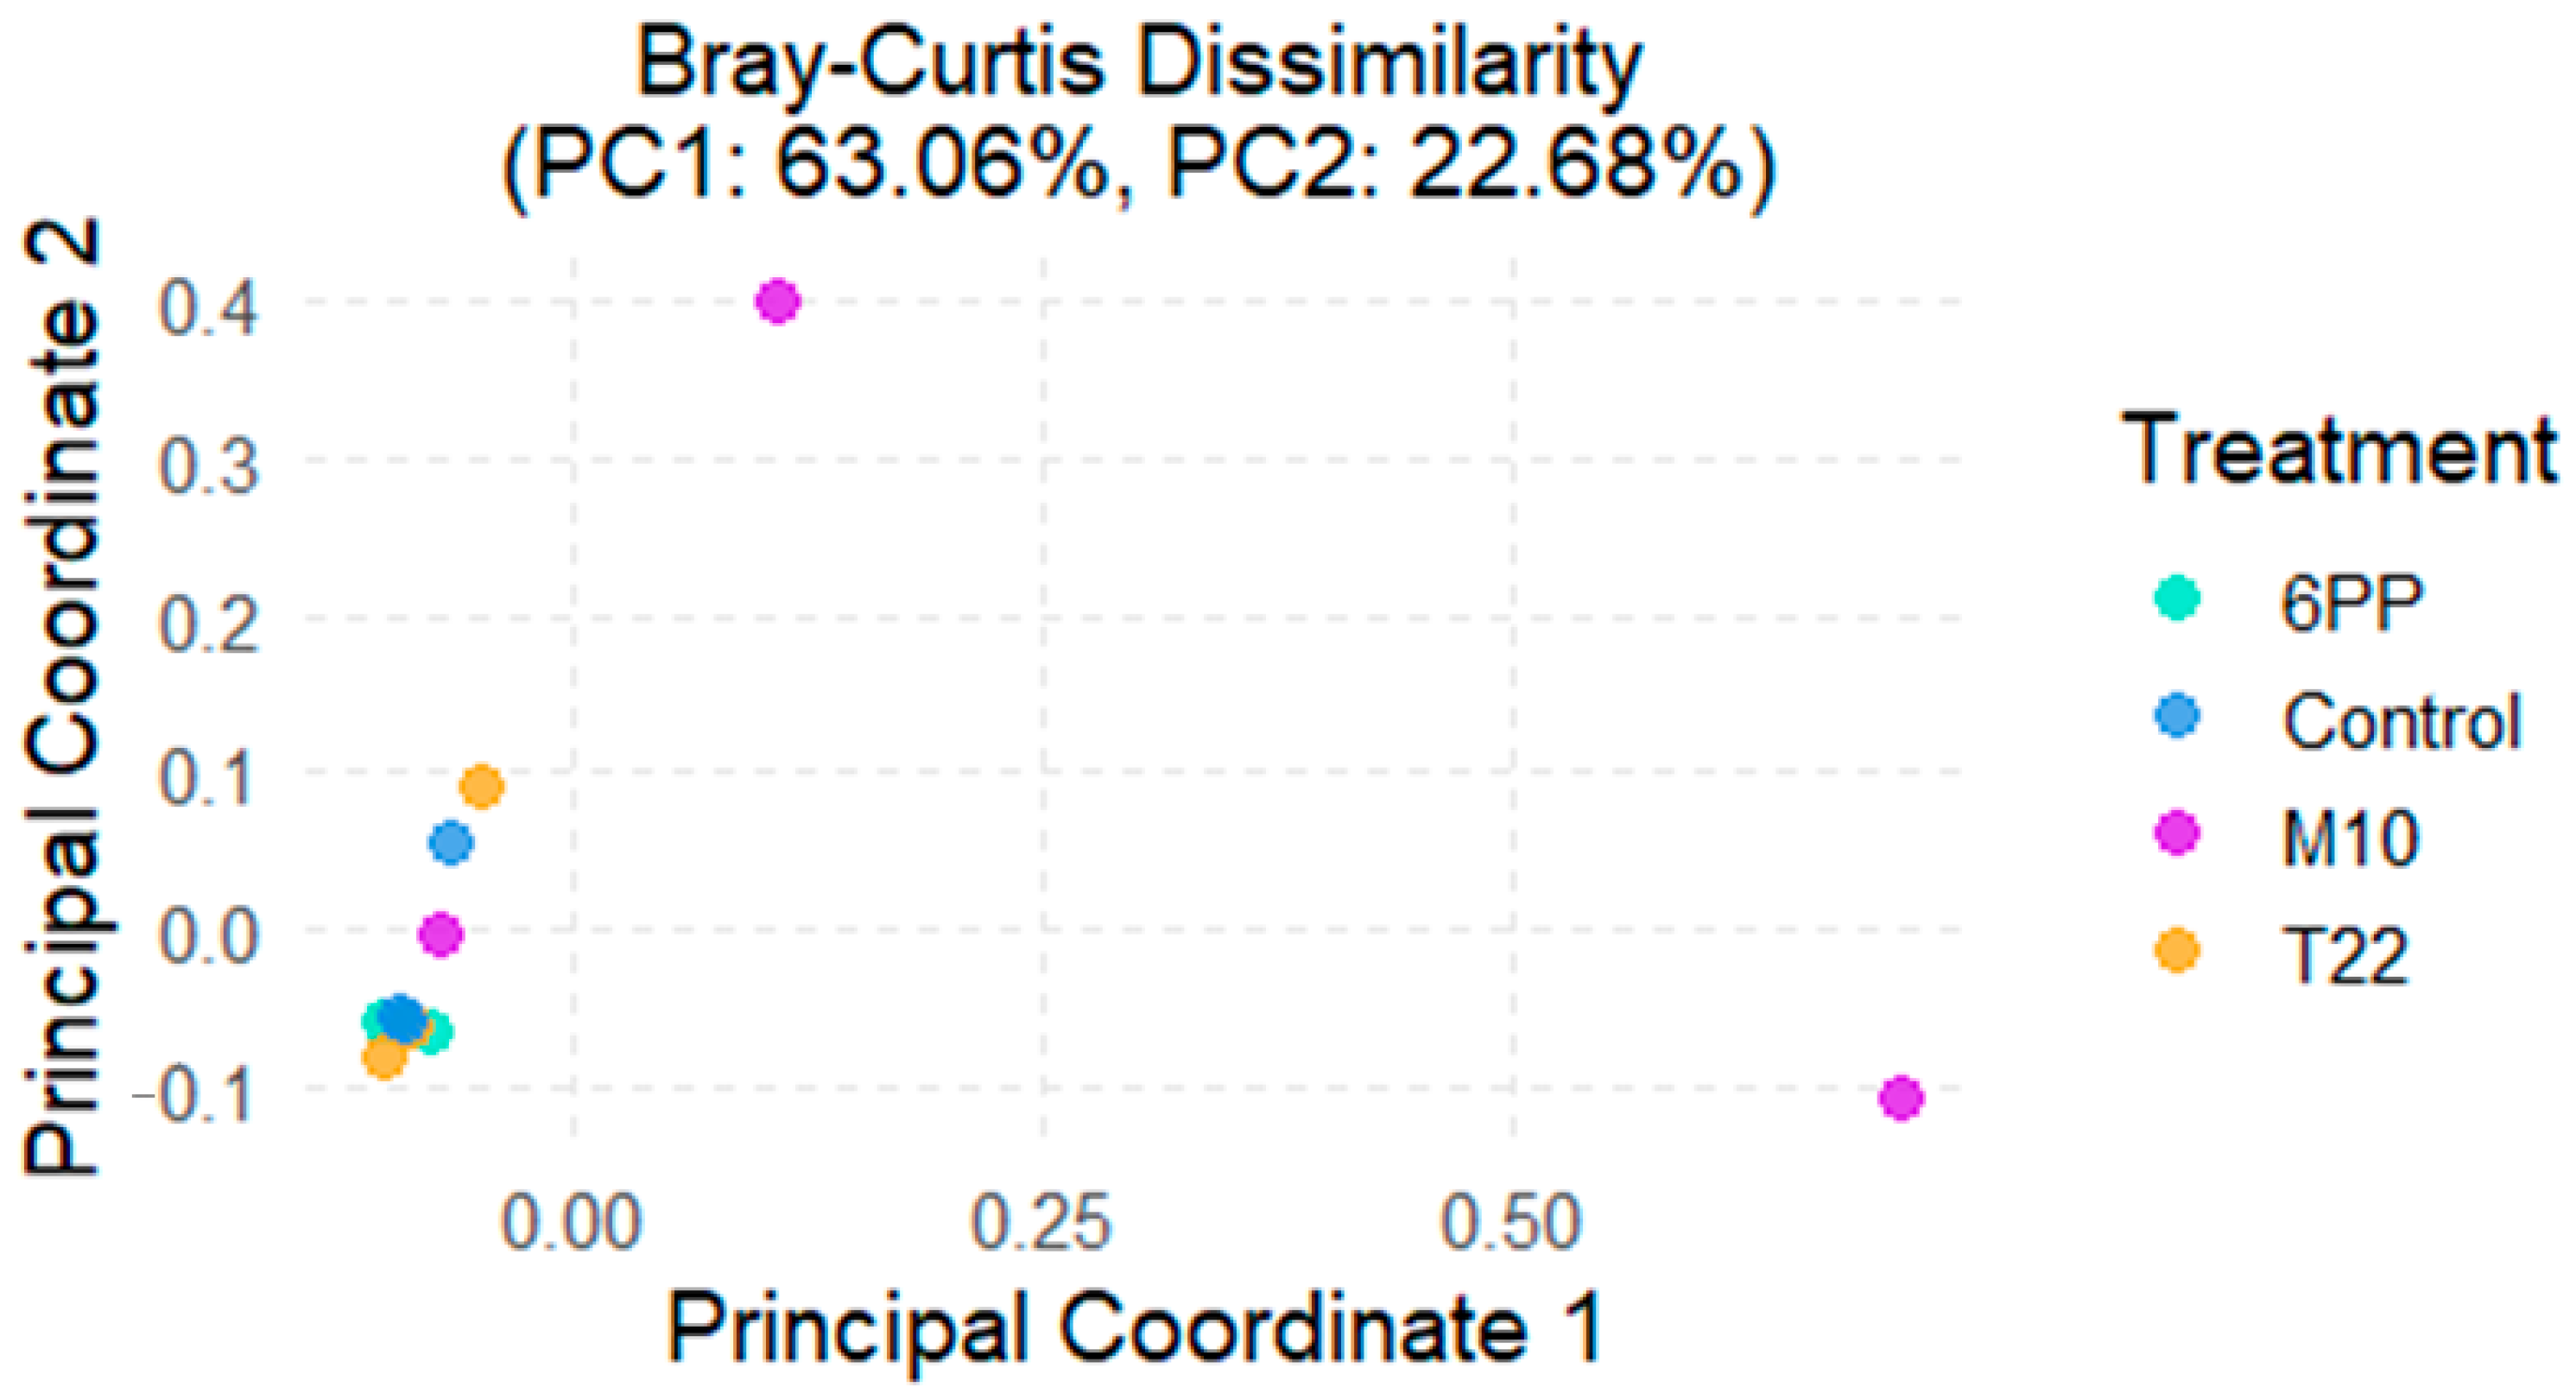
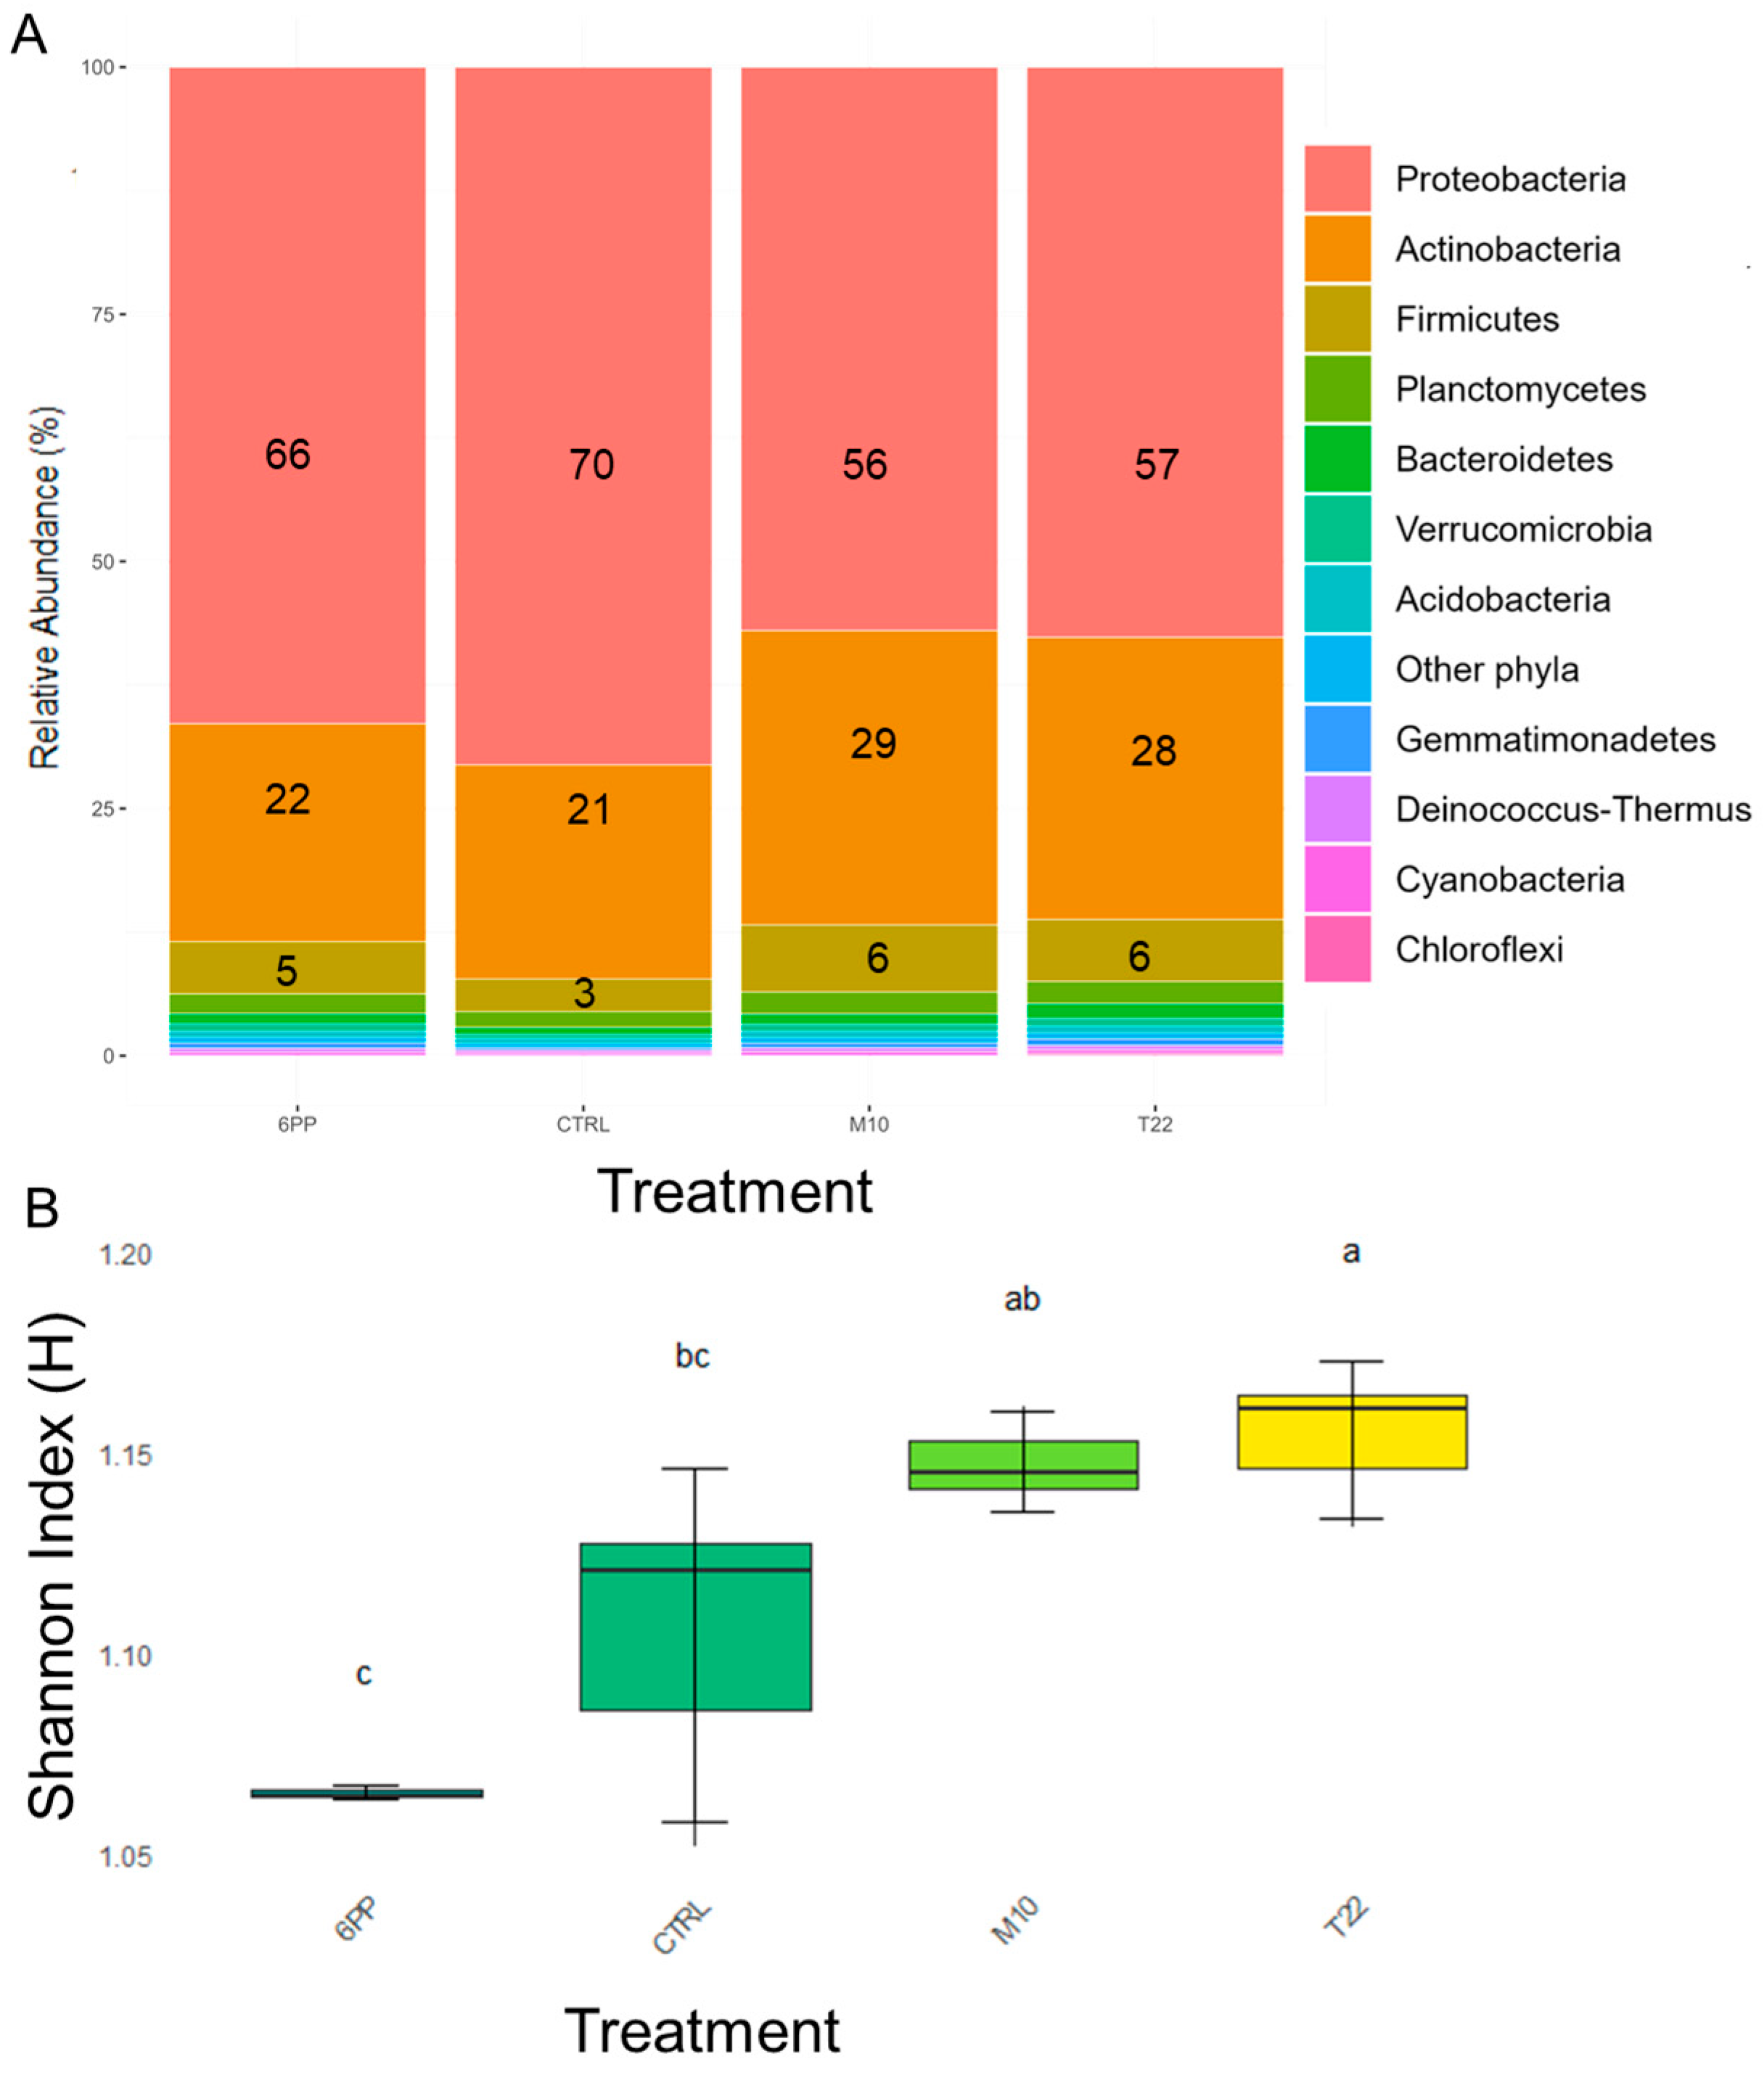
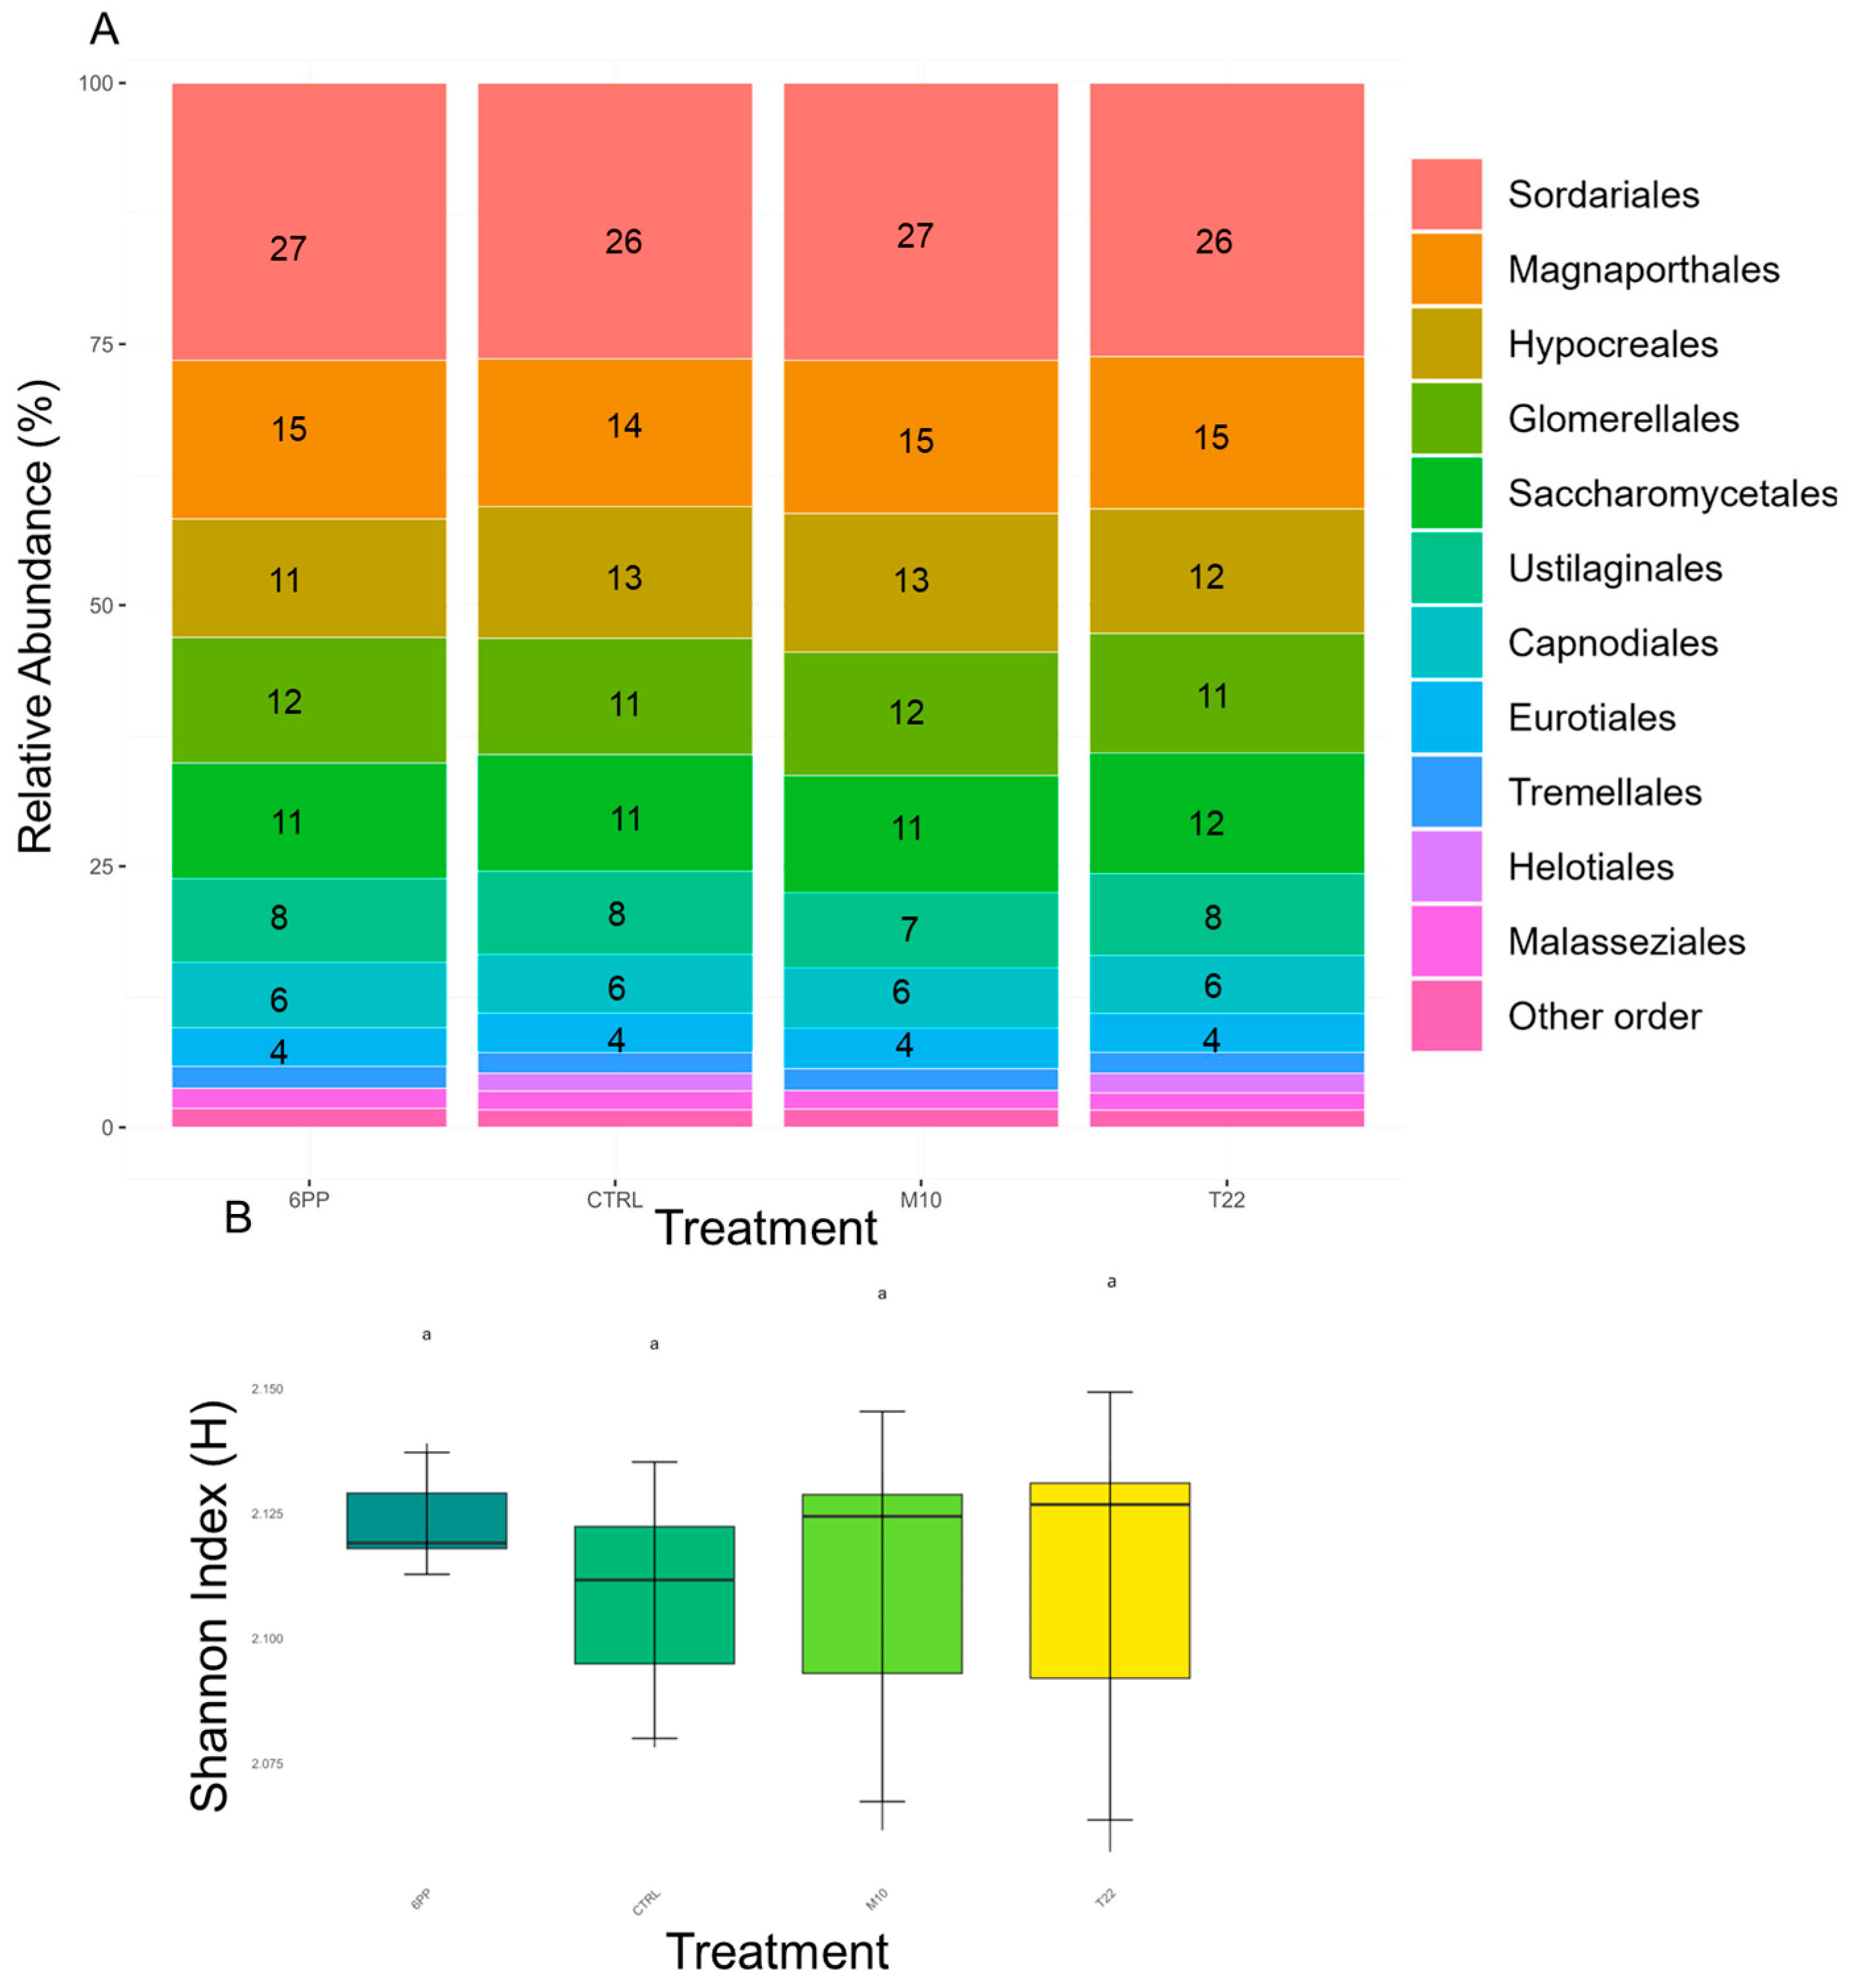
3.2. Soil Microbiome

Metagenomic analysis was employed to assess alterations in the soil microbial community. Considering that the majority of previously isolated (spring sampling, prior to treatments) microorganisms were identified at a depth of 30 cm, subsequent metagenomic analyses focused on samples taken at the same depth (30 cm) at grape harvesting time in autumn. The results revealed that bacteria constituted the most abundant groups of organisms in soil microbial communities, followed by fungi, archaea, and viruses. To understand how different treatments impacted the overall dissimilarity and clustering of microbial communities in the soil, we performed Principal Coordinate Analysis (PCoA) based on Bray–Curtis dissimilarity.
Analysis of beta diversity (Figure 2) revealed slight distinctions in the overall bacterial and fungal community composition among the different treatments. The Principal Coordinate Analysis (PCoA) plot demonstrated that the first two principal coordinates (PC1 and PC2) collectively accounted for 85.74% of the total variance (PC1: 63.06%, PC2: 22.68%). Notably, M10 samples clustered separately from T22, 6PP, and CTRL, despite some inherent biological variability, while CTRL and 6PP samples exhibited a closer relationship.
To further characterize the observed shifts in the overall community structure (beta diversity) and to identify specific bacterial taxonomic groups affected by treatments, we conducted an in-depth analysis of the relative abundance of bacterial phyla, and bacterial alpha diversity was assessed using the Shannon index. This approach allowed the identification of specific taxonomic groups, whose proportions were altered by the treatments, and enabled us to quantify the overall richness and evenness of the bacterial community within each sample.
As shown in Figure 3A, the most abundant group of bacteria identified belonged to the Proteobacteria phylum, including Alpha-, Beta-, Gamma-, Delta-, and Epsilonproteobacteria classes. Their relative abundance was highest in the untreated (CTRL) soil at 70% and in the 6PP-treated soil at 66%. In contrast, soils treated with Trichoderma strains (M10 and T22) showed a decrease in Proteobacteria abundance, accounting for 56% and 57% respectively.
The other major group of bacteria identified was the Terrabacteria group, with Actinobacteria being the second most abundant phylum. They showed an inverse trend; their relative abundance was higher in M10 (29%)- and T22 (28%)-treated soils compared to CTRL (21%) and 6PP (22%). Firmicutes, another major phylum, constituted a smaller proportion, ranging from 3% (CTRL) to 6% (M10, T22). Other bacterial phyla were present in lower abundances across all treatments (Figure 3A). Among gammaproteobacteria, the Gram-negative bacteria Pseudomonas and Bradyrhizobium, typically found in the rhizosphere, were identified (Figure S1). Actinobacteria and Firmicutes were the most represented phyla within the Terrabacteria group, with Streptomycetes being the most abundant family. The Firmicutes phylum further included Gram-positive bacteria such as Bacillus, Clostridium, and Staphylococcus (Figure S1).
Regarding bacterial alpha diversity, assessed by the Shannon index (Figure 3B), significant differences were observed among the treatments (Kruskal–Wallis test, p < 0.05). The 6PP-treated soil exhibited the lowest diversity, being significantly lower than all other treatments, whereas T22 treatment displayed the highest Shannon diversity, significantly higher than both 6PP and the CTRL soils. These results indicated that Trichoderma-based treatments promoted a richer and more evenly distributed bacterial community compared to the 6PP treatment, with T22 leading to the highest observed diversity.
To determine if the observed treatment effects extended to the fungal community, fungal composition was also analyzed at the order level and fungal alpha diversity was assessed. Fungal community analysis revealed a contrasting pattern to that observed for bacteria. Fungal composition at the order level (Figure 4A) showed consistency across all treatments. Sordariales was the overwhelmingly dominant order, consistently representing 26–27% of the total fungal community across all treatment groups. Following Sordariales, Magnaporthales (14–15%), Hypocreales (13–14%), Glomerellales (11–12%), and Saccharomycetales (11–12%) were the next most abundant orders, maintaining stable proportions across all treatments. Minor orders such as Ustilaginales, Capnodiales, Eurotiales, Tremellales, Helotiales, and Malasseziales also showed consistent, albeit smaller, percentages. This high degree of stability in fungal order composition suggested that the applied treatments did not induce substantial shifts at this taxonomic level. Furthermore, the percentage of Pochonia spp. remained relatively constant across treatments (2% for M10, T22, and CTRL, and 3% for 6PP, Figure S2). Correspondingly, fungal alpha diversity, as measured by the Shannon index (Figure 4B), showed no significant differences among any of the treatment groups (Kruskal–Wallis test, p > 0.05), reinforcing the observed stability of the fungal community structure at this level of analysis.
Statistical testing was also carried out for both fungal and bacterial at the order and phylum levels, respectively, to evaluate differences in individual taxa across treatments, by using Kruskal–Wallis test. Results showed no significant differences when focusing on a single taxon.

3.3. Plant Growth and Grape Maturity

The effectiveness of the treatments in terms of plant growth was determined by evaluating the leaf number, whereas the maturity of the grape berries was evaluated by measuring the concentration of sugars in the grapes (grape Brix grades). The number of leaves was unaffected by treatments (Figure 5, left). The sugar content in grapes was significantly affected by T22 treatment (+25%; Figure 5, right).

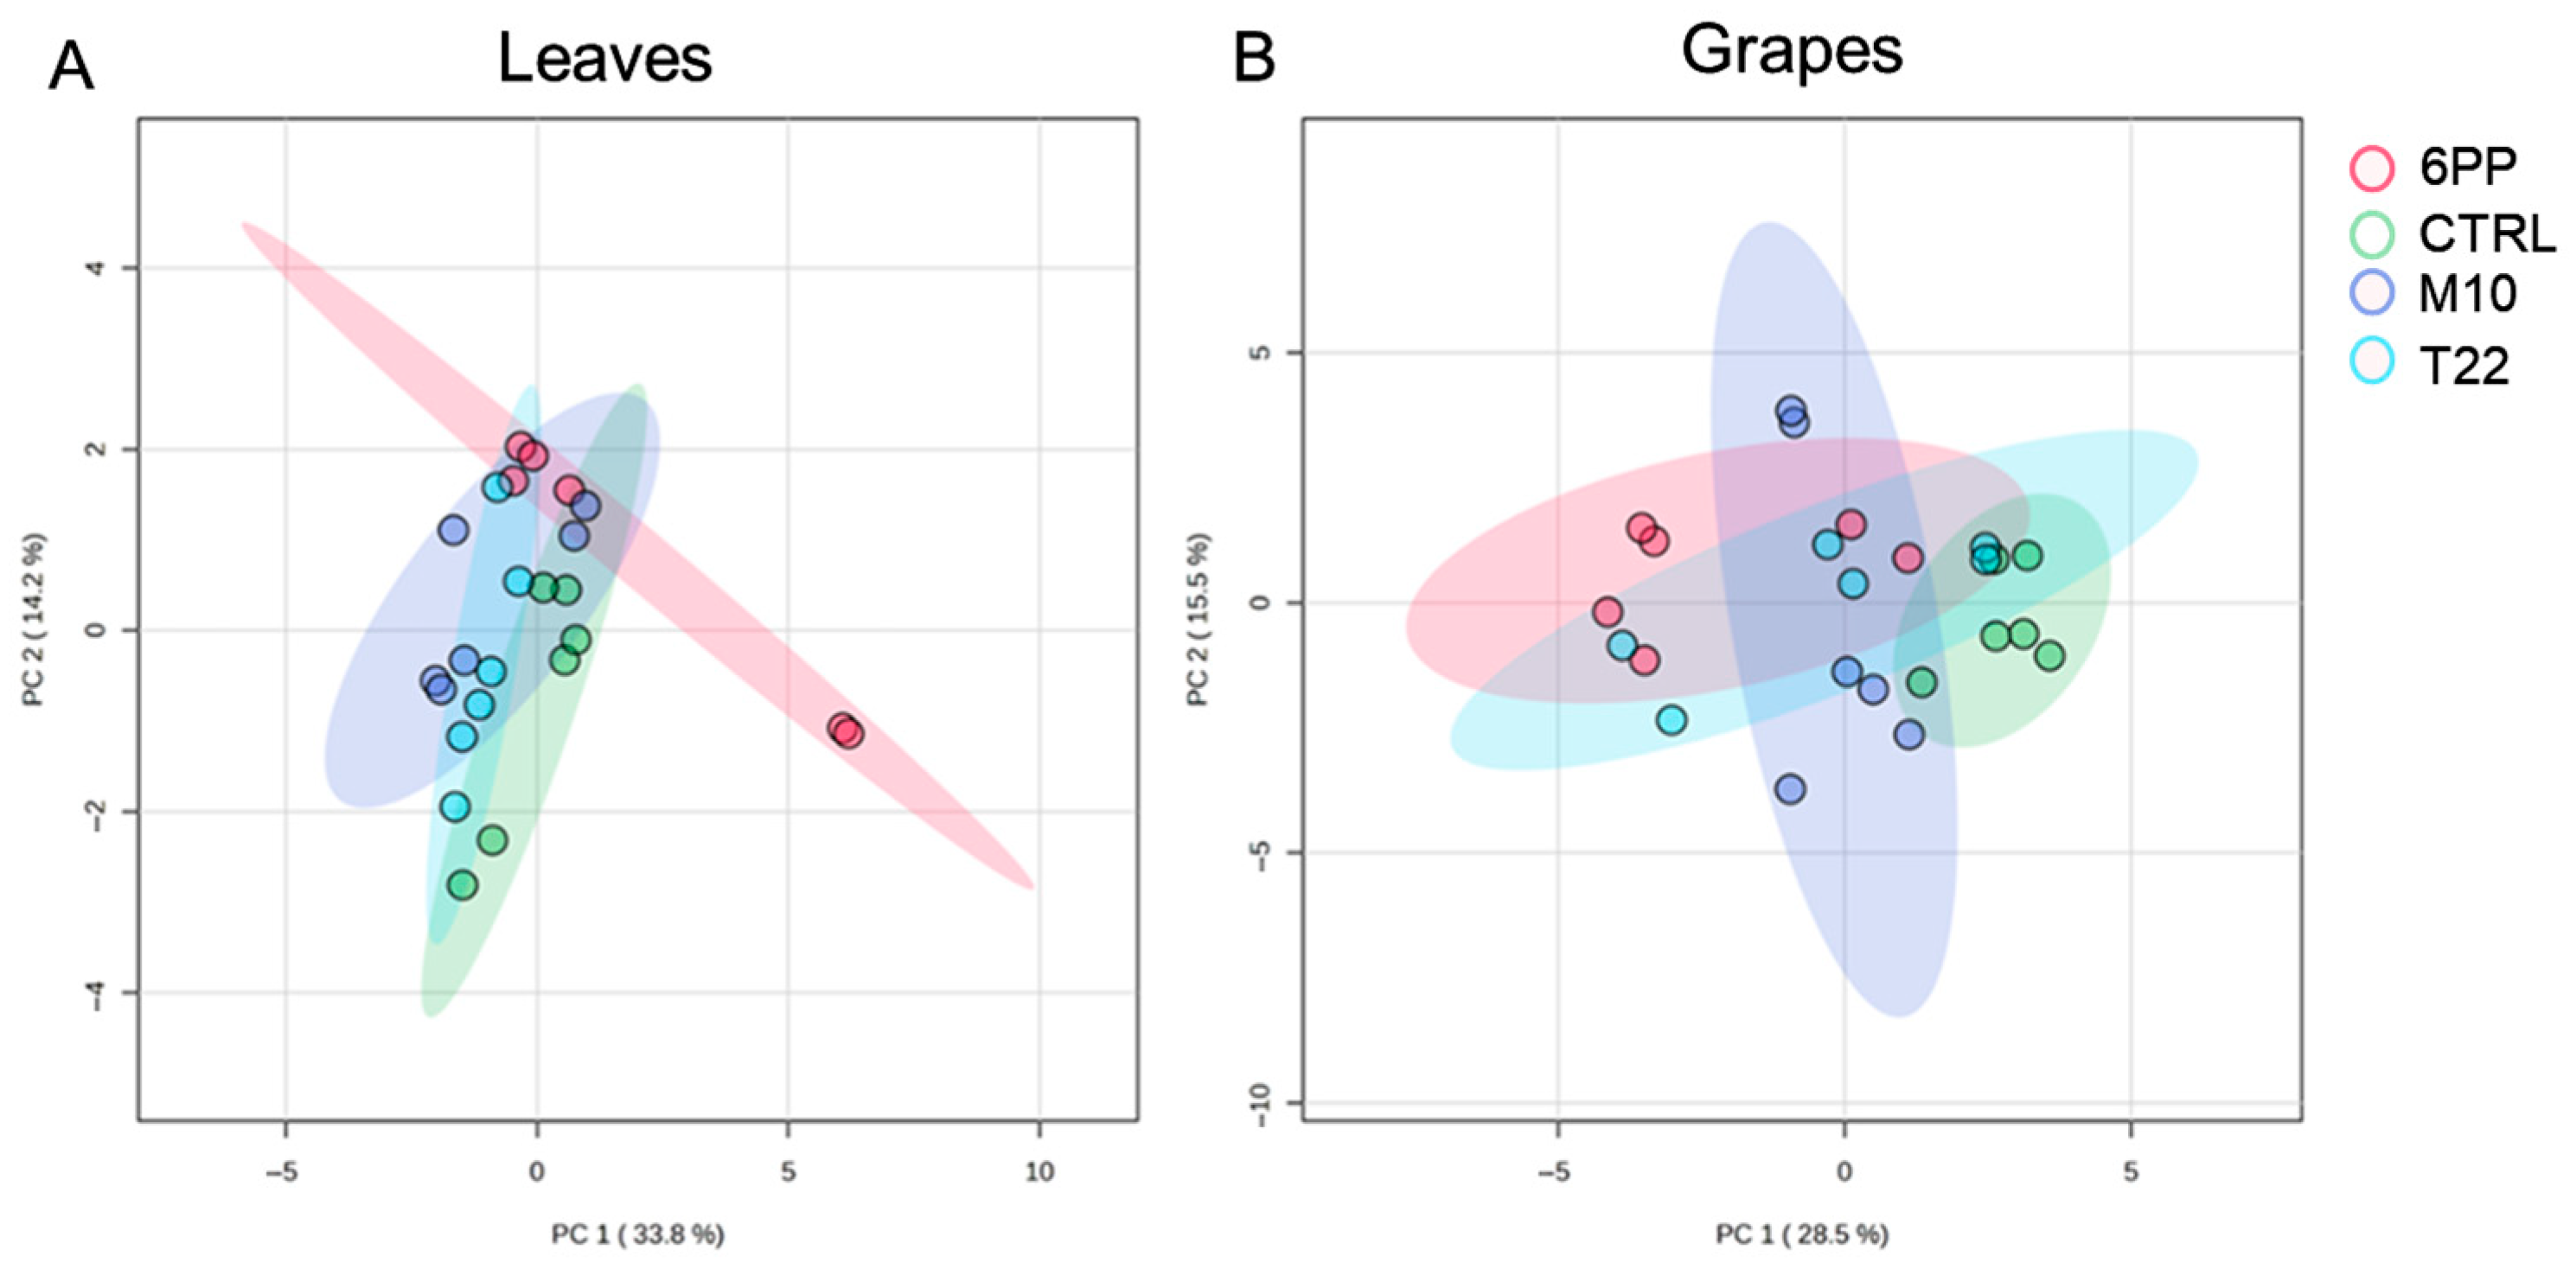
3.4. Untargeted Metabolomic Analysis

An untargeted metabolomic approach was used to evaluate the effects of microbial/metabolite-based treatments on leaves and grapes. Raw data were aligned, normalized, and subjected to statistical analyses. Multivariate analysis was initially conducted to gain a comprehensive view of sample groups’ metabolomic profiles and assess the extent of biological variability. Principal Component Analysis score plots (Figure 6) demonstrated that treatments affected leaves more than grapes. The more precise separation along principal component 1 (33.8%, Figure 6A) and the tighter clustering within groups for leaves compared to grape samples (Figure 6B) confirmed it. Microbial treatments are closer to the control group in the component space, with overlapping biological replicates, whereas the 6PP group is more distinctly separated, particularly along component 1.
Due to these encouraging results, aligned metabolites were identified, and univariate analysis (one-way ANOVA with Dunnet’s post-hoc) was performed to evaluate the impact on the accumulation of secondary metabolites. Statistically significant metabolites are listed in Table 2 and Table 3, along with the regulation (expressed as lnFC) of each treatment compared to untreated plants.
Sixteen metabolites were identified in leaf samples belonging to sugars, organic acids, phytosterols, alcohols, and antioxidants. All treatments increased the abundance of antioxidant molecules (ascorbic acid and m-hydroxybenzoic acid), but only T22-based treatment significantly influenced sugar levels.
Thirteen differential metabolites were identified in grapes, including sugars, organic acids, polyphenols, and one amide (Table 3). All treatments increased organic acid and polyphenol levels. The concentration of glucose and fructose varied in different ways depending on the treatment.

4. Discussion

The composition of soil microbial communities plays a fundamental role in shaping agricultural ecosystems, influencing plant health and crop quality. In vineyards, soil biodiversity, particularly the presence of nematodes, fungi, and bacteria, is crucial for maintaining soil fertility, suppressing diseases, and enhancing plant growth. The interactions between soil microorganisms and plant roots and their ability to control pests contribute to the development of sustainable viticulture practices [29].
Ten nematode species, twenty-three fungal species, and nine bacterial species were found in soil samples collected at 30 and 60 cm depths in the vineyard examined in this study. The diversity of fungi was greater than that of bacteria, despite the abundance of bacteria being consistently higher (106 cfu/g of soil compared to 105 cfu/g of soil, for fungi). This pattern, particularly evident at the 30 cm depth where a broader array of fungal species was identified in contrast to only eight distinct bacterial species, could be attributed to ecological and physiological differences between these microbial groups. The high variability observed within the fungal kingdom is a reflection of their versatility and genetic adaptability to the dynamic rhizosphere environment. Conversely, while bacteria are numerically dominant, their species richness is comparatively limited due to factors such as their simpler cellular organization. Resource competition is one of the main factors of adaptation and niche differentiation between soil bacteria and fungi due to common carbon and energy limitations. Bacteria are 1.4–5 times more efficient with simple organics, while fungi are 1.1–4.1 times better at using complex compounds, and this could be related to the specific carbon source of the soil [30].
Nematodes are significant contributors to the soil food web, are abundant in soil environments, and can be considered environmental indicators [31]. In the tested samples, the most representative nematodes belonged to the family Rhabditidae and the genus Cephalobus. The Rhabditidae contains Insectivora and Dolichura nematodes, some exhibiting entomopathogenic activity against invertebrate pests [32,33,34] that live freely and sustain themselves by consuming bacteria. Moreover, Rhabditidae enrich the soil with essential nutrients and improve plant productivity by decomposing organic matter [35]. The nematodes of the Cephalobidae family can play a positive role in the mineralization of organic phosphorus in agricultural soil [36].
Metagenomic analysis of post-treatment soils revealed distinct shifts in bacterial community composition. Rather than displaying an overall increase, Proteobacteria, the most abundant phylum, decreased in relative abundance in Trichoderma-treated soils (M10 and T22) compared to the control and 6PP-treated soils. Conversely, Actinobacteria, another major phylum, showed an increased relative abundance in Trichoderma-treated soils (M10 and T22). Firmicutes remained at relatively low percentages across all treatments.
The superphylum Proteobacteria represents the majority of identified bacteria. Their varying proportions across treatments suggest a dynamic ecological response. These microbes are involved in nitrogen fixation, sulfur oxidation, and carbon cycle [37]. They can also decompose organic matter, releasing essential nutrients for plant growth [38]. Proteobacteria are highly sensitive to environmental conditions, including soil pH, nutrient availability, and organic matter content [39]. In our study, the shift in Proteobacteria abundance suggests a specific response to the altered soil microenvironment induced by these biostimulants. While the direct correlation of specific environmental parameters and changes in microbial communities was beyond the scope of the present study, it is well-established that soil pH is a primary driver of bacterial community structure, with Proteobacteria often preferring more neutral to alkaline conditions [40]. Trichoderma treatments (M10 and T22) or the 6PP application may have influenced local soil conditions, which in turn may have impacted the competitive dynamics, favoring other phyla (e.g., Actinobacteria) over Proteobacteria. Future studies could measure environmental parameters, including pH, to elucidate the mechanisms driving these observed shifts in Proteobacteria abundance.
Firmicutes and gammaproteobacteria (a class within Proteobacteria), such as Pseudomonas, are well-studied plant probiotics. They can metabolize sugars and amino acids in root exudates (reducing their availability to harmful organisms like pathogens, insect larvae, and nematodes) and can boost the levels of secondary microbial products that act as natural protectants in the soil [41].
The Serratia genus (rhizobacteria of the gammaproteobacteria family) produces natural compounds that inhibit the growth and reproduction of nematodes, sometimes causing their death. They produce secondary metabolites, enzymes, and elicitors that activate the plant immune system, improving resistance to nematode attacks [42]. Pseudomonas fluorescens, a Gram-negative bacterium of the gammaproteobacteria class, produces pyoluteorin and 2,4-diacetylphloroglucinol, which inhibit nematode growth and affect their behavior. These bacteria also induce systemic resistance in plants [43].
Actinobacteria and Firmicutes are prominent phyla in soil samples and are key components of the Terrabacteria group. Streptomycetes (Actinobacteria) can produce antibiotics such as avermectin (Streptomyces avermitilis), as well as volatile organic compounds (VOCs) that affect nematode behavior and physiology [44,45]. They also play a crucial role in decomposing organic matter and recycling nutrients [46].
The Firmicutes phylum includes Bacillus species that act as nematicides and induce systemic resistance in plants [47]. These bacteria compete with nematodes for nutrients and rhizosphere space [48].
The application of Trichoderma (T22, M10) or 6PP led to no significant changes in overall fungal community composition or alpha diversity at the order level. This stability suggests that these treatments did not exert strong selective pressures on the dominant fungal groups. However, the application of Trichoderma (T22, M10) or 6PP did lead to subtle but intriguing variations in fungal and nematode communities, with the specifics changing based on the treatment used. These findings are consistent with those Savazzini et al. reported for fungal communities and Carrascosa et al. reported for nematode distribution [49,50].
Nematode control can occur through direct mechanisms, such as killing, paralyzing, or repelling nematodes, as well as through indirect mechanisms, including the production of toxins, competition for space and resources within the roots, alterations in root tissue physiology, and the production of plant hormones and metabolites. These indirect effects can enhance plant resilience, improve nitrogen fixation, and increase the efficiency of nutrient uptake [51]. Recent studies have shown that Trichoderma application can control nematodes by direct control mechanisms and by regulating plant defense mechanisms [52,53].
Furthermore, the impact of treatments on grape quality was evaluated. In agreement with Csótó et al. (2022), who found out that the Trichoderma application significantly increased the Brix grade for different cultivars and clones [54], T22 treatment significantly increased grape Brix grade. Trichoderma strains are well-known for their plant growth-promoting abilities, which include enhancing nutrient solubilization and uptake (e.g., phosphorus, potassium, micronutrients), improving root architecture, and inducing systemic resistance to various stresses [19]. The differential effect between T22 and M10 (i.e., Brix Grade), despite both being Trichoderma strains, highlights the strain-specific nature of plant–microbe interactions.
An untargeted metabolomic analysis demonstrated that treatments altered sugars, organic acids, and antioxidant metabolites both in leaves and grapes. Sugar and organic acid levels are characteristic of the stage of grape development and influence grape flavor and quality. The undetectable levels of sucrose and the enhanced concentrations of fructose or glucose in grapes indicated its conversion into these simpler sugars (characteristic conversion of the ripening phase of berry development) [55].
In contrast to the conclusions drawn by Ali et al. [56], who suggested that the organic acid concentrations peaked during the green and véraison stages and declined in the maturation phase, our findings reveal that tartaric and malic acid levels increase during maturation. These data are important from an oenological point of view because organic acids impact the grapes’ flavor and define the wine’s flavor profile [57,58]. Finally, in agreement with Pascale et al. [25], treatments with selected Trichoderma strains and the metabolite 6PP boosted the plant’s resistance to oxidation, by stimulating the production of ascorbic acid and m-hydroxybenzoic acid in leaves and polyphenol levels in grapes. These data are important because the grape polyphenols affect grapes’ and wines’ aroma, shelf life, and nutraceutical properties [59].

5. Conclusions

This study comprehensively investigated the effects of selected Trichoderma strains (T. harzianum M10 and T. afroharzianum T22) and the bioactive metabolite 6PP on vineyard ecosystems, involving the soil microbiome, metabolome, and grapevine physiological responses. While no significant changes were observed in plant-parasitic nematode communities or overall fungal community composition, bacterial communities in the soil were altered by the treatments. Specifically, T22 treatment enriched bacterial diversity and shifted the abundance of bacterial phyla like Proteobacteria and Actinobacteria. Furthermore, the application of these microbial agents and metabolites influenced grapevine physiology, with the T22 strain significantly enhancing grape sugar content (Brix grade), thus improving its winemaking value. Metabolomic analyses revealed that all tested treatments boosted the production of antioxidant secondary metabolites in grapevine leaves, contributing to enhanced plant defense and the nutraceutical value of the grapes. These findings collectively demonstrate the potential of Trichoderma-based interventions to positively impact the soil microbiome, strengthen grapevine health and resilience, and improve the oenological and nutraceutical qualities of grapes, highlighting their potential as sustainable biotechnological tools in viticulture.

Supplementary Materials

The following supporting information can be downloaded at: https://www.mdpi.com/article/10.3390/agriculture15131441/s1, Figure S1: Effect of Trichoderma and 6-pentyl-α-pyrone-based treatments on bacterial community composition. Bacterial community composition is reported at the genus level, displaying the 10 most abundant bacterial genera. Soils were treated with T. harzianum strain M10 (M10), T. afroharzianum strain T22 (T22), 6-pentyl-α-pyrone (6PP), and left untreated (CTRL). Soil samples were collected at 30 cm depth at harvesting; Figure S2: Effect of Trichoderma and 6-pentyl-α-pyrone-based treatments on fungal community composition. Fungal community composition is reported at the genus level, displaying the 10 most abundant fungal genera. Soils were treated with T. harzianum strain M10 (M10), T. afroharzianum strain T22 (T22), 6-pentyl-α-pyrone (6PP), and left untreated (CTRL). Soil samples were collected at 30 cm depth at harvesting; Figure S3: Hierarchical clustering heatmap of metabolic profiles in grape leaf extracts. The heatmap illustrates the relative abundance of metabolites detected by GC-MS in grape leaf extracts from different treatment groups: Control (CTRL), 6-pentyl-alpha-pyrone (6PP), T. harzianum M10 (M10), and T. afroharzianum T22 (T22). Each row represents a single metabolite, and each column represents an individual sample. The color intensity indicates the normalized relative abundance of each metabolite, with red representing higher abundance and blue representing lower abundance, as shown in the color scale bar; Figure S4: Hierarchical clustering heatmap of metabolic profiles in grape berries extracts. The heatmap illustrates the relative abundance of metabolites detected by GC-MS in grape leaf extracts from different treatment groups: Control (CTRL), 6-pentyl-alpha-pyrone (6PP), T. harzianum M10 (M10), and T. afroharzianum T22 (T22). Each row represents a single metabolite, and each column represents an individual sample. The color intensity indicates the normalized relative abundance of each metabolite, with red representing higher abundance and blue representing lower abundance, as shown in the color scale bar.

Author Contributions

I.D.: data curation, methodology, writing—original draft, writing—review and editing. G.d.: investigation, validation, writing—review and editing. E.T.: methodology, investigation. C.G.: formal analysis, investigation. A.V.: investigation, validation, data curation. D.L.: data curation, investigation. A.S.: methodology, validation, writing—original draft, writing—review and editing. G.P.: Conceptualization; supervision. F.P.d.: supervision, visualization. M.L.: funding acquisition, visualization, project administration. F.V.: conceptualization, project administration, supervision, writing—review and editing. All authors have read and agreed to the published version of the manuscript.

Funding

This work has been supported by DIONISO Project (PSR Campania 2014–2020—Azione 2 “Sostegno ai POI”), 2019–2021.

Institutional Review Board Statement

Not applicable.

Data Availability Statement

The original contributions presented in this study are included in the article. Further inquiries can be directed to the corresponding author.

Conflicts of Interest

The authors declare no conflicts of interest. The funders had no role in the design of the study; in the collection, analyses, or interpretation of data; in the writing of the manuscript; or in the decision to publish the results.

References

  1. UIV. Italy Wine Report. 2023. Available online: https://www.tridge.com/it/market-reports/italy-wine-report-2023-challenging-season-for-italian-producers (accessed on 20 April 2024).
  2. Ribalta-Pizarro, C.; Muñoz, P.; Munné-Bosch, S. Tissue-specific hormonal variations in grapes of irrigated and non-irrigated grapevines (Vitis vinifera cv. “Merlot”) growing under mediterranean field conditions. Front. Plant Sci. 2021, 12, 621587. [Google Scholar] [CrossRef]
  3. Smith, H.M.; Clarke, C.W.; Smith, B.P.; Carmody, B.M.; Thomas, M.R.; Clingeleffer, P.R.; Powell, K.S. Genetic identification of SNP markers linked to a new grape phylloxera resistant locus in Vitis cinerea for marker-assisted selection. BMC Plant Biol. 2018, 18, 13. [Google Scholar] [CrossRef] [PubMed]
  4. Askary, T.H.; Khalil, A.; Nazir, N.; Khan, A.A.; Banday, S.A. Nematode parasites of grapevines. In Sustainable Agriculture Reviews 31; Lichtfouse, E., Ed.; Springer Nature: Berlin/Heidelberg, Germany, 2018; pp. 389–423. [Google Scholar]
  5. Malossini, U.; Ioriatti, C.; Mescalchin, E.; Varner, M.; Giacometti, R.; D’Errico, F.P. The nematofauna associated to grapevine in Trentino (Italia Settentrionale). Redia 2008, 91, 147–150. [Google Scholar]
  6. M’rabet Samaali, B.; Loulou, A.; MougouHamdane, A.; Kallel, S. Acquisition and transmission of Grapevine fanleaf virus (GFLV) by Xiphinema index and Xiphinema italiae (Longidoridae). J. Helminthol. 2024, 98, e26. [Google Scholar] [CrossRef]
  7. Nguyen, V.C.; Villate, L.; Gutierrez-Gutierrez, C.; Castillo, P.; Van Ghelder, C.; Plantard, O.; Esmenjaud, D. Phylogeography of the soil-borne vector nematode Xiphinema index highly suggests Eastern origin and dissemination with domesticated grapevine. Sci. Rep. 2019, 9, 7313. [Google Scholar] [CrossRef]
  8. Dutta, T.K.; Phani, V. The pervasive impact of global climate change on plant-nematode interaction continuum. Front. Plant Sci. 2023, 14, 1143889. [Google Scholar] [CrossRef] [PubMed]
  9. Iacomino, G.; Bonanomi, G.; Motti, R.; Idbella, M. Trick of the Trade: Unveiling the Importance of Feedstock Chemistry in Trichoderma-Organic Amendments-Based Bio-Stimulants. Horticulturae 2023, 9, 957. [Google Scholar] [CrossRef]
  10. Illescas, M.; Rubio, M.B.; Hernández-Ruiz, V.; Morán-Diez, M.E.; Martínez de Alba, A.E.; Nicolás, C.; Monte, E.; Hermosa, R. Effect of Inorganic N Top Dressing and Trichoderma harzianum Seed-Inoculation on Crop Yield and the Shaping of Root Microbial Communities of Wheat Plants Cultivated Under High Basal N Fertilization. Front. Plant Sci. 2020, 11, 575861. [Google Scholar] [CrossRef]
  11. Zhang, F.; Huo, Y.; Cobb, A.B.; Luo, G.; Zhou, J.; Yang, G.; Wilson, G.W.T.; Zhang, Y. Trichoderma biofertilizer links to altered soil chemistry, altered microbial communities, and improved grassland biomass. Front. Microbiol. 2018, 9, 848. [Google Scholar] [CrossRef]
  12. Bonanomi, G.; Lorito, M.; Vinale, F.; Woo, S.L. Organic amendments, beneficial microbes, and soil microbiota: Toward a unified framework for disease suppression. Annu. Rev. Phytopathol. 2018, 56, 1–20. [Google Scholar] [CrossRef]
  13. Nafady, N.A.; Sultan, R.; El-Zawahry, A.M.; Mostafa, Y.S.; Alamri, S.; Mostafa, R.G.; Hashem, M.; Hassan, E.A. Effective and Promising Strategy in Management of Tomato Root-Knot Nematodes by Trichoderma harzianum and Arbuscular Mycorrhizae. Agronomy 2022, 12, 315. [Google Scholar] [CrossRef]
  14. Venkatachalam, M.; Gérard, L.; Milhau, C.; Vinale, F.; Dufossé, L.; Fouillaud, M. Salinity and Temperature Influence Growth and Pigment Production in the Marine-Derived Fungal Strain Talaromyces albobiverticillius 30548. Microorganisms 2019, 7, 10. [Google Scholar] [CrossRef] [PubMed]
  15. Dini, I.; Alborino, V.; Lanzuise, S.; Lombardi, N.; Marra, R.; Balestrieri, A.; Ritieni, A.; Woo, S.L.; Vinale, F. Trichoderma enzymes for degradation of aflatoxin B1 and ochratoxin A. Molecules 2022, 27, 3959. [Google Scholar] [CrossRef]
  16. Nicoletti, R.; Vinale, F. Bioactive Compounds from Marine-Derived Aspergillus, Penicillium, Talaromyces and Trichoderma Species. Mar. Drugs 2018, 16, 408. [Google Scholar] [CrossRef]
  17. Vinale, F.; Sivasithamparam, K. Beneficial effects of Trichoderma secondary metabolites on crops. Phytother. Res. 2020, 34, 2835–2842. [Google Scholar] [CrossRef]
  18. Lombardi, N.; Salzano, A.M.; Troise, A.D.; Scaloni, A.; Vitaglione, P.; Vinale, F.; Marra, R.; Caira, S.; Lorito, M.; d’Errico, G.; et al. Effect of Trichoderma bioactive metabolite treatments on the production, quality, and protein profile of strawberry fruits. J. Agric. Food Chem. 2020, 68, 7246–7258. [Google Scholar] [CrossRef] [PubMed]
  19. Woo, S.L.; Hermosa, R.; Lorito, M.; Monte, E. Trichoderma: A multipurpose, plant-beneficial microorganism for eco-sustainable agriculture. Nat. Rev. Microbiol. 2023, 21, 312–326. [Google Scholar] [CrossRef]
  20. Woo, S.L.; Pepe, O. Microbial consortia: Promising probiotics as plant biostimulants for sustainable agriculture. Front. Plant Sci. 2018, 9, 1801. [Google Scholar] [CrossRef]
  21. Druzhinina, I.S.; Seidl-Seiboth, V.; Herrera-Estrella, A.; Horwitz, B.A.; Kenerley, C.M.; Monte, E.; Mukherjee, P.K.; Zeilinger, S.; Grigoriev, I.V.; Kubicek, C.P. Trichoderma: The genomics of opportunistic success. Nat. Rev. Microbiol. 2021, 9, 749–759. [Google Scholar] [CrossRef]
  22. Comite, E.; El-Nakhel, C.; Rouphael, Y.; Ventorino, V.; Pepe, O.; Borzacchiello, A.; Vinale, F.; Rigano, D.; Staropoli, A.; Lorito, M.; et al. Bioformulations with Beneficial Microbial Consortia, a Bioactive Compound and Plant Biopolymers Modulate Sweet Basil Productivity, Photosynthetic Activity and Metabolites. Pathogens 2021, 10, 870. [Google Scholar] [CrossRef]
  23. Lazazzara, V.; Vicelli, B.; Bueschl, C.; Parich, A.; Pertot, I.; Schuhmacher, R.; Perazzolli, M. Trichoderma spp. volatile organic compounds protect grapevine plants by activating defense-related processes against downy mildew. Physiol. Plant. 2021, 172, 1950–1965. [Google Scholar] [CrossRef] [PubMed]
  24. de Lima, E.M.; Martins Filho, A.P.; da Costa, D.P.; de Barros, J.A.; da França, R.F.; de Sousa Lima, J.R.; Duda, G.P.; da Silva, M.M.; Araujo, A.S.F.; Medeiros, E.V.d. Winery Residues Transformed into Biochar and Co-Applied with Trichoderma Increase Grape Productivity and Soil Quality. Sustainability 2025, 17, 4150. [Google Scholar] [CrossRef]
  25. Pascale, A.; Vinale, F.; Manganiello, G.; Nigro, M.; Lanzuise, S.; Ruocco, M.; Marra, R.; Lombardi, N.; Woo, S.L.; Lorito, M. Trichoderma and its secondary metabolites improve yield and quality of grapes. Crop Prot. 2017, 92, 176–181. [Google Scholar] [CrossRef]
  26. Vinale, F.; Sivasithamparam, K.; Ghisalberti, E.L.; Marra, R.; Barbetti, M.J.; Li, H.; Woo, S.L.; Lorito, M. A novel role for Trichoderma secondary metabolites in the interactions with plants. Physiol. Mol. Plant Pathol. 2008, 72, 80–86. [Google Scholar] [CrossRef]
  27. Lotito, D.; Orazzo, G.; Matera, R.; Musco, N.; Staropoli, A.; Vinale, F. Beneficial fungal microbes as novel ecosustainable tools for forage crops. Acta IMEKO 2024, 13, 1–5. [Google Scholar] [CrossRef]
  28. Xia, J.; Wishart, D. Web-based inference of biological patterns, functions and pathways from metabolomic data using MetaboAnalyst. Nat. Protoc. 2011, 6, 743–760. [Google Scholar] [CrossRef]
  29. Francioli, D.; Strack, T.; Dries, L.; Voss-Fels, K.P.; Geilfus, C.M. Roots of resilience: Optimizing microbe-rootstock interactions to enhance vineyard productivity. Plants People Planet 2024, 7, 524–535. [Google Scholar] [CrossRef]
  30. Wang, C.; Kuzyakov, Y. Mechanisms and implications of bacterial-fungal competition for soil resources. ISME J. 2024, 18, wrae073. [Google Scholar] [CrossRef]
  31. Young, E.H.; Unc, A. A review of nematodes as biological indicators of sustainable functioning for northern soils undergoing land-use conversion. Appl. Soil. Ecol. 2023, 183, 104762. [Google Scholar] [CrossRef]
  32. Campos-Herrera, R.; Půža, V.; Jaffuel, G.; Blanco-Pérez, R.; Čepulyte Rakauskiene, R.; Turlings, T. Unraveling the intraguild competition between Oscheius spp. nematodes and entomopathogenic nematodes: Implications for their natural distribution in Swiss agricultural soils. J. Invertebr. Pathol. 2015, 132, 216–227. [Google Scholar] [CrossRef]
  33. Castro-Ortega, I.R.; Caspeta-Mandujano, J.M.; Suárez-Rodríguez, R.; Peña-Chora, G.; Ramírez Trujillo, J.A.; Cruz-Pérez, K.; Sosa, I.A.; Hernández-Velázquez, V.M. Oscheius myriophilus (Nematoda: Rhabditida) isolated in sugar cane soils in Mexico with potential to be used as entomopathogenic nematode. J. Nematol. 2020, 52, 1–8. [Google Scholar] [CrossRef] [PubMed]
  34. Kumar, P.; Jamal, W.; Somvanshi, V.S.; Chauhan, K.; Mumtaz, S. Description of Oscheius indicus n. sp. (Rhabditidae: Nematoda) from India. J. Nematol. 2019, 51, e2019-04. [Google Scholar] [CrossRef]
  35. Laznik, Ž.; Trdan, S.; Tóth, T.; Ádám, S.; Lakatos, T.; Majić, I. Discovery of Oscheius myriophilus (Nematoda: Rhabditidae) in Gastropods and Its Similar Virulence to Phasmarhabditis papillosa against Arion vulgaris, Deroceras reticulatum, and Cernuella virgata. Agronomy 2023, 13, 1386. [Google Scholar] [CrossRef]
  36. Wei, K.; Wang, J.; Yuan, C.; Tang, J.; Zhu, B. Relationships of bacterial-feeding nematodes, phosphatase-producing bacteria, phosphatase activity and their effects on soil organic phosphorus mineralization under straw return. Appl. Soil. Ecol. 2024, 196, 105280. [Google Scholar] [CrossRef]
  37. Li, Y.; Tang, K.; Zhang, L.; Zhao, Z.; Xie, X.; Chen, C.T.A.; Wang, D.; Jiao, N.; Zhang, Y. Coupled carbon, sulphur, and nitrogen cycles mediated by microorganisms in the water column of a shallow-water hydrothermal ecosystem. Front. Microbiol. 2018, 9, 406029. [Google Scholar] [CrossRef] [PubMed]
  38. Mitra, D.; Mondal, R.; Khoshru, B.; Senapati, A.; Radha, T.K.; Mahakur, B.; Uniyal, N.; Ei Mon Myo, E.M.; Boutaj, H.; Guerra Sierra, B.E.; et al. Actinobacteria-enhanced plant growth, nutrient acquisition, and crop protection: Advances in soil, plant, and microbial multifactorial interactions. Pedosphere 2022, 32, 149–170. [Google Scholar] [CrossRef]
  39. Silva, V.; Brito, I.; Alexandre, A. The Vineyard Microbiome: How Climate and the Main Edaphic Factors Shape Microbial Communities. Microorganisms 2025, 13, 1092. [Google Scholar] [CrossRef]
  40. Wei, Z.; Hu, X.; Li, X.; Zhang, Y.; Jiang, L.; Li, J.; Guan, Z.; Cai, Y.; Liao, X. The rhizospheric microbial community structure and diversity of deciduous and evergreen forests in Taihu Lake area, China. PLoS ONE 2017, 12, e0174411. [Google Scholar] [CrossRef]
  41. Lee, J.H.; Anderson, A.J.; Kim, Y.C. Root-Associated Bacteria Are Biocontrol Agents for Multiple Plant Pests. Microorganisms 2022, 10, 1053. [Google Scholar] [CrossRef]
  42. Kumar, K.K.; Dara, S.K. Fungal and bacterial endophytes as microbial control agents for plant-parasitic nematodes. Int. J. Environ. Res. Public Health 2021, 18, 4269. [Google Scholar] [CrossRef]
  43. Gade, R.M.; Koche, M.D. Enhancing the growth and disease suppression ability of Pseudomonas fluorescens. In New and Future Developments in Microbial Biotechnology and Bioengineering; Elsevier Science Publishers: Amsterdam, The Netherlands, 2022; pp. 351–368. [Google Scholar]
  44. Hao, Y.; You, Y.; Chen, Z.; Li, J.; Liu, G.; Wen, Y. Avermectin B1a production in Streptomyces avermitilis is enhanced by engineering aveC and precursor supply genes. Appl. Microbiol. Biotech. 2022, 106, 2191–2205. [Google Scholar] [CrossRef]
  45. Wang, K.; Ke, S.; Fang, W.; Liu, F.; Zhang, Z. Agroactive volatile organic compounds from microbes: Chemical diversities and potentials of application in crop protection. Adv. Agrochem. 2023, 2, 39–57. [Google Scholar] [CrossRef]
  46. Donald, L.; Pipite, A.; Subramani, R.; Owen, J.; Keyzers, R.A.; Taufa, T. Streptomyces: Still the biggest producer of new natural secondary metabolites, a current perspective. Microbiol. Res. 2022, 13, 418–465. [Google Scholar] [CrossRef]
  47. Gamalero, E.; Glick, B.R. The use of plant growth-promoting bacteria to prevent nematode damage to plants. Biology 2020, 9, 381. [Google Scholar] [CrossRef]
  48. Topalović, O.; Hussain, M.; Heuer, H. Plants and Associated Soil Microbiota Cooperatively Suppress Plant-Parasitic Nematodes. Front. Microbiol. 2020, 11, 313. [Google Scholar] [CrossRef] [PubMed]
  49. Savazzini, F.; Longa, C.M.O.; Pertot, I. Impact of the biocontrol agent Trichoderma atroviride SC1 on soil microbial communities of a vineyard in northern Italy. Soil. Biol. Biochem. 2009, 41, 1457–1465. [Google Scholar] [CrossRef]
  50. Carrascosa, M.; Sanchez-Moreno, S.; Alonso-Prados, J.L. Effects of organic and conventional pesticides on plant biomass, nematode diversity and the structure of the soil food web. Nematology 2015, 17, 11–26. [Google Scholar] [CrossRef]
  51. Moosavi, M.R.; Zare, R. Fungi as biological control agents of plant-parasitic nematodes. In Plant Defence: Biological Control, Progress in Biological Control; Mérillon, J., Ramawat, K., Eds.; Springer: Dordrecht, The Netherlands, 2020; pp. 333–384. [Google Scholar] [CrossRef]
  52. Martínez-Medina, A.; Fernandez, I.; Lok, G.B.; Pozo, M.J.; Pieterse, C.M.; Van Wees, S.C. Shifting from priming of salicylic acid- to jasmonic acid-regulated defences by Trichoderma protects tomato against the root knot nematode Meloidogyne incognita. New Phytol. 2017, 213, 1363–1377. [Google Scholar] [CrossRef]
  53. Medeiros, H.A.; Araújo Filho, J.V.; Freitas, L.G.; Castillo, P.; Rubio, M.B.; Hermosa, R.; Monte, E. Tomato progeny inherit resistance to the nematode Meloidogyne javanica linked to plant growth induced by the biocontrol fungus Trichoderma atroviride. Sci. Rep. 2017, 7, 40216. [Google Scholar] [CrossRef]
  54. Csótó, A.; Kovács, C.; Pál, K.; Nagy, A.; Peles, F.; Fekete, E.; Karaffa, L.; Kubicek, C.P.; Sándor, E. The Biocontrol Potential of Endophytic Trichoderma Fungi Isolated from Hungarian Grapevines, Part II, Grapevine Stimulation. Pathogens 2022, 12, 2. [Google Scholar] [CrossRef]
  55. Yilmaz, T.; Ates, F.; Turan, M.; Hatterman-Valenti, H.; Kaya, O. Dynamics of Sugars, Organic Acids, Hormones, and Antioxidants in Grape Varieties ‘Italia’ and ‘Bronx Seedless’ during Berry Development and Ripening. Horticulturae 2024, 10, 229. [Google Scholar] [CrossRef]
  56. Ali, K.; Maltese, F.; Fortes, A.M.; Pais, M.S.; Choi, Y.H.; Verpoorte, R. Monitoring biochemical changes during grape berry development in Portuguese cultivars by NMR spectroscopy. Food Chem. 2011, 124, 1760–1769. [Google Scholar] [CrossRef]
  57. Li, R.; Liu, K.; Liang, Z.; Lu, H.; Wang, T.; An, J.; Wang, Q.; Li, X.; Guan, Y.; Xiao, Y.; et al. Unpruning improvement the quality of tea through increasing the levels of amino acids and reducing contents of flavonoids and caffeine. Front. Nutr. 2022, 9, 1017693. [Google Scholar] [CrossRef] [PubMed]
  58. Liu, J.; Arneborg, N.; Toldam-Andersen, T.B.; Petersen, M.A.; Bredie, W.L. Effect of sequential fermentations and grape cultivars on volatile compounds and sensory profiles of Danish wines. J. Sci. Food Agric. 2017, 97, 3594–3602. [Google Scholar] [CrossRef]
  59. Pittari, E.; Moio, L.; Piombino, P. Interactions between Polyphenols and Volatile Compounds in Wine: A Literature Review on Physicochemical and Sensory Insights. Appl. Sci. 2021, 11, 1157. [Google Scholar] [CrossRef]
Figure 1. Depth-related distribution of nematode genera/taxa in soils collected before treatment application at 30 and 60 cm depths. Stacked bar chart shows averaged (25 samples, according to Dunnet’s test percentage contribution of each identified nematode genus/taxa to total nematode community at each depth. When not reported, p > 0.05.
Agriculture 15 01441 g001
Figure 2. Impact of Trichoderma- and 6-pentyl-α-pyrone-based treatments on microbial composition expressed as beta diversity at phylum level. Principal Coordinate Analysis (PCoA) plot illustrates beta diversity among samples based on Bray–Curtis dissimilarity, representing overall bacterial and fungal community composition at phylum level. Each point represents sample, colored according to its treatment group. First principal coordinate (PC1) explains 63.06% of variation, and second principal coordinate (PC2) explains 22.68% of variation in dataset.
Agriculture 15 01441 g002
Figure 3. Impact of Trichoderma- and 6-pentyl-α-pyrone-based treatments on bacterial community composition and alpha diversity. (A) Bacterial community composition at phylum level, displaying 10 most abundant bacterial phyla. Numerical labels within bars indicate mean relative abundance (%) of each phylum per treatment. (B) Shannon alpha diversity indices of bacterial community for each treatment. Horizontal bars within box plots indicate median. Treatments with different letters denote significant differences at p < 0.05 based on Kruskal–Wallis test. Soils were treated with T. harzianum strain M10 (M10), T. afroharzianum strain T22 (T22), and 6-pentyl-α-pyrone (6PP), or left untreated (CTRL). Treatments were applied monthly by soil drenching (500 mL/plant of 1 × 10⁷ spores/mL for M10 and T22 and 500 mL/plant of 10−6 M for 6PP) from June 2022 until harvesting in October 2022. Soil samples were collected at 30 cm depth at harvesting.
Agriculture 15 01441 g003
Figure 4. Impact of Trichoderma- and 6-pentyl-α-pyrone-based treatments on fungal community composition and alpha diversity. (A) Fungal community composition at order level. Numerical labels within bars indicate mean relative abundance (%) of each phylum per treatment. (B) Shannon alpha diversity indices fungal community for each treatment. Horizontal bars within box plots indicate median. Treatments with different letters denote significant differences at p < 0.05 based on Kruskal–Wallis test. Soils were treated with T. harzianum strain M10 (M10), T. afroharzianum strain T22 (T22), 6-pentyl-α-pyrone (6PP), or left untreated (CTRL). Treatments were applied monthly by soil drenching (500 mL/plant of 1 × 10⁷ spores/mL for M10 and T22 and 500 mL/plant of 10−6 M for 6PP) from June 2022 until harvesting in October 2022. Soil samples were collected at 30 cm depth at harvesting. Soil samples were collected at 30 cm depth at harvesting.
Agriculture 15 01441 g004
Figure 5. Impact of Trichoderma- and 6-pentyl-α-pyrone-based treatments on grapevine leaf number (left) and brix grade (right). Plants were treated with T. afroharzianum T22 (T22), T. harzianum M10 (M10), or 6 pentyl-α-pyrone (6PP), or left untreated (CTRL). Treatments were applied monthly by soil drenching (500 mL/plant of 1 × 10⁷ spores/mL for M10 and T22 and 500 mL/plant of 10−6 M for 6PP) from June 2022 until harvesting in October 2022. Soil samples were collected at 30 cm depth at harvesting. According to Dunnett’s test, each condition is reported as mean ± S D. *** for p < 0.001. When not reported, p > 0.05.
Agriculture 15 01441 g005
Figure 6. Impact of Trichoderma- and 6-pentyl-α-pyrone-based treatments on leaves’ and grapes’ metabolomic profiles. PCA score plots of leaves metabolomic profiles obtained by GC-MS analysis of organic extracts (A). PCA score plots of grape metabolomic profiles obtained by GC-MS analysis of organic extracts (B). Plants were treated with Trichoderma afroharzianum T22 (samples depicted in turquoise), T. harzianum M10 (samples depicted in violet), or 6PP (samples depicted in red), or left untreated (samples depicted in green). Treatments were applied monthly by soil drenching (500 mL/plant of 1 × 10⁷ spores/mL for M10 and T22 and 500 mL/plant of 10−6 M for 6PP) from June 2022 until harvesting in October 2022. Soil samples were collected at 30 cm depth at harvesting. Statistical testing (univariate analysis and fold change) was subsequently performed on aligned metabolites.
Agriculture 15 01441 g006
Table 1. Culturable fungal and bacterial species isolated and identified in soil samples collected before treatments application at 30 and 60 cm depths. Identified species are reported as an average of 25 soil samples, collected for each depth.
30 cm60 cm
Fungi(total fungal CFU: 1.83 105 cfu/g ± 2.46 × 10⁴)(total fungal CFU: 1.25 × 10⁵ cfu/g ± 1.23 × 10⁴)
Albifimbria verrucariaAspergillus aeropaus
Aspergillus awamoriClonostachys rosea
A. keveiFusarium circinatum
A. luchuensisNeonectria radicicola
Clonostachys roseaOchroconis tshawytschae
C. rosea f. catenulataP. ardesiacum
Didymella roseaP. senticosum
F. equiseti strain D3Penicillium sp.
F. oxysporum
F. oxysporum isolate F34
F. oxysporum f. sp. vasinfectum
F. solani FS-4P
Penicillium sp.
Pleosporales sp.
Rhizopus oryzae
Sirastachyi castanedae
Talaromyces pinophilus
Bacteria(total bacterial CFU: 1.34 × 10⁶ cfu/g ± 7.66 × 10⁵)(total bacterial CFU: 1.56 × 10⁶ cfu/g ± 1.01 × 10⁵)
Acineobacter sp.Bordetella sp.
Ensifer adhaerensPseudomonas mandelii
Phyllobacterium ifriglyense
P. kilonensis
P. mandelii
P. salicylatoxidans
Pseudomonas sp.
Variovorax boronicumulans
Table 2. Treatments with Trichoderma and 6PP significantly alter vine leaves’ metabolomes. Differentially accumulated metabolites in vine leaves extracts determined via statistical analysis (one-way ANOVA p < 0.05 and fold change > 2.0) of GC-MS data. Plants were treated with Trichoderma afroharzianum T22 (T22), T. harzianum M10 (M10), or 6 pentyl-α-pyrone (6PP), or left untreated (Ctrl). Treatments were applied monthly by soil drenching (500 mL/plant of 1 × 10⁷ spores/mL for M10 and T22 and 500 mL/plant of 10−6 M for 6PP) from June 2022 until harvesting in October 2022. Soil samples were collected at 30 cm depth at harvesting.
CompoundpRegulation lnFC vs. Ctrl Group
6PPM10T22
D-(-)-Fructofuranose, 5TMS0.00825−0.4727−1.46300.7274
D-Fructose, 5TMS0.00168−0.5724−8.4206−1.5036
α-Tocopherol, TMS0.00268−9.0224−9.0224−9.0224
Sucrose, 8TMS 0.00890−9.3990−5.55474.8418
1-Octacosanol, TMS0.01940−6.3610−6.3610−6.3610
Ascorbic acid, 4TMS8.45 × 10−44.25072.924715.7171
Palmitic Acid, TMS0.02052−7.5909−3.2879−9.0512
Fumaric acid, 2TMS0.00489−0.286910.79079.0419
D-Psicopyranose, 5TMS0.03078−3.6017−3.60174.1862
Hexacosanoic acid, TMS0.01730−5.7551−7.5577−7.5577
L-Threonic acid, 4TMS0.03779−3.5858−7.3303−7.3303
E-15-Heptadecenal0.01922−5.0534−5.0534−5.0534
m-Hydroxybenzoic acid, TMS0.027321.56770.079348.3108
Pregnane, TMS0.019224.7985−5.9307−3.5480
Phenoxyethanol, TMS0.018026.25271.5192−1.6813
Nonanoic acid, TMS2.63 × 10−47.6230−1.4803−1.8459
TMS = trimethylsilyl derivative.
Table 3. Treatments with Trichoderma and 6PP significantly alter grape metabolomes. Differentially accumulated metabolites in grape extracts determined via statistical analysis (one-way ANOVA p < 0.05 and fold change > 2.0) of GC-MS data. Plants were treated with Trichoderma afroharzianum T22 (T22), T. harzianum M10 (M10), or 6 pentyl-α-pyrone (6PP), or left untreated (Ctrl). Treatments were applied monthly by soil drenching (500 mL/plant of 1 × 10⁷ spores/mL for M10 and T22 and 500 mL/plant of 10−6 M for 6PP) from June 2022 until harvesting in October 2022. Soil samples were collected at 30 cm depth at harvesting.
CompoundpRegulation lnFC vs. Ctrl Group
6PPM10T22
N,N-Bis (2-hydroxyethyl) dodecanamide, 2TMS0.0016222.98613.41793.0195
D-Tagatose, 5TMS0.001303−2.4122−1.7898−1.5254
Fructofuranose, 5TMS0.01134−2.63653.80013.0195
Glucose, 5TMS0.0013643.7694nsns
Allofuranose, 5TMS0.0033981.3820ns3.6132
Tartaric acid, 4TMS0.0034183.95023.82152.8845
Malic acid, 3TMS0.0028516.23223.61323.1609
Methylsuccinic acid, 2TMS0.0032117.18326.40056.2037
Glycerol, 3TMS0.001463−1.2569−3.4210−3.0801
3-Hydroxybenzoic acid, 2TMS0.004762−8.6090−6.2364−6.2815
Flavan, 5TMS0.011427.95567.37087.6264
Epigallocatechin, 6TMS0.006272ns3.38853.2239
Catechine, 5TMS 0.002674ns7.38468.4570
ns = not significant. TMS = trimethylsilyl derivative.
Disclaimer/Publisher’s Note: The statements, opinions and data contained in all publications are solely those of the individual author(s) and contributor(s) and not of MDPI and/or the editor(s). MDPI and/or the editor(s) disclaim responsibility for any injury to people or property resulting from any ideas, methods, instructions or products referred to in the content.

