This two-step approach is necessary because anomaly detection alone cannot differentiate between calving-related anomalies and other behavioral changes. On the other hand, applying a classifier directly to the full dataset would be impractical due to extreme class imbalance and the presence of noisy data. By first isolating anomalies and then classifying them, the method provides a robust framework for calving detection.
3.1. Stage 1: Anomaly Detection Using Autoencoder
We used a fully connected autoencoder to detect abnormal time points, which may indicate the occurrence of a calving event.
Usually, autoencoders using neural networks excel in modeling high-dimensional data, capturing the nonlinear structures within the data and offering significant advantages over traditional dimensionality reduction techniques such as Principal Component Analysis (PCA) [
23]. Autoencoders use nonlinear activation functions of neural networks to learn nonlinear representations of data [
24]. By training an encoder to map high-dimensional data to a lower-dimensional latent space and a decoder to reconstruct the latent representations back to the original space, autoencoders can capture complex patterns and structures in an unsupervised manner. This capability makes them widely applicable in tasks such as dimensionality reduction, anomaly detection, and feature extraction [
23].
The proposed autoencoder method [
25] contains a training step and a prediction step.
For the training step, we used all pre-calving data of cows collected until five days prior to calving.
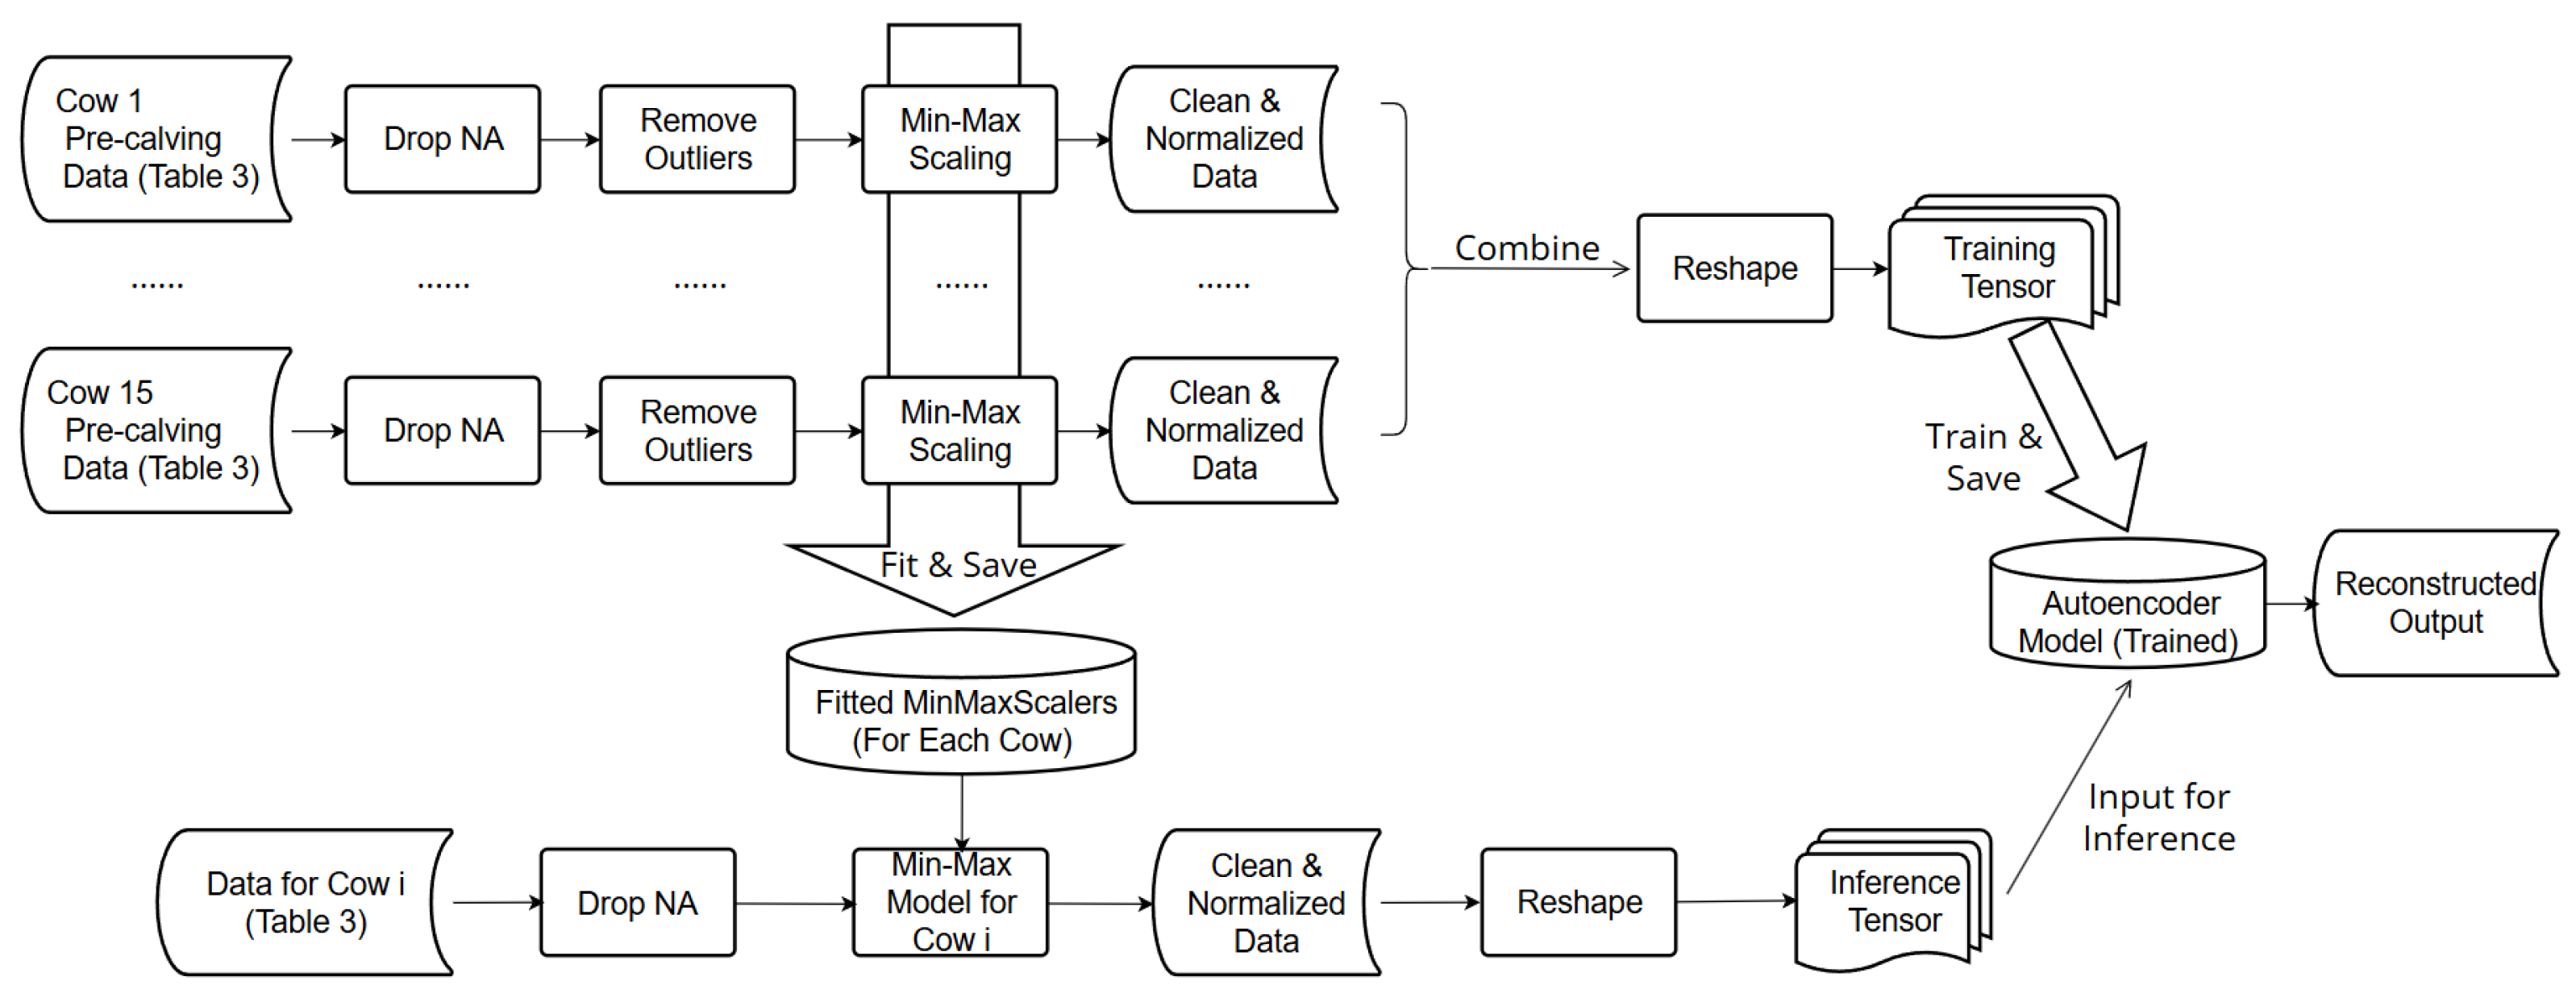
All pre-calving data was cleaned and processed as shown in
Figure 3. First, any rows with missing feature values were removed to ensure data integrity. In particular, since we do not have missing values in our raw data, the only missing values are with the generated features MI difference, walking distance, and ts in the first instance because these features’ values cannot be calculated without information of the preceding MI and location before the first instance. Thus, this step just needs to remove the first row. Second, outliers for each feature class were identified and excluded. Outliers were detected using the inter-quartile range (
) difference. Briefly, we computed the first and third quartiles (
and
, respectively) for each feature, calculated the
, and determined the lower and upper bound as follows:
where the Lower bound and Upper bound represent the lower and upper limits for outlier detection.
Third, selected features including the motion index, walking distance, sum of KNN1–KNN3, and
were normalized for each cow using the Min–Max scaling procedure [
26]. The Min–Max scalers were then saved for application with the test data.
After the cleaning and normalization steps, the pre-calving data were merged to a single file and used to train the autoencoder. An input instance to the autoencoder comprises six features: (1) normalized motion index, (2) normalized walking distance, (3) normalized sum of KNN1-KNN3, (4) normalized ts, (5) time encoding hour_sin, and (6) hour_cos. These data were organized into a 2D tensor of shape with a format , where N is the number of time points across all cows, and 6 is the number of features used. The data was passed to the autoencoder in batches.
The encoder comprises two linear layers. The first layer maps the 6 features to 32 hidden units, being followed by an ReLU activation. The second layer compresses the representation to 16 hidden units. The decoder mirrors this structure, reconstructing the input from the compressed representation through two fully connected layers with corresponding ReLU activations. The autoencoder utilizes the DataLoader from pytorch 2.6.0+cu124. The batch size is 64 with shuffle set to be True. The learning rate is set to be 1 × 10⁻³, and the number of learning epoches is 100.
Importantly, only the first four features (behavioral features) are included in the reconstruction loss. The time encoding features are provided solely as hints to help the model learn time-dependent patterns, but they are not part of the reconstruction objective. During training, we use the L1 loss between the input and reconstructed output, computed only over the four behavioral features. The L1 loss is also called the Mean Absolute Error (MAE) of a prediction. The MAE at the timestamp
t is defined as shown in Equation (
5).
where
is the actual value of the
ith feature at the timestamp
t,
is the reconstructed value of the
ith feature at the timestamp
t, and
n is the number of features used.
The trained autoencoder was intended to capture the regular behavior of cows before calving. To use the autoencoder for predictions, additional processing steps of the input data were required. These processing steps (bottom box in
Figure 3) uses the previously processed data show in
Table 3. The input data includes both pre-calving- and calving-related data. In a following step, data were cleaned and normalized. The normalization was applied using the Min–Max scalers learned previously from the pre-calving data, ensuring the consistent normalization of all data. Finally, because calving events are abnormal events, the “Remove outliers” step was not utilized (
Figure 3). Similar to the training data, the testing data needs to be processed to the same format before it is fed into the model. Therefore, the format of the testing data was the same as the training data described before.
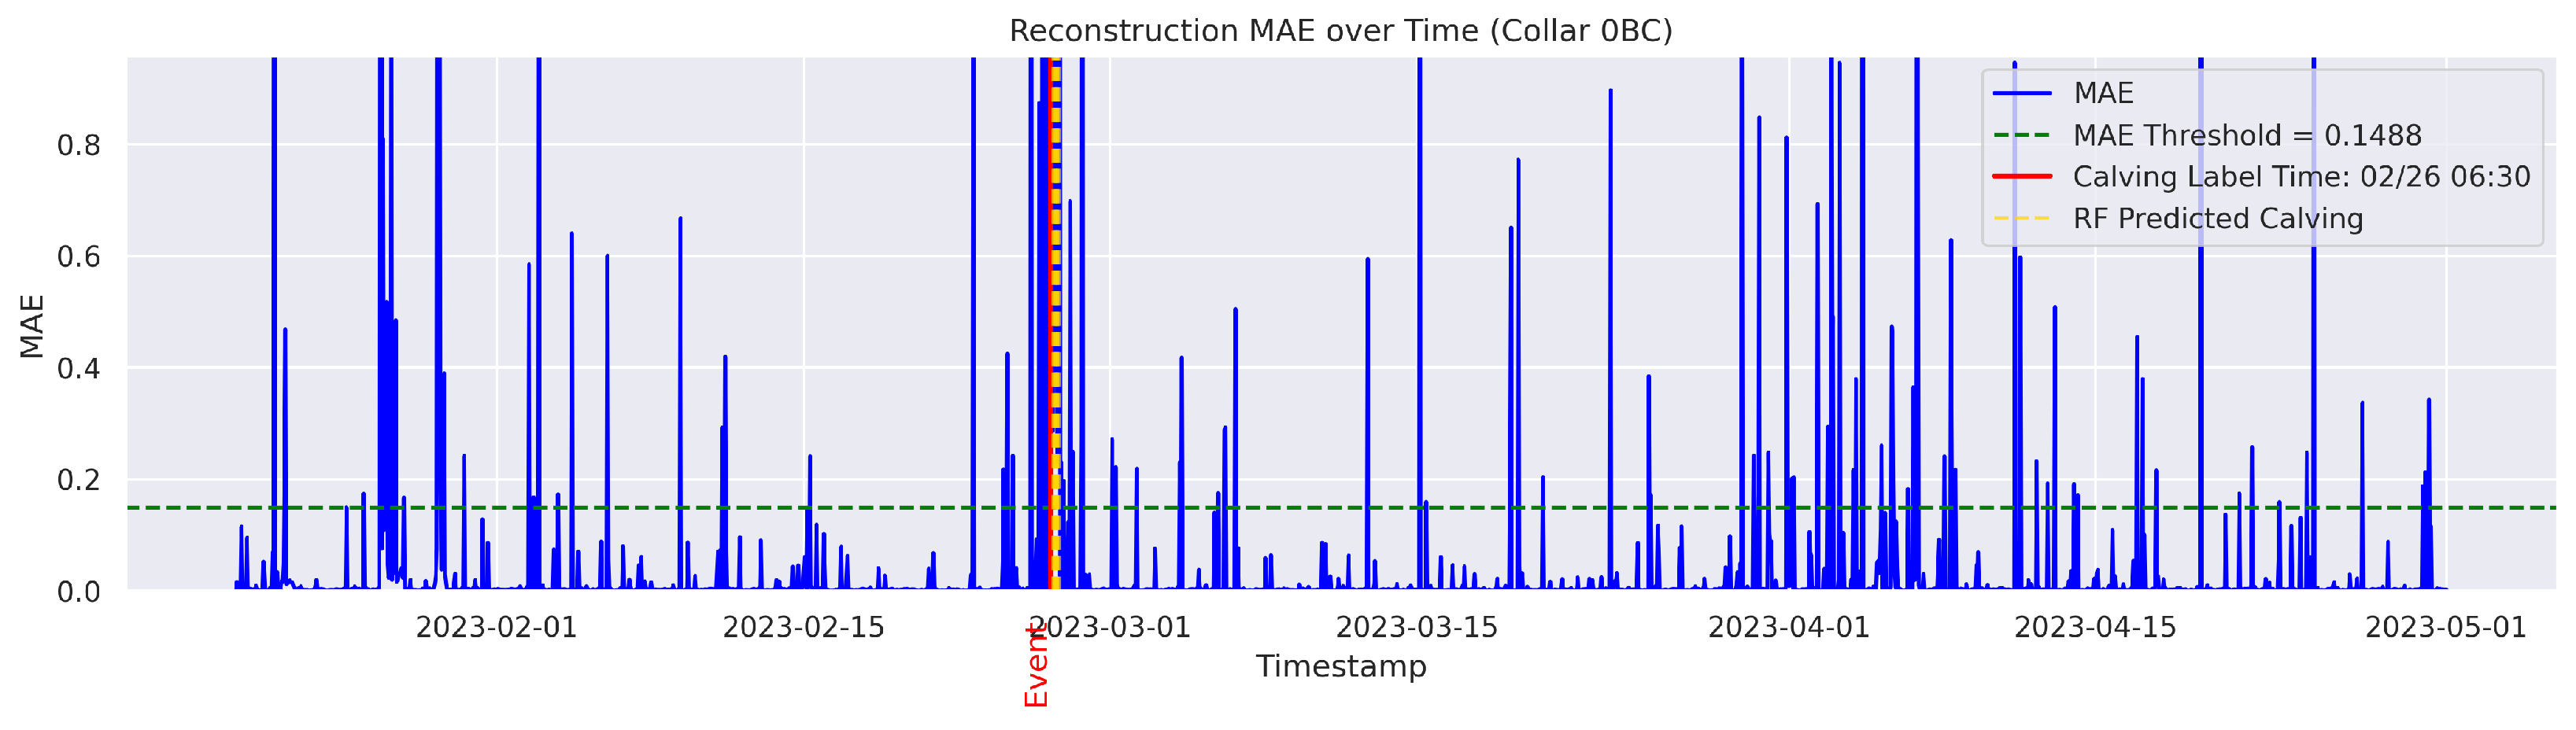
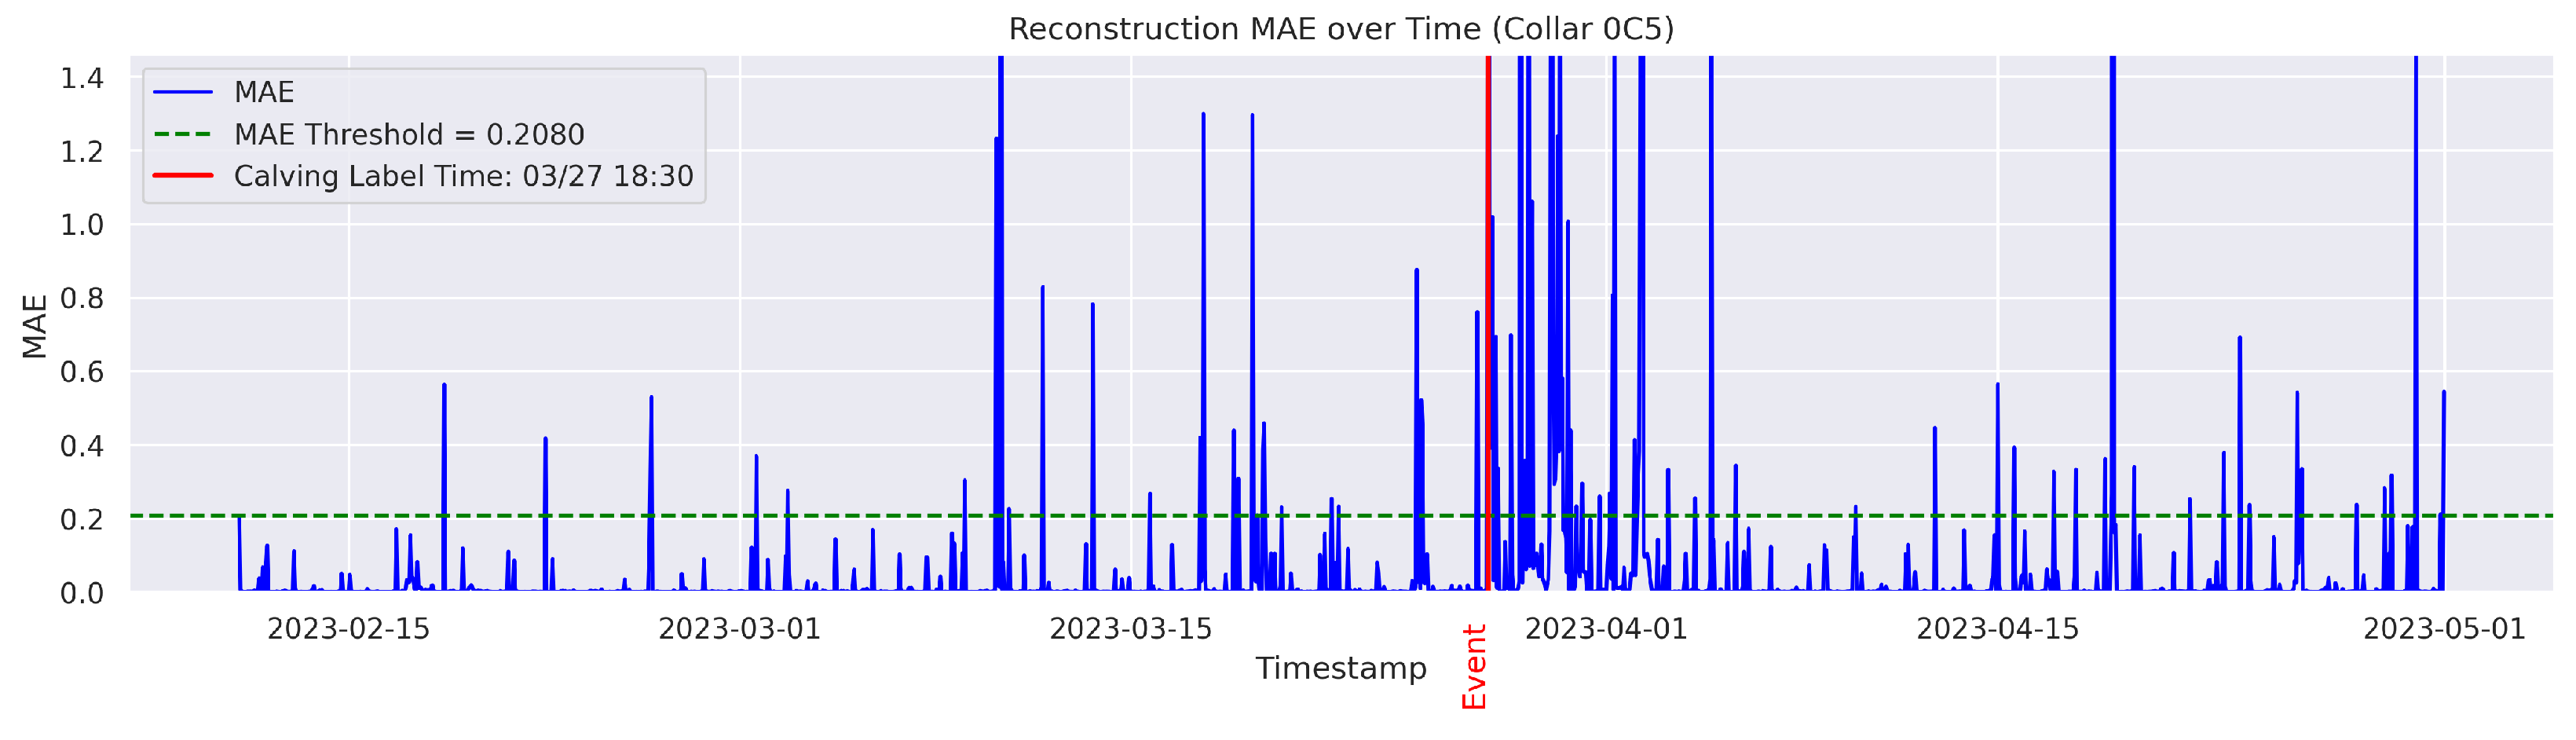
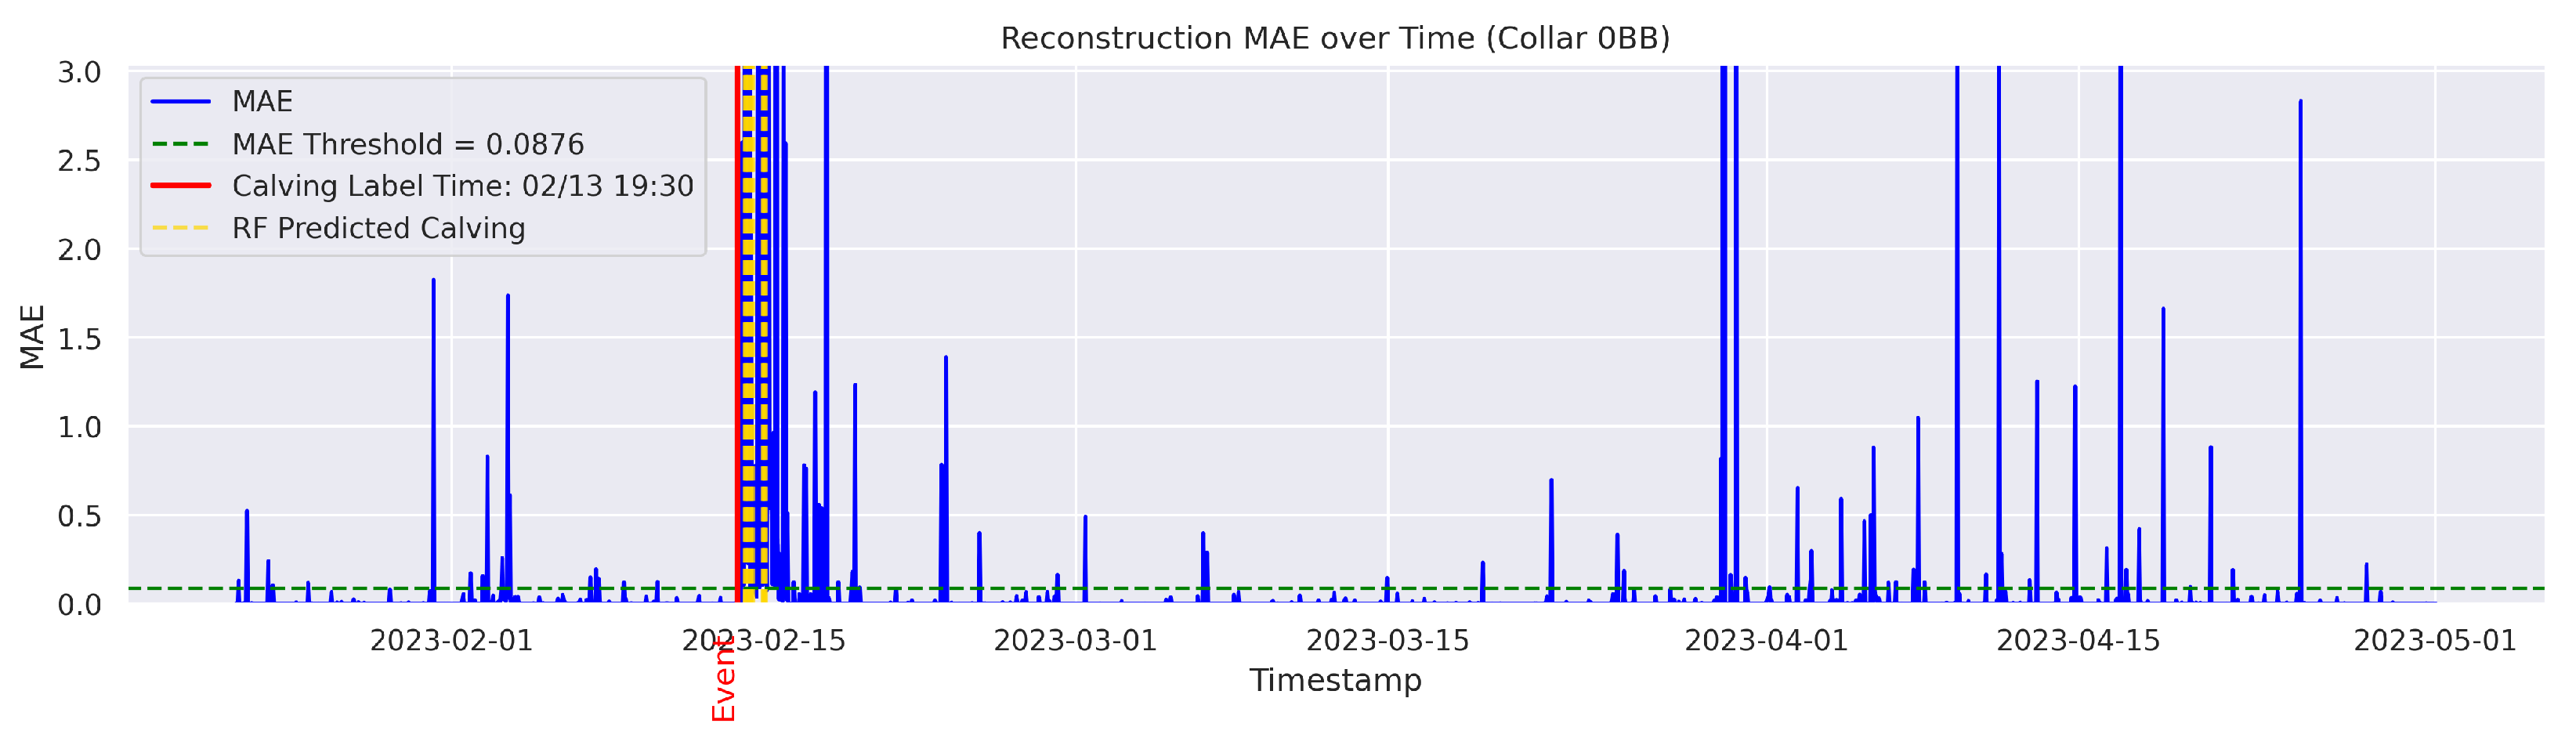
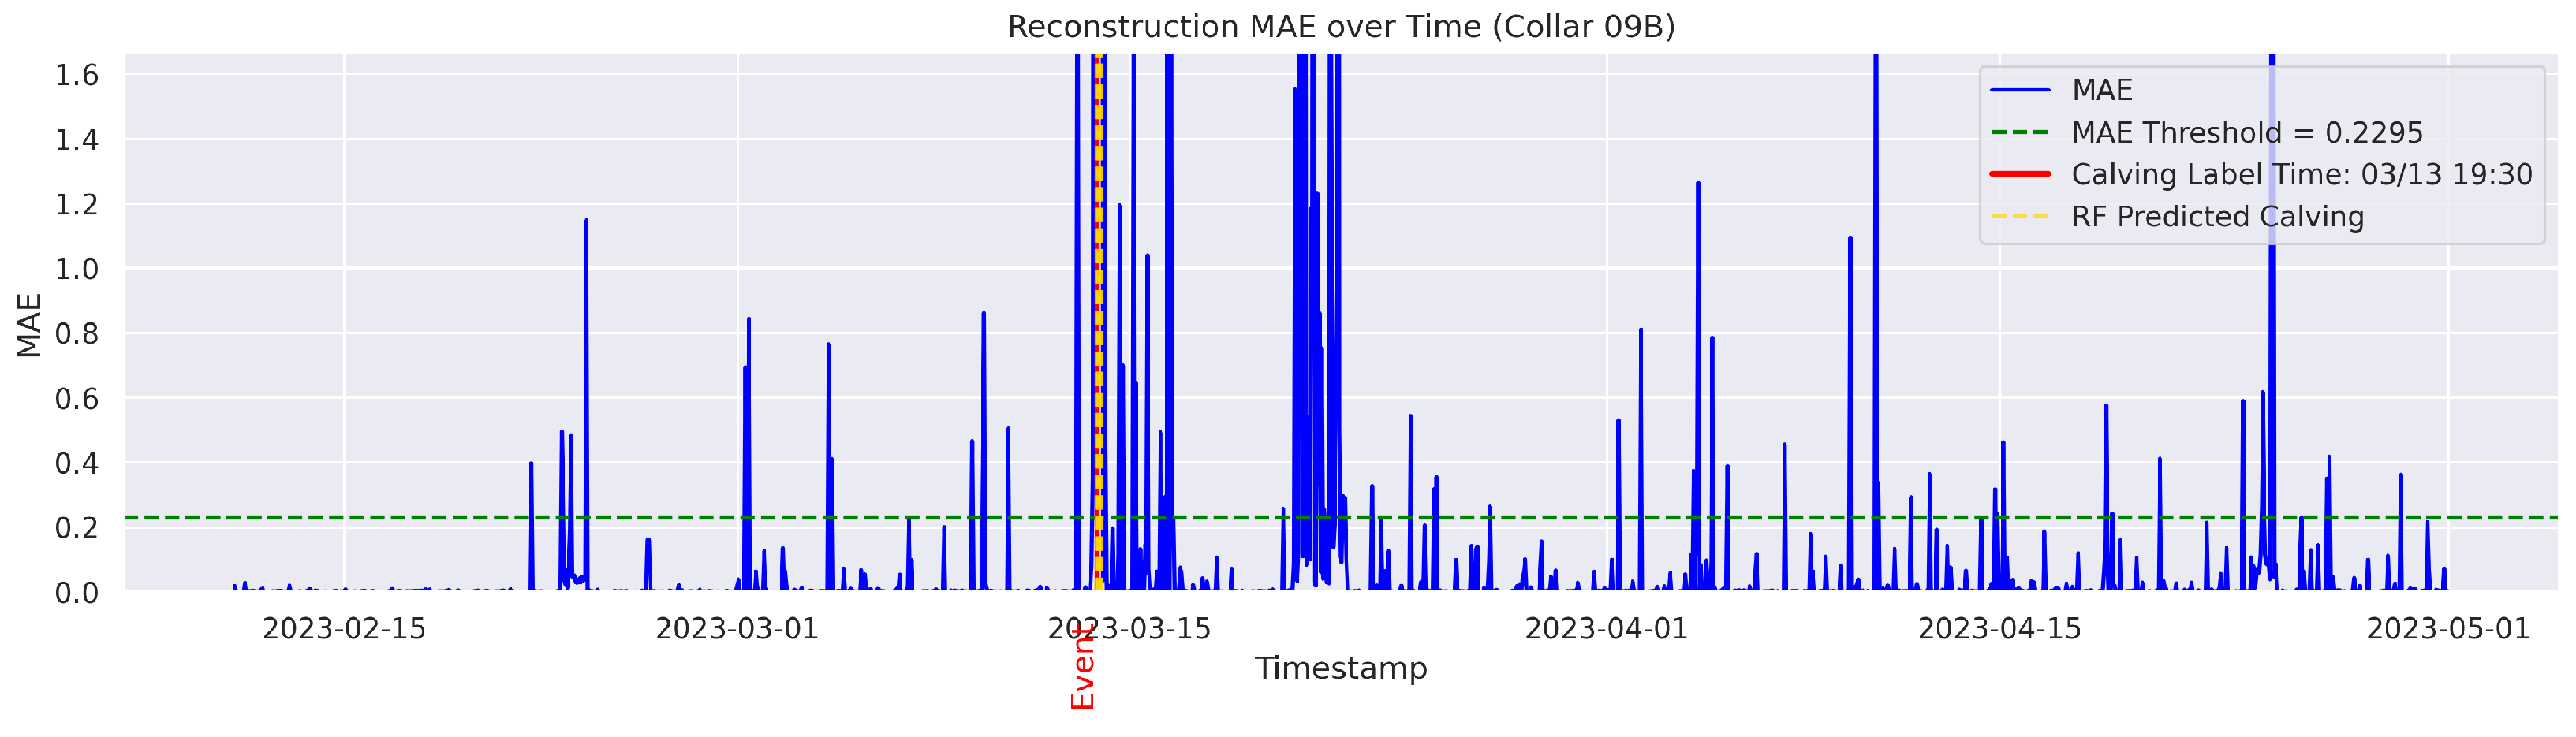
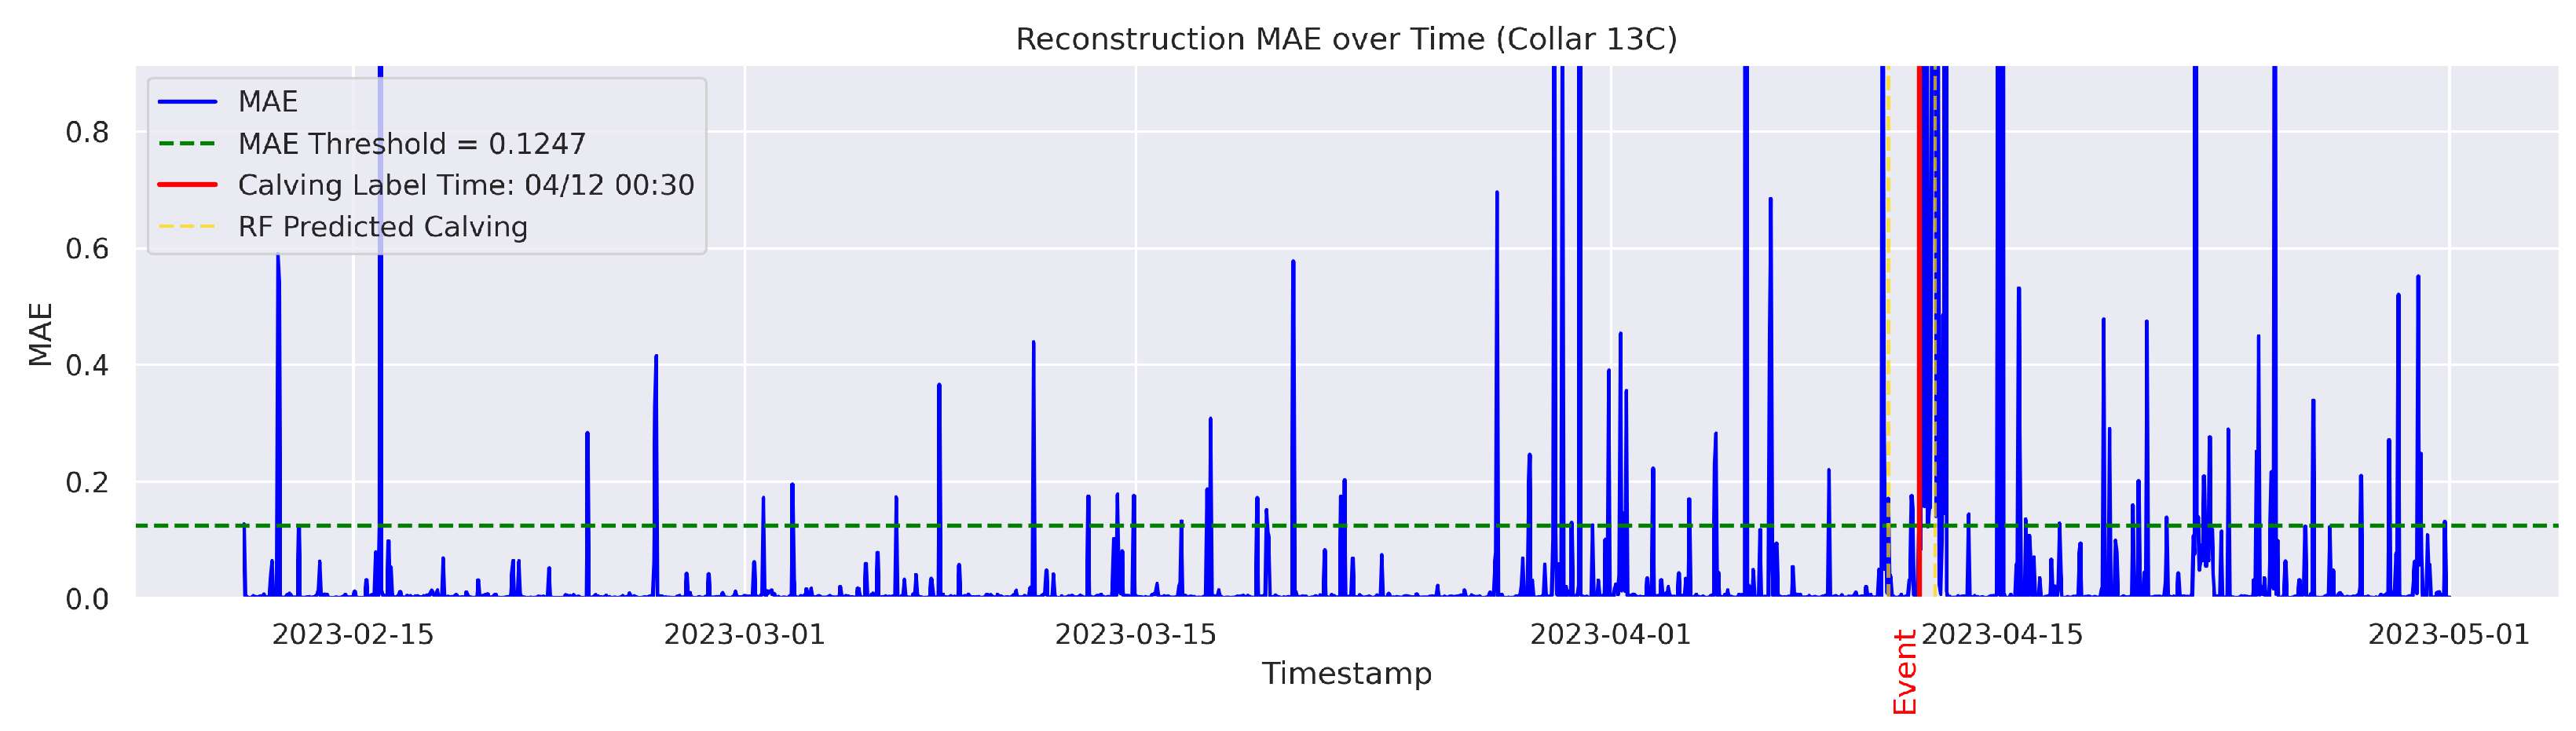
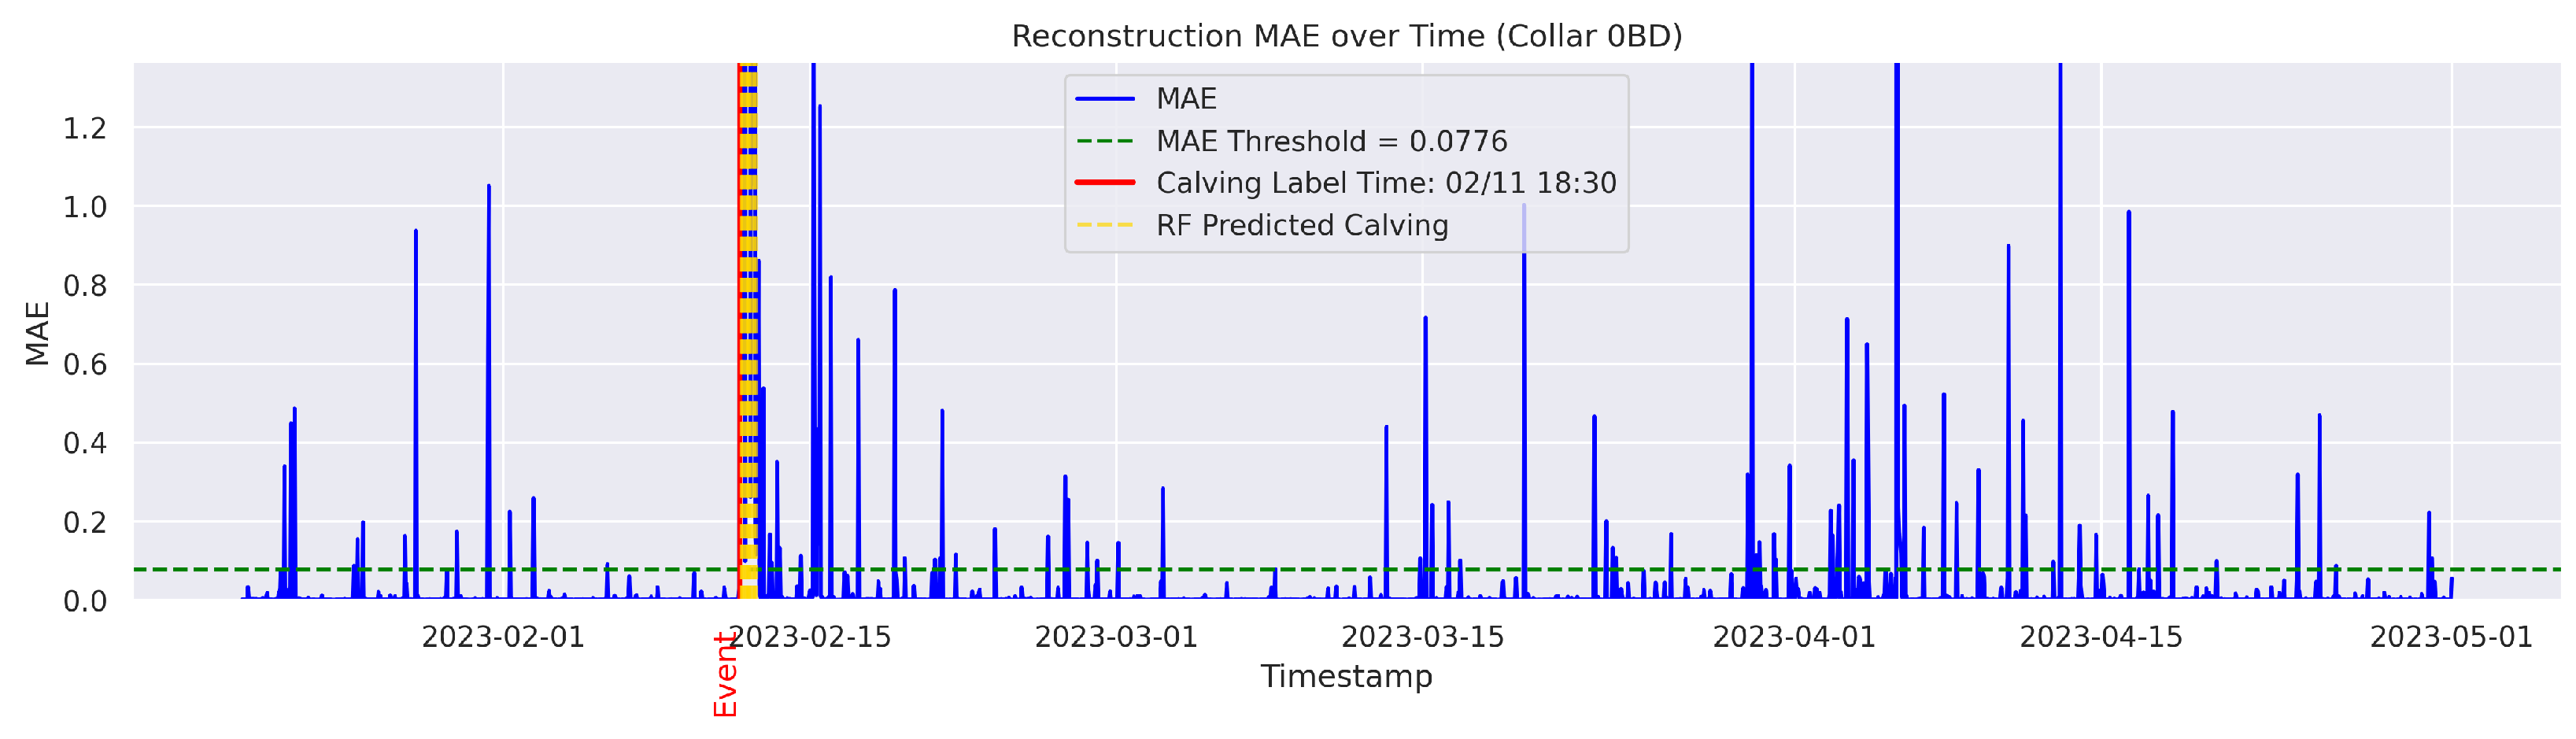
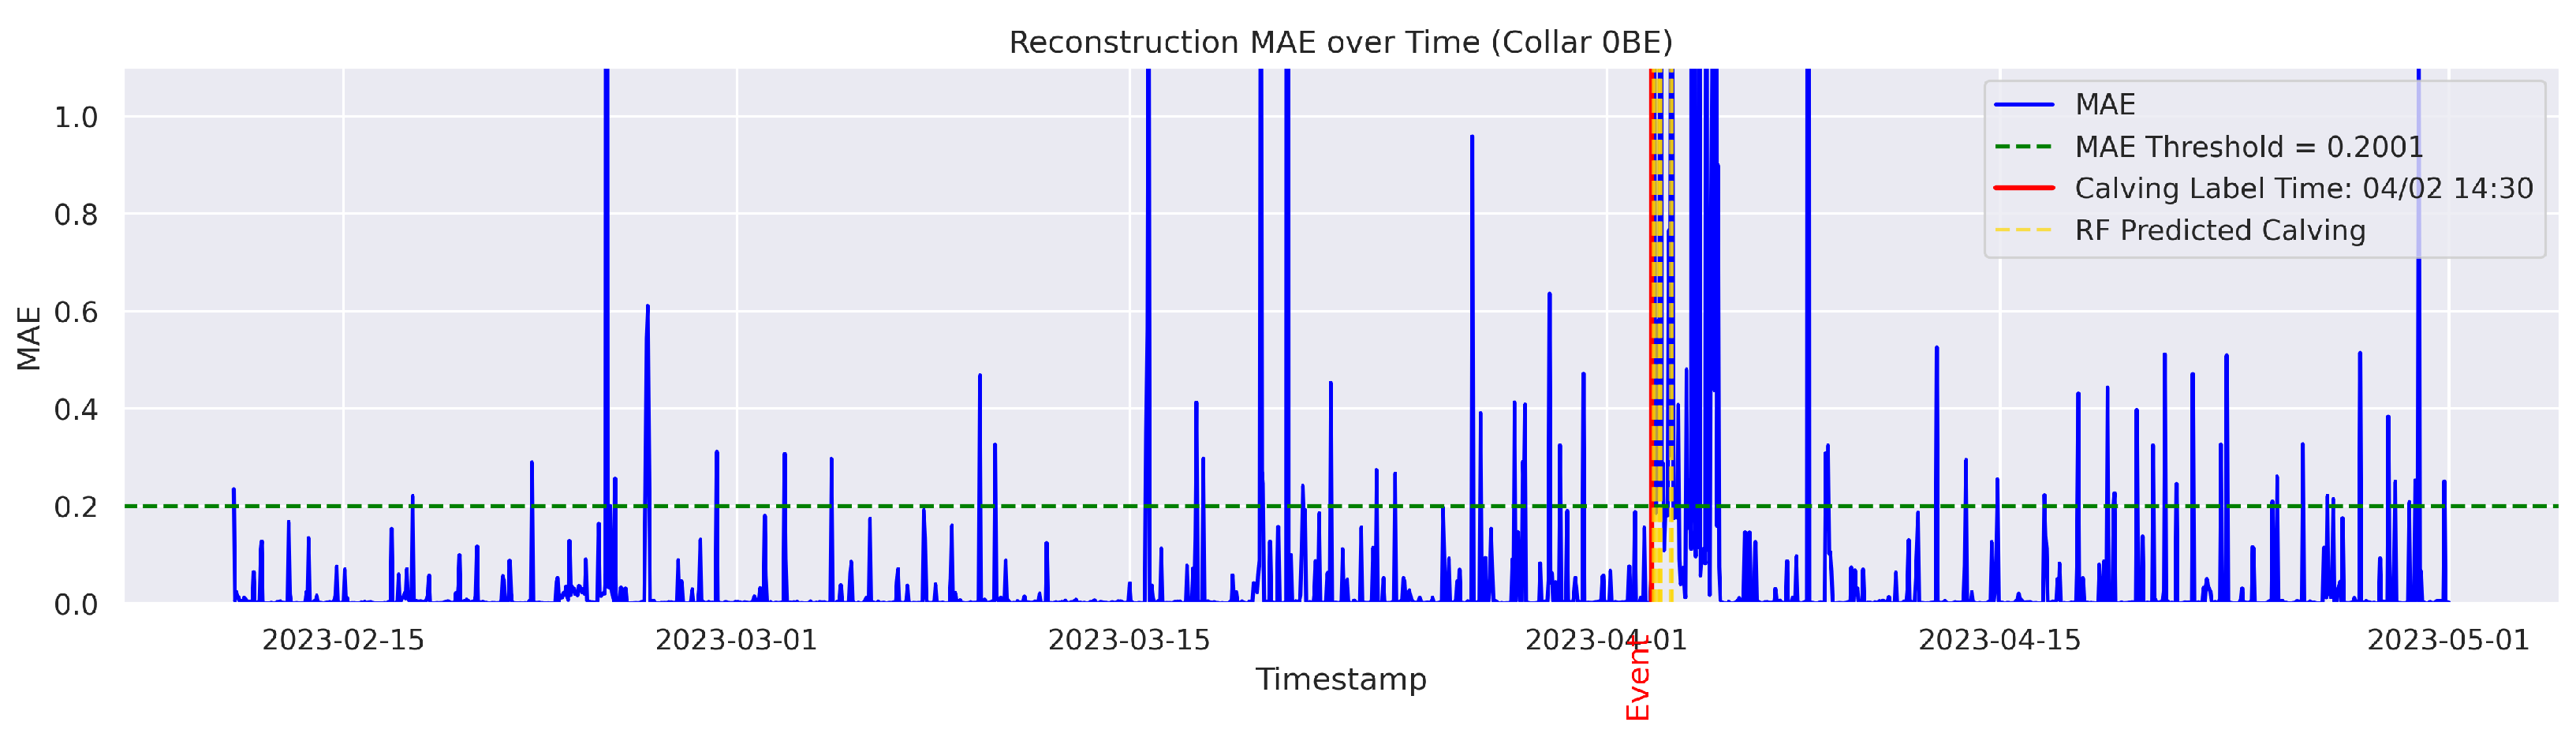
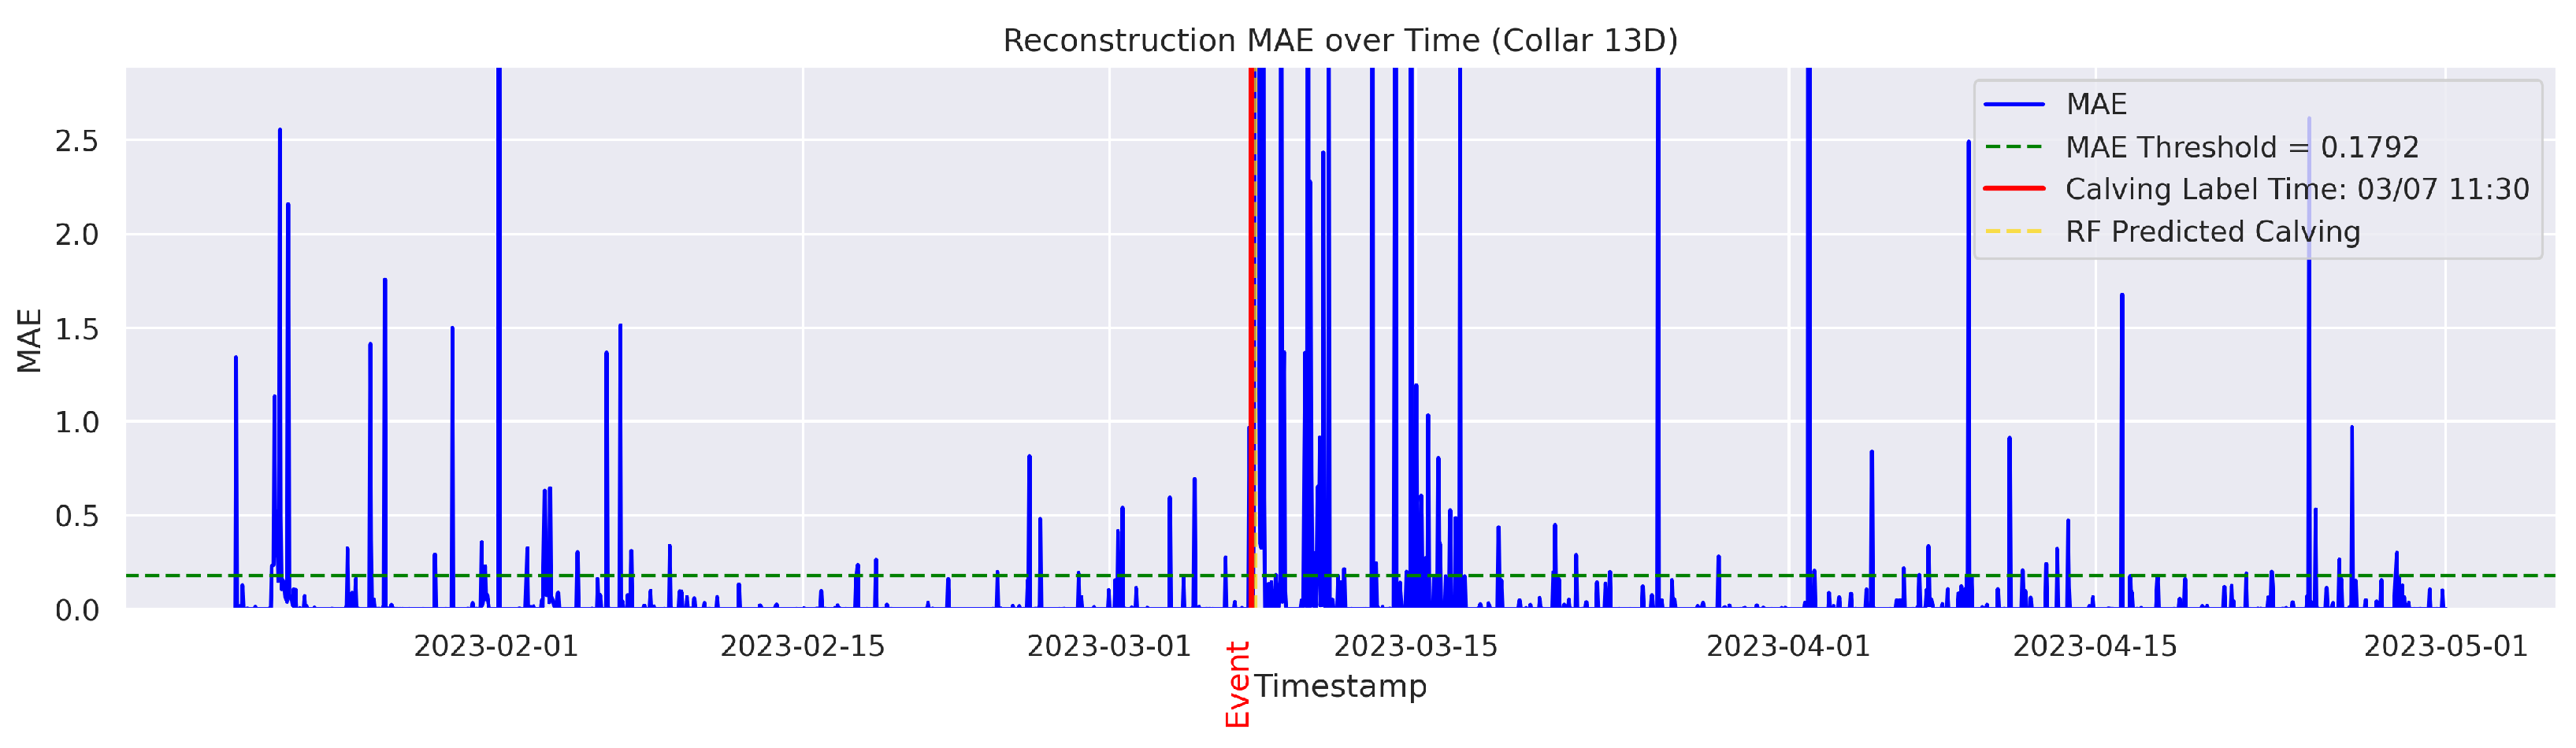
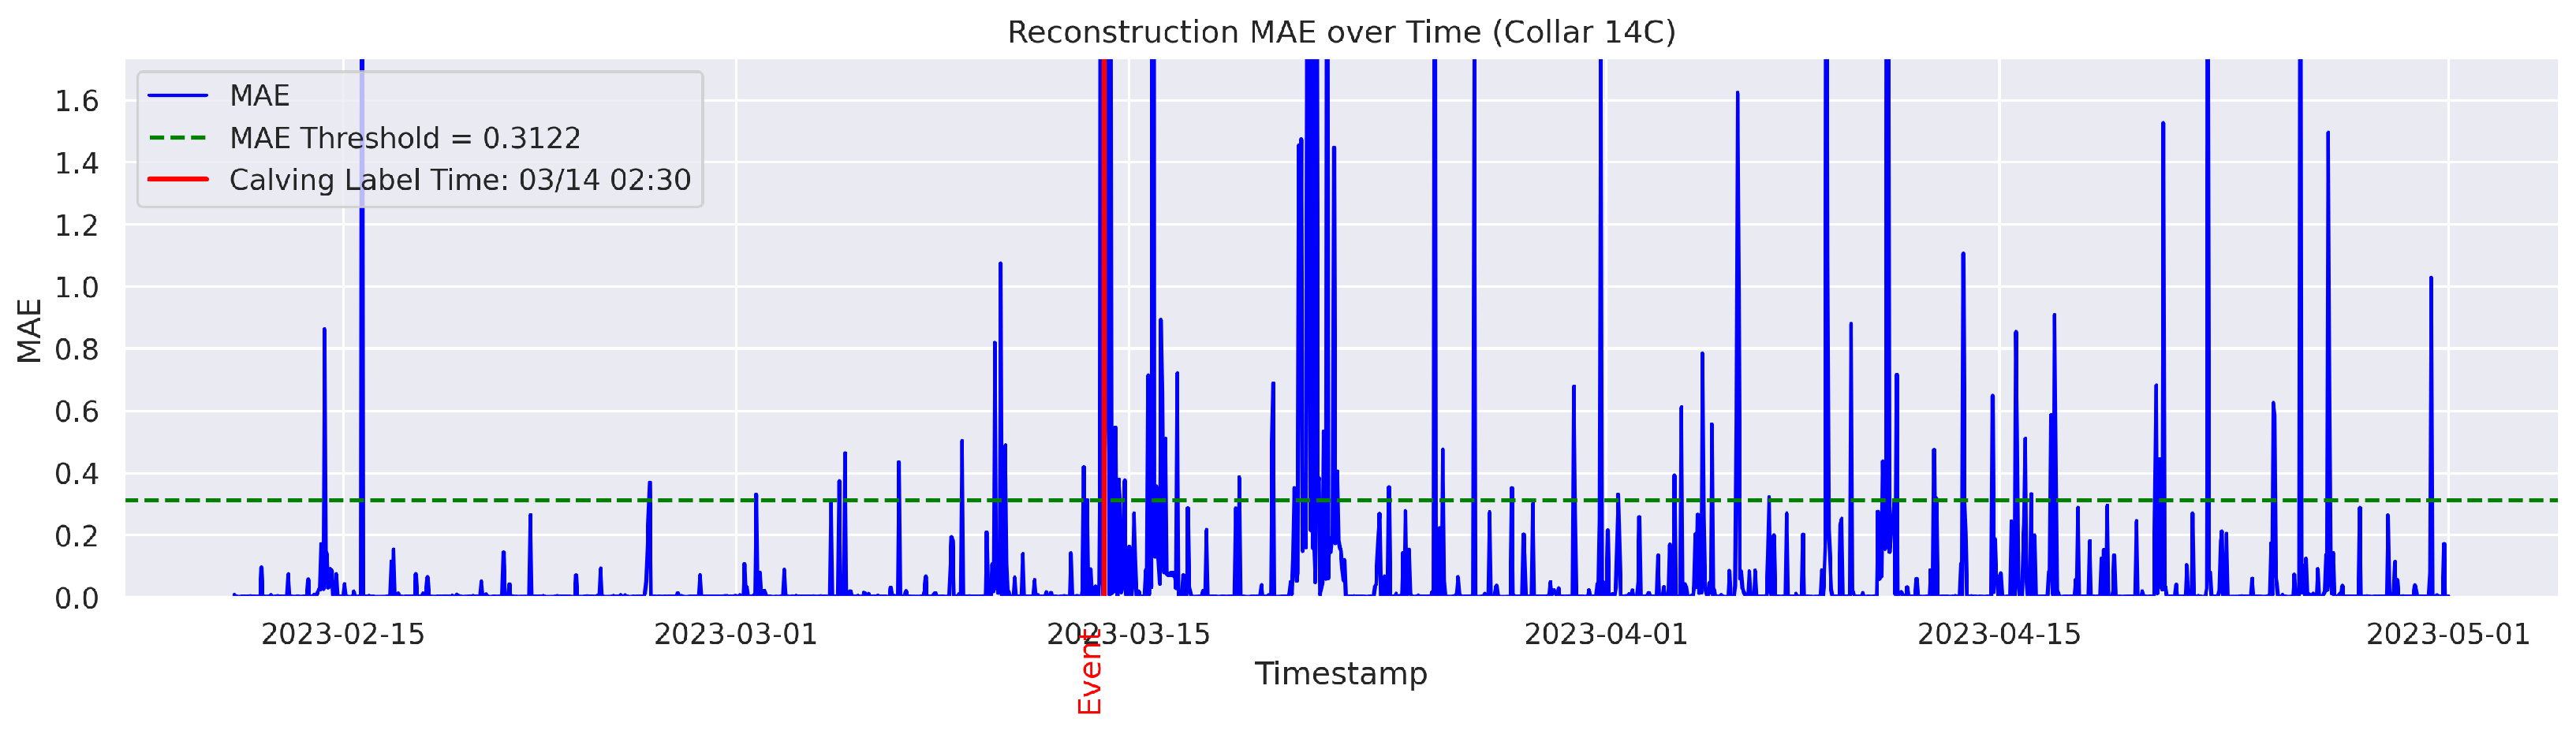
The following procedure was used to identify anomalous data points using the autoencoder. At each timestep
t, the autoencoder predicts the values of all features. These predicted values are then compared to the actual values. It is important to note that the time encoding features are not part of the reconstruction objective. To quantify the difference, also known as the reconstruction error [
27], we used the MAE. If the MAE at a timestamp
t exceeds a predefined threshold, the corresponding timestamp
t is flagged as an instance of abnormal behavior. The MAE was utilized because it directly measures the average magnitude of errors in the same units as the data, making it intuitive and easy to understand; it also avoids overemphasizing large outliers compared to the Mean Squared Error (MSE). The threshold for anomaly detection was set to the 95th percentile of the reconstruction error. Therefore, time points with a higher MAE value were considered anomalous.
The output data had the same number of rows as the input data. The columns included were “Rounded UTC Time”, “Threshold”, “MAE”, and the boolean value “Anomaly”, which was derived based on the comparison between the set threshold and the MAE value. An example of the output data is shown in
Table 4.
3.2. Stage 2: Classification of Calving Events
The goal of this stage was to distinguish abnormal points associated with calving from those caused by other behaviors. To this end, we implemented a supervised Random Forest (RF) classification model. The RF was selected over alternative models due to its robustness to noisy data, ability to handle imbalanced datasets, and effectiveness in capturing complex nonlinear relationships between features [
28], which are characteristic of this dataset. Preliminary inspection revealed a highly imbalanced dataset, with relatively few “calving” anomalies (True) compared to “non-calving” anomalies (False), which may bias a classifier toward the majority class. Additionally, calving labels were assigned by observers based on frequent but discontinued field observation schedules. This procedure may introduce noise, reducing the labeling accuracy. This bias may also obscure detecting relevant patterns, limiting the model’s ability to reliably distinguish calving events from other irregular activities.
Finally, RF provides a feature relevancy rank, enhancing the overall interpretability and helping to identify the most relevant features for classification. These properties make RF a particularly suitable classifier for our application.
The method was implemented in three steps. The first step is to label feature data with corresponding calving and non-calving labels. To this end, anomalous data points identified near the observed calving time (ground-truthed calving time) were labeled as “calving” (True). In contrast, anomalous detected points that were not associated with a true calving event were labeled as “non-calving” (False). For labeling purposes, we defined ‘near calving time’ as any time point within 24 h (±1 day) of the ground-truthed calving time. The use of a selective range was decided to mitigate any bias from field observers by ensuring that only data points proximate to the true calving event were included in the calving label. The resulting labeled dataset was subsequently partitioned into training and testing sets.
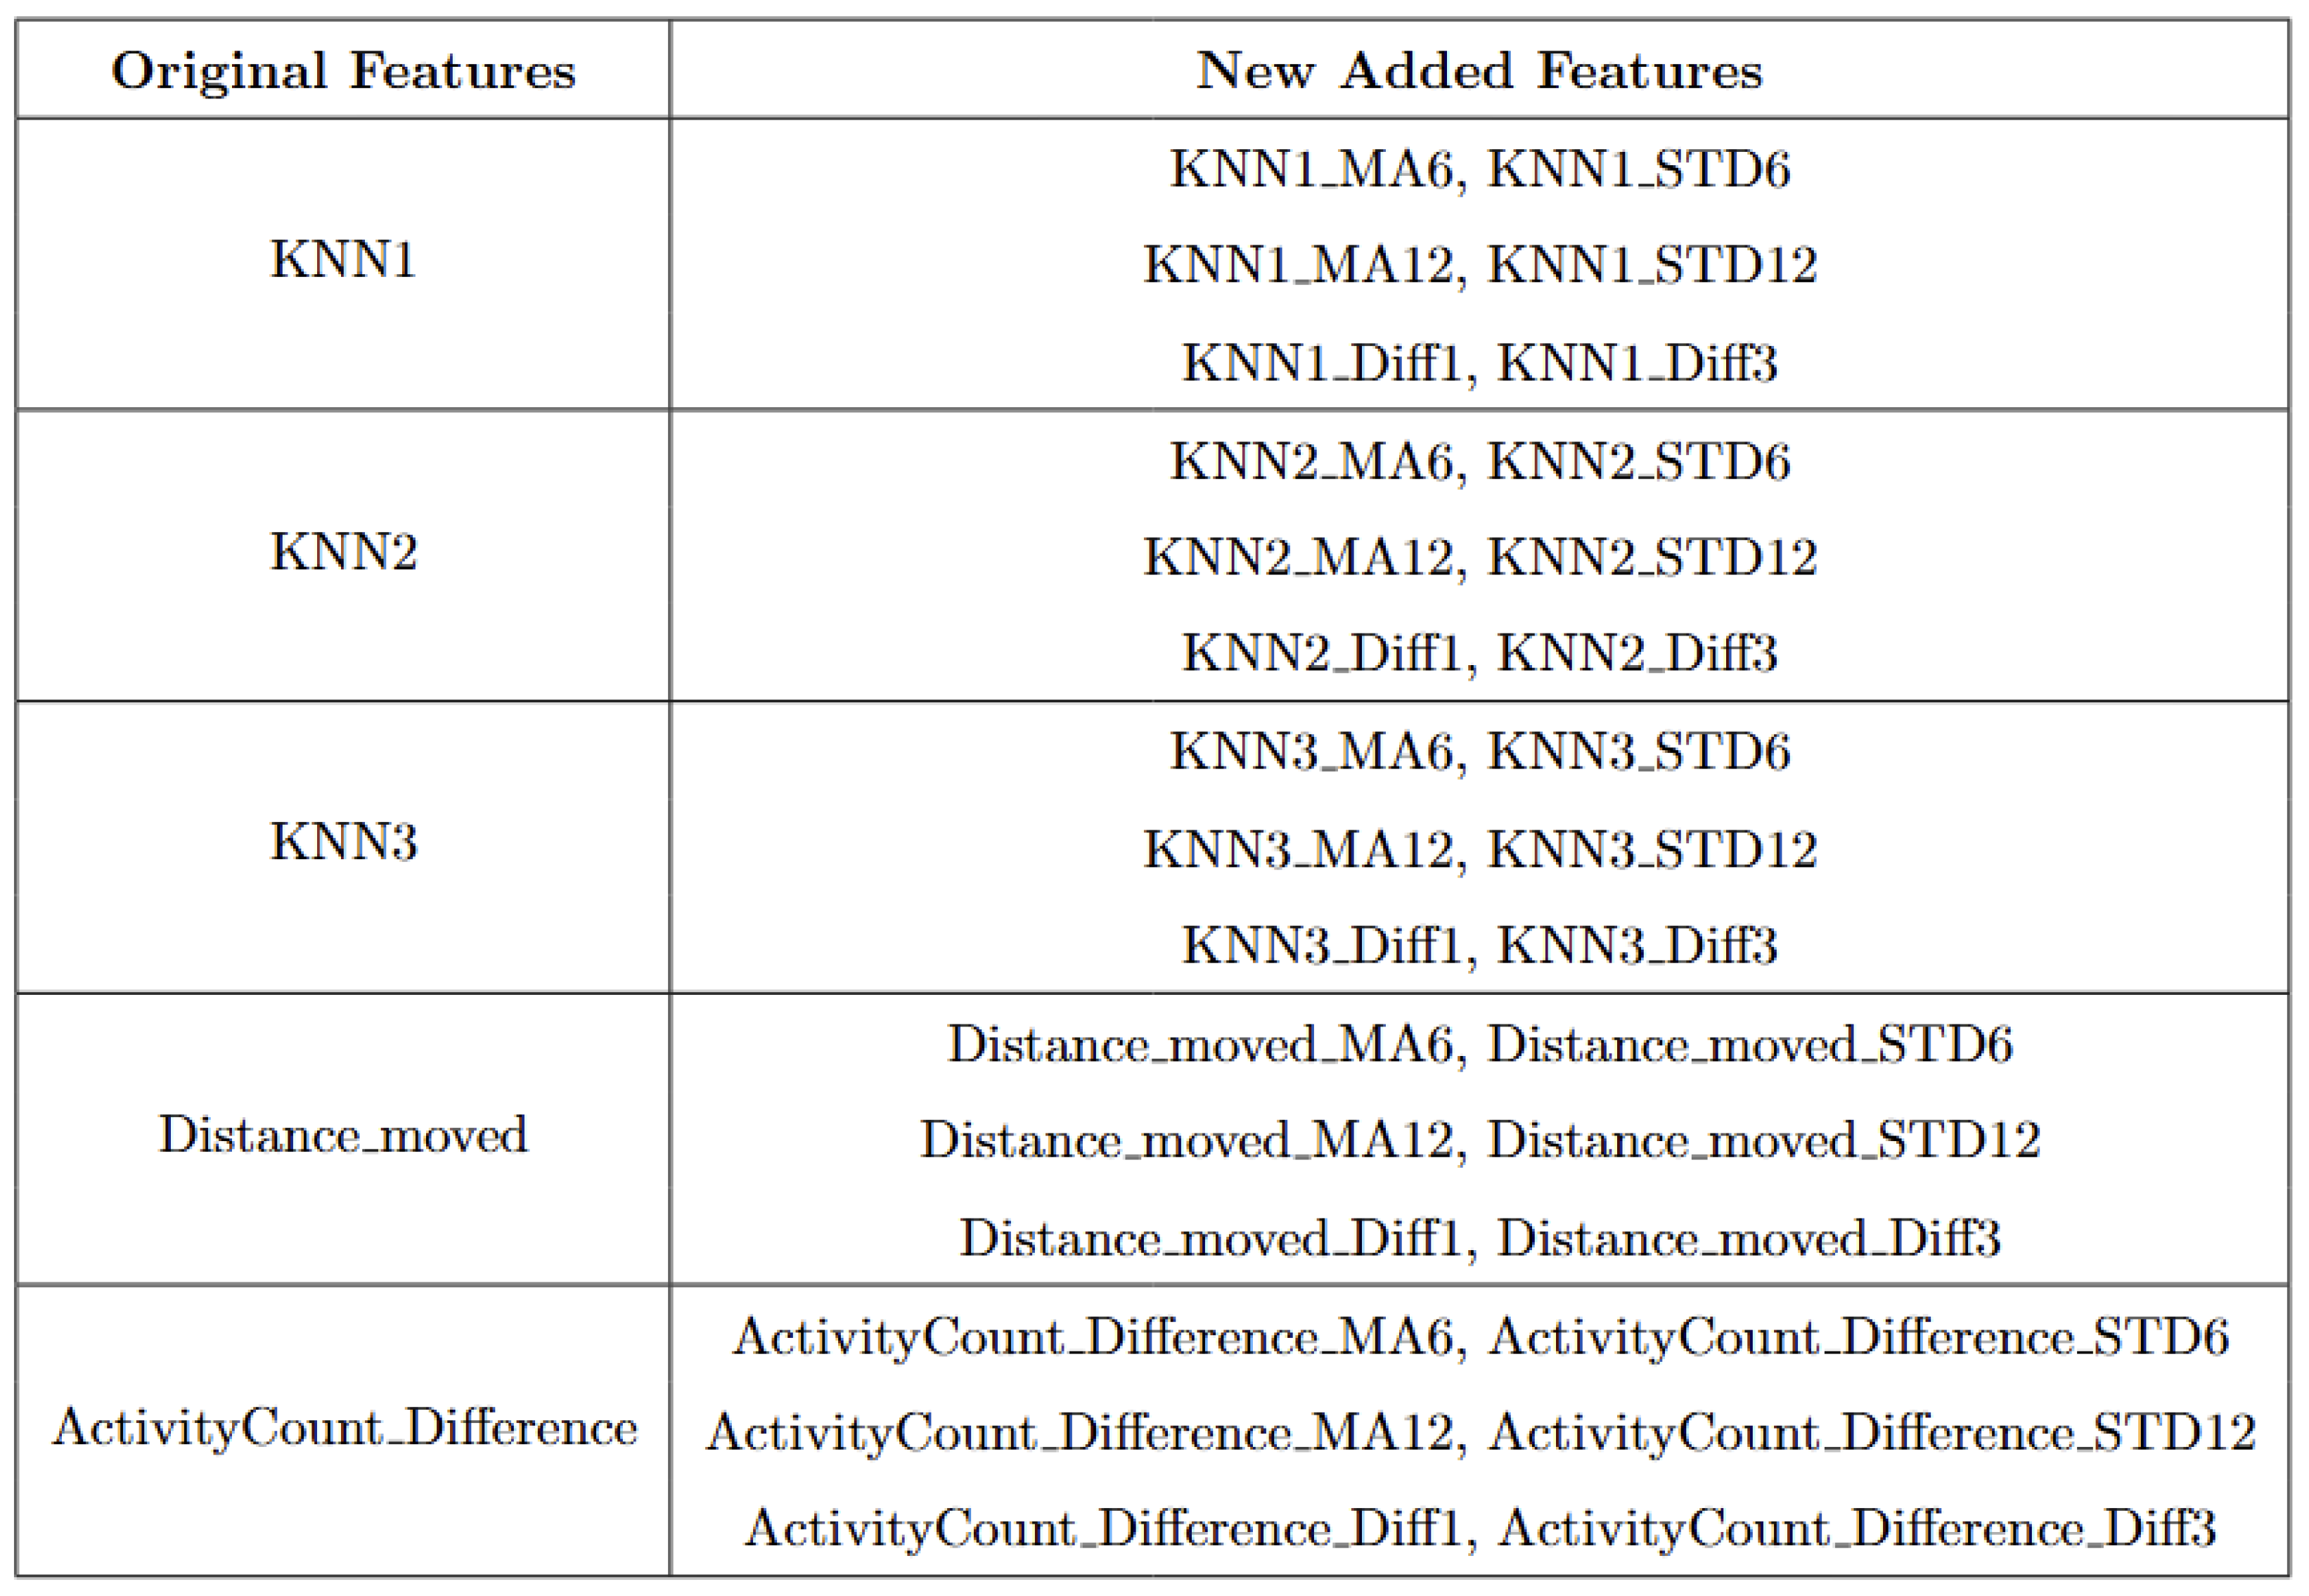
The second step was to train the RF classifier using labeled data. Prior to training, we enriched the original features by applying a sliding window function to capture short-term behavioral trends. This method computes moving averages (MAs) and standard deviations (STDs) over recent time windows (e.g., 6 and 12 h), as well as short-term differences (e.g., 1- and 3-h differences) for each of the core behavioral features. The added statistical context improves the classifier’s ability to distinguish calving-related anomalies from other outliers. Each instance has a total of 35 features used for classification, the list of features can be found in
Appendix B.
The RF is composed of multiple decision trees and decision tree splits based on the value of the features. These splits do not rely on euclidean distance or other distance-based metrics; therefore, the scale or distribution of features does not affect the splitting rules. The splits are based on the relative order of feature values rather than their absolute magnitudes or the distances between them [
28]. This approach eliminates the need for additional processing steps, such as standardization, preserving the original meaning and interpretability of the features. The RF model was initialized with 100 decision tree estimators; take
, and the class weights were set to “balanced” (
) to account for the inherent class imbalance between calving and non-calving events. The “balanced” mode automatically considers the weight of each class to be inversely proportional to its frequency [
29], ensuring that the minority class (calving) receives more attention during training. Without class weighting, the classifier could achieve superficially high accuracy by simply predicting all samples as non-calving. For example, always predicting the majority class could result in over 95% accuracy yet completely fail to identify any calving events. Such behavior would be unacceptable, as missing calving events is far more costly than generating false alarms. All the other parameters take the default values set in the random forest function from the
scikit-learn package.
The last step was to make predictions on the testing dataset to verify the performance of the classifier.
3.3. Evaluation Metrics
To evaluate the performance of the proposed method, we adopted standard binary classification metrics, including True Positive (TP), False Positive (FP), True Negative (TN), and False Negative (FN) metrics. A prediction is considered a TP if it correctly identifies a calving event. A FP occurs when the model incorrectly predicts a calving event at a non-calving time. A TN refers to a correctly predicted non-calving instance, while a FN is a calving event that the model fails to detect.
Based on these definitions, we computed three standard evaluation metrics. The Precision measures the proportion of predicted calving events that are correct and is defined as . The Recall quantifies the proportion of actual calving events that are successfully detected by the model and is defined as . The F1-score is the harmonic mean of precision and recall and is computed as . These metrics collectively provide a comprehensive reference of the model’s effectiveness in detecting calving events.
3.3.1. Evaluation Metrics for Anomaly Detection in Stage 1
The primary goal of the anomaly detection is to ensure that calving is successfully detected and without omission of any true calving event. In particular, high Recall values are preferred, meaning that data points related to true calving points are correctly identified as anomalous. We also noted other anomalies associated with low locomotion, health issues, or changes in behavior associated with inclement weather. Therefore, as our label data only includes calving events but no other events that may cause cows to behave abnormally, it is not realistic to expect a high precision.
Cows were observed twice daily at approximately 12-h intervals; therefore, calving labels may not be 100% accurate. In some cases, the recorded calving time reflects the best possible estimate based on field staff observations and judgment. To mitigate uncertainty, a time range was applied. The model predictions were considered TPs if they occurred within 24 h before or after the annotated calving time. This approach therefore accounts for the twice-daily cow inspection schedule used in this study.
3.3.2. Evaluation Metrics for Classifications in Stage 2
The goal was to distinguish calving-related anomalies from all the other detected anomalies. Therefore, Precision becomes more important in this stage. It is worth noting that the behavioral patterns associated with calving may not immediately return to normal after the event. The anomalous behaviors related to calving may persist for several hours post calving. As a result, we clustered the classifier’s predictions for calving-related anomalies based on temporal proximity. Predictions made by the classifier were grouped into clusters if their timestamps fell within a predefined temporal threshold (e.g., within 24 h of each other). Each cluster represented a single event as identified by the classifier. Following this criterion, if the point closest to the actual calving time within a cluster was classified as a TP, the entire cluster was labeled as a TP; otherwise, the cluster was classified as an FP.
We split the data by cow into training and testing sets. We performed a 5-fold cross-validation, where, in each iteration, 12 cows were used for training and the remaining 3 cows were used for testing. This process ensures that each cow is used for both training and testing across different folds, providing a robust evaluation of the model’s performance.


