2.4.1. Experiment Design
In this study, three indexes were used for evaluating the performance of seeding: seeding density, seeding uniformity, and seeding efficiency. To verify the effects of the forward speed, discharging sprocket rotational speed, and the outlet size of the hopper on the index of seeding performance, a field test was conducted as shown in
Figure 4.
Three different forward speeds v were used in this experiment: 4, 3, and 2 km/h. Two different hopper outlet sizes (w), 400 and 520 mm, were used to ensure that the hopper did not jam. Three different discharging sprocket rotational speeds n were used in this experiment: 120, 80, and 40 r/min.
The experiment followed a completely randomized design (CRD) with a fractional factorial design (FFD) approach. Only 8 key treatments were performed. This reduced the number of tests while still capturing the main effects and potential interactions, saving time and sources. The selected treatments are listed in
Table 2.
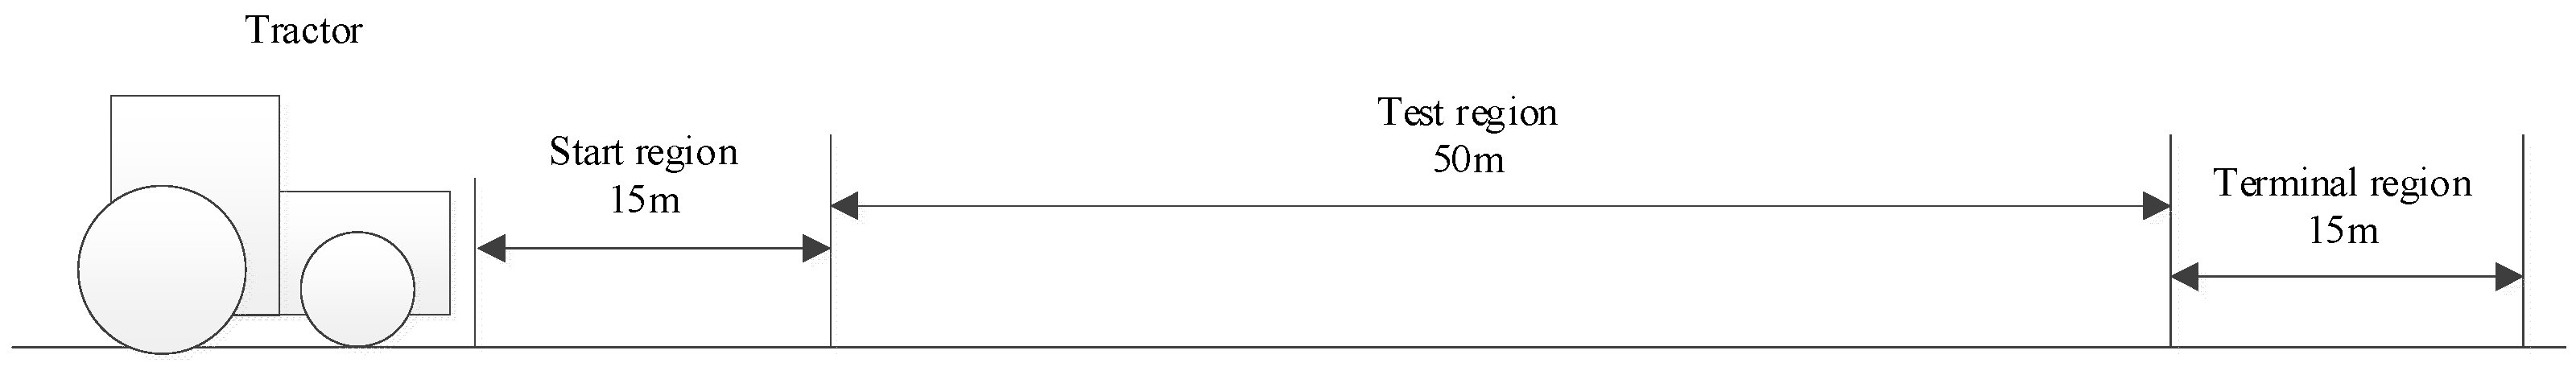
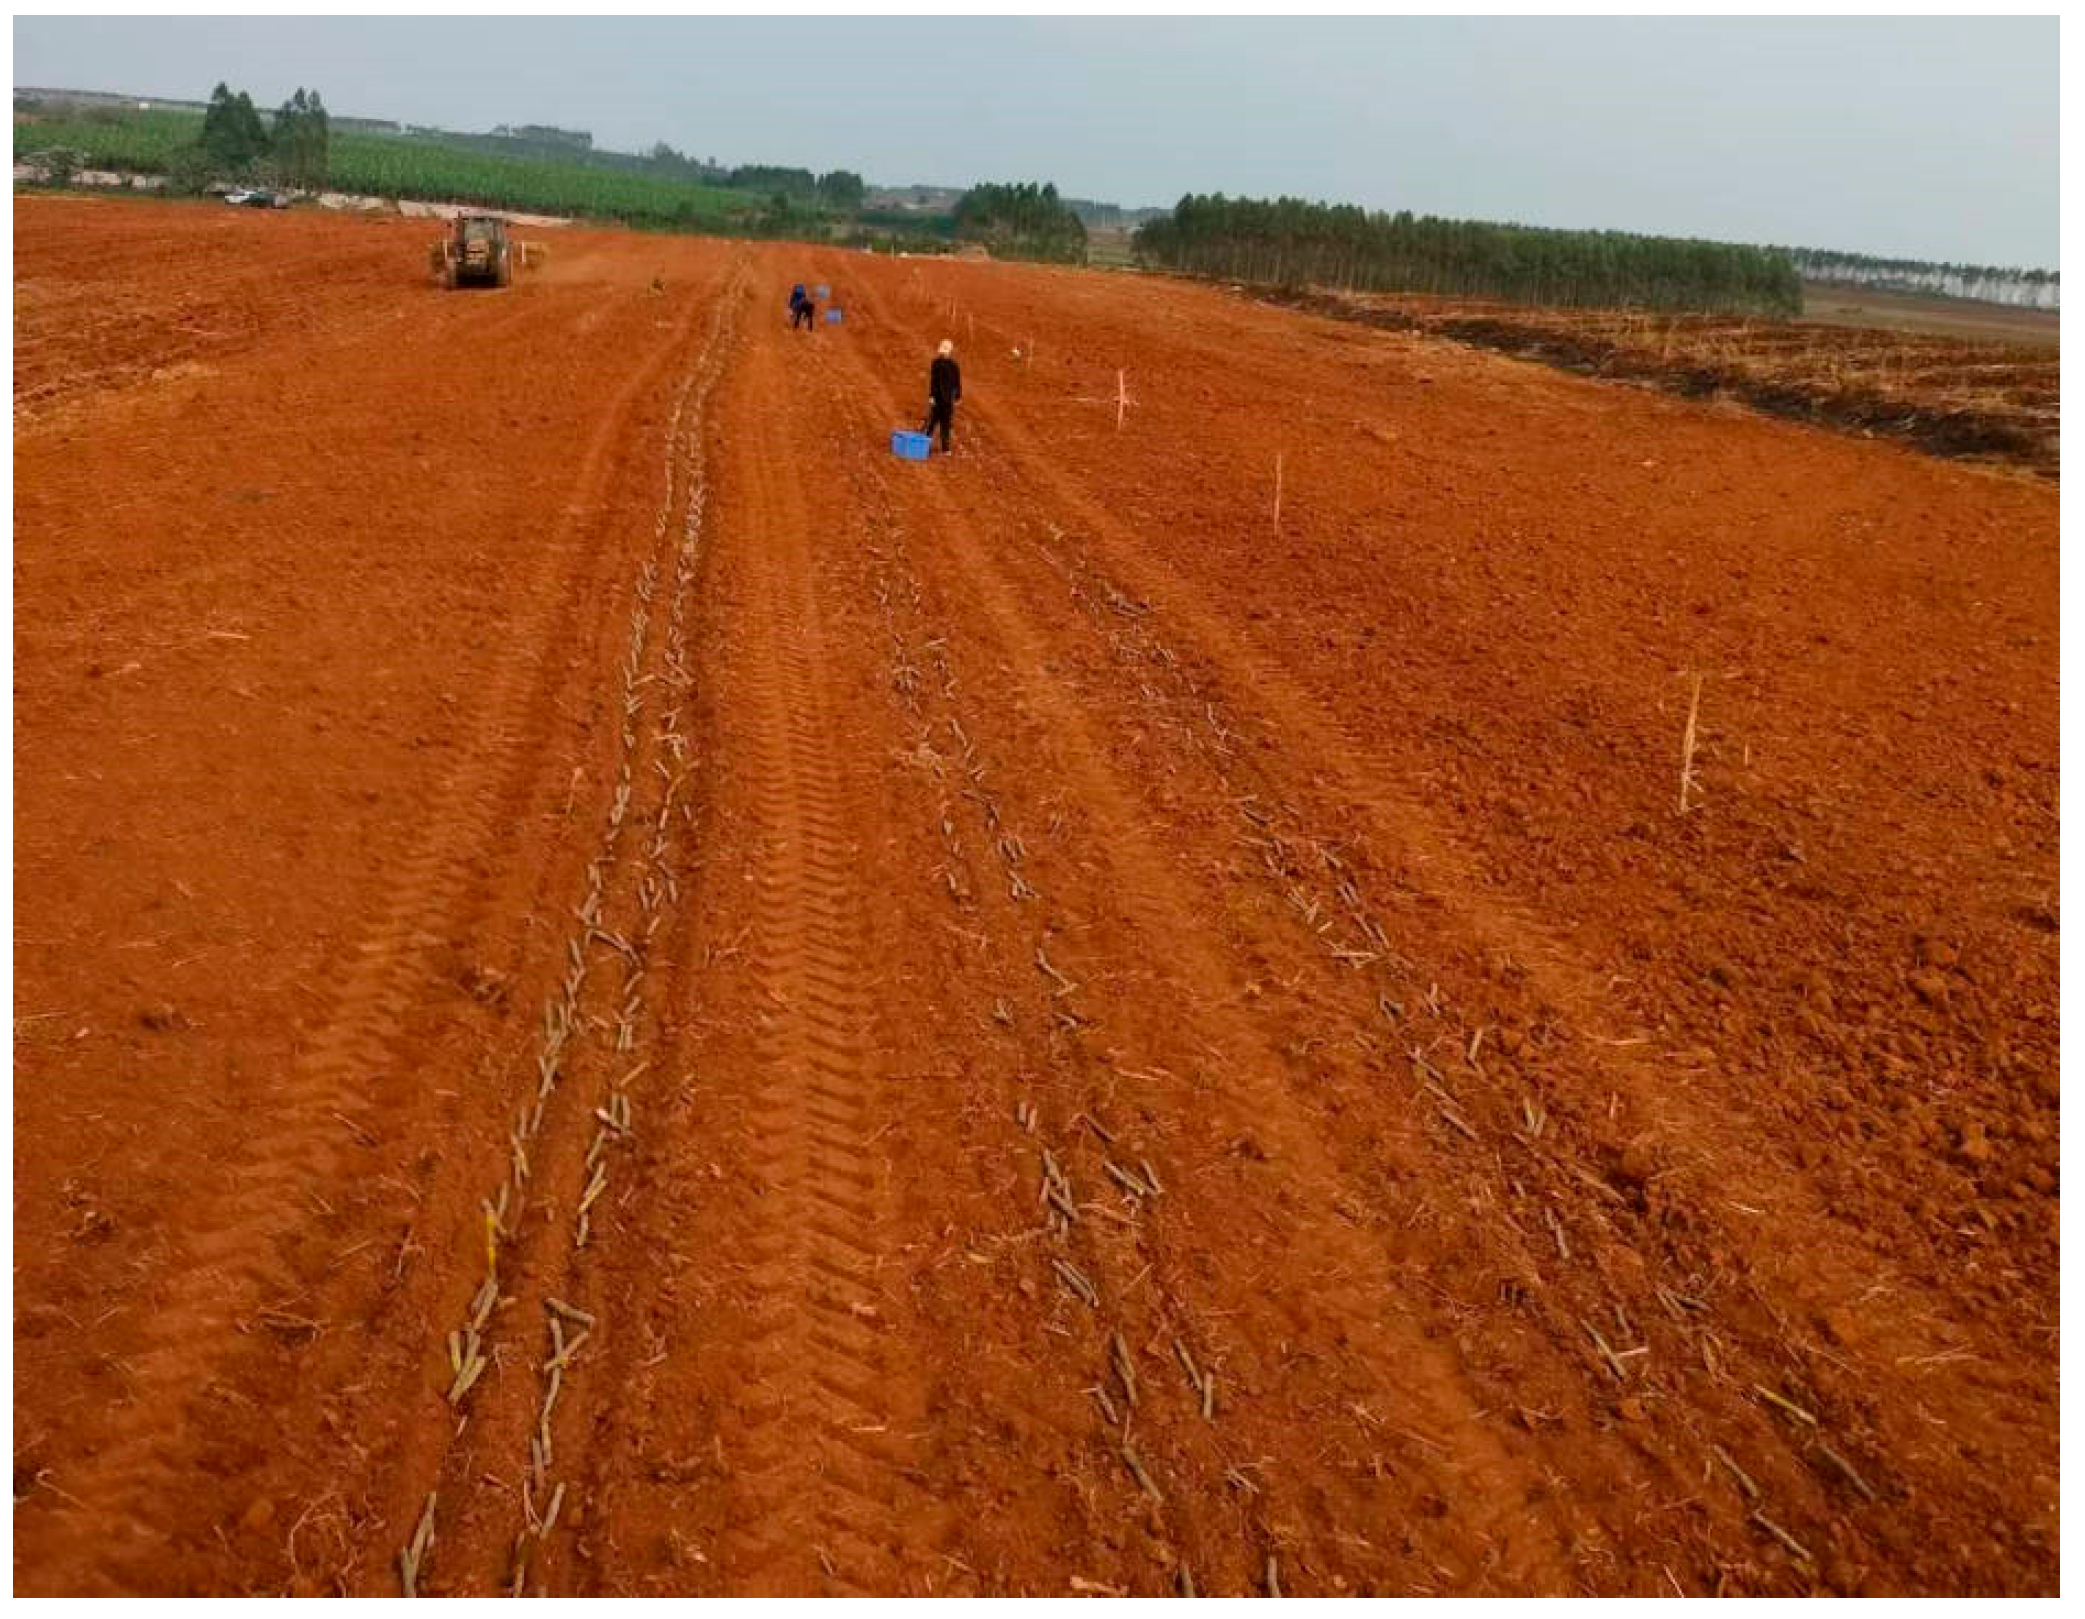
This experiment was conducted at the testing base of Guangken Agricultural Machinery Service Co., Ltd., Zhanjiang City, Guangdong Province, China, on 11 March 2023. To reduce experimental error, the operating region was divided into the start region, test region, and termination region, as shown in
Figure 5. The distances of the start, test, and termination regions were 15 m, 50 m, and 15 m, respectively. The number of seeds per meter was recorded in the test region. The planter was mounted on John Deere M1654 tractor and operated during field work. The type of sugarcane used was Guitang 91, grown in Zhanjiang city, Guangdong province. The average length and diameter of the seeds were 250 mm and 30 mm, respectively. In the test region, the seeding rate per meter was manually recorded for a two-row planter, generating 100 data points for treatments A to H. With 3 experimental replications, the total dataset included 300 data points.
The average seeding rate per meter was calculated from each treatment’s data. Using Equations (1) and (2), the average discharge amount per seeding cleat
q and seeding efficiency
E for each group were then determined. One-way analysis of variance (ANOVA) [
23] was performed on
q and
E to investigate the influence of vehicle speed
v, discharging sprocket rotational speed
n, and hopper outlet size
w on these parameters. Linear regression analysis was employed to establish mathematical relationships among the given operating parameters, the planter’s inherent structure, the average seeding rate per meter, and the seeding efficiency. When the distribution of the seeding rate sample data follows a Poisson distribution, the seeding uniformity can be reflected by the average seeding rate per meter. Therefore, the seeding performance of the planter can be directly predicted using its operating parameters and structural characteristics.
2.4.2. Speed Test of John Deere M1654 Tractor
The tractor M1654 used in the experiment lacked a real-time speed display and was equipped only with an engine speed gauge, which presents challenges when conducting speed-related tests. Therefore, this section analyzes the relationships among the vehicle speed, gear position, and engine speed of the John Deere M1654 tractor.
Within the tractor’s powertrain, speed transmission begins with the transfer of power from the engine to the main clutch, proceeds through the gearbox, reaches the main reducer, and is finally delivered to the drive wheels via the transfer case [
24].
In the transmission system of the M1654 tractor, gear A1 and gear B4 adopt a geometric transmission design. According to reference [
25], under the conditions of a constant engine speed, by measuring the vehicle speeds corresponding to any two gears (ignoring actual slippage factors), the common ratio of the transmission system can be calculated.
When operating in the B3 gear at an engine speed of 1500 RPM, the travel time of the John Deere M1654 tractor over a 50-m distance was measured manually. Under these conditions, the tractor’s speed was measured to be 5.1 km/h. Similarly, when the John Deere M1654 tractor was operated at 1500 RPM in the A2 gear, it traveled at a speed of 2.0 km/h. So, the drive train ratio for the M1654 tractor was calculated as 1.207. Based on this common ratio, the theoretical vehicle speed of any gear at a specified engine speed can be calculated using Equation (6):
where:
z is the number of gears;
is the engine speed, r/min;
is the corresponding tractor speed at engine speed
for gear z, km/h.
Therefore, when the vehicle speed is set at 3.0 km/h, the corresponding gear and speed would be A3 and 900, respectively; similarly, when the vehicle speed is set at 4.0 km/h, the gear and speed would be B3 and 1200. The study also compiled a selection of tractor models whose first 8 gears within satisfy the requirement for equal ratios. Please refer to
Table 3.
2.4.3. Centroid Analysis
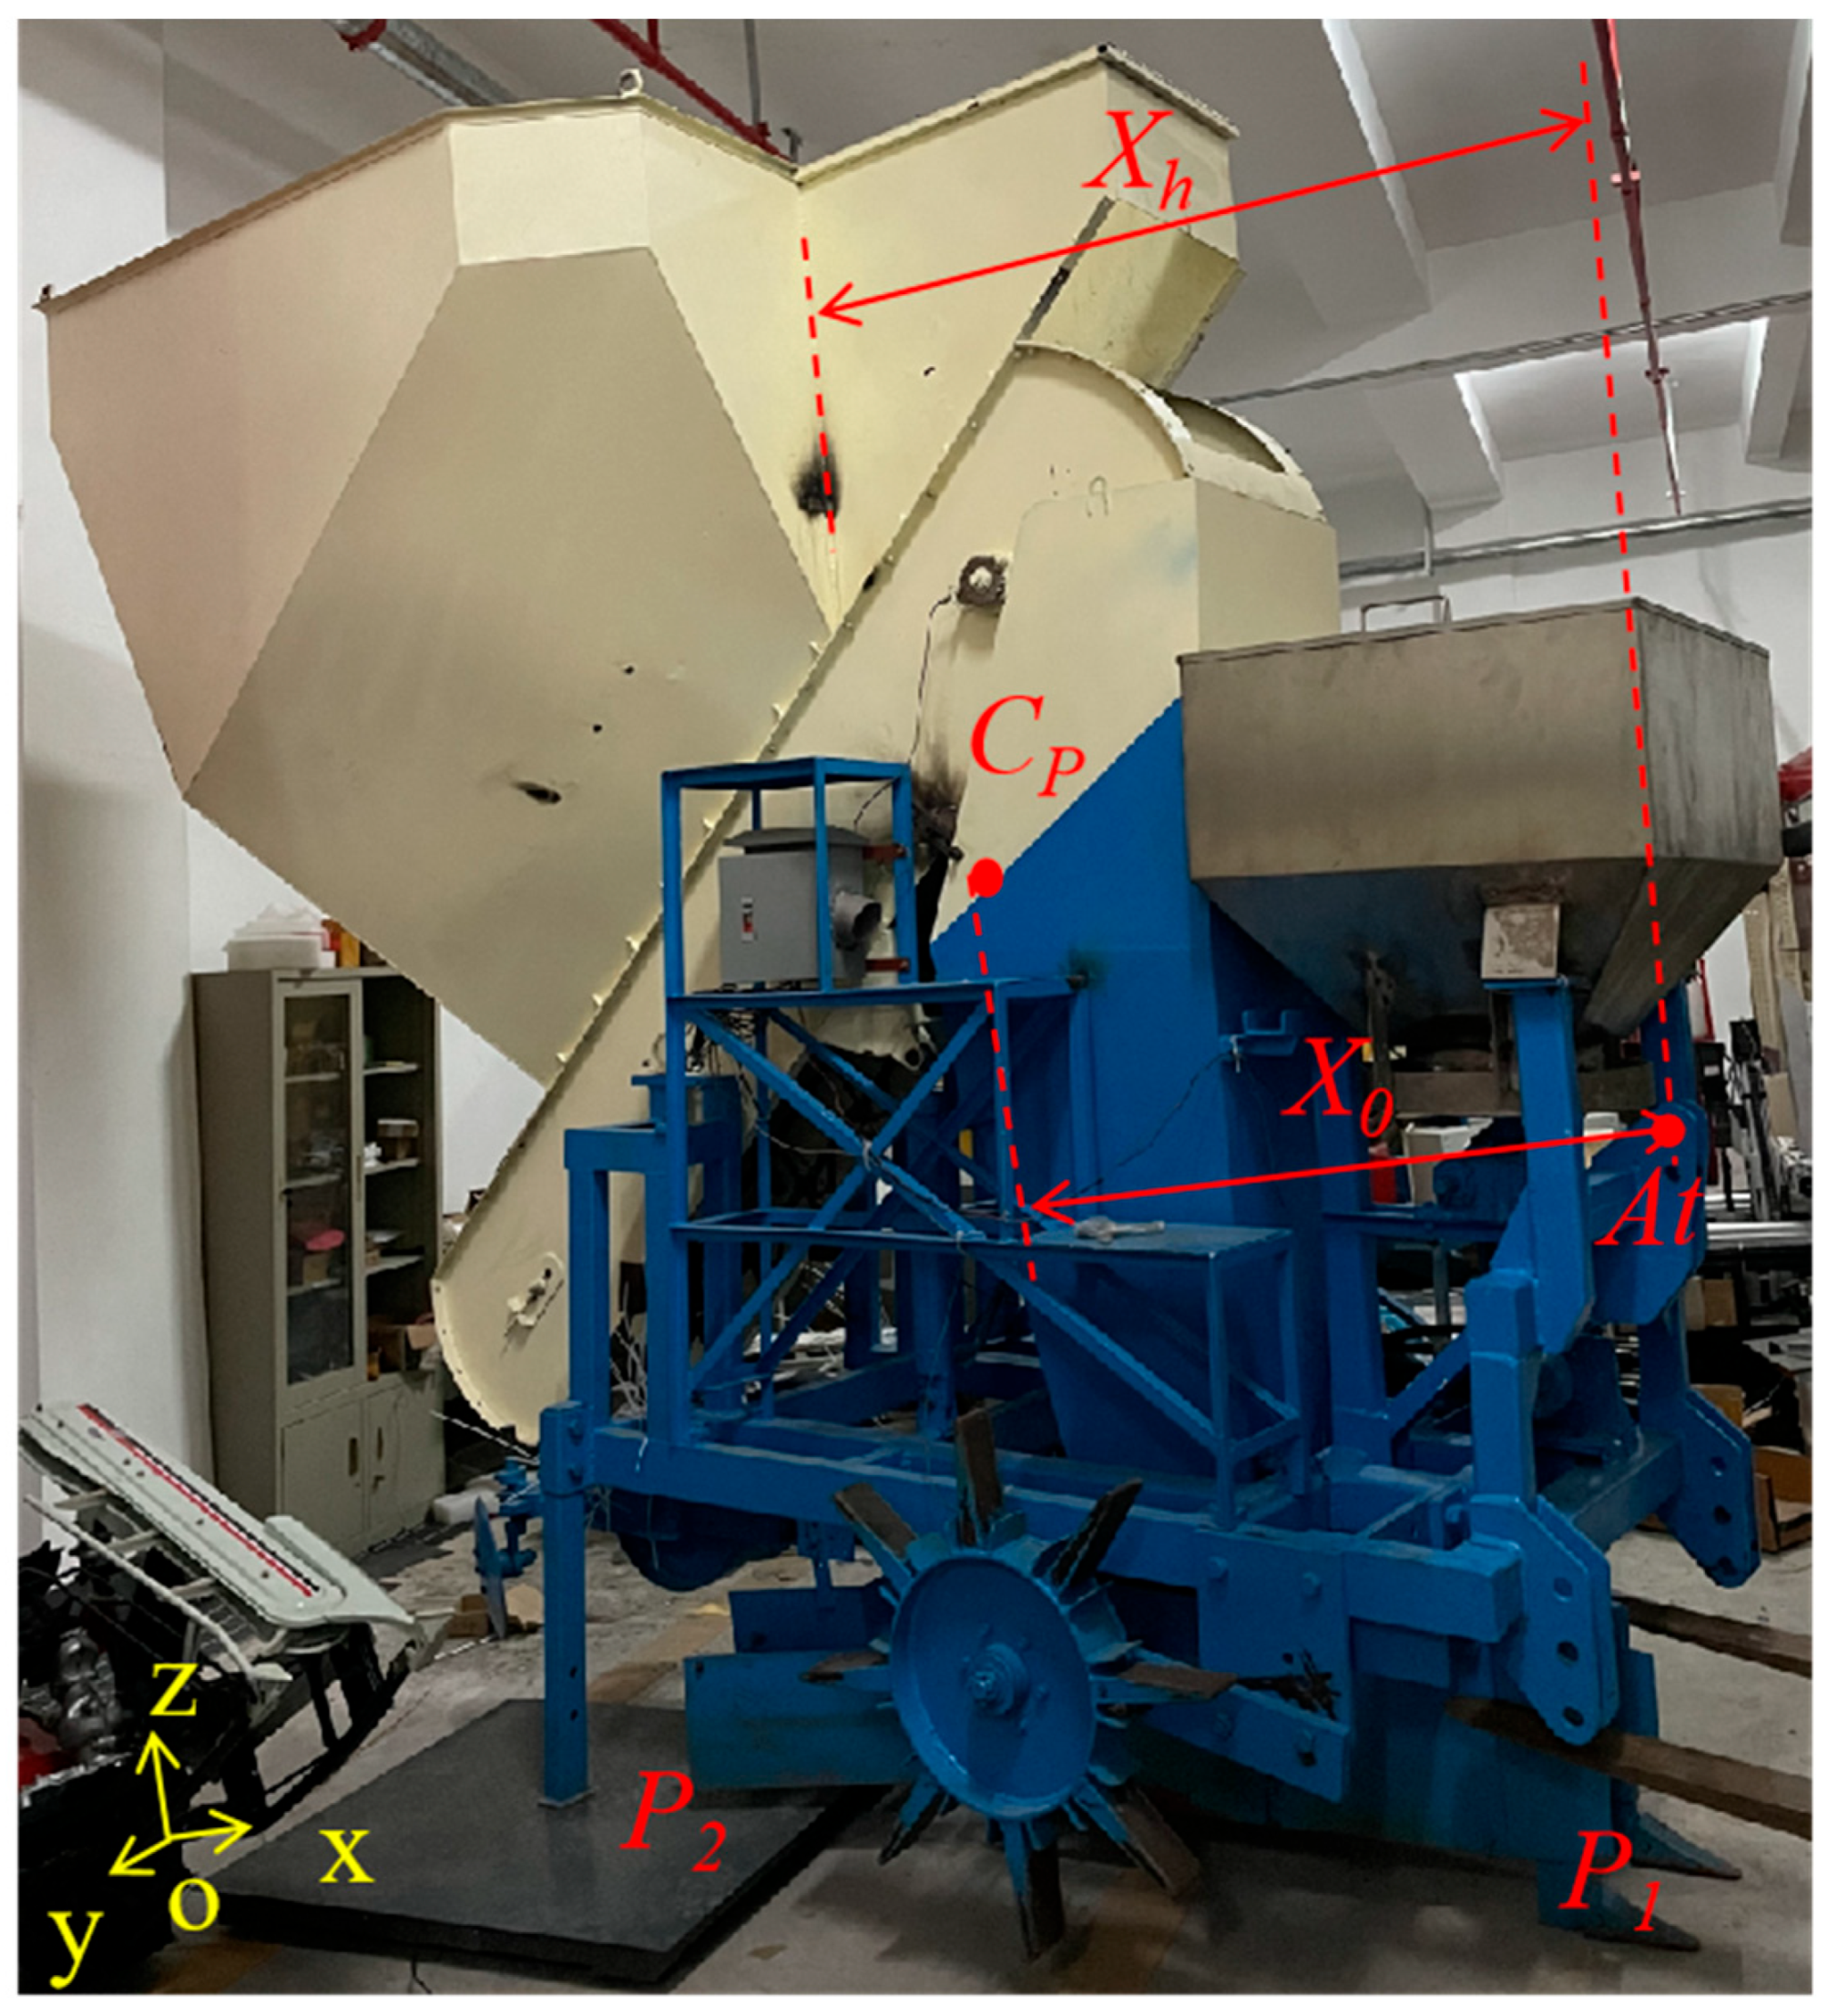
The centroid of the planter, filled with different cane seed amounts, was measured to assess how many seeds the M1654 tractor mount can support. During operation, the total weight of the planter consists primarily of two components: the weight of the unloaded planter and the mass of the loaded seeds.
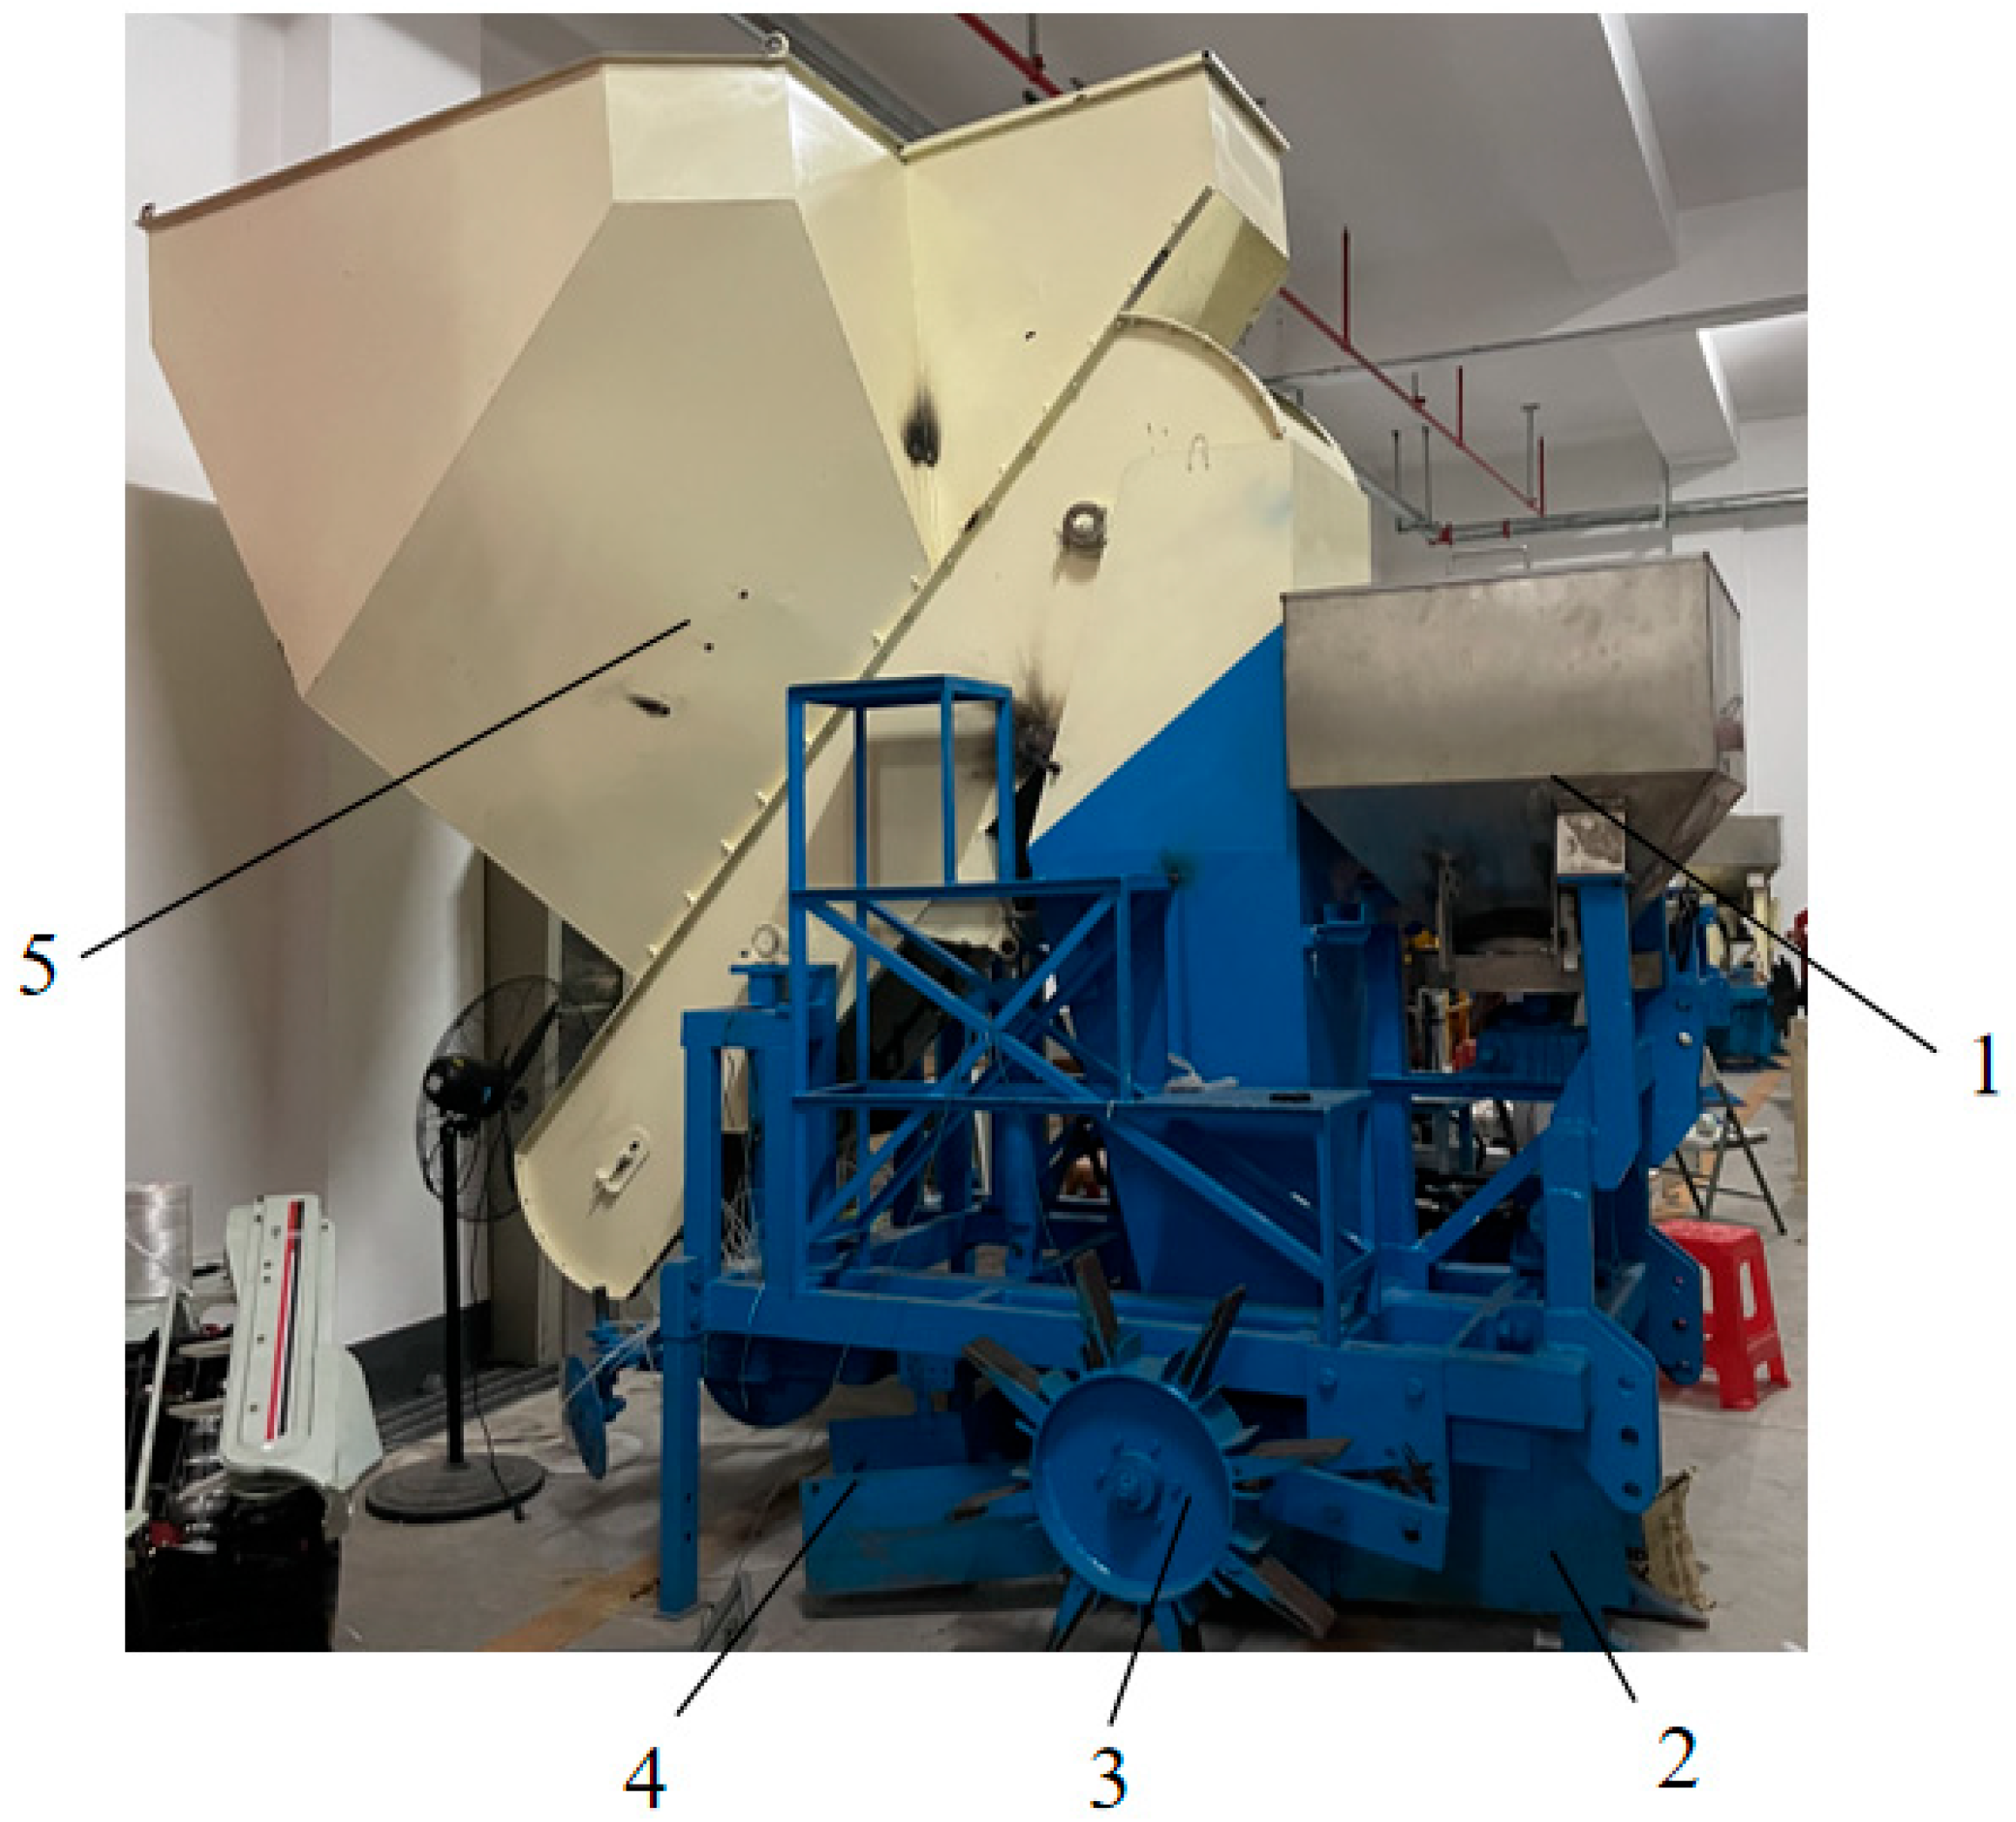
Firstly, the weight and centroid position of the unloaded planter were measured using the weighbridge, and then the centroid position of the planter with different cane seeds weights was measured using computer technology. When the planter is stationary on the ground, it is supported by the front furrow opener (P1) and two rear legs (P2 and P3). In this study, a weighbridge (range of 0–3 tons, accuracy to 0.5 kg) was used to measure the force on the three points of the unloaded planter, as shown in
Figure 6. The weights of the three points
,
, and
were 756 kg, 414 kg, and 535 kg, respectively. Therefore, the mass
of the unloaded planter was calculated to be 1705 kg, and the horizontal distance
from the center of planter
CP to the suspension point
At was 1010 mm.
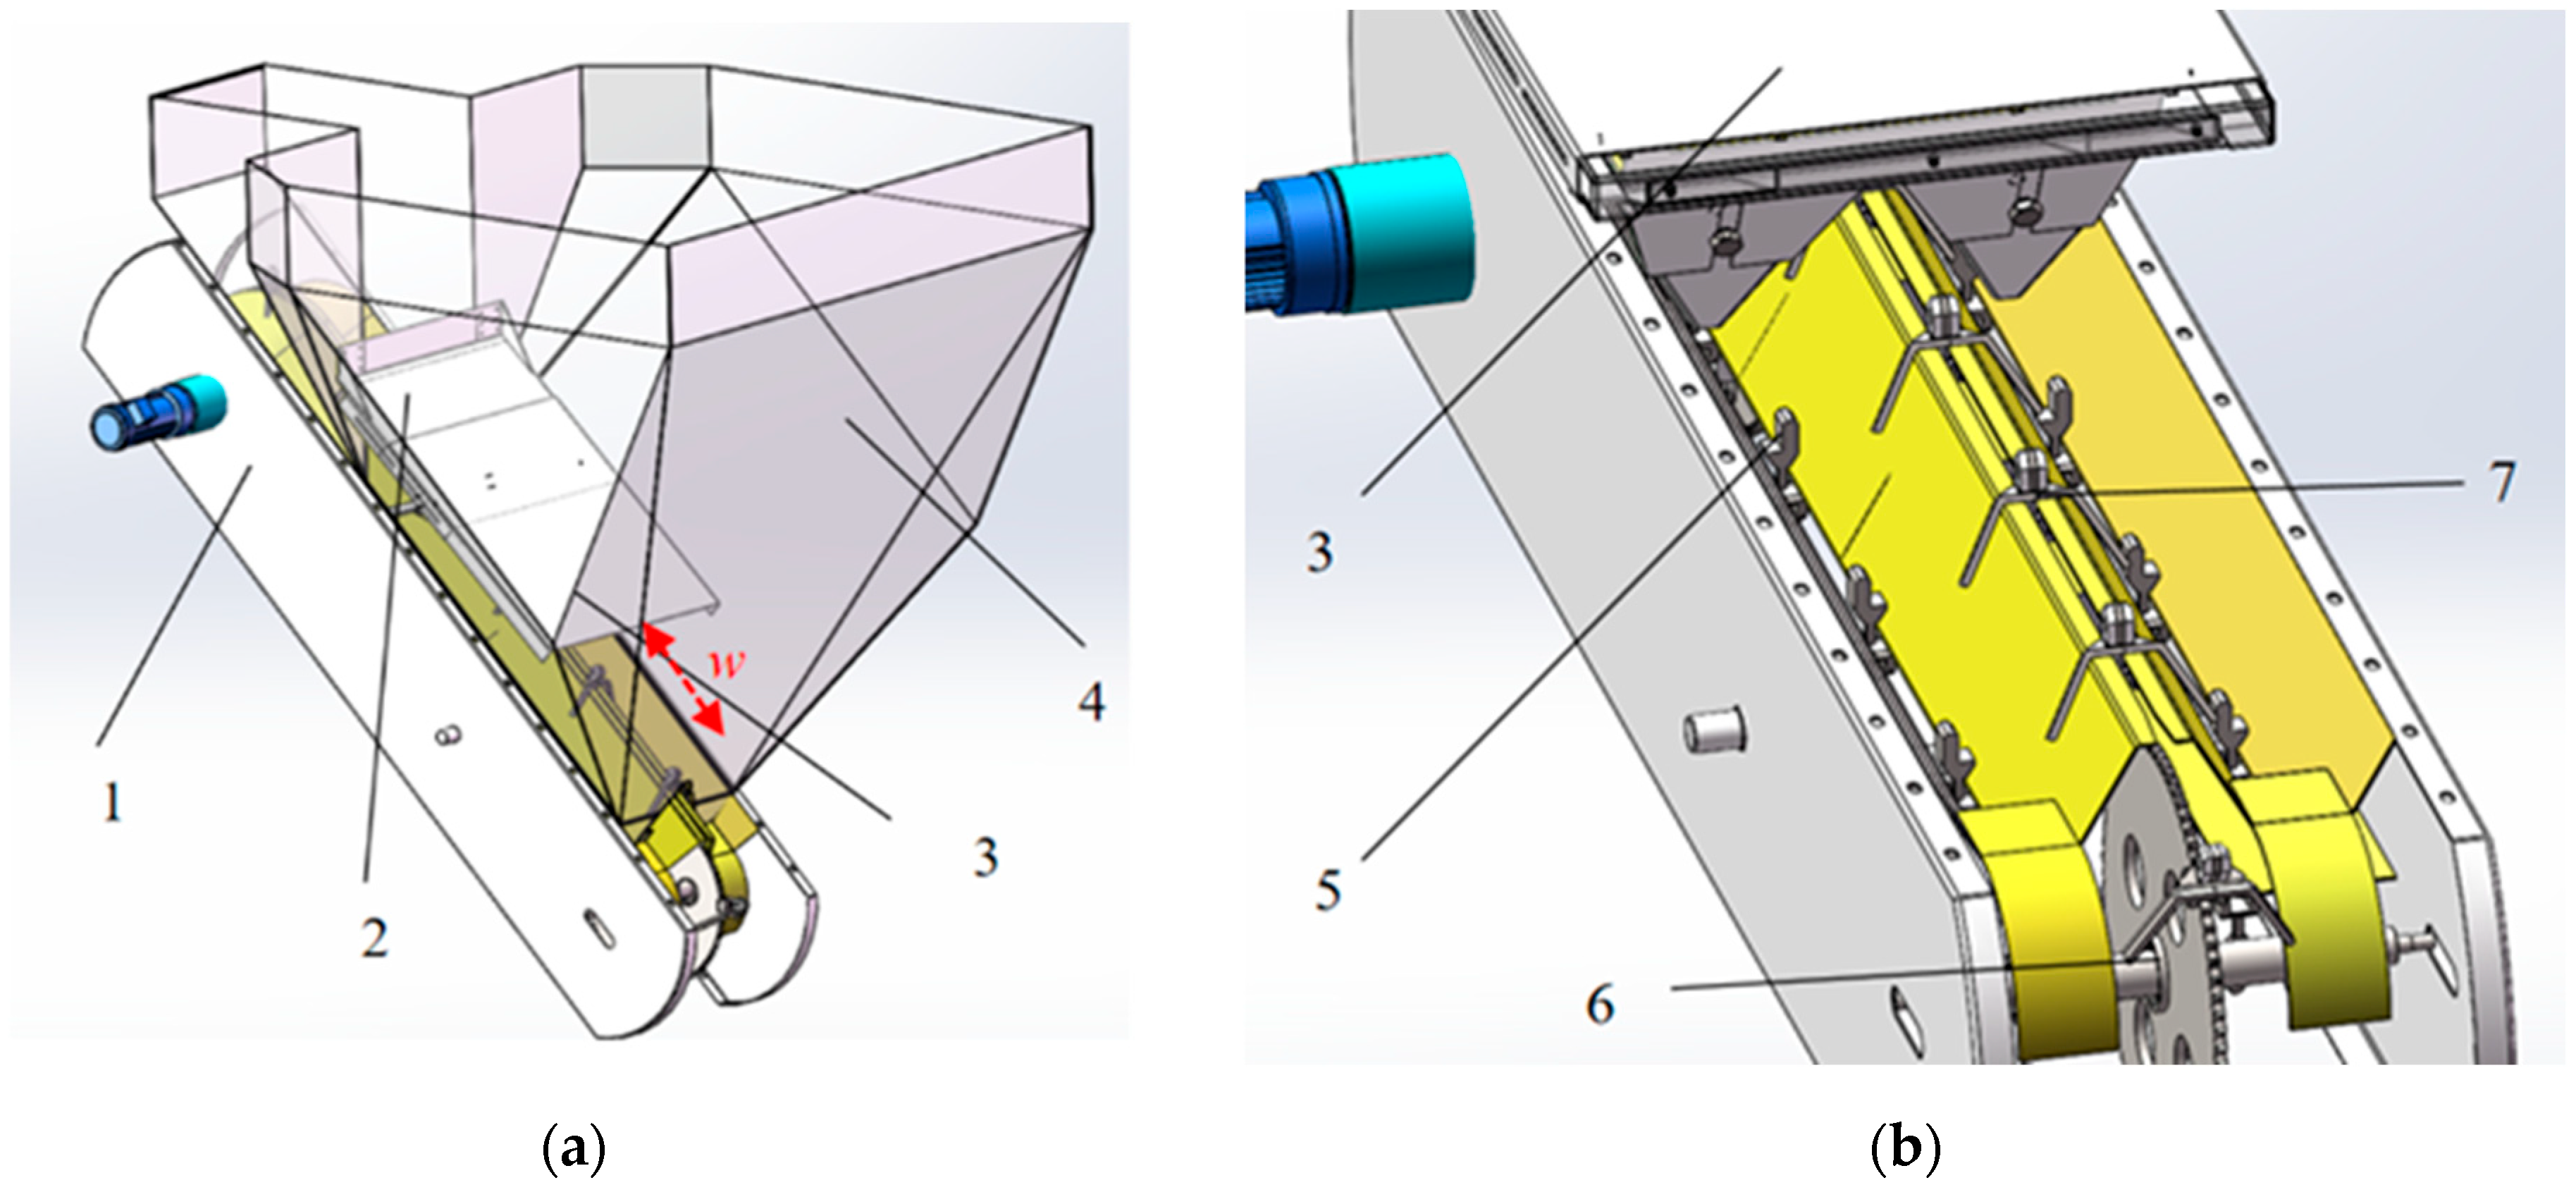
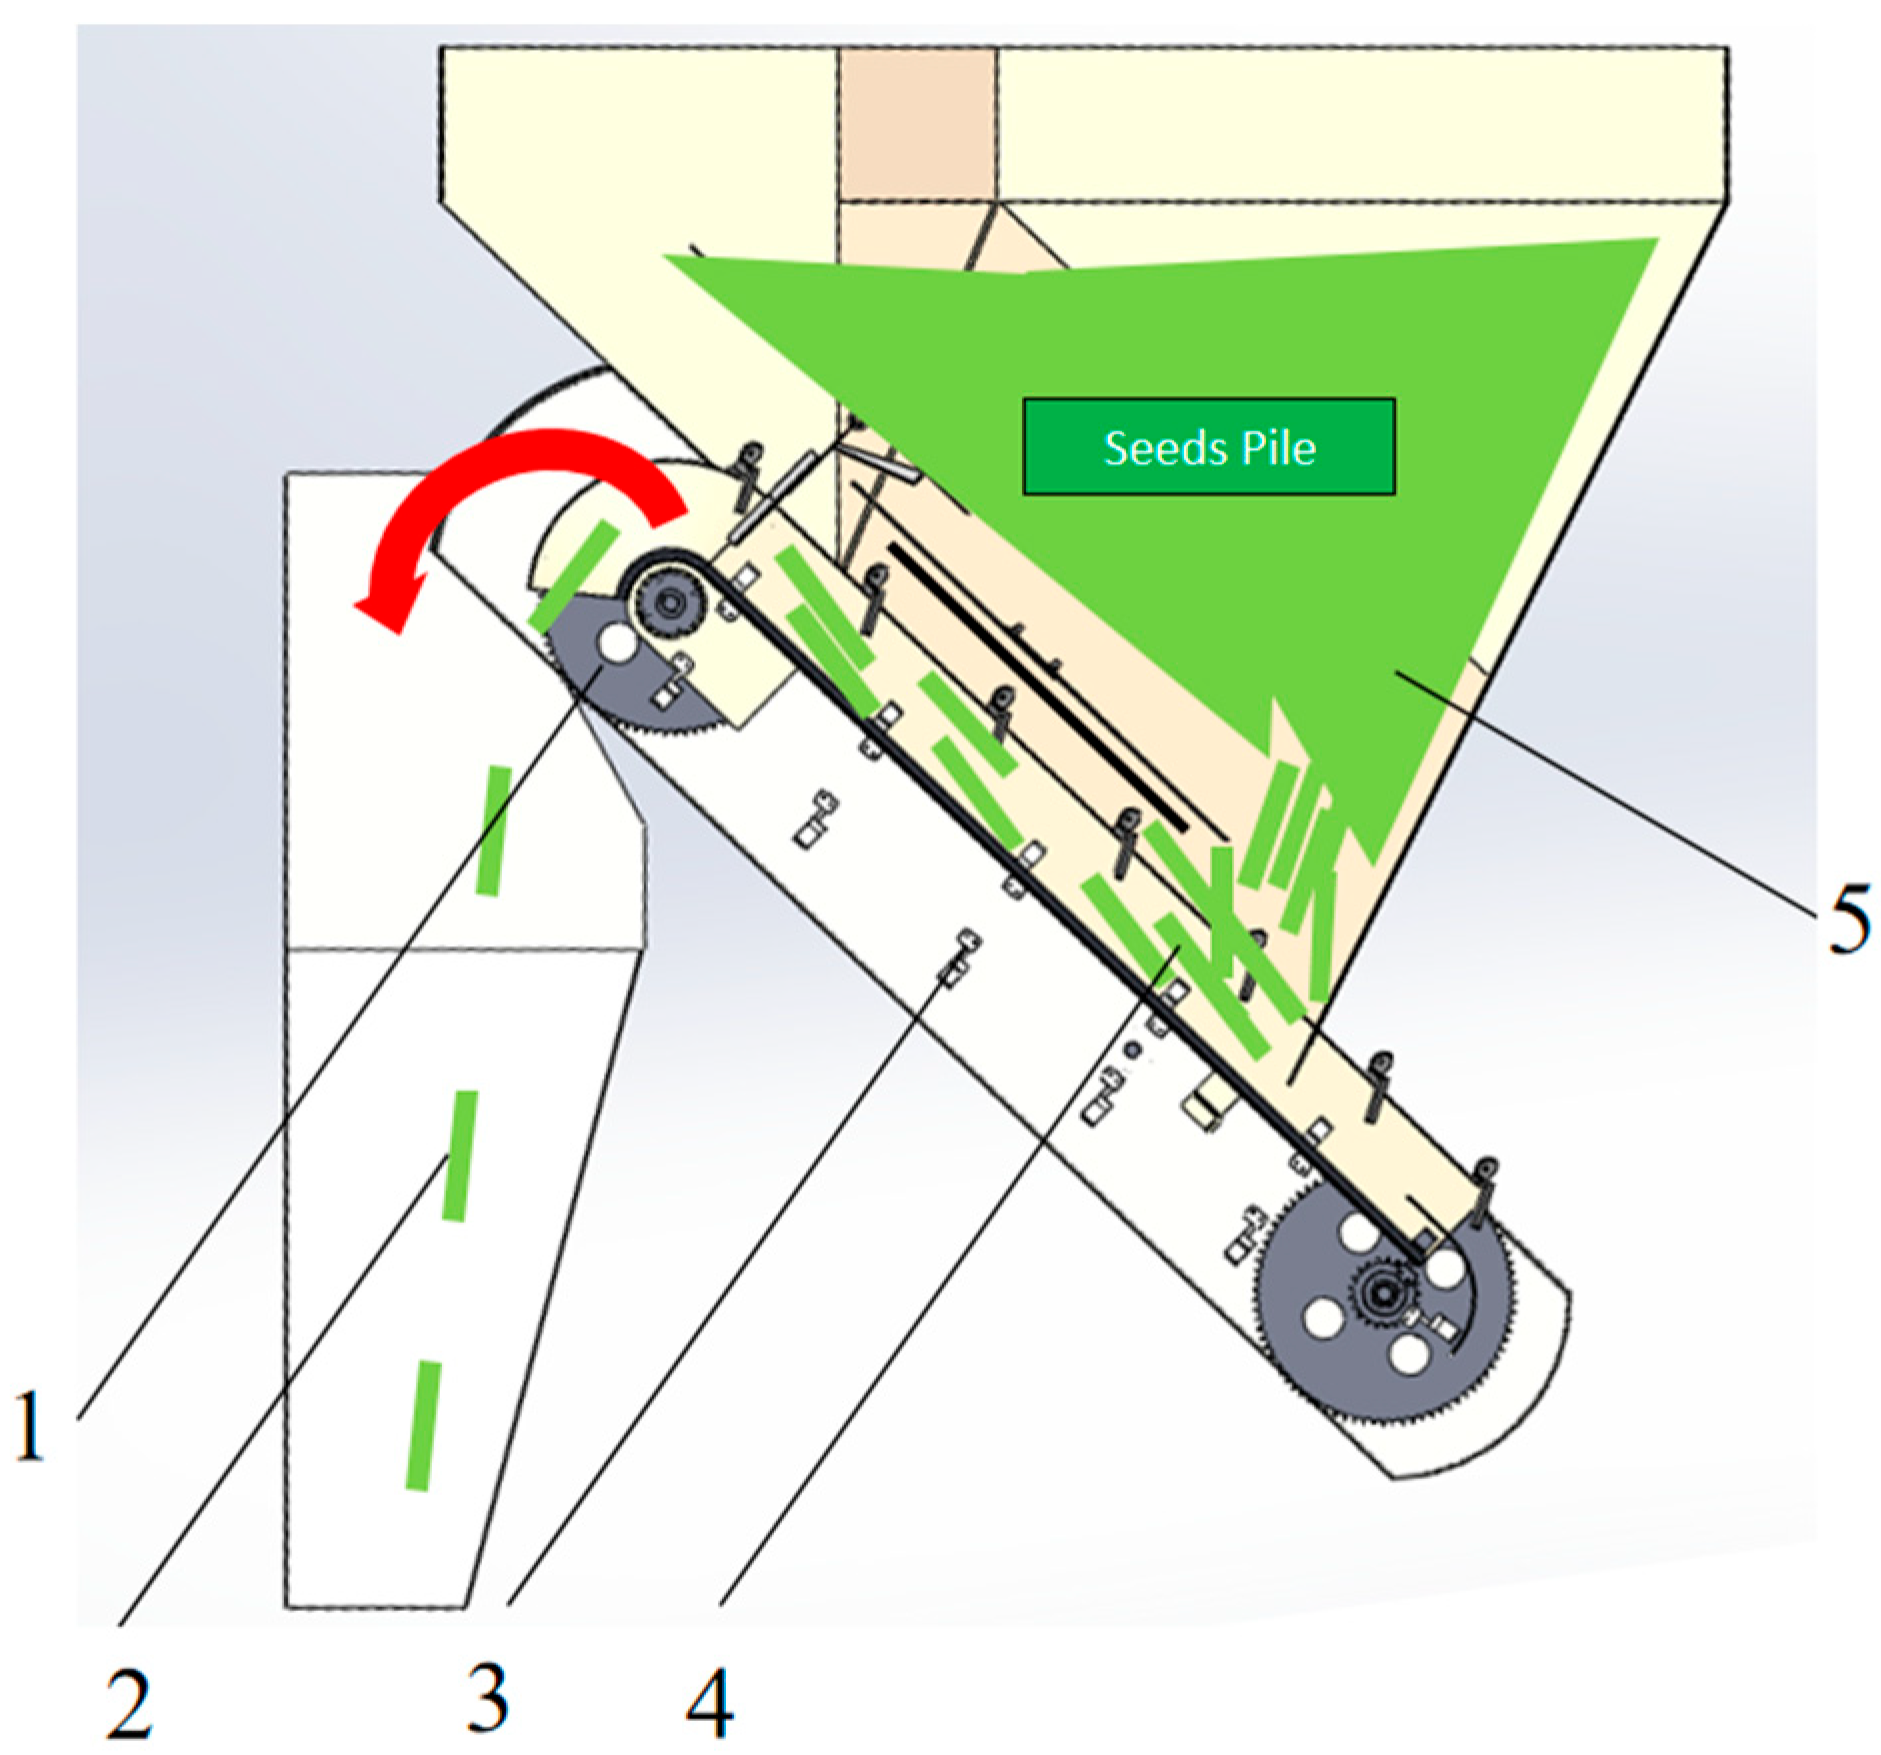
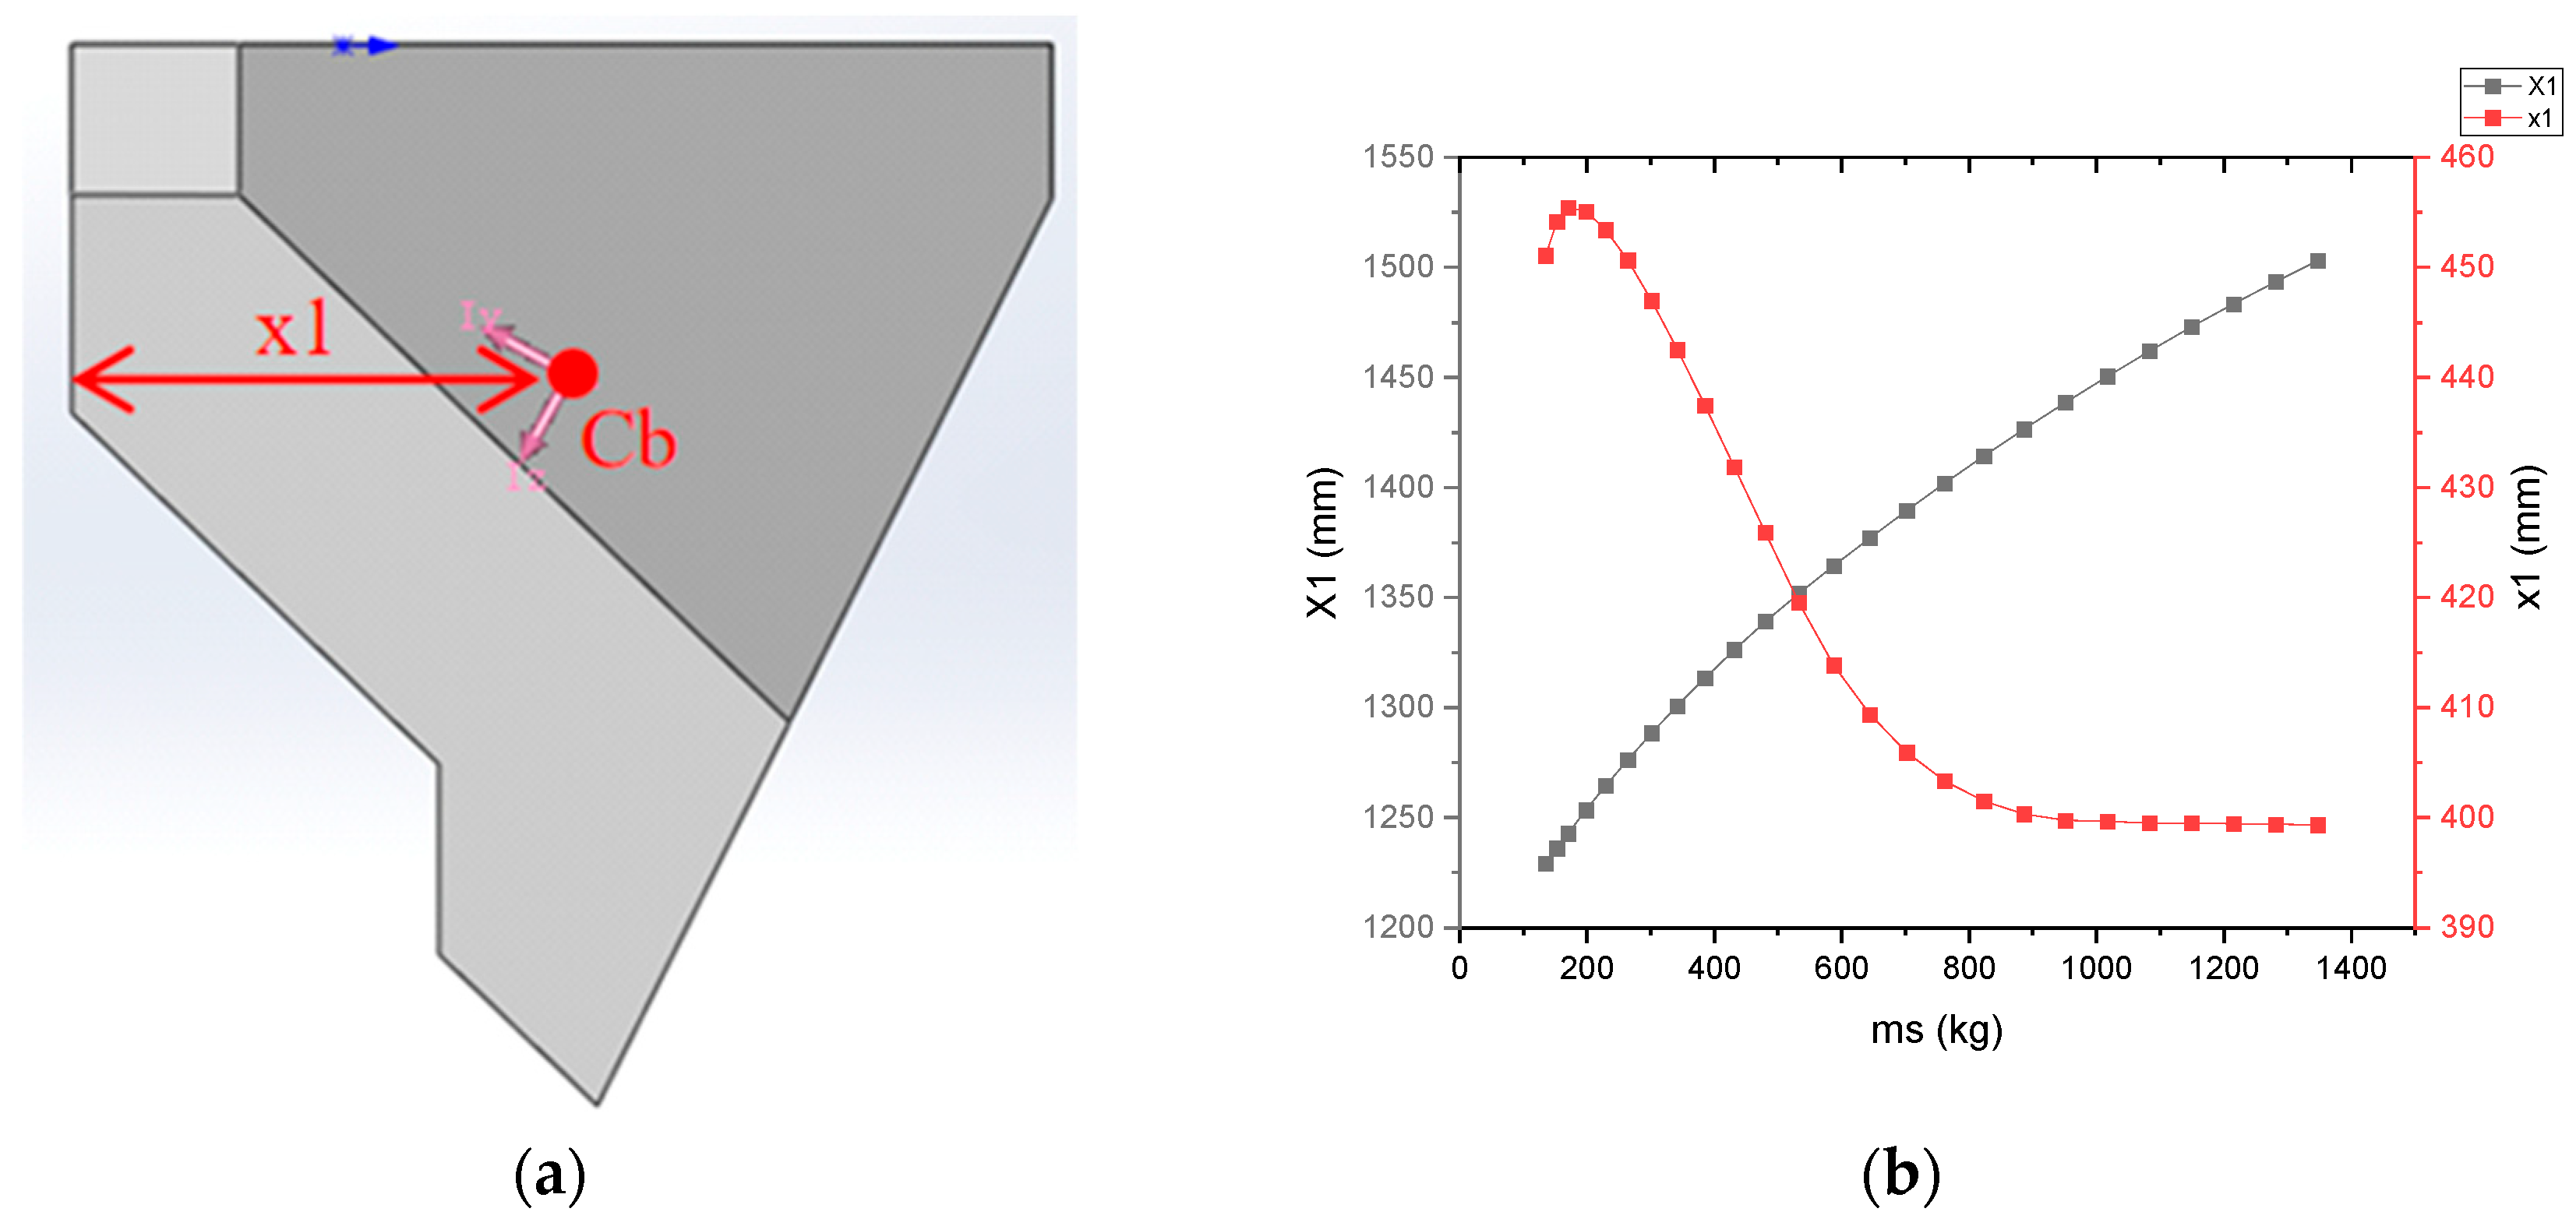
Then, using the software Solidworks (v2016), the material density of the cane seed pile model was set to 415 kg/m
3. By modeling the cane seed pile with different cane seed quantities, the curve showing the change in the centroid position of the cane seed pile with mass was obtained, as shown in
Figure 7a,b. The horizontal distance between the center of the mass and the suspension point was 350 mm, and the distance
between the front end of the bucket and the suspension point was equal to 1566.49 mm. Using the centroid formula Equation (7) of the assembly, the change curve of the position of the planter’s centroid under different cane seed quantities was calculated, as shown in
Figure 7b. When the planter is loaded with different masses of seeds, the formula for calculating its centroid position is given by Equation (7):
where
is the distance from the centroid to the suspension point after the planter is loaded with seeds, m;
is the distance from the centroid to the suspension point when the planter is not loaded, m;
is the distance from the centroid to the front end, m;
is the distance between the front end of the hopper and the suspension point, m;
is the mass of the loaded seeds, kg;
is the self-weight of the unloaded planter, kg.
As the mass of seed pile increased from 200 kg to 800 kg, the distance of the centroid of the seed pile on the
x–axis
decreased rapidly, while
gradually increased. When the mass of seed pile was more than 800 kg,
remained almost constant, while
continued to increase. The variation range of
was within 60 mm, and the variation range of
was within 270 mm. The M1654 tractor has a hydraulic lifting capacity of up to 4000 kg at the 610 mm suspension point [
26]. Therefore, based on the data in
Figure 7b, the safe loading capacity of the planter was calculated as 360 kg. Under the assumptions of ignoring ground wheel support and uniform mass distribution of seeds within the hopper, the John Deere M1604 tractor can safely suspend the planter for field operations when the loading mass of seeds is less than 360 kg.


