Carbon Storage in Coffee Agroforestry Systems: Role of Native and Introduced Shade Trees in the Central Peruvian Amazon

 , , ,
, , , 
Abstract

1. Introduction
2. Materials and Methods
2.1. Study Setup
2.2. Description of Study Area
2.3. Taxonomic Identification of Shade Trees
2.4. Assessment of Stored Carbon
2.5. Carbon Fixation Rate and Carbon Dioxide Equivalent (CO2e)
2.6. Statistical Analysis
3. Results
3.1. Biomass
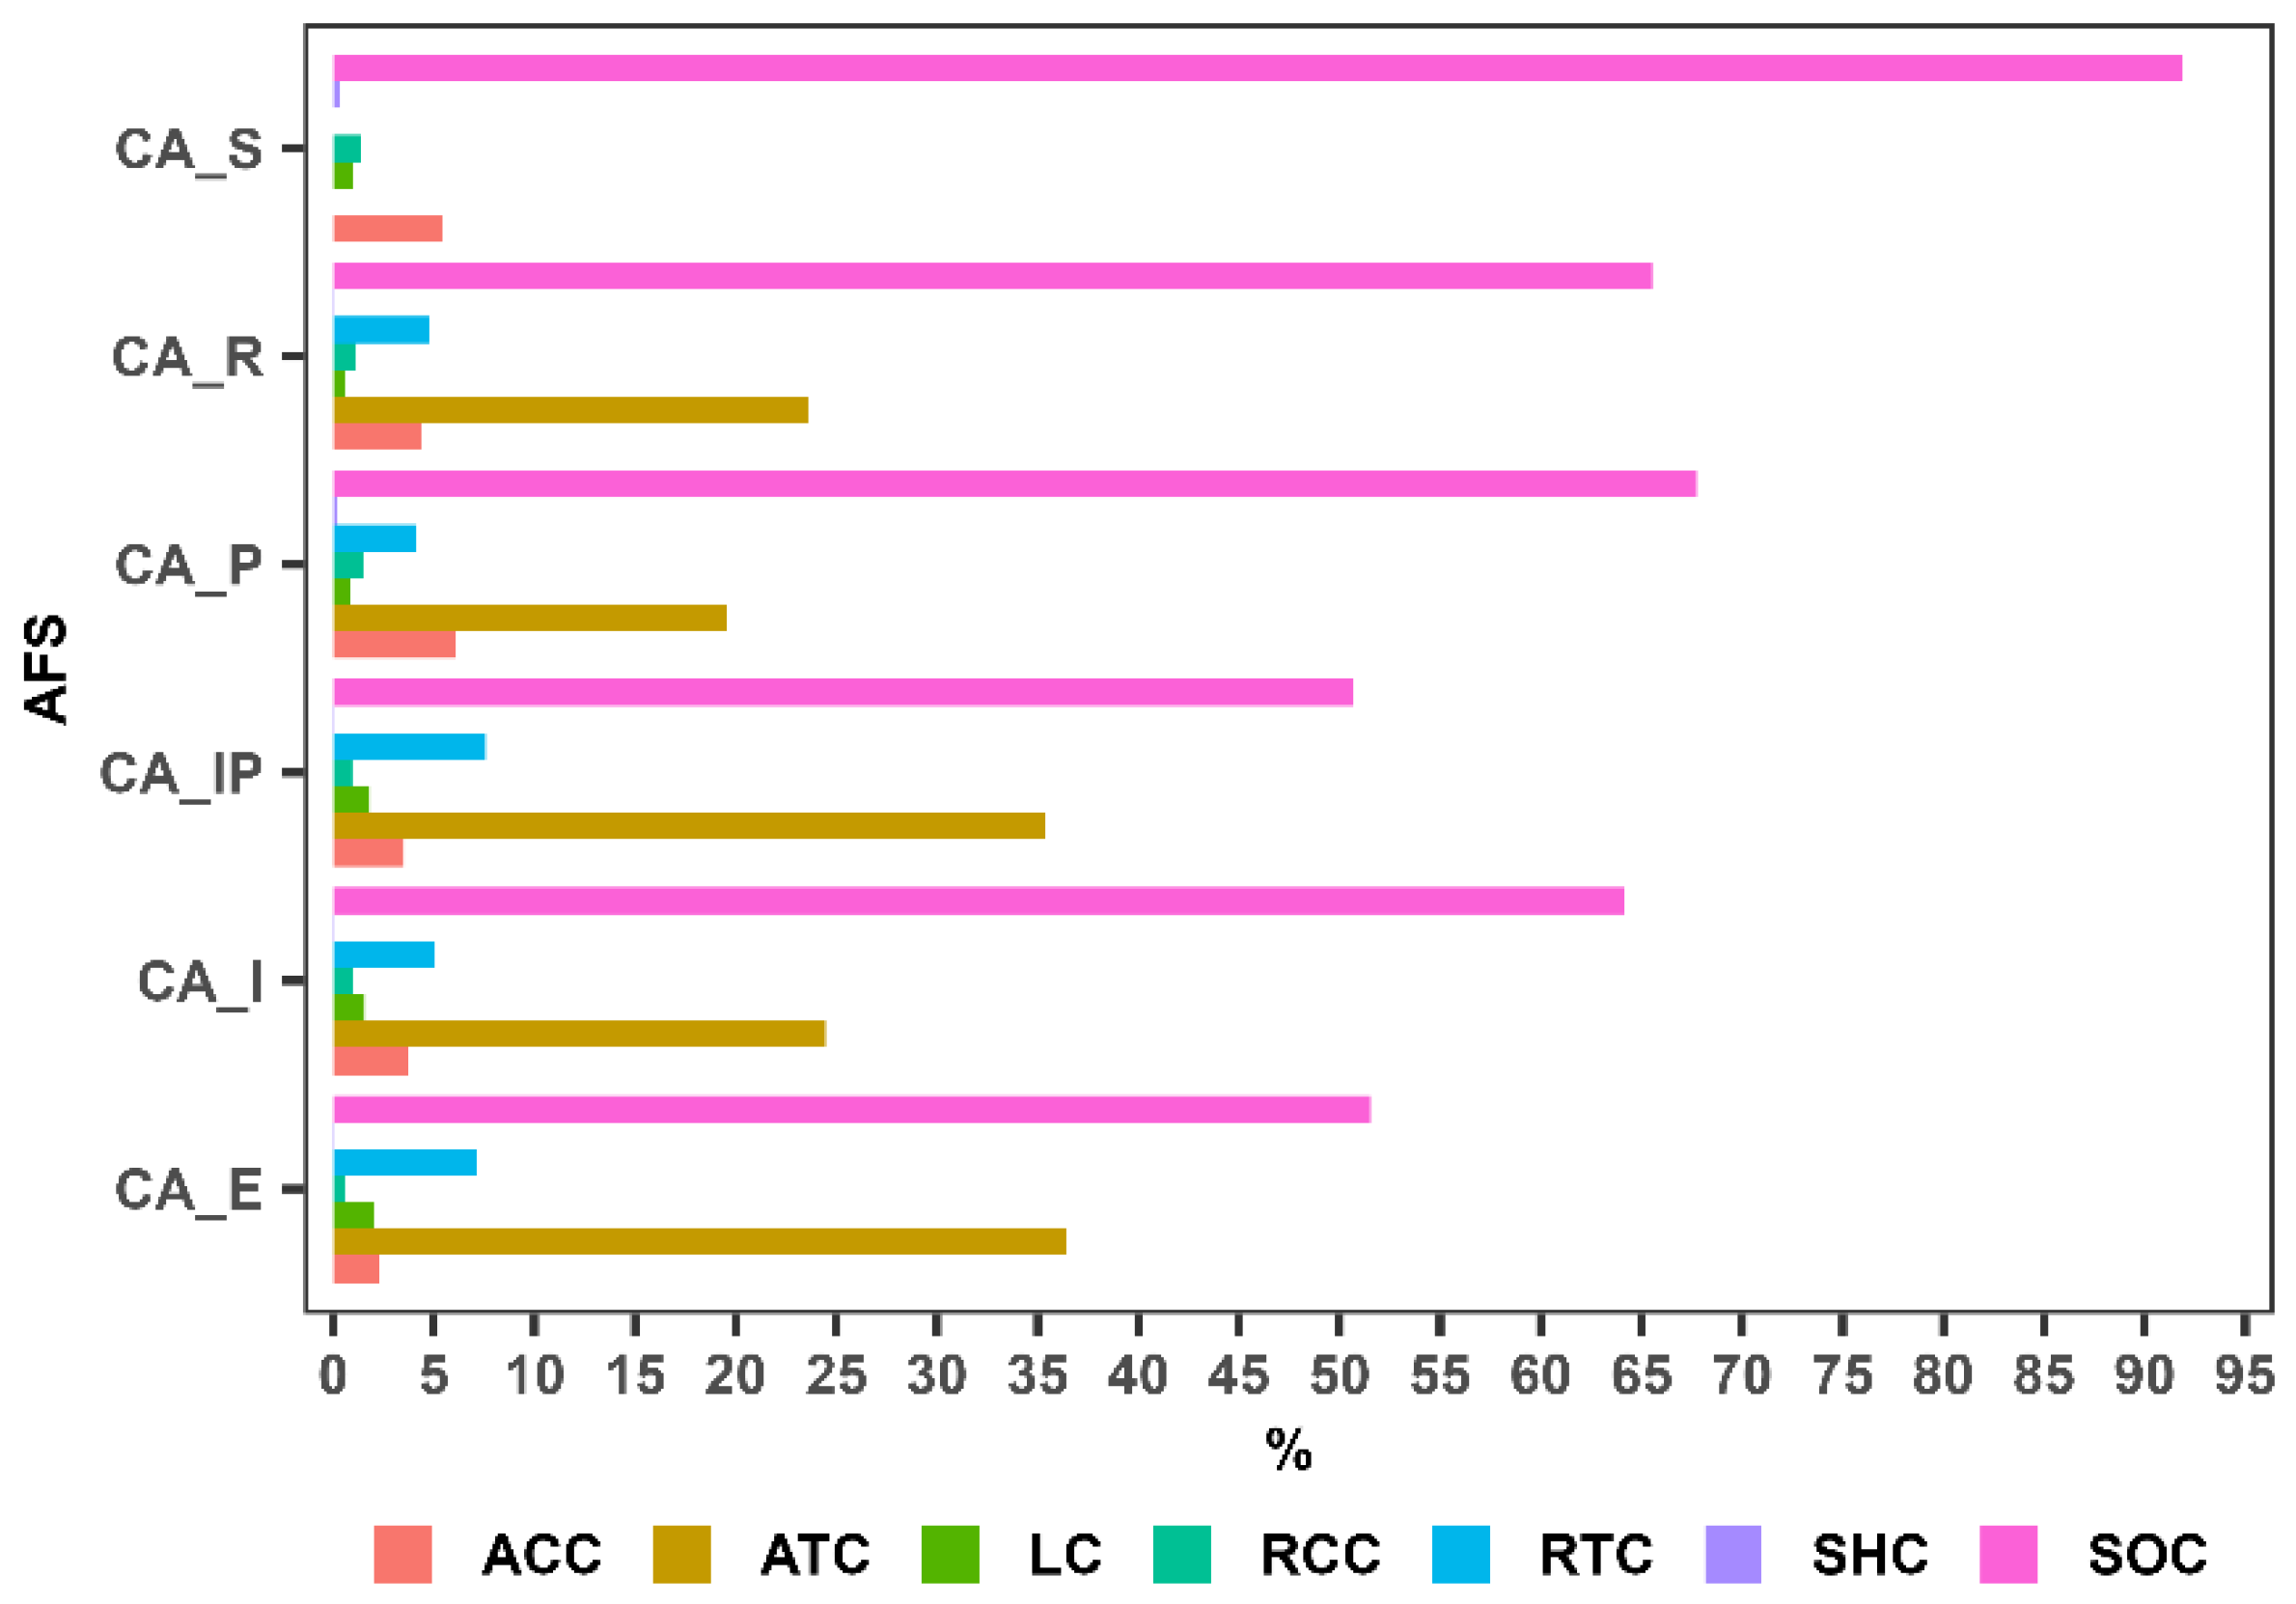
3.2. Carbon
3.3. Carbon Fixation Rate
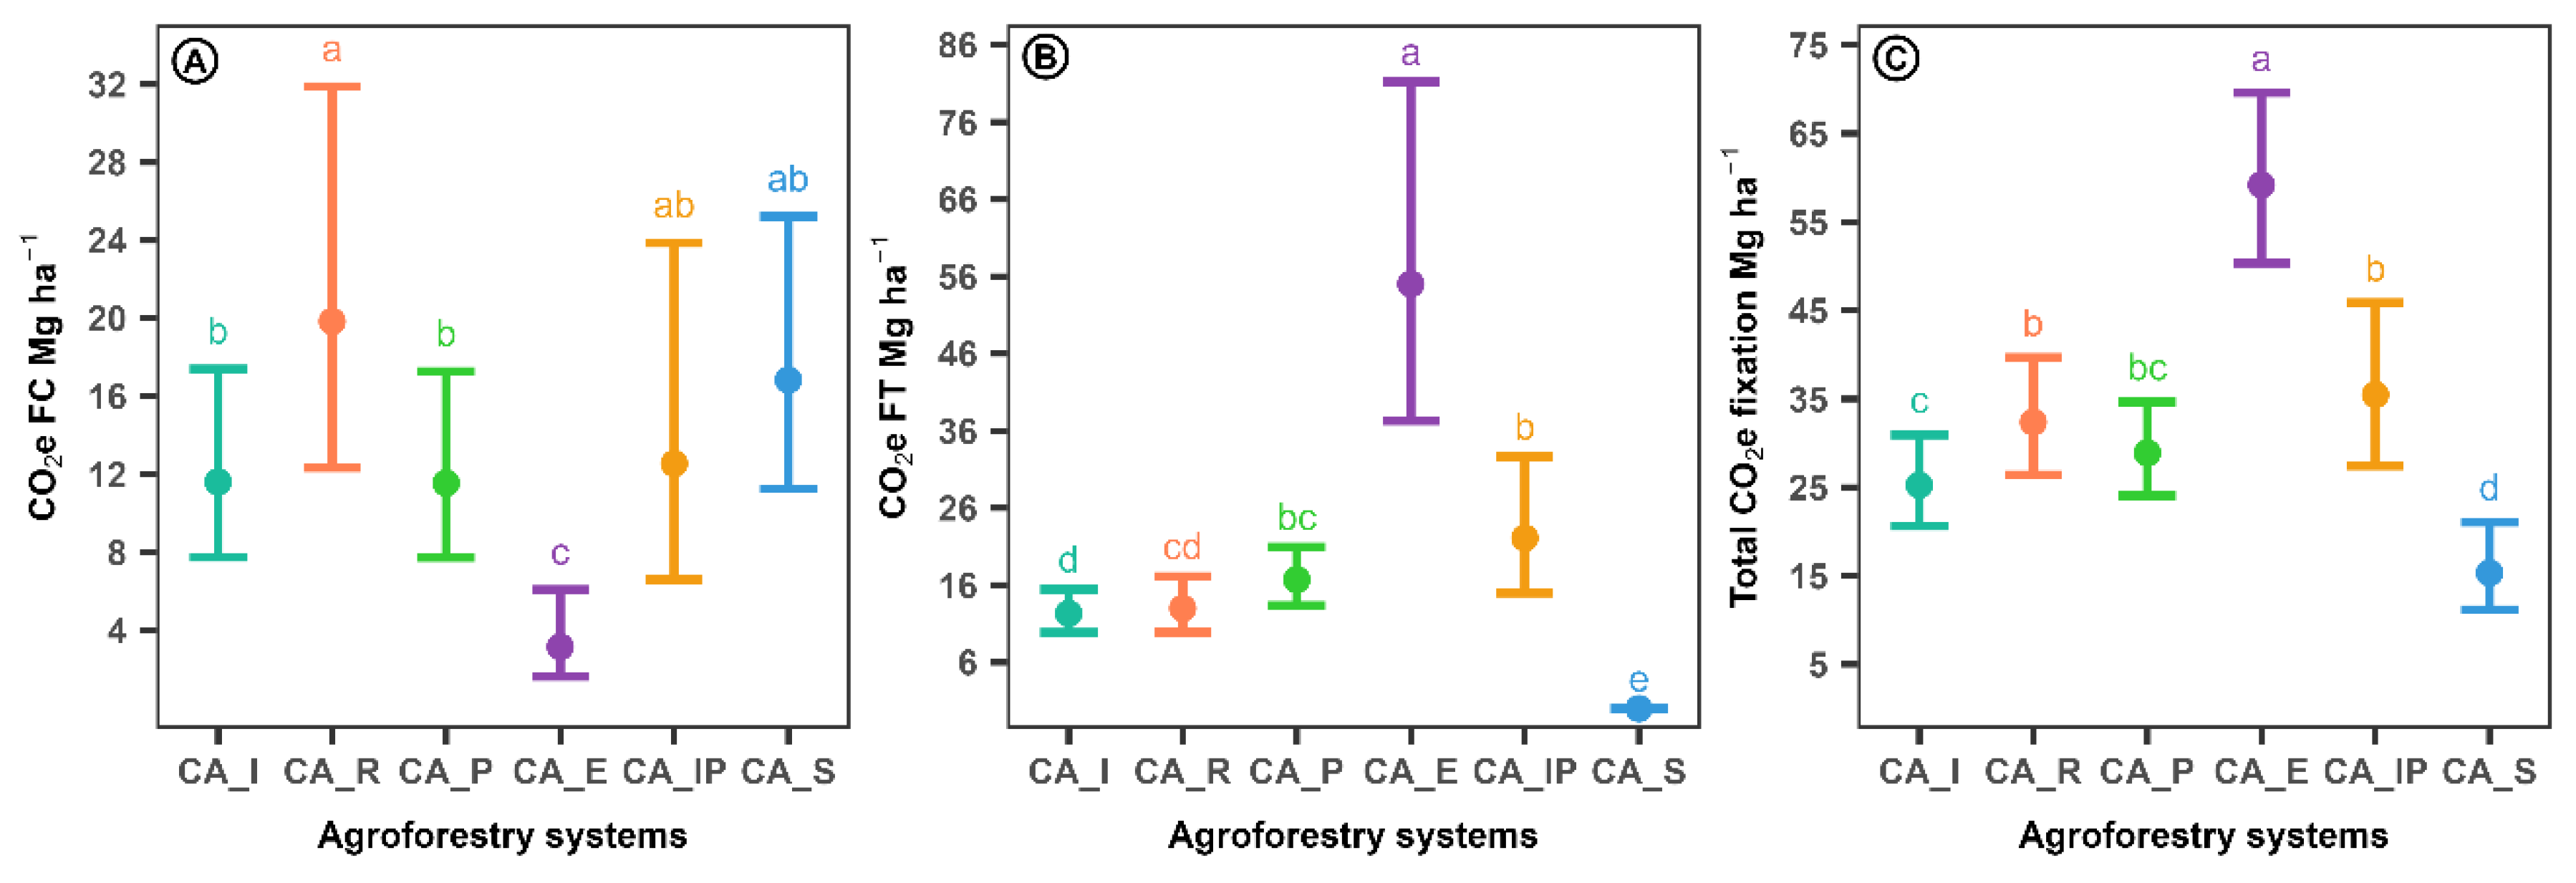
3.4. Carbon Dioxide Equivalent Fixation Rate
3.5. Other Variables
4. Discussion
5. Limitations
6. Conclusions
Supplementary Materials
Author Contributions
Funding
Institutional Review Board Statement
Informed Consent Statement
Data Availability Statement
Acknowledgments
Conflicts of Interest
Abbreviations
| AFS | Agroforestry system |
| CA_I | Coffee and Inga system |
| CA_R | Coffee and R. rospigliossi system |
| CA_E | Coffee and Eucalyptus system |
| CA_P | Coffee and Pinus system |
| CA_IP | Coffee and Inga + Pinus system |
| CA_S | Coffea arabica L. shadeless |
| ACB | Aboveground biomass of coffee |
| RCB | Root biomass of coffee |
| ATB | Aboveground biomass of shade trees |
| RTB | Root biomass of shade trees |
| HSB | Herbaceous and shrub biomass |
| LB | Litter biomass |
| ACC | Carbon in the aboveground biomass of coffee |
| RCC | Carbon in the root biomass of coffee |
| ATC | Carbon in the aboveground biomass of shade trees |
| RTC | Carbon in the root biomass of shade trees |
| SHC | Carbon in the shrub and herbaceous biomass |
| LC | Carbon in the litter biomass |
| SOC | Soil organic carbon |
| CFC | Carbon fixation rate of coffee |
| CFT | Carbon fixation rate of shade trees |
| CO2e FC | CO2e fixation rate of coffee |
| CO2e FT | CO2e fixation rate of shade trees |
| %C | %carbon |
| %OM | %organic matter |
References
- USDA. Coffee: World Markets and Trade. 2023. Available online: https://downloads.usda.library.cornell.edu/usda-esmis/files/m900nt40f/73667k581/qz20v7955/coffee.pdf (accessed on 28 March 2025).
- MIDAGRI. Observatorion de COOMDITIES. 2024. Available online: https://cdn.www.gob.pe/uploads/document/file/6461268/5316298-commodities-cafe-n-01-2024.pdf?v=1718054404 (accessed on 28 March 2025).
- SEIA Padrón de Productores Agrarios, Actualizado al mes de Julio del 2024. Available online: https://observatorio-ppa.midagri.gob.pe/ (accessed on 13 January 2025).
- Jezeer, R.; Verweij, P. Café en sistemas Agroforestales- Doble Dividendo para la Biodiversidad y los Pequeños Agricultores en Perú. Available online: https://www.researchgate.net/publication/301694184_Cafe_en_sistemas_Agroforestales-_Doble_dividendo_para_la_biodiversidad_y_los_pequenos_agricultores_en_Peru (accessed on 28 March 2025).
- MIDAGRI. Observatorio de COMMODITIES. 2023. Available online: https://cdn.www.gob.pe/uploads/document/file/5524126/4327863-commodities-cafe-abr-jun-2023.pdf?v=1701812688 (accessed on 28 March 2025).
- Díaz, C.V.; Carmen, M.W. Línea de Base del Sector Café en el Perú. Available online: https://www.undp.org/es/latin-america/publicaciones/linea-de-base-del-sector-cafe-en-el-peru (accessed on 13 January 2025).
- FAO. FRA 2020 Remote Sensing Survey; FAO: Rome, Italy, 2022; ISBN 978-92-5-136147-4. Available online: http://www.fao.org/documents/card/en/c/cb9970en (accessed on 28 March 2025).
- Geoboques Bosque y Pérdida de Bosque. Ministerio del Ambiente—Perú. Available online: https://geobosques.minam.gob.pe/geobosque/view/perdida.php (accessed on 28 March 2025).
- Burgess, A.J.; Correa Cano, M.E.; Parkes, B. The deployment of intercropping and agroforestry as adaptation to climate change. Crop Environ. 2022, 1, 145–160. Available online: https://linkinghub.elsevier.com/retrieve/pii/S2773126X22000223 (accessed on 7 January 2025). [CrossRef]
- Chirinos, R.A.G. En este Artículo se Presenta Información Sobre la Emisión de Dióxido de Carbono (CO2) del Perú y las Acciones que se Pueden Tomar Para Mitigar sus Efectos en el Medio Ambiente y el Planeta. 2021. Volume 5. Available online: https://www.bcrp.gob.pe/docs/Publicaciones/Revista-Moneda/moneda-188/moneda-188-12.pdf (accessed on 7 January 2025).
- Ahmed, S.; Brinkley, S.; Smith, E.; Sela, A.; Theisen, M.; Thibodeau, C.; Warne, T.; Anderson, E.; Van Dusen, N.; Giuliano, P.; et al. Climate Change and Coffee Quality: Systematic Review on the Effects of Environmental and Management Variation on Secondary Metabolites and Sensory Attributes of Coffea arabica and Coffea canephora. Front. Plant Sci. 2021, 12, 708013. Available online: https://www.frontiersin.org/journals/plant-science/articles/10.3389/fpls.2021.708013/full (accessed on 28 April 2025). [CrossRef]
- Gomes, L.C.; Bianchi, F.J.J.A.; Cardoso, I.M.; Fernandes, R.B.A.; Filho, F.E.I.; Schulte, R.P.O. Agroforestry systems can mitigate the impacts of climate change on coffee production: A spatially explicit assessment in Brazil. Agric. Ecosyst. Environ. 2020, 294, 106858. Available online: https://research.wur.nl/en/publications/agroforestry-systems-can-mitigate-the-impacts-of-climate-change-o (accessed on 15 January 2025). [CrossRef]
- Boehm, R.; Kitchel, H.; Ahmed, S.; Hall, A.; Orians, C.M.; Stepp, J.R.; Robbat, J.; Griffin, T.S.; Cash, S.B. Is Agricultural Emissions Mitigation on the Menu for Tea Drinkers? Sustainability 2019, 11, 4883. [Google Scholar] [CrossRef]
- Tinoco-Jaramillo, L.; Vargas-Tierras, Y.; Habibi, N.; Caicedo, C.; Chanaluisa, A.; Paredes-Arcos, F.; Viera, W.; Almeida, M.; Vásquez-Castillo, W. Agroforestry Systems of Cocoa (Theobroma cacao L.) in the Ecuadorian Amazon. Forests 2024, 15, 195. [Google Scholar] [CrossRef]
- Murga-Orrillo, H.; Lobo, F.D.A.; Santos Silva Amorim, R.; Fernandes Silva Dionisio, L.; Nuñez Bustamante, E.; Chu-Koo, F.W.; López, L.A.A.; Arévalo-Hernández, C.O.; Abanto-Rodriguez, C. Increased Production of Tara (Caesalpinia spinosa) by Edaphoclimatic Variation in the Altitudinal Gradient of the Peruvian Andes. Agronomy 2023, 13, 646. [Google Scholar] [CrossRef]
- Montagnini, F.; Nair, P.K.R. Carbon sequestration: An underexploited environmental benefit of agroforestry systems. Agrofor. Syst. 2004, 61, 281–295. [Google Scholar] [CrossRef]
- López-Hernández, J.C.; Aryal, D.R.; Villanueva-López, G.; Pinto-Ruiz, R.; Reyes-Sosa, M.B.; Hernández-López, A.; Casanova-Lugo, F.; Venegas-Venegas, J.A.; Medina-Jonapa, F.J.; Guevara-Hernández, F.; et al. Carbon storage and sequestration rates in Leucaena leucocephala-based silvopasture in Southern Mexico. Agrofor. Syst. 2024, 98, 1105–1121. [Google Scholar] [CrossRef]
- Villa, P.M.; Martins, S.V.; de Oliveira Neto, S.N.; Rodrigues, A.C.; Hernández, E.P.; Kim, D.-G. Policy forum: Shifting cultivation and agroforestry in the Amazon: Premises for REDD+. For. Policy Econ. 2020, 118, 102217. Available online: https://www.sciencedirect.com/science/article/pii/S1389934119305441 (accessed on 13 January 2025). [CrossRef]
- Shibu, J. Agroforestry for ecosystem services and environmental benefits: An overview. Agrofor. Syst. 2009, 76, 1–10. Available online: http://link.springer.com/10.1007/s10457-009-9229-7 (accessed on 13 January 2025). [CrossRef]
- Villarreyna, R.; Avelino, J.; Cerda, R. Adaptación basada en ecosistemas: Efecto de los árboles de sombra sobre servicios ecosistémicos en cafetales1. Agron. Mesoam. 2020, 31, 499–516. Available online: http://www.scielo.sa.cr/scielo.php?script=sci_abstract&pid=S1659-13212020000200499&lng=en&nrm=iso&tlng=es (accessed on 9 January 2025). [CrossRef]
- Ehrenbergerová, L.; Cienciala, E.; Kučera, A.; Guy, L.; Habrová, H. Carbon stock in agroforestry coffee plantations with different shade trees in Villa Rica, Peru. Agrofor. Syst. 2016, 90, 433–445. [Google Scholar] [CrossRef]
- Rezende, M.Q.; Venzon, M.; dos Santos, P.S.; Cardoso, I.M.; Janssen, A. Extrafloral nectary-bearing leguminous trees enhance pest control and increase fruit weight in associated coffee plants. Agric. Ecosyst. Environ. 2021, 319, 107538. Available online: https://www.sciencedirect.com/science/article/pii/S0167880921002425 (accessed on 28 March 2025). [CrossRef]
- Leblanc, H. Dinitrogen-fixation by three neotropical agroforestry tree species under semi-controlled field conditions. Plant Soil 2007, 291, 199–209. Available online: https://www.academia.edu/29714381/Dinitrogen_fixation_by_three_neotropical_agroforestry_tree_species_under_semi_controlled_field_conditions (accessed on 28 March 2025). [CrossRef]
- Rapidel, B.; Allinne, C.; Cerdan, C.; Meylan, L.; de Melo, V.F.E.; Avelino, J.; Sistemas Agroforestales. Funciones Productivas, Socioeconómicas y Ambientales. CATIE. Efectos Ecológicos y Productivos del Asocio de Árboles de Sombra con Café en Sistemas Agroforestales. 2015. Available online: https://agritrop.cirad.fr/575470/ (accessed on 28 March 2025).
- More, P.; Cuellar, J.; Salazar, E. Propagación vegetativa de Retrophyllum rospigliosii (Pilg.) C.N. Page “ulcumano” en cámara de subirrigación en Chanchamayo/Perú. Ecol. Apl. 2021, 20, 15–23. Available online: https://revistas.lamolina.edu.pe/index.php/eau/article/view/1687 (accessed on 28 March 2025). [CrossRef]
- Marín Vélez, A.; Vásquez Velásquez, G.; Monsalve, M.; Orozco, F.; Carbonell, J.A.; Villegas, C.; Ramírez Ospina, J.; Romero, J.L. Ecología y Silvicultura de las Podocarpáceas Andinas de Colombia. Cali: Smurfit Cartón de Colombia. 1998. Available online: https://catalogo.jbb.gov.co/cgi-bin/koha/opac-detail.pl?biblionumber=2808 (accessed on 5 June 2025).
- Ruiz-Erazo, C.E.; Riascos-Acosta, R.I.; Guerrero-Martínez, E.S.; Marín-Vélez, A.M.; Sierra, C.A.; Ramírez-Correa, J.A. Potencial de captura de carbono en plantaciones de Retrophyllum rospigliosii (Pilg.) C. N. Page con fines de restauración en la región Andina colombiana. Rev. Chapingo Ser. Cienc. For. Ambiente 2025, 31, e24009. Available online: https://revistas.chapingo.mx/forestales/article/view/1327 (accessed on 5 June 2025). [CrossRef]
- Gardner, M.; Thomas, P. IUCN Red List of Threatened Species: Retrophyllum rospigliosii. IUCN Red List Threat Species. 2013. Available online: https://www.iucnredlist.org/en (accessed on 5 June 2025).
- Baselly-Villanueva, J.R.; Goycochea-Casas, G.; Carvalho, A.M.M.L.; Roncal-Briones, W.R.; Chumbimune-Vivanco, S.Y.; Chavesta-Custodio, M. CARACTERIZACIÓN Y DIFERENCIAS ANATÓMICAS DE MADERAS DE Retrophyllum rospigliosii (Pilg.) C.N. Page Y Prumnopitys harmsiana (Pilg.) de Laub. (PODOCARPACEAE) PROCEDENTES DE LA PROVINCIA DE SAN IGNACIO, PERÚ. Folia Amaz. 2021, 30, 137–148. Available online: https://revistas.iiap.gob.pe/index.php/foliaamazonica/article/view/587 (accessed on 5 June 2025). [CrossRef]
- Camarena-Yupanqui, R.C.; Orellana-Mendoza, E.; Bernaola-Paucar, R.M.; Ames-Martínez, F.N.; Loardo-Tovar, H.; Quispe-Melgar, H.R. Seedling Production of Retrophyllum rospigliosii in Nurseries and Potential Reforestation Areas Using Modeling Techniques. Forests 2024, 15, 2179. [Google Scholar] [CrossRef]
- Loewe-Muñoz, V.; del Río, R.; Delard, C.; Balzarini, M. Short-term stem diameter variations in irrigated and non-irrigated stone pine (Pinus pinea L.) trees in a xeric non-native environment. Ann. For. Sci. 2021, 78, 99. Available online: https://annforsci.biomedcentral.com/articles/10.1007/s13595-021-01114-8 (accessed on 28 March 2025). [CrossRef]
- Sülüsoglu, M. The Management of Villagers Owned Stone Pine (Pinus pinea L.) Plantations In Kozak Region, Turkey: A Case Study. Available online: https://www.fao.org/4/j4821e/j4821e00.htm (accessed on 28 March 2025).
- Gomes, V.M.; Miranda Júnior, M.S.; Silva, L.J.; Teixeira, M.V.; Teixeira, G.; Schossler, K.; Freitas, D.A.; Oliveira, D.M. A Global Meta-Analysis of Soil Carbon Stock in Agroforestry Coffee Cultivation. Agronomy 2025, 15, 480. [Google Scholar] [CrossRef]
- Pan, J.; Chen, S.; He, D.; Zhou, H.; Ning, K.; Ma, N.; Li, K.; Liao, D.; Mi, W.; Wu, Q.; et al. Agroforestry increases soil carbon sequestration, especially in arid areas: A global meta-analysis. Catena 2025, 249, 108667. Available online: https://www.sciencedirect.com/science/article/pii/S0341816224008646 (accessed on 5 June 2025). [CrossRef]
- Zomer, R.J.; Bossio, D.A.; Trabucco, A.; van Noordwijk, M.; Xu, J.; Zomer, R.J.; Bossio, D.A.; Trabucco, A.; van Noordwijk, M.; Xu, J. Global carbon sequestration potential of agroforestry and increased tree cover on agricultural land. Circ. Agric. Syst. 2022, 2, 1–10. Available online: https://www.maxapress.com/article/doi/10.48130/CAS-2022-0003 (accessed on 5 June 2025). [CrossRef]
- Nguyen, M.P.; Vaast, P.; Pagella, T.; Sinclair, F. Local Knowledge about Ecosystem Services Provided by Trees in Coffee Agroforestry Practices in Northwest Vietnam. Land 2020, 9, 486. [Google Scholar] [CrossRef]
- Flores-Ortiz, C.M.; Davila, P.; Rodríguez-Arevalo, I.; Manson, R.H.; Toledo-Garibaldi, M.; Cabrera-Santos, D.; Salguero, M.A.; Vázquez, F.G.; Cobos-Silva, J.; Gianella, M.; et al. Prioritisation of native trees for enhancing carbon sequestration in shade-grown coffee plantations in the State of Veracruz (México): Linking conservation and ecological traits to community needs. Agrofor. Syst. 2025, 99, 55. [Google Scholar] [CrossRef]
- Rügnitz, M.T.; Chacón León, M.; Porro, R. Guía Para la Determinación de Carbono en Pequeñas Propiedades Rurales; Manual Técnico; ICRAF: Lima, Peru, 2009; ISBN 978-92-9059-254-9. [Google Scholar]
- Jurado, M.A.J.R.; Jurado, H.R.O.; Burbano, T.C.L. Evaluación de la captura de carbono en sistemas productivos de café (Coffea arabica L.), Consacá, Nariño, Colombia. Luna Azul 2020, 51, 166–181. Available online: https://revistasojs.ucaldas.edu.co/index.php/lunazul/article/view/5342 (accessed on 14 January 2025). [CrossRef]
- Instituto Nacional de Recursos Naturales Inrena. Mapa Ecológico del Perú: Guía Explicativa; INRENA: Lima, Peru, 1995. Available online: https://app.ingemmet.gob.pe/biblioteca/pdf/Lib-215.pdf (accessed on 14 January 2025).
- SENAMHI. Datos Hidrometeorológicos a Nivel Nacional. Available online: https://www.senamhi.gob.pe/?p=estaciones (accessed on 14 January 2025).
- Angiosperm Phylogeny Group; Chase, M.W.; Fay, M.F.; Byng, J.W.; Judd, W.S.; Soltis, D.E.; Mabberley, D.J.; Sennikov, A.N.; Soltis, P.S.; Stevens, P.F. An update of the Angiosperm Phylogeny Group classification for the orders and families of flowering plants: APG IV. Bot. J. Linn. Soc. 2016, 181, 1–20. [Google Scholar] [CrossRef]
- Christenhusz, M.J.M.; Reveal, J.L.; Farjon, A.; Gardner, M.F.; Mill, R.R.; Chase, M.W. A new classification and linear sequence of extant gymnosperms. Phytotaxa 2011, 19, 55–70. Available online: https://www.biotaxa.org/Phytotaxa/article/view/phytotaxa.19.1.3 (accessed on 14 January 2025). [CrossRef]
- Yang, Y.; Ferguson, D.K.; Liu, B.; Mao, K.-S.; Gao, L.-M.; Zhang, S.-Z.; Wan, T.; Rushforth, K.; Zhang, Z.-X. Recent advances on phylogenomics of gymnosperms and a new classification. Plant Divers. 2022, 44, 340–350. Available online: https://www.sciencedirect.com/science/article/pii/S2468265922000440 (accessed on 14 January 2025). [CrossRef]
- Zavala, W.; Merino, E.; Peláez, P. Influencia de tres sistemas agroforestales del cultivo de cacao en la captura y almacenamiento de carbono. Sci. Agropecu. 2018, 9, 493–501. Available online: http://www.scielo.org.pe/scielo.php?script=sci_abstract&pid=S2077-99172018000400004&lng=es&nrm=iso&tlng=es (accessed on 14 January 2025). [CrossRef]
- Cuellar, J.E.B.; Salazar, E.J.H. Dinámica del Carbono Almacenado en los Diferentes Sistemas de uso de la Tierra del Perú, Base para una Estrategia de Mitigación ante el Cambio Climático. 2016. Available online: https://repositorio.inia.gob.pe/handle/20.500.12955/363 (accessed on 14 January 2025).
- IPCC Directrices del IPCC de 2006 para los Inventarios Nacionales de Gases de Efecto Invernadero Volumen 4 Agricultura, Silvicultura y otros Usos de la Tierra. Available online: https://www.ipcc-nggip.iges.or.jp/public/2006gl/spanish/vol4.html (accessed on 14 January 2025).
- Arevalo, L.A.; Alegre, J.C.; Montoya Vilcahuaman, L.J. Metodologia Para Estimar o Estoque de Carbono em Diferentes Sistemas de uso da Terra. 2002. Available online: http://www.infoteca.cnptia.embrapa.br/handle/doc/308054 (accessed on 15 January 2025).
- Razo Zárate, R.; Gordillo Martínez, A.J.; Rodríguez Laguna, R.; Maycotte Morales, C.C.; Acevedo Sandoval, O.A. Coeficientes de carbono para arbustos y herbáceas del bosque de oyamel del Parque Nacional El Chico. Rev. Mex. Cienc. For. 2018, 6, 58–67. Available online: https://cienciasforestales.inifap.gob.mx/index.php/forestales/article/view/195 (accessed on 28 March 2025). [CrossRef]
- Quilio, A.; Castellanos, E.; Pons, D. Estudio de Línea Base de Carbono en Cafetales; Universidad del Valle de Guatemala: Guatemala, 2010; Volume 46. [Google Scholar]
- Marroquín, P.M.; Pérez, J.J.; Yamallel, J.I.Y.; García, R.S. Almacenamiento de carbono en Coffea arabica L. en la Sierra Madre de Chiapas. Rev. Mex. Cienc. Agríc. 2024, 15, e3315. Available online: https://cienciasagricolas.inifap.gob.mx/index.php/agricolas/article/view/3315 (accessed on 14 January 2025). [CrossRef]
- van Noordwijk, M.; Rahayu, S.; Hairiah, K.; Wulan, Y.C.; Farida, A.; Verbist, B. Carbon stock assessment for a forest-to-coffee conversion landscape in Sumber-Jaya (Lampung, Indonesia): From allometric equations to land use change analysis. Sci. China Ser. C-Life Sci. 2002, 45, 75–86. Available online: https://www.semanticscholar.org/paper/Carbon-stock-assessment-for-a-forest-to-coffee-in-Noordwijk-Rahayu/d167089d33268097a56adad7775ab28350c5012e (accessed on 16 January 2025).
- MIDAGRI Requerimientos Agroclimáticos del Cultivo de Café. 2019. Available online: https://repositorio.midagri.gob.pe/bitstream/20.500.13036/237/1/ficha-tecnica-11-cultivo-cafe%20%281%29.pdf (accessed on 5 June 2025).
- Rodríguez, R.L.; Jiménez-Pérez, J.; Aguirre-Calderón, Ó.A.; Treviño-Garza, E.J.; Razo-Zárate, R. Estimación De Carbono Almacenado En El Bosque De Pino-Encino En La Reserva De La Biosfera El Cielo, Tamaulipas, México. 2009. Available online: https://www.redalyc.org/articulo.oa?id=46111817006 (accessed on 15 January 2025).
- Rojas-García, F.; De Jong, B.H.J.; Martínez-Zurimendí, P.; Paz-Pellat, F. Database of 478 allometric equations to estimate biomass for Mexican trees and forests. Ann. For. Sci. 2015, 72, 835–864. Available online: https://annforsci.biomedcentral.com/articles/10.1007/s13595-015-0456-y (accessed on 15 January 2025). [CrossRef]
- Winck, R.A.; Fassola, H.E.; Barth, S.R.; Crechi, E.H.; Keller, A.E.; Videla, D.; Zaderenko, C. Modelos predictivos de biomasa aérea de eucalyptus grandis para el noreste de Argentina. Ciênc. Florest. 2015, 25, 595–606. Available online: https://periodicos.ufsm.br/cienciaflorestal/article/view/19611 (accessed on 15 January 2025). [CrossRef]
- Callo, D.C.; Krishnamurthy, L.; Alegre, J. Secuestro de carbono por sistemas agroforestales amazónicos. Rev. Chapingo Ser. Cienc. For. Ambiente 2002, 8, 101–106. Available online: https://www.redalyc.org/articulo.oa?id=62980202 (accessed on 15 January 2025).
- Cairns, M.A.; Brown, S.; Helmer, E.H.; Baumgardner, G.A. Root biomass allocation in the world’s upland forests. Oecologia 1997, 111, 1–11. [Google Scholar] [CrossRef]
- Intergovernmental Panel on Climate Change. Guía de Buenas Prácticas Para el uso de la Tierra, el Cambio de uso de la Tierra y la Silvicultura. Inventarios Nacionales de Gases de Efecto Invernadero. Métodos Complementarios y Orientación sobre las Buenas Prácticas Derivados del Protocolo de Kyoto. Available online: https://www.ipcc-nggip.iges.or.jp/public/gpglulucf/gpglulucf_languages.html (accessed on 15 January 2025).
- Van Bemmelen, J.M. Ueber die Bestimmung des Wassers, des Humus, des Schwefels, der in den Colloidalen Sillikaten Gebunden Kieselsäure, des Mangans u.s.w. im Ackerboden. 1879. Available online: https://edepot.wur.nl/211282 (accessed on 15 January 2025).
- Eyherabide, M.; Saínz Rozas, H.; Barbieri, P.; Echeverría, H.E. Comparación de métodos para determinar carbono orgánico en suelo. Cienc. Suelo 2014, 32, 13–19. Available online: https://www.scielo.org.ar/scielo.php?script=sci_abstract&pid=S1850-20672014000100002&lng=es&nrm=iso&tlng=es (accessed on 15 January 2025).
- Rolando, J.L.; Dubeux, J.C.B.; de Souza, T.C.; Mackowiak, C.; Wright, D.; George, S.; Pires, T.; Santos, E. Organic carbon is mostly stored in deep soil and only affected by land use in its superficial layers: A case study. Agrosystems Geosci. Environ. 2021, 4, e20135. Available online: https://onlinelibrary.wiley.com/doi/abs/10.1002/agg2.20135 (accessed on 5 June 2025). [CrossRef]
- Button, E.S.; Pett-Ridge, J.; Murphy, D.V.; Kuzyakov, Y.; Chadwick, D.R.; Jones, D.L. Deep-C storage: Biological, chemical and physical strategies to enhance carbon stocks in agricultural subsoils. Soil Biol. Biochem. 2022, 170, 108697. Available online: https://www.sciencedirect.com/science/article/pii/S0038071722001547 (accessed on 5 June 2025). [CrossRef]
- Yost, J.L.; Hartemink, A.E. How deep is the soil studied—An analysis of four soil science journals. Plant Soil 2020, 452, 5–18. [Google Scholar] [CrossRef]
- Walkley, A.; Black, I.A. An examination of the degtjareff method for determining soil organic matter, and a proposed modification of the chromic acid titration method. Soil Sci. 1934, 37, 29–38. Available online: https://journals.lww.com/soilsci/citation/1934/01000/an_examination_of_the_degtjareff_method_for.3.aspx (accessed on 16 January 2025). [CrossRef]
- Marín, M.D.; Andrade, H.J.; Sandoval, A.P. Fijación de carbono atmosférico en la biomasa total de sistemas de producción de cacao en el departamento del Tolima, Colombia. Rev. UDCA Actual. Divulg. Científica 2016, 19, 351–360. Available online: http://www.scielo.org.co/scielo.php?script=sci_arttext&pid=S0123-42262016000200012 (accessed on 14 January 2025).
- Brooks, M.E.; Bolker, B.M.; Kristensen, K.; Machler, M.; Magnusson, A.; Skaug, H.J.; Nielsen, A.; Berg, C.; van Bentham, H.; Sadat, N.; et al. glmmTMB: Generalized linear mixed models using Template Model Builder. 2025. Available online: https://cran.r-project.org/web/packages/glmmTMB/index.html (accessed on 31 May 2025).
- Bartoń, K. MuMIn: Multi-Model Inference. 2025. p. 1.48.11. Available online: https://cran.r-project.org/web/packages/MuMIn/index.html (accessed on 31 May 2025).
- Hartig, F.; Lohse, L.; de Souza, M. DHARMa: Residual diagnostics for hierarchical (multi-level/mixed) Regression models. 2024. Available online: https://cran.r-project.org/web/packages/DHARMa/index.html (accessed on 31 May 2025).
- Soto-Pinto, L.; Aguirre-Dávila, C.M.; Anzueto-Martínez, M.J. Almacenes de carbono en cafetales con distintos manejos en el Norte de Chiapas, México. Estado ctual del Conocimiento del Ciclo del Carbono y sus Interacciones en México: Síntesis a 2015. Texcoco, Estado de México, México. 2015, pp. 256–263. Available online: https://pmcarbono.org/pmc/simposio/files/Memorias_Res_Cortos-2015.pdf (accessed on 15 January 2025).
- Salas, V.M.; Paz Pellat, F.; Rojas-García, F.; Bolaños-González, M.A. Almacenes de Carbono en Sistemas Agroforestales Cafetaleros de la Sierra Madre de Chiapas. En: Estado Actual del Conocimiento del Ciclo del Carbono y sus Interacciones en México: Síntesis 2018. 2018. Available online: https://www.researchgate.net/publication/330384193_Almacenes_de_carbono_en_sistemas_agroforestales_cafetaleros_de_la_Sierra_Madre_de_Chiapas (accessed on 15 January 2025).
- Valdés-Velarde, E.; Vázquez-Domínguez, L.P.; Tinoco-Rueda, J.Á.; Sánchez-Hernández, H.; Salcedo-Pérez, E.; Lagunes-Fortiz, E. Servicio ecosistémico de carbono almacenado en cafetales bajo sombra en sistema agroforestal. Rev. Mex. De Cienc. Agrícolas 2022, 13, 287–297. [Google Scholar] [CrossRef]
- Vallejos-Torres, G.; Gaona-Jimenez, N.; Pichis-García, R.; Ordoñez, L.; García-Gonzales, P.; Quinteros, A.; Lozano, A.; Saavedra-Ramírez, J.; Tuesta-Hidalgo, J.C.; Reategui, K.; et al. Carbon reserves in coffee agroforestry in the Peruvian Amazon. Front. Plant Sci. 2024, 15, 1410418. Available online: https://www.frontiersin.org/journals/plant-science/articles/10.3389/fpls.2024.1410418/full (accessed on 16 January 2025). [CrossRef]
- Castellanos, E.; Quilo, A.; Mato, R. Metodología Estimación Carbono Bosques Guatemala. Available online: https://studylib.es/doc/7798569/metodología-para-la-estimación-del-contenido-de-carbono-en (accessed on 5 June 2025).
- Lugo-Pérez, J.; Hajian-Forooshani, Z.; Perfecto, I.; Vandermeer, J. The importance of shade trees in promoting carbon storage in the coffee agroforest systems. Agric. Ecosyst. Environ. 2023, 355, 108594. Available online: https://www.sciencedirect.com/science/article/pii/S0167880923002530 (accessed on 16 January 2025). [CrossRef]
- Espinoza-Domínguez, W.; Krishnamurthy, L.; Vázquez-Alarcón, A.; Torres-Rivera, A. Almacén de carbono en sistemas agroforestales con café. Rev. Chapingo Ser. Cienc. For. Ambiente 2012, 18, 57–70. Available online: https://www.redalyc.org/pdf/629/62924537005.pdf (accessed on 15 January 2025). [CrossRef]
- Nelson, K.C.; De Jong, B.H. Making Global Initiatives Local Realities: Carbon Mitigation Projects in Chiapas, Mexico. Available online: https://colab.ws/articles/10.1016%2Fs0959-3780%2802%2900088-2 (accessed on 16 January 2025).
- Albrecht, A.; Kandji, S.T. Carbon sequestration in tropical agroforestry systems. Agric. Ecosyst. Environ. 2003, 99, 15–27. Available online: https://www.sciencedirect.com/science/article/pii/S0167880903001385 (accessed on 28 March 2025). [CrossRef]
- Häger, A. The effects of management and plant diversity on carbon storage in coffee agroforestry systems in Costa Rica. Agrofor. Syst. 2012, 86, 159–174. [Google Scholar] [CrossRef]
- de Carvalho, F.F.; Barreto-Garcia, P.A.B.; Pérez-Maluf, R.; Monroe, P.H.M.; Pereira, F.R.; Almeida, T.C.; Nunes, M.R. Effects of Coffee arabica cultivation systems on tropical soil microbial biomass and activity in the northeast region of Brazil. Agrofor. Syst. 2024, 98, 2397–2410. [Google Scholar] [CrossRef]
- Niguse, G.; Iticha, B.; Kebede, G.; Chimdi, A. Contribution of coffee plants to carbon sequestration in agroforestry systems of Southwestern Ethiopia. J. Agric. Sci. 2022, 160, 440–447. Available online: https://www.cambridge.org/core/journals/journal-of-agricultural-science/article/contribution-of-coffee-plants-to-carbon-sequestration-in-agroforestry-systems-of-southwestern-ethiopia/320308C9F0281FB4911D64988E75394E (accessed on 16 January 2025). [CrossRef]
- Hergoualc’h, K.; Blanchart, E.; Skiba, U.; Henault, C.; Harmand, J.-M. Changes in Carbon Stocks and Greenhouse Gas Balance in a Coffee (Coffea arabica) Monoculture Versus an Agroforestry System with Inga Densiflora, in Costa Rica. CIFOR-ICRAF. 2012. Available online: https://www.cifor-icraf.org/knowledge/publication/5154/ (accessed on 16 January 2025). [CrossRef]
- Negash, M.; Starr, M. Biomass and soil carbon stocks of indigenous agroforestry systems on the south-eastern Rift Valley escarpment, Ethiopia. Plant Soil 2015, 393, 95–107. [Google Scholar] [CrossRef]
- Solis, R.; Vallejos-Torres, G.; Arévalo, L.; Marín-Díaz, J.; Ñique-Alvarez, M.; Engedal, T.; Bruun, T.B. Carbon stocks and the use of shade trees in different coffee growing systems in the Peruvian Amazon. J. Agric. Sci. 2020, 158, 450–460. Available online: https://www.cambridge.org/core/journals/journal-of-agricultural-science/article/carbon-stocks-and-the-use-of-shade-trees-in-different-coffee-growing-systems-in-the-peruvian-amazon/EFBC4767DB3C355403F162F6286E2373 (accessed on 28 March 2025). [CrossRef]
- Gebeyehu, G.; Soromessa, T.; Bekele, T.; Teketay, D. Carbon stocks and factors affecting their storage in dry Afromontane forests of Awi Zone, northwestern Ethiopia. J. Ecol. Environ. 2019, 43, 7. [Google Scholar] [CrossRef]
- Asrat, F.; Soromessa, T.; Bekele, T.; Kurakalva, R.M.; Guddeti, S.S.; Smart, D.R.; Steger, K. Effects of Environmental Factors on Carbon Stocks of Dry Evergreen Afromontane Forests of the Choke Mountain Ecosystem, Northwestern Ethiopia. Int. J. For. Res. 2022, 2022, 9447946. Available online: https://onlinelibrary.wiley.com/doi/abs/10.1155/2022/9447946 (accessed on 28 April 2025). [CrossRef]
- Birhane, E.; Ahmed, S.; Hailemariam, M.; Negash, M.; Rannestad, M.M.; Norgrove, L. Carbon stock and woody species diversity in homegarden agroforestry along an elevation gradient in southern Ethiopia. Agrofor. Syst. 2020, 94, 1099–1110. [Google Scholar] [CrossRef]
- Fukumasu, J.; Jarvis, N.; Koestel, J.; Kätterer, T.; Larsbo, M. Relations between soil organic carbon content and the pore size distribution for an arable topsoil with large variations in soil properties. Eur. J. Soil Sci. 2022, 73, e13212. Available online: https://onlinelibrary.wiley.com/doi/abs/10.1111/ejss.13212 (accessed on 28 April 2025). [CrossRef]
- Polo-Marcial, M.H.; Solís-Ramos, L.Y.; Murillo-Cruz, R.; Ávila-Arias, C.; Andrade-Torres, A. Mycorrhizal and endophytic richness and colonization in Cedrela odorata L., in agroforestry systems and secondary forest from southeastern Costa Rica. Agrofor. Syst. 2023, 97, 647–658. [Google Scholar] [CrossRef]
- Wang, Y.-J.; He, X.-H.; Meng, L.-L.; Zou, Y.-N.; Wu, Q.-S. Extraradical Mycorrhizal Hyphae Promote Soil Carbon Sequestration through Difficultly Extractable Glomalin-Related Soil Protein in Response to Soil Water Stress. Microb. Ecol. 2023, 86, 1023–1034. [Google Scholar] [CrossRef]
- Son, Y.; Martínez, C.E.; Kao-Kniffin, J. Three important roles and chemical properties of glomalin-related soil protein. Front. Soil Sci. 2024, 4, 1418072. Available online: https://www.frontiersin.org/journals/soil-science/articles/10.3389/fsoil.2024.1418072/full (accessed on 5 June 2025). [CrossRef]
- Paz-Pellat, F.; Salas-Aguilar, V.M.; Sánchez-Sánchez, C.D.; Libert-Amico, A.; Bolaños-González, M.A. Caracterización de los almacenes de carbono, estructura y diversidad de los cafetales bajo sombra y vegetación natural en la Sierra Madre de Chiapas, México. Elem. Para Políticas Públicas 2022, 6, 101–122. Available online: https://www.elementospolipub.org/ojs/index.php/epp/article/view/46 (accessed on 16 January 2025).
- Brevik, E.C.; Burgess, L.C. Soils and Human Health; CRC Press: Boca Raton, FL, USA, 2013; ISBN 978-1-4398-4454-0. [Google Scholar]
- Belay, B.; Pötzelsberger, E.; Sisay, K.; Assefa, D.; Hasenauer, H. The Carbon Dynamics of Dry Tropical Afromontane Forest Ecosystems in the Amhara Region of Ethiopia. Forests 2018, 9, 18. [Google Scholar] [CrossRef]
- Somarriba, E.; Cerda, R.; Orozco, L.; Cifuentes, M.; Dávila, H.; Espin, T.; Mavisoy, H.; Ávila, G.; Alvarado, E.; Poveda, V.; et al. Carbon stocks and cocoa yields in agroforestry systems of Central America. Agric. Ecosyst. Environ. 2013, 173, 46–57. Available online: https://www.sciencedirect.com/science/article/pii/S0167880913001230 (accessed on 28 March 2025). [CrossRef]
- Canal-Daza, D.; Andrade-Castañeda, H. Adaptation to Climate Change in Coffee Production Systems in Tolima. Floresta E Ambiente 2019, 26, e20171165. Available online: https://www.scielo.br/j/floram/a/cmnsMbWD9wksFyKJ4zRjksM/?lang=en (accessed on 28 March 2025). [CrossRef]
- Merle, I.; Villarreyna-Acuña, R.; Ribeyre, F.; Roupsard, O.; Cilas, C.; Avelino, J. Microclimate estimation under different coffee-based agroforestry systems using full-sun weather data and shade tree characteristics. Eur. J. Agron. 2022, 132, 126396. Available online: https://www.sciencedirect.com/science/article/pii/S1161030121001672 (accessed on 28 March 2025). [CrossRef]
- Kimaro, O.D.; Desie, E.; Verbist, B.; Kimaro, D.N.; Vancampenhout, K.; Feger, K.-H. Soil organic carbon stocks and fertility in smallholder indigenous agroforestry systems of the North-Eastern mountains, Tanzania. Geoderma Reg. 2024, 36, e00759. Available online: https://ui.adsabs.harvard.edu/abs/2024GeodR..36E00759/abstract (accessed on 16 January 2025). [CrossRef]
- Mada, G.; Anjulo, A.; Gelaw, A. Estimation of biomass and carbon sequestration capacity of the Surra mountain plantation forest in Gamo Highlands, Southern Ethiopia. Food Energy Secur. 2022, 11, e399. Available online: https://onlinelibrary.wiley.com/doi/abs/10.1002/fes3.399 (accessed on 5 June 2025). [CrossRef]
- Reay, D. Climate-Smart Coffee. In Climate-Smart Food; Reay, D., Ed.; Springer International Publishing: Berlin/Heidelberg, Germany, 2019; pp. 93–104. ISBN 978-3-030-18206-9. [Google Scholar] [CrossRef]
- Perfecto, I.; Jiménez-Soto, M.E.; Vandermeer, J. Coffee Landscapes Shaping the Anthropocene: Forced Simplification on a Complex Agroecological Landscape. Curr. Anthropol. 2019, 60, S236–S250. Available online: https://www.journals.uchicago.edu/doi/full/10.1086/703413 (accessed on 28 March 2025). [CrossRef]
- Gidey, T.; Crous-Duran, J.; Oliveira, T.S. Using the Yield-SAFE Model to Assess the Impacts of Climate Change on Yield of Coffee (Coffea arabica L.) Under Agroforestry and Monoculture Systems; ResearchGate: Berlin, Germany, 2020; Available online: https://www.researchgate.net/publication/344649153_Using_the_yield-SAFE_model_to_assess_the_impacts_of_climate_change_on_yield_of_coffee_Coffea_arabica_L_under_agroforestry_and_monoculture_systems (accessed on 28 March 2025).
- Lin, B.B. Resilience in Agriculture through Crop Diversification: Adaptive Management for Environmental Change. BioScience 2011, 61, 183–193. [Google Scholar] [CrossRef]
- Pandey, D.N. Carbon sequestration in agroforestry systems. Clim. Policy 2002, 2, 367–377. Available online: https://www.tandfonline.com/doi/abs/10.3763/cpol.2002.0240 (accessed on 13 January 2025). [CrossRef]


| N° | AFS Code | Coffee | Shade Trees | ||||||
|---|---|---|---|---|---|---|---|---|---|
| Age (Years) | Distance (m) | Density (Plants ha−1) | Pruning | Age (Years) | Distance (m) | Density (Plants ha−1) | |||
| 1 | CA_I | 2 | 2.0 × 1.3 | 3846 | Pruned | 15 | 10.0 × 10.0 | 100 | |
| 2 | CA_P | 6 | 2.0 × 1.0 | 5000 | Not pruned | 8 | 5.0 × 5.0 | 400 | |
| 3 | CA_E | 5 | 2.5 × 1.0 | 4000 | Not pruned | 5 | 4.0 × 4.0 | 625 | |
| 4 | CA_R | 2 | 1.8 × 1.0 | 5555 | Pruned | 12 | 6.5 × 6.5 | 236 | |
| 5 | CA-S | 2 | 1.3 × 1.0 | 7692 | Pruned | - | - | - | |
| 6 | CA_I | 4 | 2.2 × 1.0 | 4545 | Not pruned | 20 | 10.0 × 10.0 | 100 | |
| 7 | CA_P | 5 | 1.8 × 1.0 | 5555 | Not pruned | 10 | 10.0 × 8.0 | 125 | |
| 8 | CA_R | 2 | 2.0 × 1.2 | 4166 | Pruned | 18 | 6.0 × 8.0 | 208 | |
| 9 | CA_S | 2 | 2.2 × 1.2 | 3787 | Pruned | - | - | - | |
| 10 | CA_I | 2 | 1.8 × 1.0 | 5555 | Pruned | 8 | 10.0 × 10.0 | 100 | |
| 11 | CA_P | 2 | 1.8 × 1.2 | 4629 | Pruned | 8 | 10.0 × 8.0 | 125 | |
| 12 | CA_IP | 2 | 1.9 × 1.0 | 5263 | Pruned | 11 | 7.5 × 7.5 a | 177 a | |
| 11.0 × 11.0 b | 82 b | ||||||||
| 13 | CA_S | 2 | 2.2 × 1.2 | 3787 | Pruned | - | - | - | |
| N° | AFS Code | Coffea arabica L. Shaded by | Location | UTM Coordinates | ||
|---|---|---|---|---|---|---|
| District (Province–Region) | East | North | Altitude (masl) | |||
| 1 | CA_I | Inga edulis (guaba or pacay) | Villa Rica (Oxapampa–Pasco) | 473510 | 8815758 | 1638 |
| 2 | CA_P | Pinus tecunumanii (pine) | 473490 | 8816254 | 1634 | |
| 3 | CA_E | Eucalyptus grandis (eucalipto) | 471384 | 8812334 | 1595 | |
| 4 | CA_R | Retrophyllum rospigliosii (ulcumano) | 471122 | 8810866 | 1500 | |
| 5 | CA_S | C. arabica shadeless | 469761 | 8809842 | 1632 | |
| 6 | CA_I | Inga lineata (guaba, parrot pacay or shimbillo) | San Luis de Shuaro (Chanchamayo–Junín) | 477080 | 8802257 | 1369 |
| 7 | CA_P | Pinus patula (pine) | 475636 | 8804918 | 1392 | |
| 8 | CA_R | Retrophyllum rospigliosii (ulcumano) | 477006 | 8802606 | 1398 | |
| 9 | CA_S | C. arabica shadeless | 477018 | 8802569 | 1390 | |
| 10 | CA_I | Inga edulis (guaba or pacay) | Perené (Chanchamayo–Junín) | 486614 | 8804519 | 850 |
| 11 | CA_P | Pinus tecunumanii (pine) | 492494 | 8804924 | 1611 | |
| 12 | CA_IP | Inga edulis and Pinus tecunumanii (pine) | 491937 | 8808242 | 1381 | |
| 13 | CA_S | C. arabica shadeless | 492544 | 8805006 | 1594 | |
| Factors | ACB | RCB | ATB | RTB | HSB | LB | Total Biomass |
|---|---|---|---|---|---|---|---|
| Fixed factors (p value) | |||||||
| AFS | <0.01 | <0.01 | <0.01 | <0.01 | <0.01 | <0.01 | <0.01 |
| DSC | Excluded | Excluded | Excluded | Excluded | 0.01 | 0.02 | Excluded |
| Selection of distribution | |||||||
| Distribution | lognormal | lognormal | Gamma | Gamma | Gamma | lognormal | Gamma |
| AICc | 188.82 | 132.01 | 107.42 | 5.23 | 31.74 | 189.03 | 396.61 |
| Random factor () | |||||||
| Districts | 0.36 | 0.32 | 0.24 | 0.21 | 0.00 | 0.00 | 0.28 |
| AFS | ACB | RCB | ATB | RTB | HSB | LB | Total Biomass |
|---|---|---|---|---|---|---|---|
| CA_I | 12.78 b | 3.27 b | 79.16 c | 16.42 c | 0.27 b | 7.2 b | 120.36 b |
| CA_R | 13.62 b | 3.51 b | 85.57 bc | 17.61 bc | 0.41 ab | 3.61 c | 122.65 ab |
| CA_P | 20.72 a | 5.05 a | 69.6 c | 14.67 c | 0.63 a | 4.02 c | 113.01 b |
| CA_E | 6.93 c | 1.88 c | 146.48 a | 28.41 a | 0.08 c | 10.59 a | 168.61 ab |
| CA_IP | 17.59 ab | 4.34 ab | 131.48 ab | 27.67 ab | 0.4 ab | 6.52 b | 209.69 a |
| CA_S | 15.71 b | 3.92 b | 0.00 d | 0.00 d | 0.91 a | 3.26 c | 24.07 c |
| Factors | ACC | RCC | ATC | RTC | SHC | LC | SOC | Total Carbon |
|---|---|---|---|---|---|---|---|---|
| Fixed factors (p value) | ||||||||
| AFS | <0.01 | <0.01 | <0.01 | <0.01 | 0.01 | <0.01 | <0.01 | 0.02 |
| DSC | Excluded | Excluded | Excluded | Excluded | Excluded | 0.02 | Excluded | Excluded |
| Selection of distribution | ||||||||
| Distribution | lognormal | lognormal | Gamma | Gamma | Gamma | lognormal | lognormal | normal |
| AICc | 188.82 | 73.52 | 62.12 | −40.08 | −33.36 | 111.46 | 388.53 | 410.56 |
| Random factor () | ||||||||
| Districts | 0.36 | 0.32 | 0.24 | 0.21 | 0.23 | 0.00 | 0.09 | 0.13 |
| Factor | ACC | RCC | ATC | RTC | SHC | LC | SOC | Total Carbon |
|---|---|---|---|---|---|---|---|---|
| CA_I | 6.03 b | 1.55 b | 37.20 c | 7.72 c | 0.14 bc | 2.67 b | 105.44 ab | 162.85 ab |
| CA_R | 6.43 b | 1.66 b | 40.22 bc | 8.28 bc | 0.18 abc | 1.33 c | 129.58 a | 190.38 a |
| CA_P | 9.78 a | 2.38 a | 32.71 c | 6.89 c | 0.23 ab | 1.49 c | 106.06 ab | 163.69 ab |
| CA_E | 3.27 c | 0.89 c | 68.85 a | 13.36 a | 0.05 c | 3.92 a | 98.64 ab | 178.47 ab |
| CA_IP | 8.3 ab | 2.05 ab | 61.80 ab | 13.01 ab | 0.16 abc | 2.41 b | 76.95 b | 163.12 ab |
| CA_S | 7.41 b | 1.85 b | 0.00 d | 0.00 d | 0.43 a | 1.20 c | 128.70 a | 138.17 b |
| Factor | CFC | CFT | Total C Fixation |
|---|---|---|---|
| Fixed factors (p value) | |||
| AFS | <0.01 | <0.01 | <0.01 |
| Selection of distribution | |||
| Distribution | Gamma | Gamma | Normal |
| AICc | 154.43 | −82.31 | 159.13 |
| Random factor () | |||
| Districts | 0.16 | 0.00 | 0.36 |
| Factor | CO2eFC | CO2eFT | Total CO2e Fixation |
|---|---|---|---|
| Fixed factors (p value) | |||
| AFS | <0.01 | <0.01 | <0.01 |
| Selection of distribution | |||
| Distribution | Gamma | Gamma | lognormal |
| AICc | 255.83 | −4.28 | 289.72 |
| Random factor () | |||
| Districts | 0.16 | 0.00 | 0.00 |
| Factor | % Carbon | % Organic Matter | % Porosity |
|---|---|---|---|
| Fixed factors (p value) | |||
| AFS | <0.01 | <0.01 | <0.01 |
| DSC | 0.02 | 0.02 | <0.01 |
| Selection of distribution | |||
| Distribution | Beta | Beta | Beta |
| AICc | −212.58 | −170.36 | −60.55 |
| Random factor () | |||
| Districts | 0.14 | 0.14 | 0.00 |
| AFS | % Carbon | % Organic Matter | %Porosity |
|---|---|---|---|
| CA_I | 2.91 b | 5.02 b | 53.17 bc |
| CA_R | 4.48 a | 7.74 a | 60.30 abc |
| CA_P | 3.62 ab | 6.24 ab | 60.60 ab |
| CA_E | 2.33 b | 4.02 b | 48.17 c |
| CA_IP | 2.11 b | 3.65 b | 49.51 bc |
| CA_S | 4.79 a | 8.27 a | 66.75 a |
Disclaimer/Publisher’s Note: The statements, opinions and data contained in all publications are solely those of the individual author(s) and contributor(s) and not of MDPI and/or the editor(s). MDPI and/or the editor(s) disclaim responsibility for any injury to people or property resulting from any ideas, methods, instructions or products referred to in the content. |
© 2025 by the authors. Licensee MDPI, Basel, Switzerland. This article is an open access article distributed under the terms and conditions of the Creative Commons Attribution (CC BY) license (https://creativecommons.org/licenses/by/4.0/).
Share and Cite
Salgado Veramendi, N.; Romero-Chavez, L.E.; Huerto Pajuelo, E.S.; Ibarra Porras, C.d.C.; Cunyas-Camayo, J.M.; Aldava Pardave, U.; Vallejos-Torres, G.; Solórzano Acosta, R. Carbon Storage in Coffee Agroforestry Systems: Role of Native and Introduced Shade Trees in the Central Peruvian Amazon. Agriculture 2025, 15, 1415. https://doi.org/10.3390/agriculture15131415
Salgado Veramendi N, Romero-Chavez LE, Huerto Pajuelo ES, Ibarra Porras CdC, Cunyas-Camayo JM, Aldava Pardave U, Vallejos-Torres G, Solórzano Acosta R. Carbon Storage in Coffee Agroforestry Systems: Role of Native and Introduced Shade Trees in the Central Peruvian Amazon. Agriculture. 2025; 15(13):1415. https://doi.org/10.3390/agriculture15131415
Chicago/Turabian StyleSalgado Veramendi, Noelito, Lorena Estefani Romero-Chavez, Eldhy Sianina Huerto Pajuelo, Carolina del Carmen Ibarra Porras, Joseph Michael Cunyas-Camayo, Uriel Aldava Pardave, Geomar Vallejos-Torres, and Richard Solórzano Acosta. 2025. "Carbon Storage in Coffee Agroforestry Systems: Role of Native and Introduced Shade Trees in the Central Peruvian Amazon" Agriculture 15, no. 13: 1415. https://doi.org/10.3390/agriculture15131415
APA StyleSalgado Veramendi, N., Romero-Chavez, L. E., Huerto Pajuelo, E. S., Ibarra Porras, C. d. C., Cunyas-Camayo, J. M., Aldava Pardave, U., Vallejos-Torres, G., & Solórzano Acosta, R. (2025). Carbon Storage in Coffee Agroforestry Systems: Role of Native and Introduced Shade Trees in the Central Peruvian Amazon. Agriculture, 15(13), 1415. https://doi.org/10.3390/agriculture15131415