Article

Soil Quality and Heavy Metal Source Analyses for Characteristic Agricultural Products in Luzuo Town, China

1
College of Earth and Planetary Sciences, Chengdu University of Technology, Chengdu 610059, China
2
Sichuan Key Laboratory of Geological and Nuclear Technology, Chengdu University of Technology, Chengdu 610059, China
3
School of Resources, Environment and Tourism, Anyang Normal College, Anyang 455000, China
4
Shandong Provincial Research Center of Geological Survey Engineering and Technology, Jinan 250013, China
5
Shandong Provincial Institute of Physical and Chemical Exploration, Jinan 250013, China
6
Shandong Academy of Agricultural Sciences, Jinan 250013, China
*
Author to whom correspondence should be addressed.
Agriculture 2025, 15(13), 1360; https://doi.org/10.3390/agriculture15131360
Submission received: 23 April 2025 / Revised: 12 June 2025 / Accepted: 21 June 2025 / Published: 25 June 2025
(This article belongs to the Section Agricultural Soils)

Abstract

Identifying the soil quality and the sources of heavy metals in the production areas of characteristic agricultural products is crucial for ensuring the quality of such products and the sustainable development of agriculture. This research took the farmland soil of Luzuo Town, a characteristic production area of Cangshan garlic in Linyi City, as the research object. The contents of Cr, Cu, Ni, Pb, Zn, As, Hg, and Cd in farmland soil were analyzed. The ecological risks were evaluated using the Geographical Cumulative Index (Igeo) and the Potential Ecological Risk Index. The spatial distribution characteristics of the elements were determined through geostatistical analysis, and Positive Matrix Factorization (PMF) was used for source apportionment. The results show the following: (1) The average concentrations of all heavy metals exceeded local background values, with Cr and Hg surpassing the screening thresholds from China’s “Soil Pollution Risk Control Standards” (GB 15618-2018). (2) The results of the Moran’s index show that, except for Hg and Cd, all the elements had a high spatial autocorrelation, and there are two potential highly polluted areas in the study area. (3) Soils were generally uncontaminated or low risk, with Hg and Cd as the primary ecological risk contributors. (4) Five sources were quantified: fertilizer and pesticide sources (32.28%); mixed sources of fertilizer, pesticides, and manure (14.15%); mixed sources of traffic activities and agricultural waste discharge (19.95%); natural sources (20.55%); and incineration sources (13.07%). This study demonstrates the value of integrating geospatial and statistical methods for soil pollution management. Targeted control of Hg/Cd and reduced agrochemical use are recommended to protect this important agricultural region.

1. Introduction

The heavy metal pollution of soil has received increasing attention since the beginning of the 21st century [1,2,3,4], and it is still an important environmental problem in both developed and developing countries [4]. The results of the National Soil Pollution Survey Bulletin released in 2014 showed that the quality of the domestic soil environment is worrisome, with a total exceedance rate of national soil at 16.1%, and the predominant polluting elements are Cd, Hg, As, Cu, Pb, Cr, Zn, and Ni, with Cd contamination being the most serious problem. Heavy metal pollution not only affects crop growth but also reduces the yield and quality of agricultural products while posing a threat to human health through the food chain. Heavy metal pollution threatens the sustainable development of characteristic agricultural products [5]. Therefore, it is particularly important to investigate the content, spatial distribution, and pollution characteristics of heavy metal elements in soil. Previous studies have shown that there are two main sources of excess heavy metal elements in soil: anthropogenic and natural sources [6]. Due to soil heterogeneity, the sources of heavy metal elements in soils are diverse [7]. The sources of the same element may be similar or different across various areas; conversely, different elements within a single area may also share similar or differing sources. Therefore, the specific sources of heavy metal elements in a study area should be analyzed according to local conditions.
The protection of agricultural soil quality and ecological security, safeguarding agricultural product safety, and maintaining sustainable agricultural development have long been the key research foci in the scientific community. As an indispensable spice crop, garlic possesses significant culinary, medicinal, and economic values [8,9]. However, its growth and development are particularly vulnerable to heavy metal stress, especially from cadmium (Cd) and lead (Pb). Under Cd/Pb stress, garlic exhibits a marked reduction in root development and sprouting, ultimately compromising yield and quality [9,10]. Moreover, the consumption of heavy metal-contaminated garlic may lead to the bioaccumulation of toxic elements in humans, posing substantial health risks. As a major garlic cultivation region in China, Shandong Province faces particularly acute challenges related to soil heavy metal contamination. Linyi’s Lanling County is designated as a “National High-Quality Garlic Production Demonstration Base” and renowned as “China’s Garlic Homeland”, producing the distinctive Cangshan garlic variety. This cultivar is characterized by its unique flavor profile (pungency, spiciness, viscosity, and richness) and superior nutritional composition, containing higher levels of all 17 amino acids compared to other regional varieties. With over two decades of export history, the Cangshan garlic industry represents a vital economic sector [11]. However, decades of intensive agricultural and industrial development have potentially compromised local soil environments. The current research on garlic-growing regions has primarily focused on Jinxiang County and Qi County [12,13], while systematic investigations of soil quality characteristics in Lanling’s garlic production areas remain notably absent. Given garlic’s triple role as an economic crop, medicinal resource, and culinary staple, soil quality directly determines both crop productivity and regional brand value. Therefore, conducting comprehensive regional soil quality assessments is imperative to ensure sustainable agricultural development and maintain the yield and quality of this premium agricultural product.
Against this background, this study selected Luzuo Town in Lanling County, Linyi City, Shandong Province, as the research area, aiming to address the knowledge gap regarding soil quality assessment and heavy metal pollution sources in this premium agricultural product zone. The specific research objectives were to (1) systematically investigate the concentration characteristics, spatial distribution patterns, and correlations of heavy metals in the study area’s soils; (2) evaluate the contamination levels and potential ecological risks posed by heavy metals; (3) conduct source apportionment to quantify the rates of contribution from different sources using the PMF receptor model; and (4) provide a scientific basis for categorized soil quality management and sustainable agricultural development in characteristic agricultural product regions.

2. Materials and Methods
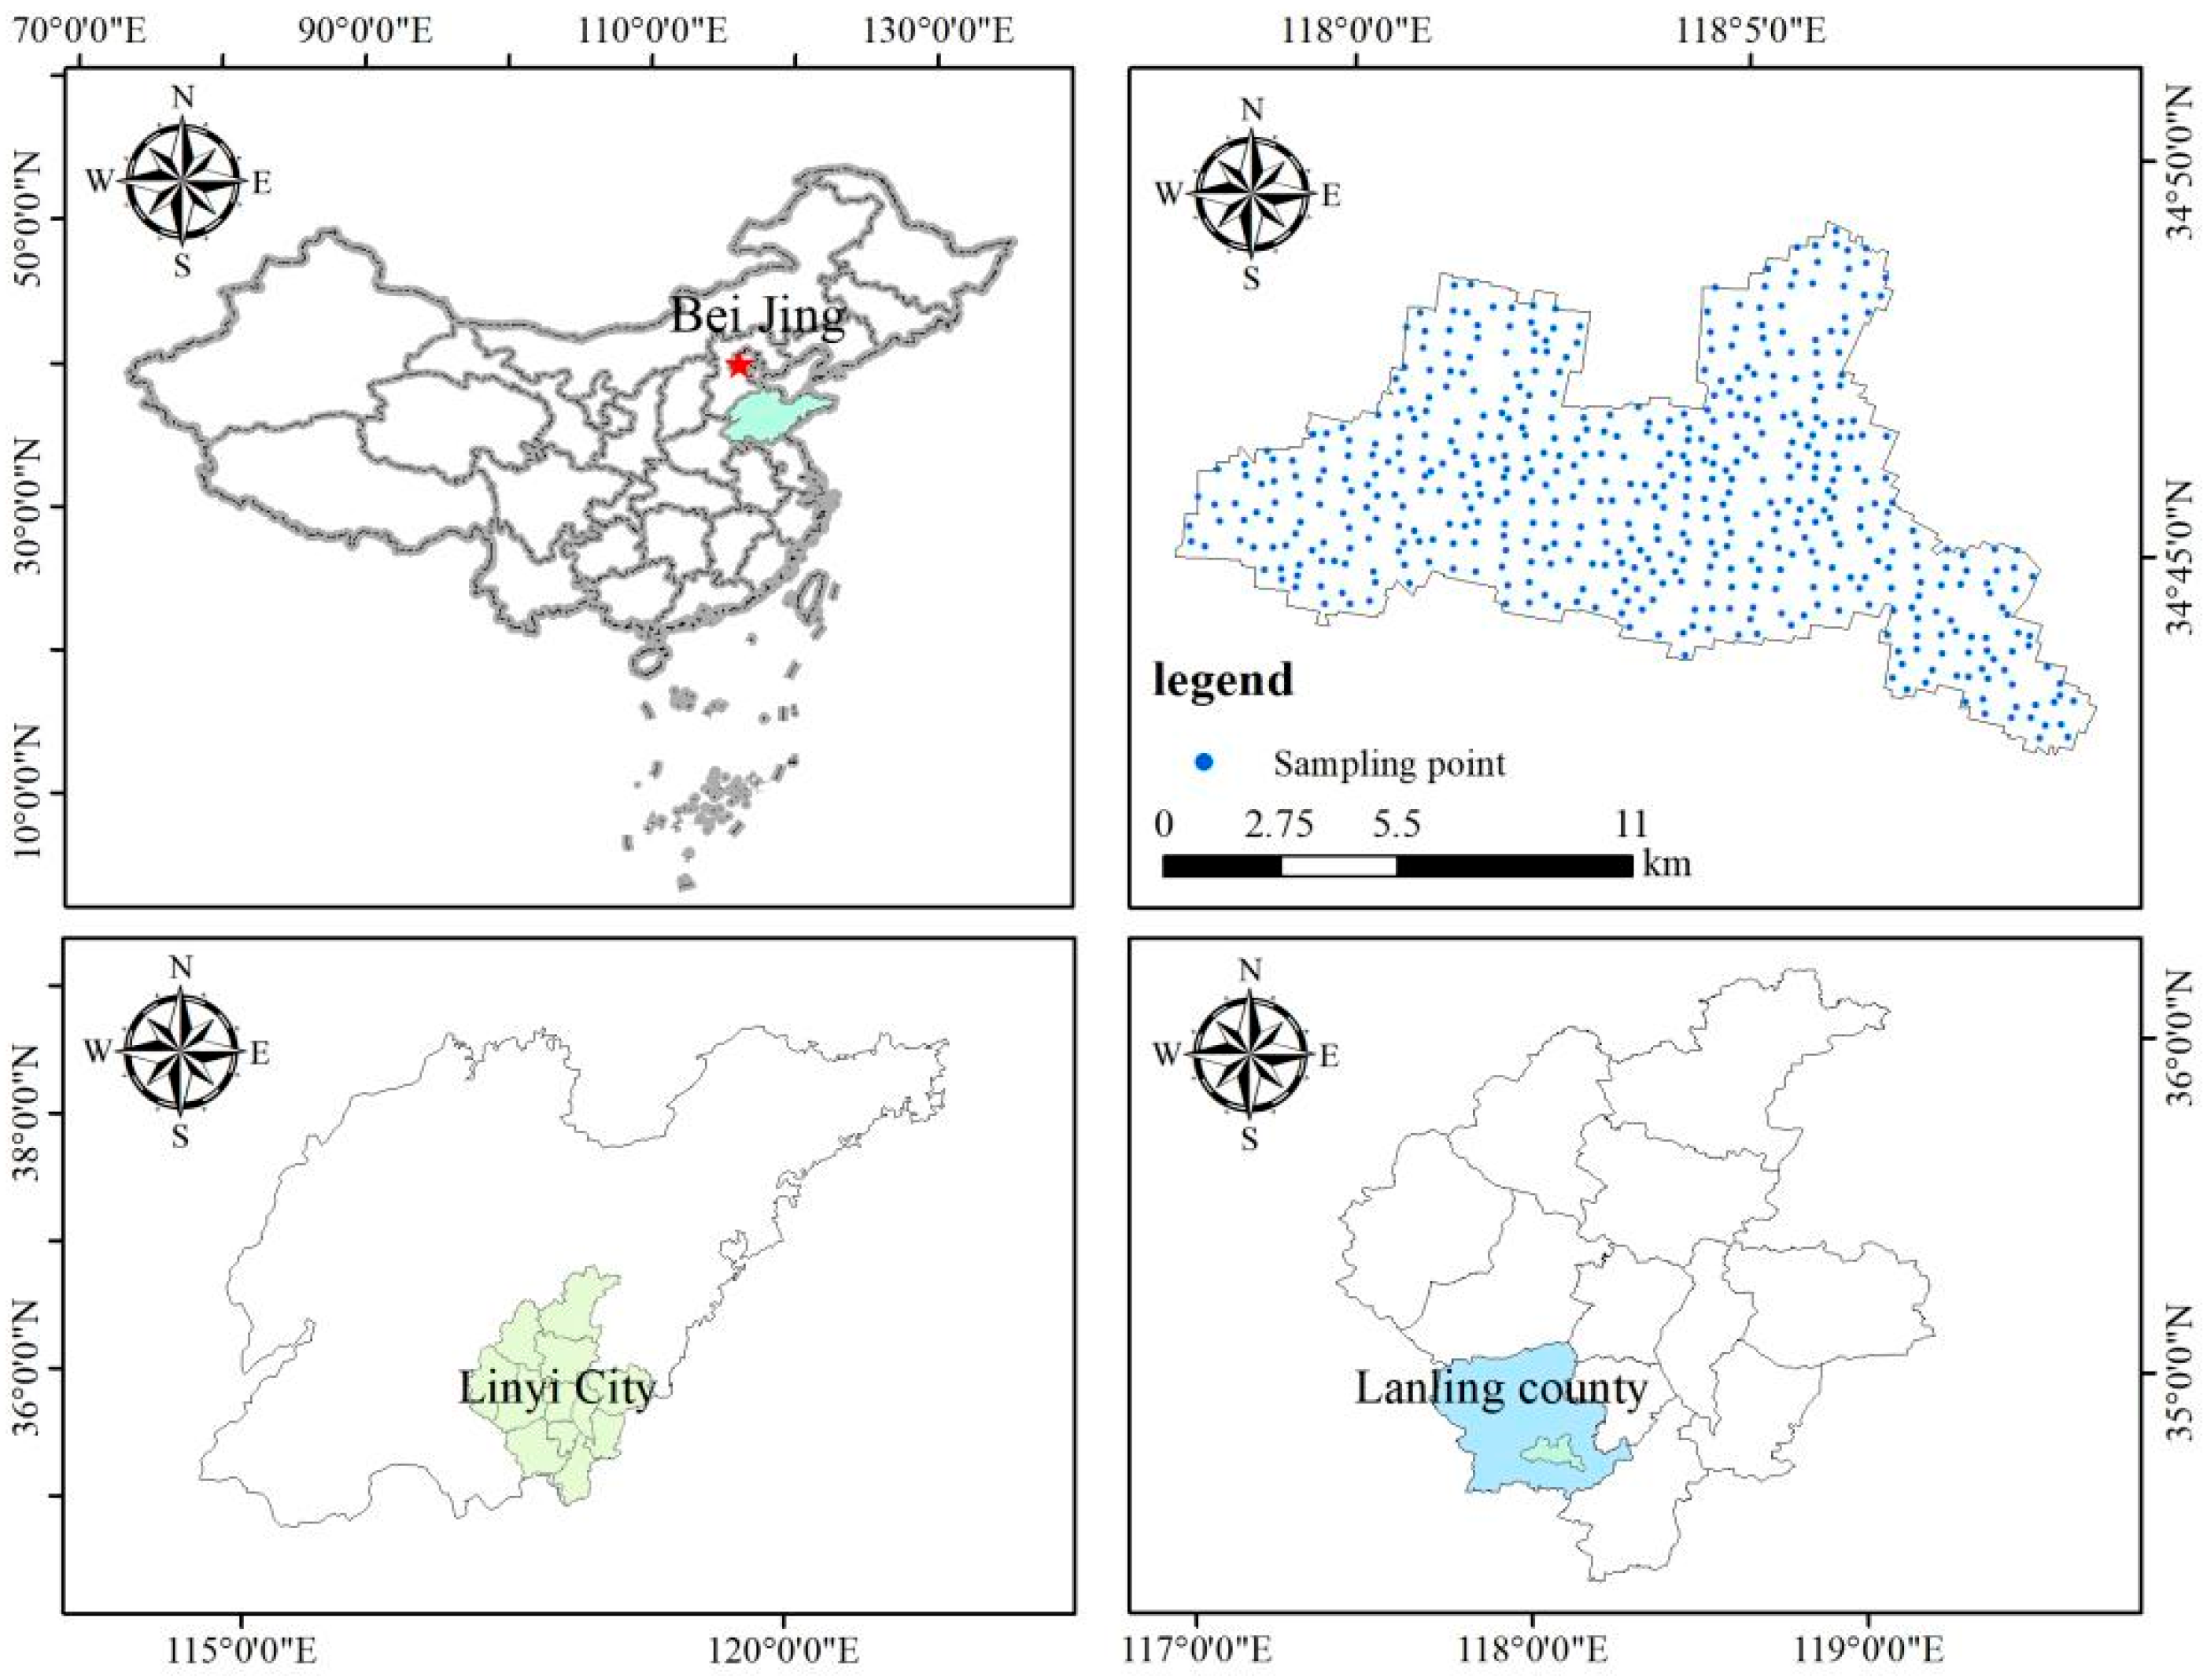
2.1. Study Area

The study area is located in Luzuo Town (Figure 1 and Figure S1), Lanling County, Linyi City, Shandong Province, bordering Moshan Town and Zhuangwu Town in the east, Nanqiao Town and Changcheng Town in the south, Xiangcheng Town in the west, and Bianzhuang Street in the north. It has an administrative area of 95.66 km2 and geographic coordinates of 117°57′21.863″–118°09′1.091″; 34°42′32.266″–34°49′17.559″. The territory of Luzuo Town belongs to the eastern plain area, with a flat terrain and an average elevation of 40 m. The highest point in this territory is 42 m above sea level, while the lowest point is 36 m above sea level. Luzuo Town has a warm, temperate, semi-humid monsoon climate, characterized by dry and windy springs, concentrated rainfall in summer, mild and cool falls, and dry and cold winters with little snow [14,15]. The average annual temperature is 12.8 °C, with a mean temperature of −3.6 °C in January and 26.7 °C in July; the average annual difference in temperature is 30.3 °C. The average annual growing period lasts for 206 days; the average annual frost-free period is about 192 days; there are approximately 2647.6 h of sunshine annually; the total annual radiation is about 127.4 kcal/cm2; and the duration above 0 °C spans approximately 276 days (generally from 28th February to 3rd December). The average annual precipitation amounts to around 585 mm. Cultivation, breeding, and food processing are the main industries in Luzuo Town. The stratigraphy in the study area consists of quaternary sediments [16], mainly Holocene lacustrine deposits (Qhl) and Holocene swamp deposits (Qhf) (Figure S2), with clayey silt, gravelly medium-coarse sand, and silty clay as the main lithologies. The soil types include hydromorphic soils and tidal soils.

2.2. Sample Collection and Pretreatment

Using the current land use status of the study area as the working base map, samples were collected from the cultivated soils in the study area. The sampling process was conducted in strict accordance with the Specification for Geochemical Evaluation of Land Quality (DZ/T 0295-2016) [17]. The successive collection of 0–20 cm soil column samples from the surface layer of arable land was performed, and 3–5 points were aliquoted and combined into one sample according to the characteristics of the plot. The mass of each fresh sample was ≥1500 g. A total of 512 soil samples were collected, naturally dried in a ventilated place, and passed through a 10-mesh (2 mm aperture) nylon sieve. A 100 g sample was collected using the shrinkage method and ground through a 200-mesh (75 μm aperture) nylon sieve to analyze the heavy metal elements.

2.3. Analyzing and Testing Methods

The heavy metal elements were analyzed as follows: ① Pb, Ni, Cr, Zn, and Cu were determined using X-ray fluorescence spectrometry (Axiosmax, PANalytical B.V., Eindhoven, Netherlands, Holland). A sample (4.00 g) was weighed and placed uniformly in a low-pressure polyethylene plastic ring and then pressed to mold it using the powder press cake method for the determination. ② Cd was determined using graphite furnace atomic absorption spectrometry (GF-AAS, PE600, Thermo Elemental, Waltham, MA, USA). A sample weighing 0.2500 g was taken and placed in a polytetrafluoroethylene crucible; mixed acid (HF-HClO4-HNO3) was added for digestion, and the mixture was then shaken well for the determination. ③ As and Hg were determined using hydride generation atomic fluorescence spectrometry (AFS9750, Beijing Haiguang Instrument, Beijing, China). A 0.5000 g quantity of the sample was added into a colorimeter; aqua regia was added, and the mixture was dissolved in a water bath. Then, 10% hydrochloric acid was used to settle the sample, which was shaken well for the determination. The pH was determined using the potentiometric method (PHS-3C, Shanghai Precision Scientific Instrument Co, Ltd., Shanghai, China). The detection limits of As, Cd, Cr, Cu, Hg, Ni, Pb, and Zn were 0.2, 0.02, 2, 1, 0.0003, 2, 1, and 2 mg·kg−1, respectively; the minimum display unit for pH was 0.01. The results show that all the indicators were better than those of the Earth’s land quality and met the requirements of the land quality geochemical evaluation specification (DZ/T0295-2016) [17]. The glassware used in the tests was soaked in a 10% nitric acid solution for 24 h. All the reagents were of superior purity, and the water used for analysis was ultrapure water. During the testing process, one duplicate sample and four soil national standard substances (GBW-07403) were included in every batch of 50 samples for quality control. The pass rate of the sample repeatability test was between 91.3% and 98.8%, while that of the anomaly duplicate check ranged from 96.0% to 100%. The results of the specimen determinations were all within a permissible error range. The soil samples were analyzed and tested by the Central Laboratory of Shandong Geological and Mineral Exploration and Development Bureau.

2.4. Geoaccumulation Index Method (Igeo)

The geoaccumulation index method was first proposed by Muller [18], initially used to evaluate contaminants in the water environment. With its advanced development, this method has gradually been applied to the evaluation of soil heavy metal pollution and the interpretation of human evidence, taking into account not only anthropogenic influences and geochemical background but also variations in the background values due to natural diagenetic action. Its expression is shown in Equation (1).
I g e o = log 2 C i K × B i
where Igeo denotes the geoaccumulation index; Ci denotes the measured content of element i (mg·kg−1); Bi denotes the background value of element i (mg·kg−1), which was chosen as the background value for Linyi City; and K denotes the correction factor, set to 1.5. According to a previous study [3], the geoaccumulation index (Igeo) values represent the following: Igeo ≤ 0 represents no pollution, 0 < Igeo ≤ 1 represents mild–moderate pollution, 1 < Igeo ≤ 2 represents moderate pollution, 2 < Igeo ≤ 3 represents moderate–high pollution, 3 < Igeo ≤ 4 represents high pollution, 4 < Igeo ≤ 5 represents high–extremely high and severe pollution, and Igeo > 5 represents very severe pollution.

2.5. Potential Ecological Risk Index (PERI) Method

The potential ecological risk index (PERI) considers the content, ecological effect, and environmental effect of heavy metals, as well as the toxicity coefficient of heavy metals. It classifies the potential ecological hazard degree of heavy metals from the perspective of sedimentology and expresses the potential ecological hazards of heavy metals through intuitive data [19]. To date, this method has been the most commonly used for heavy metal ecological risk evaluation. Its expression is shown in Equations (2) and (3).
E r i = T r i × C i C n i
R I = i = 1 m E r i
where E r i denotes the ecological risk associated with a single metal; RI denotes the overall potential risk of the heavy metal; Ci denotes the measured content of element i (mg·kg−1); Cin denotes the background value of element i (mg·kg−1); and Tir denotes the corresponding coefficient of toxicity of element i. Here, Hakanson’s division was chosen: Cr = 2, Cu = 5, Ni = 5, Pb = 5, Zn = 1, As = 10, Hg = 40, and Cd = 30; the classification of E r i and RI is shown in the following Table 1.

2.6. Moran’s Index (I)

The Moran’s index is commonly used to study spatial autocorrelation [20]. The Moran’s index (I) can be used to determine whether the values in the region are clustered or anomalous; it can be specifically divided into the global Moran’s index and local Moran’s index. The global Moran’s index indicates whether the values are clustered or not, while the local Moran’s index further indicates the clustered regions. They are calculated using the following formula:
I = n × i = 1 n j = 1 n ω i , j x i x ¯ x j x ¯ i = 1 n j = 1 n ω i , j × i = 1 n x i x j 2
I L = n × x i x ¯ j = 1 n ω i , j x j x ¯ i = 1 n j = 1 n ω i , j × i = 1 n x i x j 2
where I represents the global Moran’s index; IL represents the local Moran’s index; xi and xj represent the attribute values of locations i and j, respectively; n represents the number of all the study objects; and wi,j represents the weights assigned to each raster measurement unit. A significance test was performed on the calculated Moran’s index using the Z distribution with the following test formula:
Z I = 1 E I V a r I
E I = 1 n 1
V a r I = E I 2 E 2 I
where E(I) denotes the expected value of the Moran’s index, and E(I2) denotes the expected variance of the Moran’s index. When |Z| > 1.96, it indicates that the element is characterized by significant clustering or dispersion within the 95% confidence interval; otherwise, it is randomly distributed.

2.7. Positive Definite Matrix Factorization (PMF) Model

The positive definite matrix factorization (PMF) model is a mathematical receptor model based on principal component analysis (PCA), which is commonly used to quantify the contribution of pollution sources in a sample based on the composition of those sources [1,21]. It is a multivariate analytical tool widely used in recent years for various source contributions of samples; among these applications, it has been most notably applied in the resolution of environmental pollution [22]. The model was first proposed by Paatero in 1994 [23], and it decomposes the pollutant content matrix into a contribution matrix, a source component spectral matrix, and a residual matrix. Additionally, it imposes non-negative constraints on the decomposition of the factor matrices during the solution process to make the analytical results more practical.
The basic principle of PMF involves the decomposition of the content matrix Xij into a source component spectrum matrix (Fki), a contribution matrix (Gik), and a residual matrix (Eij). The expression is as follows:
X ij = k = 1 p ( G ik × F kj ) + E ij
where Xij denotes the content matrix of the receptor, specifically expressed as the content of the jth element in the ith sample; Gik denotes the factor contribution matrix, specifically expressed as the contribution of the ith sample in the kth pollutant; Fkj denotes the factor component Pu matrix, specifically expressed as the content of the kth pollutant in the jth source contribution; and Eij denotes the residual matrix, which is calculated from the objective function Q. The objective function Q is calculated as follows:
Q = i = 1 n j = 1 m ( E ij U ij ) 2
where i represents the ith sample, j represents the jth pollutant, and Uij represents the uncertainty of the element, specifically expressed as the uncertainty of element i in pollutant j. There are two ways to calculate uncertainty: when the element content is less than or equal to the corresponding method detection limit (MDL), the uncertainty can be calculated using Equation (11); when the element content is greater than the corresponding method detection limit, the uncertainty can be calculated using Equation (12). The specific formulas for calculating uncertainty are as follows:
U ij = 5 6 × MDL
U ij = ( δ × C ) 2 + ( 0.5 × MDL ) 2
where δ denotes the relative standard deviation, C denotes the elemental content (mg·kg−1), and MDL denotes the method detection limit for heavy metals (mg·kg−1).

2.8. Data Processing

The data related to this study were processed using the software IBM SPSS Statistics 26 (IBM Inc., Armonk, NY, USA) and Origin 2021 (Origin Lab Corporation, Northampton, MA, USA). The main content processing of these two pieces of software included principal component analysis, Kaiser–Meyer–Olkin (KMO) and Bartlett’s spherical tests, correlation analysis, and statistical analysis. Mapping and post-processing were accomplished using ArcGIS 10.7 (Esri, Redlands, CA, USA) and CorelDraw 2018 (Corel Corporation, Ottawa, OA, Canada), with ArcGIS mainly used to draw Kriging interpolation maps, sampling point location maps, and Moran’s index operations. CorelDraw was used to enhance all the figures presented in this paper. The source analysis of soil heavy metal contaminants was performed using the PMF modeling component (Ver. 5.0; EPA; Washington, DC, USA).

3. Results and Discussion

3.1. Characteristics of Soil Heavy Metal Element Content

The results of the statistical analysis of the heavy metals and pH in the surface soil of the study area are shown in Table 2. These showed that the mean values of ω(Cr), ω(Cu), ω(Ni), ω(Pb), ω(Zn), ω(As), ω(Hg), and ω(Cd) in the study area were 80.90, 31.57, 36.58, 28.72, 76.67, 9.51, 0.04, and 0.16 mg·kg−1, respectively, all of which exceeded the soil background values of Linyi City and the national soil background values [24]. The percentages of points in the study area where the contents of Cr, Cu, Ni, Pb, Zn, As, Hg, and Cd exceeded the background values of Linyi City were 98.44%, 86.33%, 92.58%, 77.34%, 79.10%, 99.41%, 83.98%, and 88.67%, respectively; their average contents were also higher than those national soil background values by the following approximate factors: Cr (1.32 times), Cu (1.33 times), Ni (1.34 times), Pb (1.10 times), Zn (1.19 times), As (1.46 times), Hg (1.47 times), and Cd (1.29 times) [24]. Compared with other areas in Linyi City, the average heavy metal content in this study area exceeded its regional average, except for Hg [25]. According to the screening values specified in the Soil Environmental Quality Risk Control Standards for Soil Pollution in Agricultural Land (GB15618-2018) [26], the maximum levels of Cr and Hg within this region surpassed the risk screening thresholds, while Cu’s maximum value was also slightly above its corresponding threshold. Statistical analysis indicated that the skewness and kurtosis values pertaining to Zn, Hg, and Cd in this location were high, suggesting pronounced right-skewed distributions. Additionally, the dispersion observed among both mercury and cadmium appeared significant, possibly due to elevated concentrations at certain sampling sites.
The coefficient of variation (CV) reflects the spatial characteristics of element distribution, i.e., the degree of uniformity in the distribution of heavy metal elements in soil. The larger the CV value, the more uneven the distribution of the elements and the greater the degree of influence from external disturbances and anthropogenic factors [27,28,29]. According to Wilding’s grading of the magnitude of the coefficient of variation [30], when the coefficient is less than 10%, the variation is considered weak; when it is greater than or equal to 10% or less than or equal to 100%, the variation is considered moderately strong; and when it exceeds 100%, the variation is considered strong. The coefficients of variation for eight heavy metals in the study area, listed in descending order, were Hg (143.89%) > Cd (30.54%) > Cu (22.15%) > Zn (19.79%) > Ni (17.84%) > As (15.13%) > Cr (12.85%) > Pb (10.64%). According to this classification, Hg exhibits a strong variation and has a high probability of being affected by external and anthropogenic influences, while all other elements exhibit medium variations.

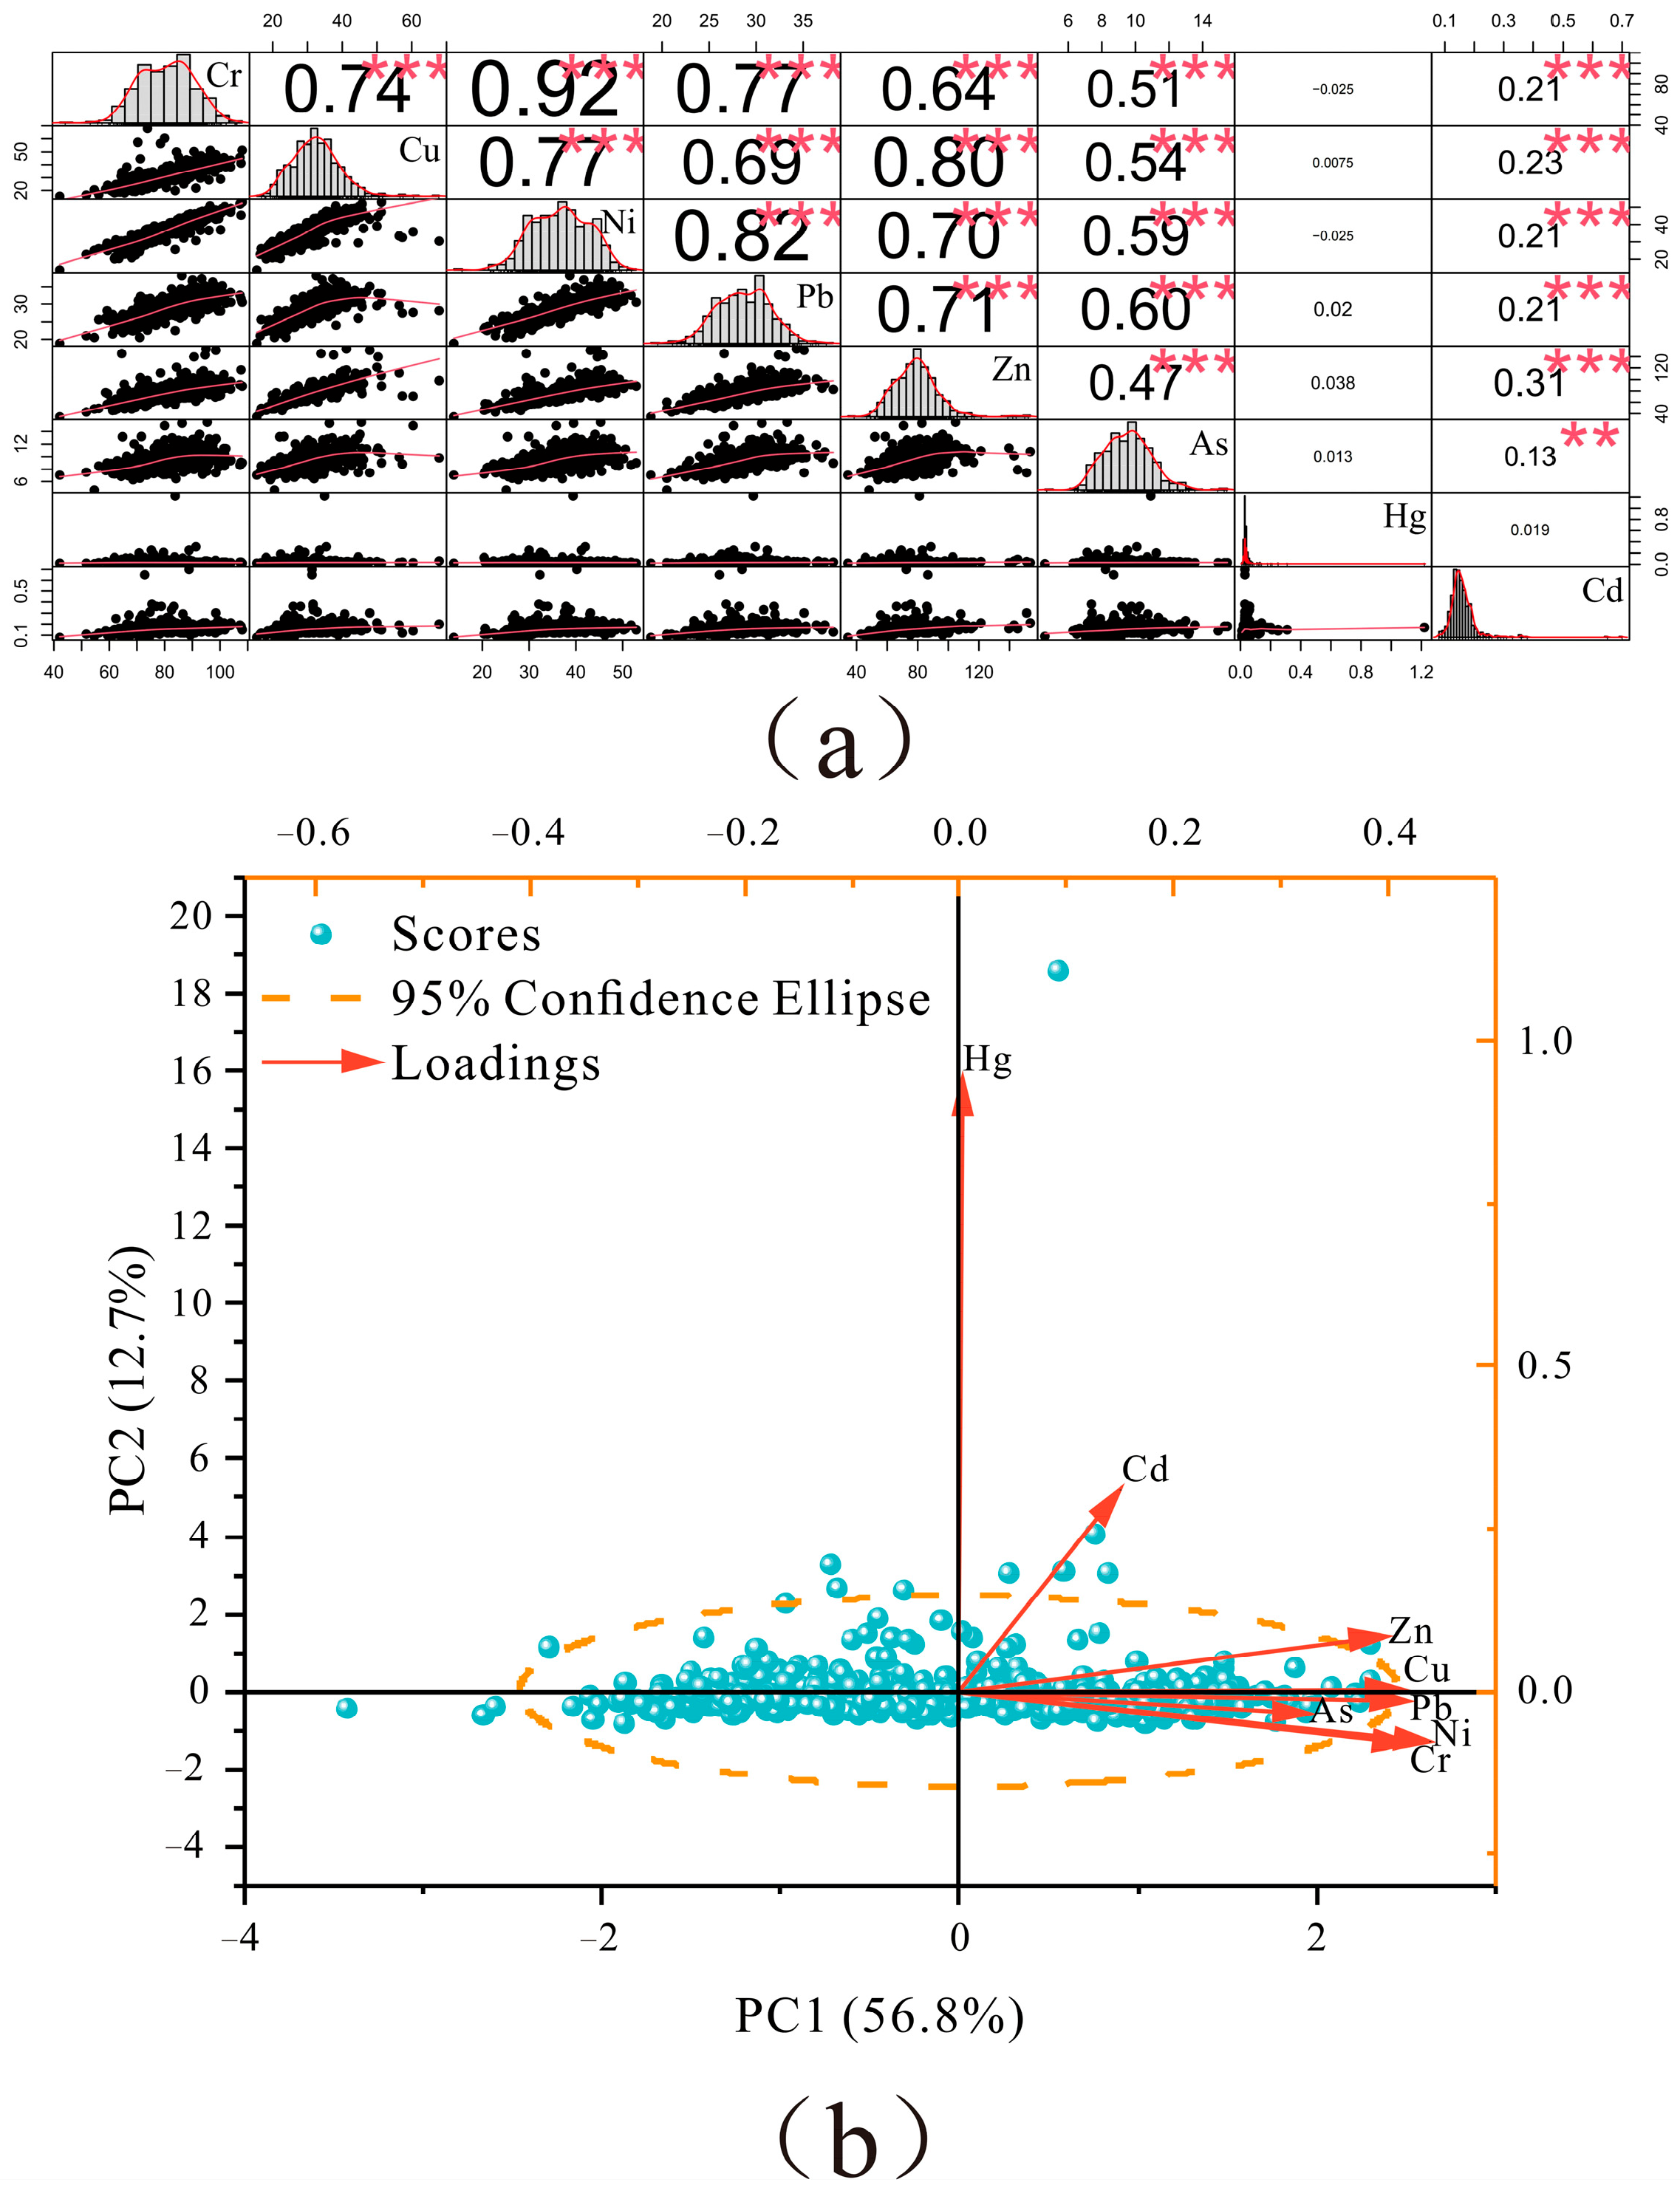
3.2. Soil Heavy Metal Correlation

The data for heavy metal elements in the soil samples from the study area were subjected to principal component analysis (PCA) (Table 3). The KMO value was 0.849, which is greater than 0.5 and close to 1. Bartlett’s spherical test significance (p-value) was 0.000, which is less than 0.05. According to a relevant standard [31], there was a good correlation among the sample data, and the analyzed results show correlations between heavy metal elements. The results of the principal component analysis are shown in Table 3 and Figure 2. The two factors with eigenvalues greater than 1 were selected as “meaningful” influencing factors, and their cumulative variance contribution was 69.416%. The percentage of variance for PC1 was 56.751%, with main loading elements being Cr, Cu, Ni, Pb, Zn, As, and Cd, while the percentage of variance for PC2 was 12.665%, with the main loading elements being Hg and Cd. The results of the correlation analysis (Figure 2) reveal a strong correlation between Cr, Cu, Ni, Pb, Zn, and As; no significant correlation between Hg and other elements; and a weak correlation between Cd and Cr, Cu, Ni, Pb, Zn, and As. The correlation analysis along with the scatter plot from the correlation matrix indicates that the studied elements can be roughly divided into two categories: category (1): Cr, Cu, Ni, Pb, Zn, and As; category (2): Hg and Cd (Figure 2b).

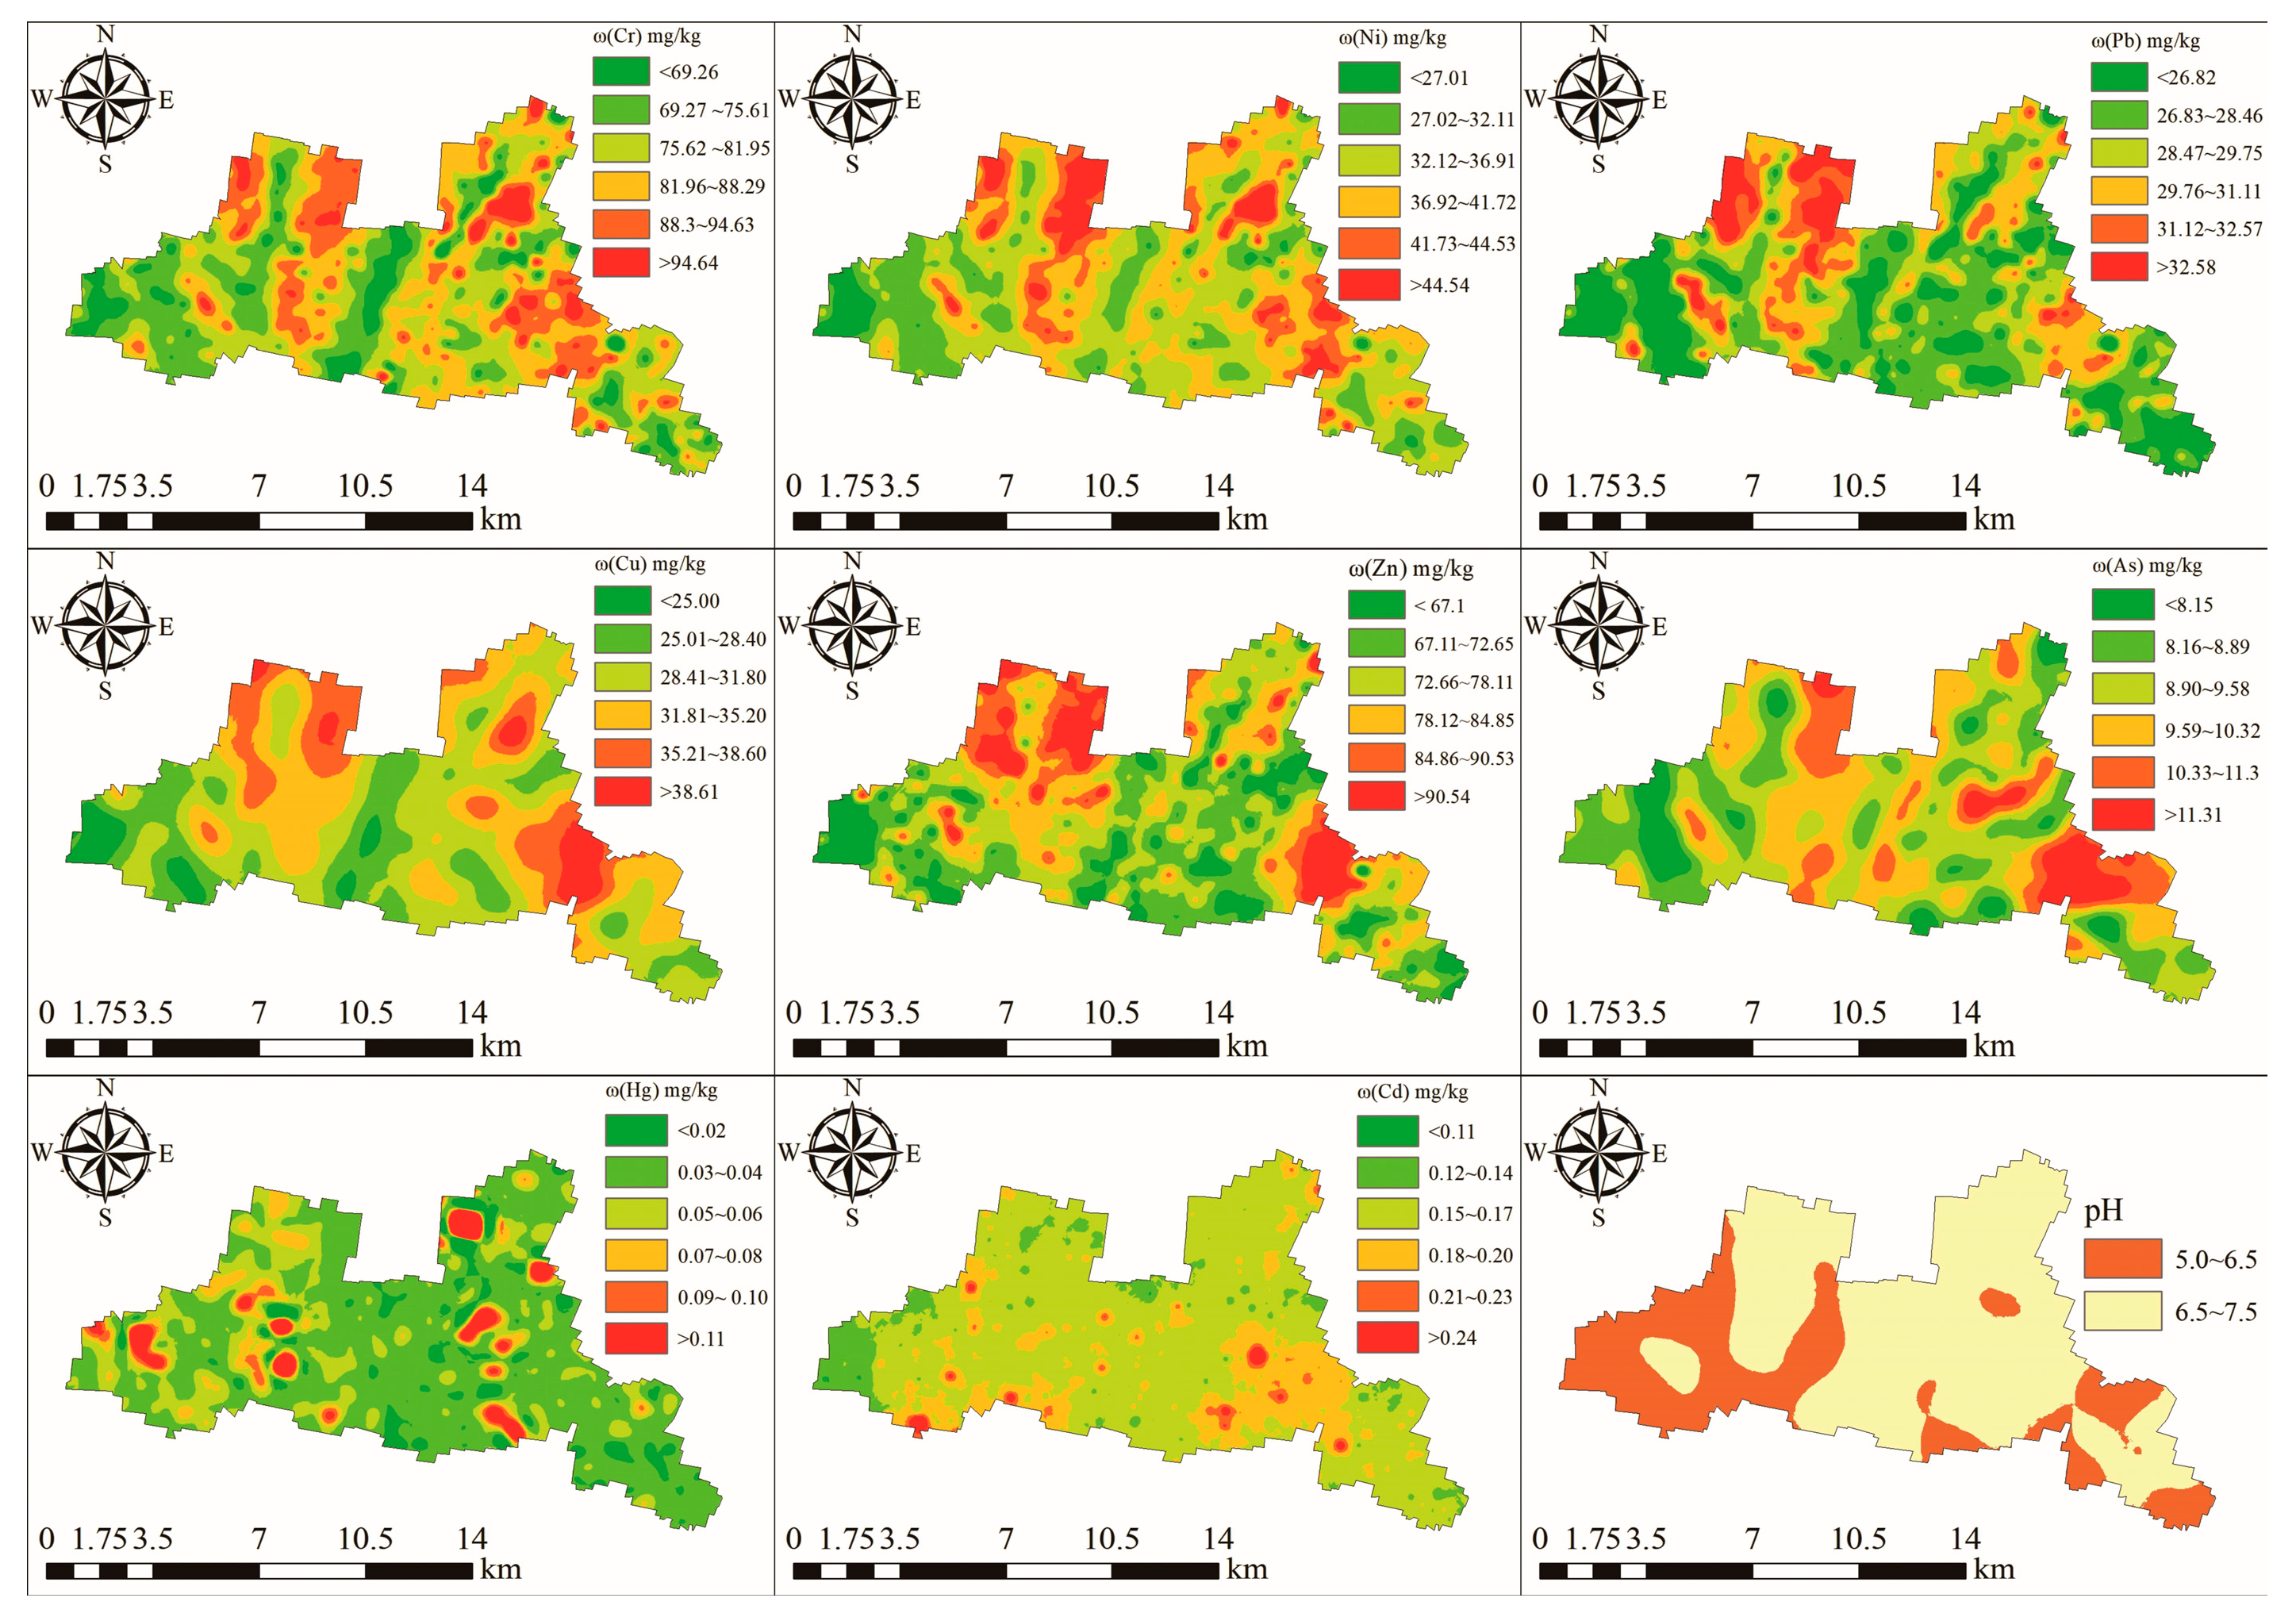
3.3. Characteristics of Spatial Distribution of Heavy Metals in Soil

The spatial distribution of heavy metal elements can be used to visualize the distribution characteristics of these elements and their correlations [25]. The spatial distribution of heavy metals in the study area is illustrated in Figure 3. This distribution can be categorized into four groups. (1) The spatial distribution characteristics of Cr, Ni, and Pb show very high similarity, with areas with a relatively high content and areas with a relatively low content distributed in a strip-like manner. (2) The spatial distribution of Cu, Zn, and As also exhibits high similarity, with areas with a relatively high content coinciding with agricultural land in the multi-study area. (3) The spatial distribution of Hg differs from that of the other elements; its areas with a relatively high content are coherent in a certain direction and exhibit a low–high–low trend. (4) The distribution of Cd is also different from that of other elements; its area with a relatively high content is mainly located on the right side at the center middle part of the study area as well as a small region in the southern part; this central area serves as the administrative center for the town crossed by provincial highways and has a higher population density that is likely related to traffic activities. Lastly, the pH values are mostly close to neutral, except for the weakly acidic conditions found in western parts.

3.4. Spatial Correlation Analysis

The spatial autocorrelation analysis tool in ArcGIS was used to analyze the soil heavy metal elements in this study area. The calculation results (Table 4) show that the global Moran’s index of the eight heavy metal elements in the study area is greater than 0, and the p-value for these elements is less than 0.05, except for Cd; additionally, the z-score for these elements is greater than 2.58, except for Hg. The significance of the Moran’s index graph (Figure 4) indicated that, except for Cd and Hg, the remaining elements exhibited a high spatial autocorrelation.

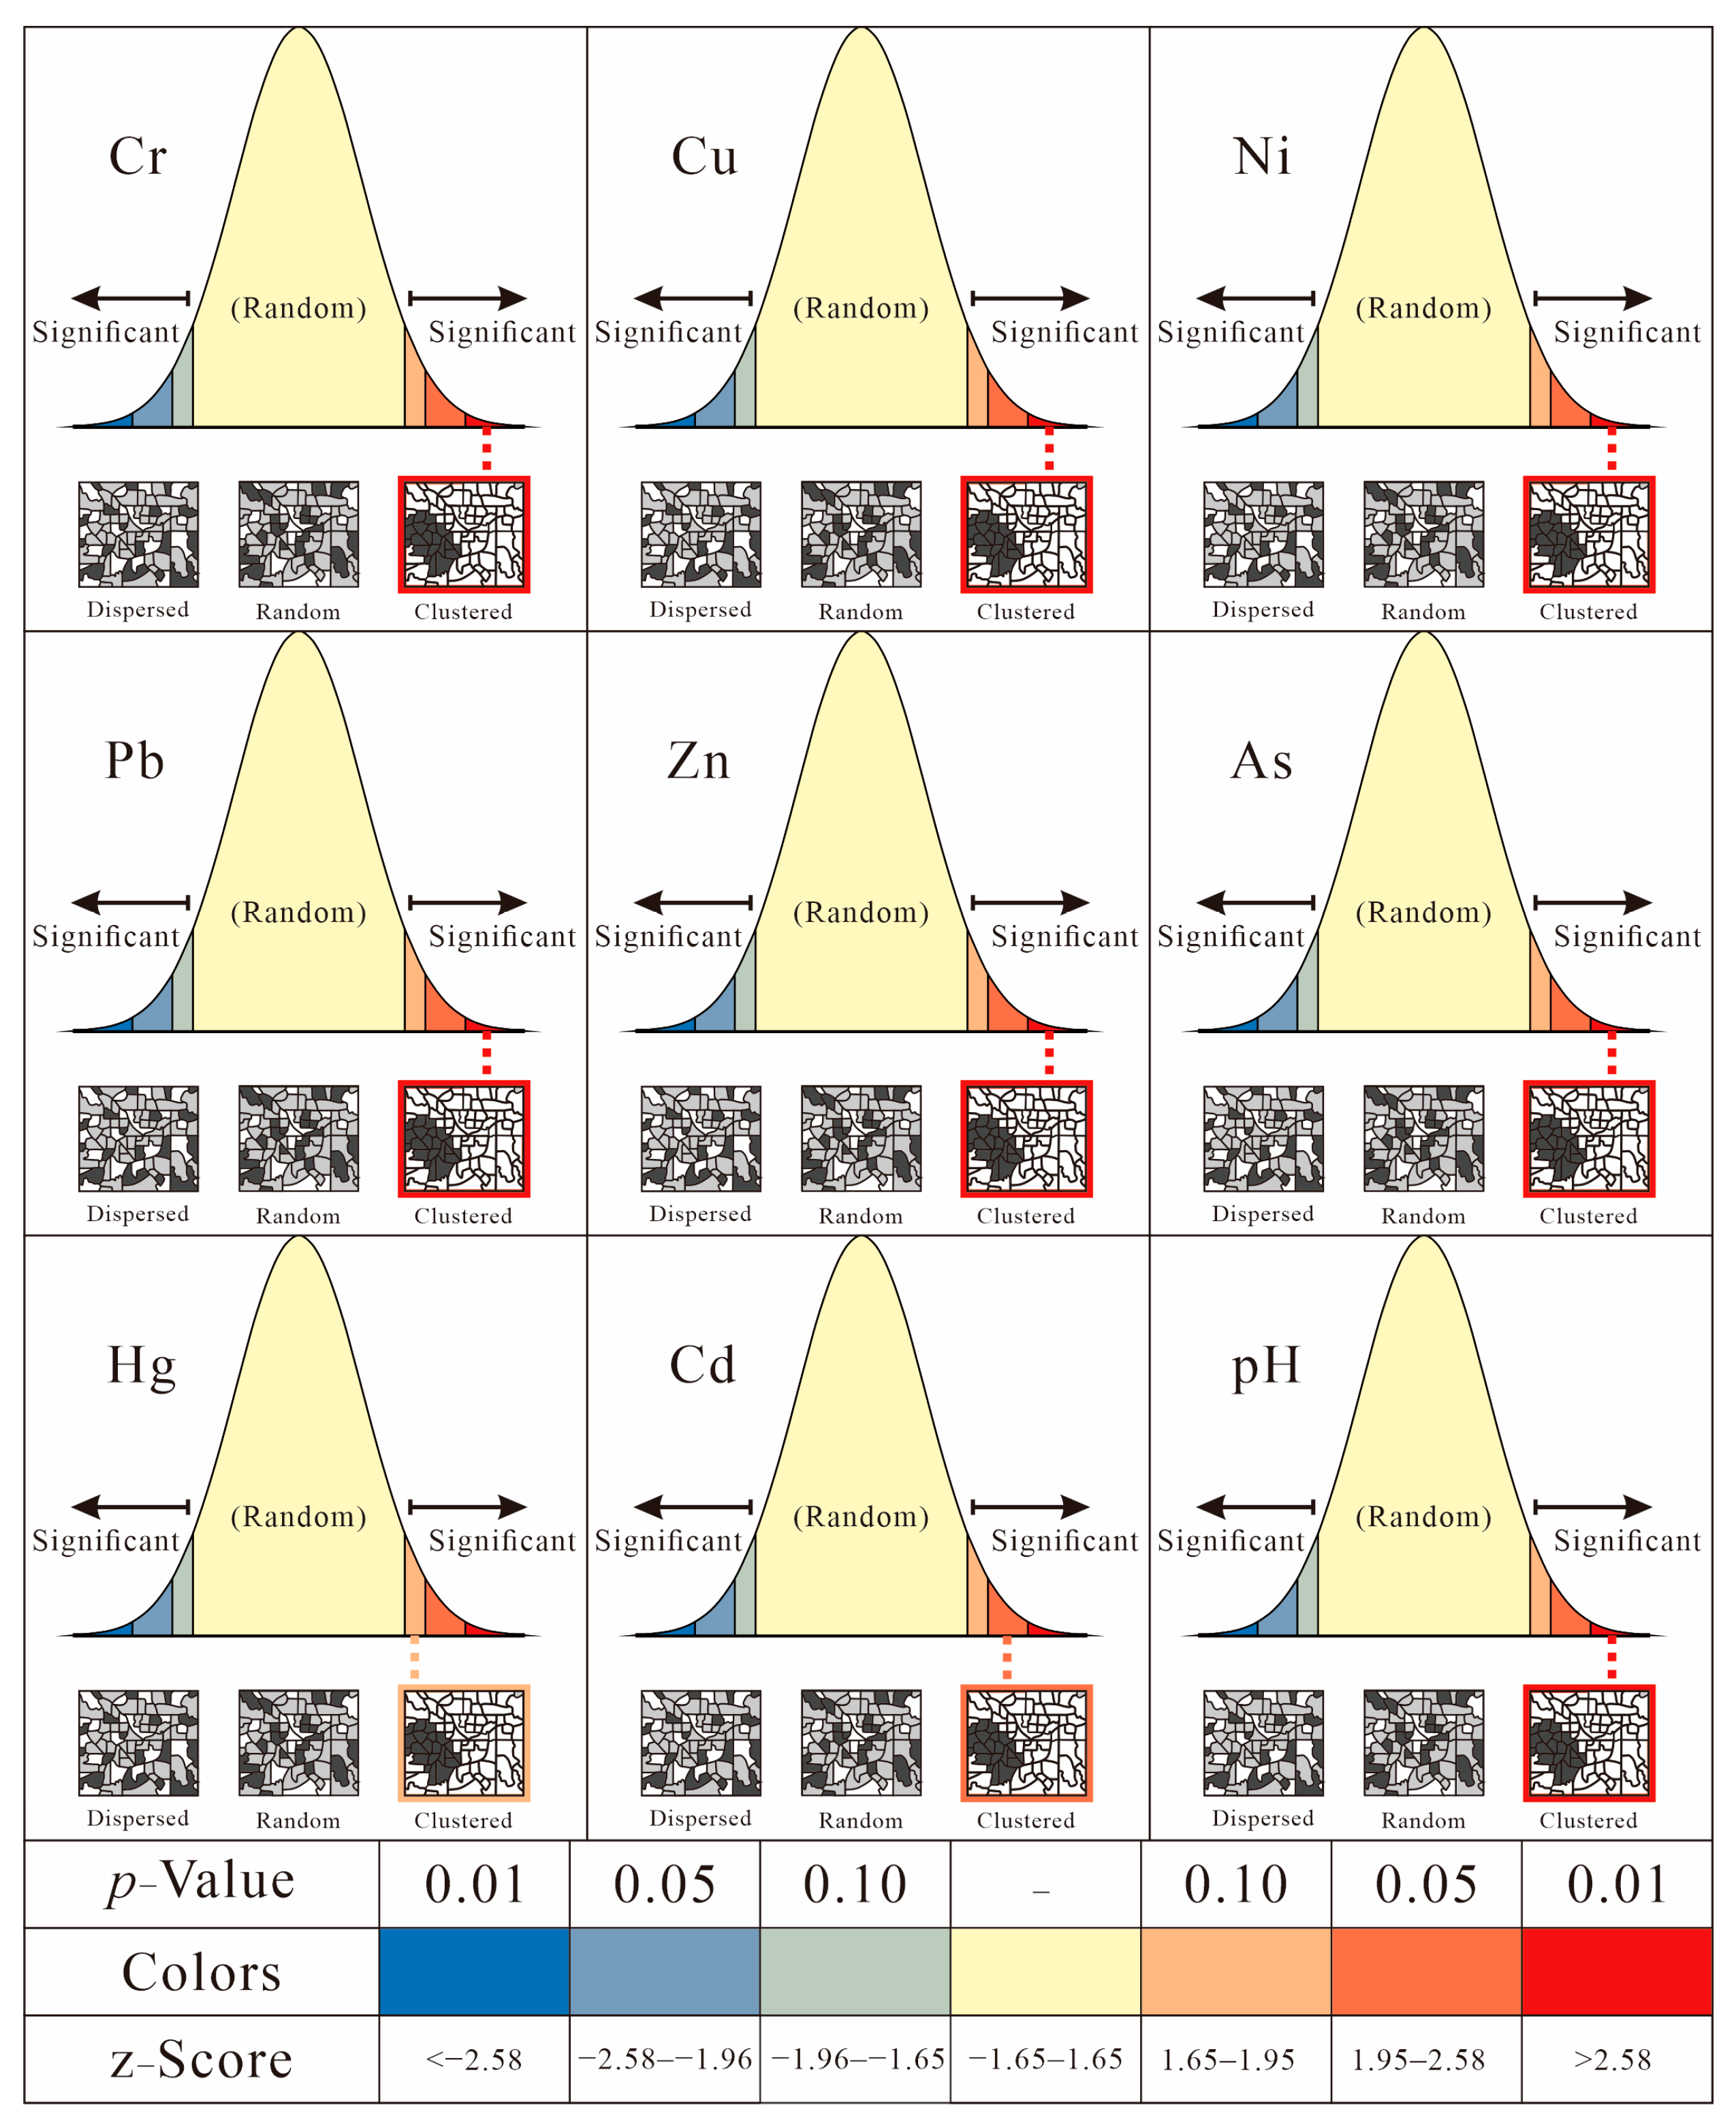
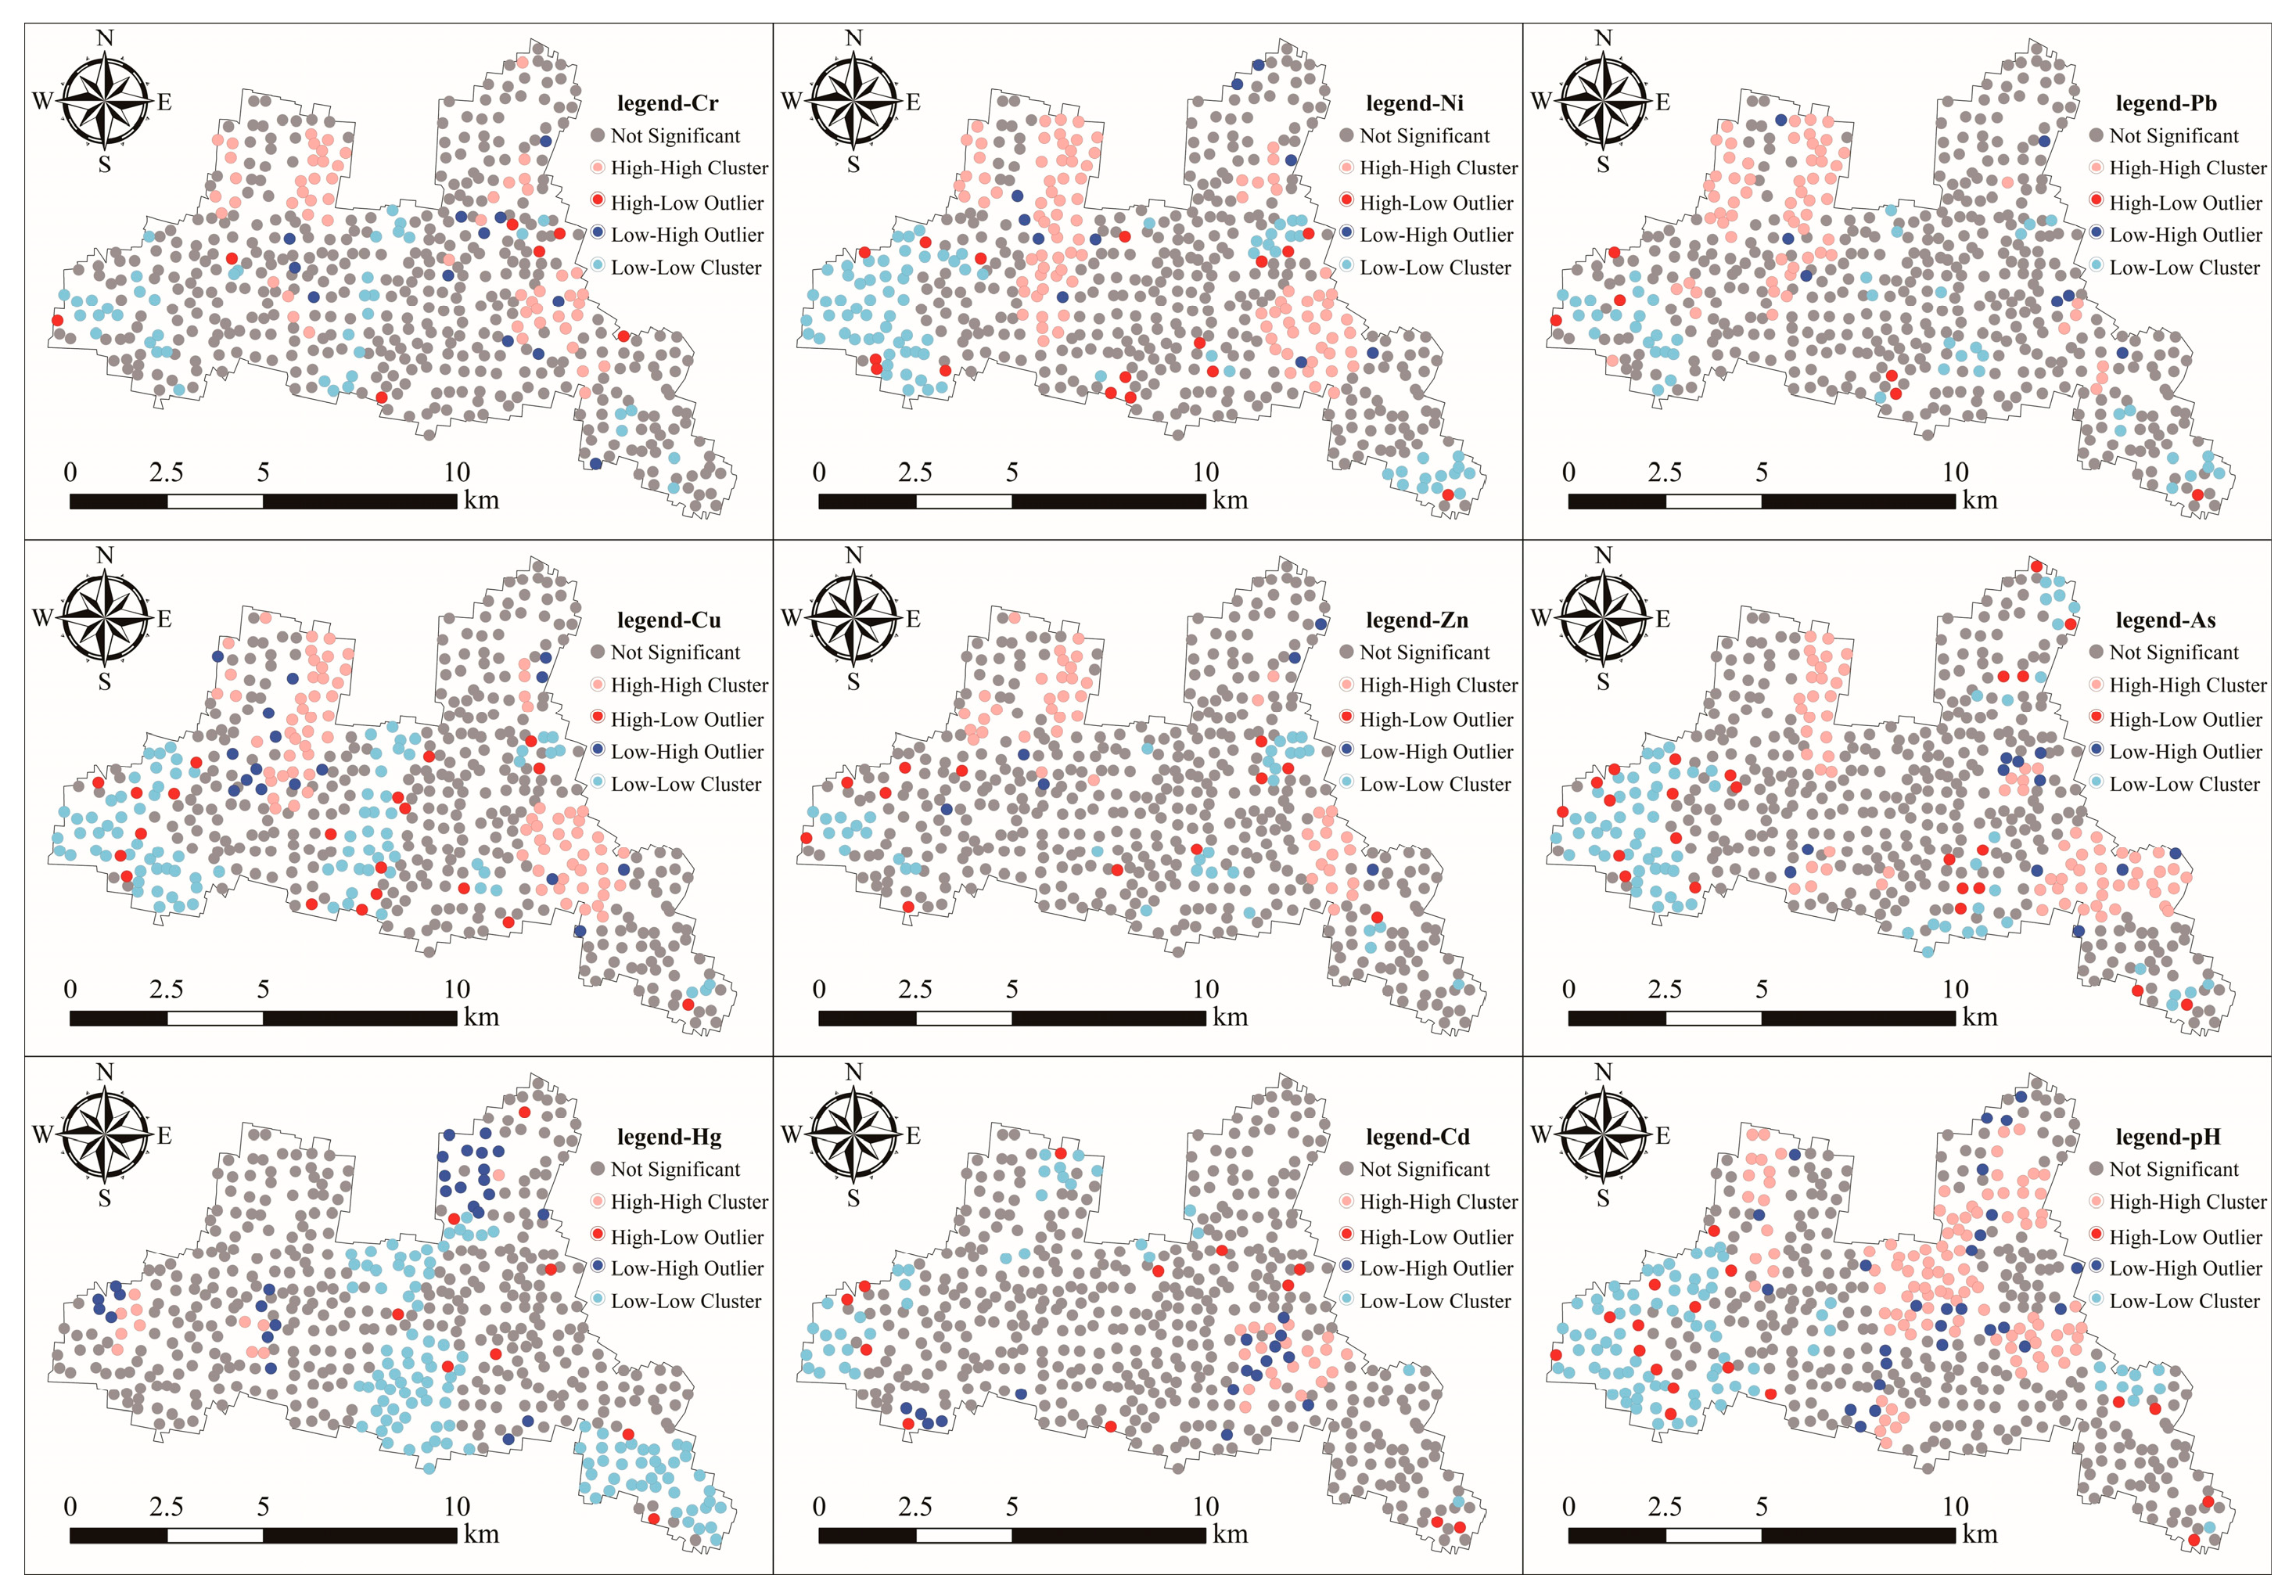
3.5. Spatial Cluster Analysis

The clustering types of heavy metal elements identified by local Moran’s I are commonly utilized to infer potential pollution sources within a region. The spatial clustering results for Cr, Ni, and Pb were found to be highly consistent, with their high–high clusters patterns exhibiting a notable correspondence to geological conditions. This spatial correspondence implies geogenic origins (Figure 5). Cu and Zn also exhibit similar aggregation results, with their high–high cluster patterns mainly found in the northwestern and southeastern sectors of the study area. The distribution of these two elements was in the vicinity of irrigation river bends and agricultural fields, suggesting that Cu and Zn may originate from agricultural activities. The distribution of As is similar to that of Cu and Zn; it is primarily located in the silkworm seed farm in the northwest part of the study area as well as along river bends in its southeast region, resembling a faceted distribution; a small amount is also observed in the south-central part as a point source. High–high cluster patterns for Cd appeared in the southeastern part of the study area near both its administrative center and large irrigation rivers while simultaneously indicating a high level of pollution. The spatial aggregation pattern for Hg is more complex, mainly consisting of low–low clusters distributed across central and southeastern areas; however, its high-high cluster patterns show a point-source distribution.
A comprehensive analysis of the distribution characteristics of the spatial aggregation types of the eight heavy metal elements in the study area showed that the high–high aggregation types of Cr, Ni, Pb, Cu, Zn, As, and Cd were mainly distributed in the northwestern and southeastern parts of the study area, whereas the low–low aggregation types were primarily found in the western part. The spatial aggregation type of Hg has complex characteristics; it is mainly a low–low aggregation type, while its high–high aggregation types are more pronounced. The spatial aggregation characteristics of various heavy metal elements in the study area exhibit similar distributions that are primarily controlled by two factors: anthropogenic and natural influences.

3.6. Soil Heavy Metal Risk Evaluation

The results of the geoaccumulation index calculation show that the average value of soil heavy metal Igeo in the study area, in descending order, is as follows: As > Ni > Cr > Cu > Cd > Hg > Zn > Pb. Among them, Pb showed no contamination in the study area; most points for Cr, Cu, Ni, Zn, Hg, and Cd also showed no contamination, while a small number of points exhibited mild to moderate contamination. Among the studied heavy metals, As was relatively more polluting, with 41.99% of its points showing mild to medium pollution and the remaining points showing no pollution (Table 5). The results of the ecological risk evaluation for single metals (Table 6) indicate that Cr, Cu, Ni, Pb, Zn, and As are the least polluting to the study area and all exhibit slight ecological hazards; Hg poses a moderate ecological hazard, with 74.22% of its points falling into this category, while 16.02% are classified as slight ecological hazards, and 7.03%, 1.95%, and 0.78% represent severe ecological hazards, high ecological hazards, and very high ecological hazards, respectively. Cd was mainly a slight ecological hazard, with 65.04% of its points falling into this category; additionally, 33.79% were moderate ecological hazards, while there were also reports of heavy (0.98%) and high (0.20%) ecological hazards. The comprehensive ecological risk index for soil heavy metals in the study area showed that 85.74% of points were slight ecological hazards, 12.89% were moderate, 1.17% were high, and 0.20% were very high.

3.7. Heavy Metal Source Analysis

The PMF source analysis of soil heavy metals in the study area was conducted by running the model, importing the relevant files, and inputting the heavy metal content data along with the corresponding uncertainty data reflecting that the heavy metal S/N ratios are larger (the ratio for Cd is 9.8; the other ratios are all 10). The number of factors was set to 3, 4, and 5, and an initial point was randomly selected to run the software once. The optimal number of factors was determined by comparing QRobust/QTrue for different factor numbers. The operation results show that, when the number of factors is 5, QRobust = 2215.6 and QTrue = 2375.8 for the model; additionally, there are 15 data points exceeding standard residuals (−3~3). The calculation scheme was stable, the model fitting results were good, and this number of factors could sufficiently explain the sources of heavy metals. Therefore, this number of factors was considered as the optimal solution for the model. The analytical results indicate that factors 1, 2, 3, 4, and 5 make high contributions to Cu and Zn; As; Cd; Cr, Ni, and Pb; and Hg, respectively (Figure 6). These parsing results are similar to those from the correlation analysis.
Factor 1 made a high contribution to Cu and Zn, with contributions of 65.9% and 68.8%, respectively. Comprehensive previous studies have found that the sources of Cu and Zn are mainly related to regional rock distribution, the use of chemical fertilizers and pesticides, and the discharge of sewage/wastewater [32,33,34]. The study area is a typical farming zone; therefore, the sources of Cu and Zn are more likely related to the use of chemical fertilizers and pesticides. The long-term application of these substances can lead to the serious accumulation of heavy metal elements in the soil. The high-value areas for Cu and Zn were mostly distributed along rivers where agricultural production was more active. The presence of rivers facilitates spraying pesticides and applying fertilizers. Additionally, greenhouse planting occurs in areas with relatively high Cu and Zn contents, as this method requires large amounts of chemical fertilizers and pesticides. Therefore, this study suggests that the source of Cu and Zn in the study area may be linked to fertilizer and pesticide usage in agricultural activities.
Factor 2 made a high contribution of 34.0% to As, which is a component of pesticides; the use of pesticides containing As can lead to excessive levels of As in soil [35]. As is related not only to the use of fertilizers and pesticides, but also to industrial manufacturing and animal excreta [28,36]. A large sericulture farm exists in the northern part of the study area, where sericulture production requires the cultivation of mulberry trees, which are perennial trees capable of absorbing heavy metal elements. The planting of mulberry trees necessitates spraying a large quantity of chemical fertilizers and pesticides, with some amount of As from these substances inevitably transferred to mulberry leaves. In the process of sericulture, silkworms consume mulberry leaves containing As, resulting in accumulation within their bodies; this accumulated As is then excreted through feces and used as organic fertilizer on-site. Coupled with previous applications of As-containing fertilizers and pesticides, this leads to further accumulation in soil. The eastern part of the study area is dominated by garlic planting, processing, and storage industries; thus, the use of fertilizers and pesticides during garlic cultivation is very high (more than 300 kg per mu for fertilizers and more than 200 g per mu for pesticides). The substantial amounts used inevitably result in increased elemental As accumulation in soil. Therefore, this study suggests that sources contributing to elevated levels may include animal manure as well as chemical fertilizers and pesticides.
Factor 3 made the highest contribution to Cd, with a contribution rate of 63.7%. Cd has different sources in different environments and plays an important role in smelting activities, electroplating processes, and industrial synthesis. It can enter the environment and subsequently contaminate soil through industrial waste, which can harm the soil [37]. Cd is more likely to accumulate in soil than in animal waste due to its use in fertilizers and pesticides. Meanwhile, previous studies have found that Cd is highly correlated with Pb and Zn, which are released during mineral development as well as fuel combustion and tire wear. As an important ecological risk element, Cd is usually associated with transportation [38,39]; it is also linked to the use of fertilizers, pesticides, plastic films, and agricultural waste emissions [40,41]. In this study, several high-value areas of Cd were found to have a strong correlation with concentrated distributions of settlements—often implying a high concentration of transportation activity. Additionally, the high values of Cd were mostly located near agricultural land at river bends; this proximity indicates agricultural production practices that inevitably lead to heavy metal accumulation during farming activities [42,43]. During agricultural production processes, Cd present in pesticides enters water bodies or remains in the soil; local irrigation using river water contributes further to cadmium accumulation on farmland. Therefore, this study suggests that the main sources of Cd are related to fuel combustion in transportation, tire wear and tear, and agricultural waste emissions from agricultural activities.
Factor 4 made a high contribution to Cr, Ni, and Pb, with contribution rates of 50.2%, 47.1%, and 36.8%, respectively. Cr and Ni are often clustered together, showing a high correlation in many studies. Furthermore, Cr and Ni are related to soil-forming matrices and processes [44,45]. Other studies have shown that Cr and Ni are frequently associated with the combustion of coal or fossil fuels [1], the use of fertilizers and pesticides [46], transportation [47], and smelting activities [42]. Pb is equally related to the above factors [39,48,49,50]. However, a comparison of regional geological maps along with correlation analysis revealed that Cr, Ni, and Pb have strong correlations; their spatial distributions are banded with some overlap with the local geological background. The distribution of high-value zones is mostly related to Qhl stratigraphy, while low-value zones primarily relate to Qhf stratigraphy. Therefore, in this study, Cr, Ni, and Pb were considered as geological causes.
Factor 5 made the highest contribution of 80.0% to Hg. This result is similar to that of a previous correlation analysis. It was found that there is a thermal power plant in the northwestern part of the study area, which mainly incinerates waste to generate electricity. Previous studies have shown that a large number of pollutants, such as acid gases, heavy metals, and dioxins, are generated during waste incineration [51]. These pollutants are transported over long distances by the dominant winds in the area and are finally deposited on the soil [52]. One of the most serious environmental impacts is Hg pollution [53]. The Hg level was low in areas closer to the power plant, while its content farther away from it was high; additionally, the spatial distribution of Hg showed a low–high–low trend, consistent with previous studies on its spatial distribution characteristics around power plants [54]. Combined with local topography, high-value areas may be present along the downwind direction of locally dominant winds. Therefore, this study suggests that Hg formation is related to waste incineration at power plants.
Based on the above analysis, there are five main sources of soil heavy metals in the study area: fertilizer and pesticide sources; mixed sources of fertilizers, pesticides, and manure; mixed sources of traffic activities and agricultural waste discharge; natural sources; and incineration sources. The contribution of each source is 32.28%, 14.15%, 19.95%, 20.55%, and 13.07%. Factor 3 and Factor 5 only had high loadings for Cd and Hg, which accounted for 39.6% of the total proportion of pollution sources. Hg pollution showed regular changes, while Cd mostly caused moderate to severe pollution based on the evaluation methods used; therefore, this study considers Cd to be the main polluting element in the study area.

4. Conclusions

(1) The average values of heavy metals in the soil in the study area exceeded the background values for soil in Linyi City, indicating heavy metal accumulation in the soil. The contents of Cr, Cu, Ni, Pb, Zn, and As in the soil were lower than the screening values specified in GB 15618-2018, which indicates their low ecological risk; however, the maximum values of Hg and Cd exceeded the recommended risk screening values, while their overall risk remained low. This comprehensive evaluation shows that Hg and Cd are the main risk elements in the study area.
(2) The spatial distribution of soil heavy metals is quite diverse; Cr, Ni, and Pb are distributed in strips, while As, Cu, Zn, and Cd are mainly found in the northwestern and southeastern parts of the study area. The coefficient of variation for Hg is very high, indicating regularity in its spatial distribution.
(3) Spatial statistical analysis shows that some high-value points for heavy metals are primarily located in agricultural cultivation areas in the northwestern part and river bends in southeastern regions; thus, these two areas are considered as highly polluted regions within this study area.
(4) The PMF results show that the sources of soil heavy metals in the study area are classified into five categories: fertilizer and pesticide sources; mixed sources of fertilizers, pesticides, and manure; mixed sources of traffic activities and agricultural waste discharge; natural sources; and incineration sources. Their contribution rates are 19.3%, 27.8%, 16.1%, 13.3%, and 23.5%.

Supplementary Materials

The following supporting information can be downloaded at: https://www.mdpi.com/article/10.3390/agriculture15131360/s1, Figure S1: Distribution of transportation streams in the study area; Figure S2: Geological map of the study area.

Author Contributions

Conceptualization, Z.Z., L.Y., H.F. and Z.S.; methodology, Z.Z. and L.Y.; writing—original draft preparation, Z.Z., L.Y., H.F. and Z.S.; writing—review and editing, Z.Z., L.Y. and Z.S.; visualization, Z.Z. and L.Y.; supervision, H.F. and F.W.; project administration, H.F.; funding acquisition, H.F. and L.Y. All authors have read and agreed to the published version of the manuscript.

Funding

This research was funded by the Shandong Geological Exploration Project (grant nos. 2019(44) and 2020(58)), the Science and Technology Innovation Project (grant no.KY202227) of Shandong Provincial Bureau of Geology & Mineral Resources, the Henan Provincial Science and Technology Key Research and Development Project (252102320218), and the Key Scientific Research Projects Plan of Colleges and Universities in Henan Province (25A170002).

Data Availability Statement

The data presented in this study are available on request from the corresponding authors. The processed data are not publicly available, as the data are also part of an ongoing study.

Acknowledgments

The authors would like to thank the editors and reviewers for their valuable comments and suggestions.

Conflicts of Interest

The authors declare no conflicts of interest.

References

  1. Hu, W.Y.; Wang, H.F.; Dong, L.R.; Huang, B.A.; Borggaard, O.K.; Hansen, H.C.B.; He, Y.; Holm, P.E. Source identification of heavy metals in peri-urban agricultural soils of southeast China: An integrated approach. Environ. Pollut. 2018, 237, 650–661. [Google Scholar] [CrossRef] [PubMed]
  2. Liu, G.N.; Wang, J.; Liu, X.; Liu, X.H.; Li, X.S.; Ren, Y.Q.; Wang, J.; Dong, L.M. Partitioning and geochemical fractions of heavy metals from geogenic and anthropogenic sources in various soil particle size fractions. Geoderma 2018, 312, 104–113. [Google Scholar] [CrossRef]
  3. Zhang, L.P.; Ye, X.; Feng, H.; Jing, Y.H.; Ouyang, T.; Yu, X.T.; Liang, R.Y.; Gao, C.T.; Chen, W.Q. Heavy metal contamination in western Xiamen Bay sediments and its vicinity, China. Mar. Pollut. Bull. 2007, 54, 974–982. [Google Scholar] [CrossRef] [PubMed]
  4. Frohne, T.; Rinklebe, J.; Diaz-Bone, R.A. Contamination of Floodplain Soils along theWupper River, Germany, with As, Co, Cu, Ni, Sb, and Zn and the Impact of Pre-definite Redox Variations on the Mobility of These Elements. Soil Sediment Contam. 2014, 23, 779–799. [Google Scholar] [CrossRef]
  5. Nachman, K.E.; Punshon, T.; Rardin, L.; Signes-Pastor, A.J.; Murray, C.J.; Jackson, B.P.; Guerinot, M.L.; Burke, T.A.; Chen, C.Y.; Ahsan, H.; et al. Opportunities and Challenges for Dietary Arsenic Intervention. Environ. Health Persp. 2018, 126, 8–084503. [Google Scholar] [CrossRef]
  6. Dai, X.Y.; Liang, J.H.; Shi, H.D.; Yan, T.Z.; He, Z.X.; Li, L.; Hu, H.L. Health risk assessment of heavy metals based on source analysis and Monte Carlo in the downstream basin of the Zishui. Environ. Res. 2024, 245, 117975. [Google Scholar] [CrossRef]
  7. Yang, L.X.; Meng, F.H.; Ma, C.; Hou, D.W. Elucidating the spatial determinants of heavy metals pollution in different agricultural soils using geographically weighted regression. Sci. Total Environ. 2022, 853, 158628. [Google Scholar] [CrossRef]
  8. Baktemur, G. The Effect of Some Heavy Metals on the Growth of Garlic under In Vitro Conditions. Hortscience 2022, 58, 1–5. [Google Scholar] [CrossRef]
  9. Soudek, P.; Petrová, S.; Vaněk, T. Heavy metal uptake and stress responses of hydroponically cultivated garlic (Allium sativum L.). Environ. Exp. Bot. 2011, 74, 289–295. [Google Scholar] [CrossRef]
  10. Dong, H.X. Effects of Lead and Cadmium Stress on Some Physiological and Biochemical Indicators of Garlic. J. Shangrao Norm. Univ. 2012, 32, 76–80. Available online: https://link.cnki.net/urlid/36.1241.C.20120913.1507.009 (accessed on 21 June 2025).
  11. Zhuang, Y.N. Current Status and Strategies for Enhancing Economic Benefits of the Garlic Industry in Linyi. Spec. Econ. Anim. Plants 2025, 28, 174–176. Available online: https://kns.cnki.net/kcms2/article/abstract?v=a4fp6zKrpgYswCb29ZQ2Km9g-t8CrDk5QGRUFSc8PKWen0578Erwpa5HqVWLIdmtH5A2ePf5SEAFE2JnJzRvni-p0a372QAay97Oooz-weSj5eQRAYGtJYMHOY8dv2z60PifYPmOPfGEekej_BsXilsmjKzoYvrnZ83k9nvurR09wFd41iNeZ-DW8gm6ZJ6a&uniplatform=NZKPT&language=CHS (accessed on 21 June 2025).
  12. Hu, Y.H.; Wang, H.X.; Wang, Z.K.; Wang, C.W.; Zhao, B.; Fu, Q.L.; Ning, F.Z.; Hu, J.C.; Shen, Q. Geochemical Characteristics and Environmental Quality Evaluation of Heavy Metal Elements in Soils of Qi County Garlic Planting Area. J. Anhui Agric. Sci. 2006, 1411–1412. Available online: https://link.cnki.net/doi/10.13989/j.cnki.0517-6611.2006.07.071 (accessed on 21 June 2025).
  13. Bo, L.J.; Li, B.; Zhang, R.Q.; Li, Y.P.; Li, Y.; Duan, G.; Gao, X.H. Characteristics of Heavy Metals in Soils of Garlic Planting Areas in Jinxian County and Assessment of Potential Ecological Risks. Chin. J. Soil Sci. 2021, 52, 434–442. Available online: https://link.cnki.net/doi/10.19336/j.cnki.trtb.2020061601 (accessed on 21 June 2025).
  14. Li, Y.C. Research on Countermeasures for Livestock Farming Pollution Prevention and Control in Lanling County. Shandong Agricultural University, Tai’an, China. 2022. Available online: https://link.cnki.net/doi/10.27277/d.cnki.gsdnu.2022.000788 (accessed on 21 June 2025).
  15. Zhang, R.; Tian, Y. Climate suitability analysis of garlic planting in Luling County and meteorological service suggestions. J. South. Agric. 2022, 16, 158–161. Available online: https://link.cnki.net/doi/10.19415/j.cnki.1673-890x.2022.07.038 (accessed on 21 June 2025).
  16. Shu, P. Quantitative Study of the Latest Late Cenozoic Right-Slip Movement in the Tanlu Fault Zone and Its Tectonic Significance—Based on Tectonic and Sedimentary Constraints in the Panquan Lafen Basin; Institute of Geology, China Earthquake Administration, Beijing, China. 2023. Available online: https://link.cnki.net/doi/10.27489/d.cnki.gzdds.2023.000003 (accessed on 21 June 2025).
  17. DZ/T 0295-2016; Specifications for Geochemical Assessment of Land Quality. China National Standardization Management Committee: Beijing, China, 2016. Available online: https://g.mnr.gov.cn/201701/t20170123_1430074.html (accessed on 21 June 2025).
  18. Muller, G. Index of Geoaccumulation in Sediments of the Rhine River. Geo J. 1969, 2, 109–118. [Google Scholar]
  19. Hakanson, L. An ecological risk index for aquatic pollution control. A sedimentological approach. Water Res. 1980, 14, 975–1001. [Google Scholar] [CrossRef]
  20. Huang, X.Y.; Wang, L.; Pan, H.; Xie, F.F. Trends and spatial effects of PM 2.5 and PM 10 in the Yangtze River Delta urban agglomeration. Environ. Poll. Control 2021, 43, 1309–1315. Available online: https://link.cnki.net/doi/10.15985/j.cnki.1001-3865.2021.10.016 (accessed on 21 June 2025).
  21. Paatero, P. Least squares formulation of robust non-negative factor analysis. Chemometr. Intell. Lab. 1997, 37, 23–35. [Google Scholar] [CrossRef]
  22. Wang, Y.M.; Zhang, L.X.; Wang, J.N.; Lv, J.S. Identifying quantitative sources and spatial distributions of potentially toxic elements in soils by using three receptor models and sequential indicator simulation. Chemosphere 2020, 242, 125266. [Google Scholar] [CrossRef]
  23. Paatero, P.; Tapper, U. Positive matrix factorization: A non-negative factor model with optimal utilization of error estimates of data values. Environmetrics 1994, 5, 111–126. [Google Scholar] [CrossRef]
  24. Pang, X.G.; Dai, J.R.; Chen, L.; Liu, D.F.; Yu, C.; Han, L.; Ren, T.L.; Hu, X.P.; Wang, H.J.; Wang, Z.H.; et al. Geochemical Background Values of Soils in 17 Cities of Shandong Province. Shandong Land Resour. 2019, 35, 46–56. Available online: https://kns.cnki.net/kcms2/article/abstract?v=AGqaFAGiW5_z3AO_R29qOu0miP1WqkkImgnz3VV_9p1GQ3zoz5pfhiO3ymo7nJdmk6qnvnEa6AyyCliyJMLzsh2xK1EUtxrSVR7MoMJ58qXyaLi5prsILCeKvHu3dd_2CS0NUzC_ruG7NeS8SoCP0RCTqlOwKMA91palTtqeiGHYp2lcJSHomiZbUMNmsOwwwQbNcgU79XE=&uniplatform=NZKPT&language=CHS (accessed on 21 June 2025).
  25. Yu, L.S.; Wan, F.; Fan, H.Y.; Kang, G.L.; Liu, H.; Wang, D.P.; Xu, J. Spatial Distribution, Source Apportionment and Ecological Risk Assessment of Heavy Metals in Soils of the Jianghu Gongmi Production Area. China Environ. Sci. 2022, 43, 4199–4211. Available online: https://link.cnki.net/doi/10.13227/j.hjkx.202112133 (accessed on 21 June 2025).
  26. GB 15618; Soil Environmental Quality: Risk Control Standard for Soil Contamination of Agricultural Land. Ministry of Ecology and Environment: Beijing, China, 2018. Available online: https://www.mee.gov.cn/ywgz/fgbz/bz/bzwb/trhj/201807/t20180703_446029.shtml (accessed on 21 June 2025).
  27. Hu, Z.X.; Wu, Z.Y.; Luo, W.Q.; Liu, S.H.; Tu, C. Spatial distribution, risk assessment, and source apportionment of soil heavy metals in a karst county based on grid survey. Sci. Total Environ. 2024, 953, 176049. [Google Scholar] [CrossRef] [PubMed]
  28. Tang, J.L.; Zhao, K.; Hu, Y.X.; Xu, T.; Wang, Y.X.; Yang, Y.; Zhou, B.H. Characterization, source analysis and pollution evaluation of heavy metals in surface soil of Chuzhou City. China Environ. Sci. 2023, 44, 3562–3572. Available online: https://link.cnki.net/doi/10.13227/j.hjkx.202208031 (accessed on 21 June 2025).
  29. Anaman, R.; Chi, P.; Jiang, Z.C.; Liu, X.; Zhou, Z.R.; Guo, Z.H.; Xiao, X.Y. Identifying sources and transport routes of heavy metals in soil with different land uses around a smelting site by GIS based PCA and PMF. Sci. Total Environ. 2022, 823, 153759. [Google Scholar] [CrossRef]
  30. Wilding, L.P. Spatial variability: Its documentation, accomodation and implication to soil surveys. Spat. Var. 1985, 166–187. [Google Scholar]
  31. Zhuang, S.L. Environmental Data Analysis; Science Press: Beijing, China, 2020; pp. 63–67. [Google Scholar]
  32. Wei, A.N.; Jia, J.; Chang, P.Y.; Wang, S.L. Probabilistic risk assessment and source identification of heavy metals in soil-rice systems in northern area of Fujian Province, China. Ecol. Indic. 2025, 174, 113504. [Google Scholar] [CrossRef]
  33. Huang, M.Q.; Cheng, J.W.; Zeng, B.P.; Cai, S.W. Morphological Enrichment and Environmental Factors Correlation of Heavy Metals in Dominant Plants in Typical Manganese Ore Areas in Guizhou, China. Environ. Manag. 2024, 74, 942–957. [Google Scholar] [CrossRef]
  34. Zhong, X.L.; Zhou, S.L.; Zhao, Q.G.; Li, J.T.; Liao, Q.L. Synergistic regionalization analysis, spatial correlation analysis and spatial principal component analysis of the effective state of heavy metals in soils of the Yangtze River Delta. China Environ. Sci. 2007, 2758–2765. Available online: https://link.cnki.net/doi/10.13227/j.hjkx.2007.12.011 (accessed on 21 June 2025).
  35. Li, Z.C.; Wang, Y.H.; Chen, S.; Ma, J.; Wang, G.X.; Xu, X.G.; Huang, H.Y.; Zhu, Y.K. Pollution assessment and source analysis of heavy metals in sediment of Lake Tuohu in Huaihe River Basin. J. Lake Sci. 2025, 37, 889–901. Available online: https://link.cnki.net/urlid/32.1331.P.20250114.1423.002 (accessed on 21 June 2025).
  36. Zhu, B.L.; Kun, L.; Zhou, J.; Li, L. Analysis of Heavy Metal Sources and Sustainability: Human Health Risk Assessment of Typical Agricultural Soils in Tianjin, North China Plain. Sustainability 2025, 17, 3738. [Google Scholar] [CrossRef]
  37. Laniyan, T.A.; Popoola, O.J. Integrated Assessment of Heavy Metal Contamination in Urban Road Dust: Implications for Human Health and Ecosystem Sustainability in Abeokuta, Nigeria. Environ. Forensics 2024, 26, 204–222. [Google Scholar] [CrossRef]
  38. Xia, Y.F.; Liu, Y.H.; Chen, T.; Xu, Y.D.; Qi, M.; Sun, G.Y.; Wu, X.; Chen, M.J.; Xu, W.P.; Liu, C.S. Combining Cd and Pb isotope analyses for heavy metal source apportionment in facility agricultural soils around typical urban and industrial areas. J. Hazard. Mater. 2024, 466, 133568. [Google Scholar] [CrossRef] [PubMed]
  39. Cheng, Z.; Chen, L.J.; Li, H.H.; Lin, J.Q.; Yang, Z.B.; Yang, Y.X.; Xu, X.X.; Xian, J.R.; Shao, J.R.; Zhu, X.M. Characteristics and health risk assessment of heavy metals exposure via household dust from urban area in Chengdu, China. Sci. Total Environ. 2018, 619, 621–629. [Google Scholar] [CrossRef]
  40. Zhang, Y.Q.; Jiang, B.; Gao, Z.J.; Wang, M.; Feng, J.G.; Xia, L.; Liu, J.T. Health risk assessment of soil heavy metals in a typical mining town in north China based on Monte Carlo simulation coupled with Positive matrix factorization model. Environ. Res. 2024, 251, 118696. [Google Scholar] [CrossRef] [PubMed]
  41. Wang, Y.; Duan, X.; Wang, L. Spatial distribution and source analysis of heavy metals in soils influenced by industrial enterprise distribution: Case study in Jiangsu Province. Sci. Total Environ. 2020, 710, 134953. [Google Scholar] [CrossRef]
  42. Rao, Z.X.; Huang, D.Y.; Wu, J.S.; Zhu, Q.H.; Zhu, H.H.; Xu, C.; Xiong, J.; Wang, H.; Duan, M.M. Distribution and availability of cadmium in profile and aggregates of a paddy soil with 30-year fertilization and its impact on Cd accumulation in rice plant. Environ. Pollut. 2018, 239, 198–204. [Google Scholar] [CrossRef]
  43. Liu, H.W.; Zhang, Y.; Yang, J.S.; Wang, H.Y.; Li, Y.L.; Shi, Y.; Li, D.C.; Holm, P.E.; Ou, Q.; Hu, W.Y. Quantitative source apportionment, risk assessment and distribution of heavy metals in agricultural soils from southern Shandong Peninsula of China. Sci. Total Environ. 2021, 767, 144879. [Google Scholar] [CrossRef]
  44. Zhang, Y.X.; Song, B.; Zhou, Z.Y. Pollution assessment and source apportionment of heavy metals in soil from lead—Zinc mining areas of south China. J. Environ. Chem. Eng. 2023, 11, 109320. [Google Scholar] [CrossRef]
  45. Zeng, Y.; Jiang, Y.J.; Li, Y.Q. Early warning of urban heavy metal pollution based on PMF- MeteoInfo model combined with physicochemical properties of dust. Stoch. Environ. Res. Risk Assess. 2024, 38, 1541–1556. [Google Scholar] [CrossRef]
  46. Xia, Z.S.; Bai, Y.R.; Wang, Y.Q.; Gao, X.L.; Ruan, X.H.; Zhong, Y.X. Spatial distribution and source analysis of soil heavy metals in small watersheds of Ningnan mountainous area based on PMF model. China. Environ. Sci. 2022, 43, 432–441. Available online: https://link.cnki.net/doi/10.13227/j.hjkx.202105128 (accessed on 21 June 2025).
  47. Sprynskyy, M.; Kowalkowski, T.; Tutu, H.; Cozmuta, L.M.; Cukrowska, E.M.; Buszewski, B. The Adsorption Properties of Agricultural and Forest Soils Towards Heavy Metal Ions (Ni, Cu, Zn, and Cd). Soil Sediment Contam. 2011, 20, 12–29. [Google Scholar] [CrossRef]
  48. Pan, H.; Lu, X.; Lei, K. A comprehensive analysis of heavy metals in urban road dust of Xi’an, China: Contamination, source apportionment and spatial distribution. Sci. Total Environ. 2017, 609, 1361–1369. [Google Scholar] [CrossRef] [PubMed]
  49. Chen, T.B.; Zheng, Y.M.; Lei, M.; Huang, Z.C.; Wu, H.T.; Chen, H.; Fan, K.K.; Yu, K.; Wu, X.; Tian, Q.Z. Assessment of heavy metal pollution in surface soils of urban parks in Beijing, China. Chemosphere 2005, 60, 542–551. [Google Scholar] [CrossRef] [PubMed]
  50. Cheng, X.M.; Sun, B.B.; Wu, C.; He, L.; Zeng, D.M.; Chen, Z. Characterization of heavy metal content and health risk of agricultural soils in a typical sulfide iron ore area in central Zhejiang. China Environ. Sci. 2022, 43, 442–453. Available online: https://link.cnki.net/doi/10.13227/j.hjkx.202102161 (accessed on 21 June 2025).
  51. Wang, C.Y.; Shen, J.Z.; Tan, J.F.; Zhou, W.F.; Li, S.H.; Liu, H.J. Characterization of condensable particulate fractions in waste incineration power plants. Environ. Poll. Control 2022, 44, 1068–1073. Available online: https://link.cnki.net/doi/10.15985/j.cnki.1001-3865.2022.08.015 (accessed on 21 June 2025).
  52. Qi, D.W.; Chen, H.Y.; Hu, L.K.; Sun, J.C. Multimethod Analysis of Heavy Metal Pollution and Source Apportionment in a Southeastern Chinese Region. Appl. Sci. 2024, 14, 10559. [Google Scholar] [CrossRef]
  53. Lv, J.S. Multivariate receptor models and robust geostatistics to estimate source apportionment of heavy metals in soils. Environ. Pollut. 2019, 244, 72–83. [Google Scholar] [CrossRef]
  54. Fang, F.M.; Yang, D.; Wang, L.L.; Jiang, B.Y. Characterization of arsenic and mercury distribution in soils around Wuhu coal-fired power plant. J. Soil Water Conserv. 2010, 24, 109–113. Available online: https://link.cnki.net/doi/10.13870/j.cnki.stbcxb.2010.01.005 (accessed on 21 June 2025).
Figure 1. Overview of study area.
Agriculture 15 01360 g001
Figure 2. Scatter map of soil heavy metal correlation in study area: (a) scatter plot of the correlation matrix; (b) principal component score plot.
Agriculture 15 01360 g002
Figure 3. Spatial distribution of heavy metals and pH in soil surface from the study area.
Agriculture 15 01360 g003
Figure 4. Moran’s significance diagram of soil heavy metals.
Agriculture 15 01360 g004
Figure 5. Spatial distribution of cluster types of soil heavy metals.
Agriculture 15 01360 g005
Figure 6. Pollution source composition spectrum of heavy metal PMF analysis in soil in the study area.
Agriculture 15 01360 g006
Table 1. Classification criteria for potential ecological risks of heavy metals in soil.
Single-Metal Ecological Risk Index ( E r i )Composite Ecological Risk Index (RI)Potential Ecological Risk GradingSingle-Metal Ecological Risk Index ( E r i )Composite Ecological Risk Index (RI)Potential Ecological Risk Grading
E r i < 40RI < 150Slight ecological hazardous pollution160 ≤ E r i < 320600 ≤ RI < 1200Very high ecological hazard pollution
40 ≤ E r i < 80150 ≤ RI < 300Moderate ecological hazardous pollution E r i ≥ 320RI ≥ 1200Very high ecological hazardous pollution
80 ≤ E r i < 160300 ≤ RI < 600High ecological hazardous pollution
Table 2. Statistics of heavy metal content in surface soil of study area (mg·kg−1).
DataCrCuNiPbZnAsHgCdpH
Mean80.9031.5736.5828.7276.679.510.040.166.63
Standard deviation10.396.996.533.0615.171.440.060.050.67
Min42.1015.4013.9018.8034.304.610.010.084.53
Median81.2531.3036.8028.7076.259.520.030.156.66
Max108.0067.9052.9038.20153.6015.471.220.707.93
Skewness−0.090.70−0.11−0.011.010.4316.145.34−0.41
Kurtosis−0.301.81−0.50−0.123.530.91312.9548.67−0.27
Coefficient of variation %12.8522.1517.8410.6419.7915.13143.8930.5410.06
National soil background value # (A layer) (1)6122.626.92674.211.20.0650.0976.7
Jianghugongmi production area (2)68.2123.1325.5227.1562.447.160.040.13/
Linyi City background
value (3)
61.1023.7027.3026.164.506.500.0280.1256.43
Risk screening value (4)150507090200300.50.3pH ≤ 6.5
200100100120250250.60.36.5 < pH < 7.5
250100190170300201.00.6pH ≥ 7.5
(1) National soil background value# (A layer) [24]. (2) Jianghugongmi production area [25]. (3) Linyi City background value [24]. (4) Risk screening value [26].
Table 3. Eigenvalues of eigenvectors and correlation matrices extracted from principal component analysis.
Extracted EigenvectorsEigenvalues of Correlation Matrix
FactorCrCuNiPbZnAsHgCdEigenvaluePercentageof VarianceCumulative Variance
PC10.4200.4130.4390.4180.3970.3260.0030.1504.54056.75%56.75%
PC2−0.0810.003−0.077−0.0140.086−0.3420.9400.3081.01312.67%69.42%
Table 4. Distribution of heavy metal Moran’s indices in soil from the study area.
Heavy MetalExpected IndexVariancez-Scorep-ValueGlobal Moran′s Index
Cr−0.0019570.00024014.0855760.0000000.216458
Ni−0.0019570.00024118.3167940.0000000.282123
Pb−0.0019570.00024018.0280970.0000000.277543
Cu−0.0019570.00023912.2397690.0000000.187446
Zn−0.0019570.00023913.1146040.0000000.200643
As−0.0019570.00024016.4486760.0000000.252800
Cd−0.0019570.0002182.0790410.0376140.028709
Hg−0.0019570.0000941.6841030.0921620.014380
Table 5. Distribution of soil heavy metal geological accumulative index in the study area.
Heavy MetalMean Value of IgeoPercentage of Samples by Grade
Igeo ≤ 0Percentage0 < Igeo ≤ 1Percentage1 < Igeo ≤ 2Percentage2 < Igeo ≤ 3Percentage3 < Igeo ≤ 4Percentage4 < Igeo ≤ 5PercentageIgeo > 5Percentage
Cr−0.1943584.96%7715.04%//////////
Cu−0.2138274.61%13025.39%//////////
Ni−0.1938675.39%14428.13%//////////
Pb−0.46512100.00%////////////
Zn−0.3647592.77%377.23%//////////
As−0.0529758.01%21541.99%//////////
Hg−0.2842583.01%6913.48%112.15%6///10.20%//
Cd0.2642482.81%8516.60%30.59%////
Table 6. Distribution of potential ecological risk index of heavy metals in soil in the study area.
Type of Hazard IndexHeavy MetalMean Value of PERIPercentage of Samples by Grade
Slight Ecological Hazardous PollutionPercentageModerate Ecological Hazardous PollutionPercentageHigh Ecological Hazardous PollutionPercentageVery High Ecological Hazard PollutionPercentageVery High Ecological Hazardous PollutionPercentage
E r i Cr2.65512100%////////
Cu6.66512100%////////
Ni6.70512100%////////
Pb5.50512100%////////
Zn1.19512100%////////
As14.62512100%////////
Hg58.658216.02%38074.22%367.03%101.95%40.78%
Cd38.6333365.04%17333.79%50.98%10.20%//
RI/134.6043985.74%6612.89%61.17%10.20%//
Disclaimer/Publisher’s Note: The statements, opinions and data contained in all publications are solely those of the individual author(s) and contributor(s) and not of MDPI and/or the editor(s). MDPI and/or the editor(s) disclaim responsibility for any injury to people or property resulting from any ideas, methods, instructions or products referred to in the content.

