Article

Monitoring Moringa oleifera Lam. in the Mediterranean Area Using Unmanned Aerial Vehicles (UAVs) and Leaf Powder Production for Food Fortification

1
Department of Agricultural, Food and Forestry Sciences, University of Palermo, Viale delle Scienze, Building 4, 90128 Palermo, Italy
2
Association of Producers SiciliaBio, Via Vittorio Emanuele 100, 92026 Favara, Italy
3
CREA, Research Centre for Plant Protection and Certification, 90128 Palermo, Italy
*
Author to whom correspondence should be addressed.
Agriculture 2025, 15(13), 1359; https://doi.org/10.3390/agriculture15131359
Submission received: 27 May 2025 / Revised: 18 June 2025 / Accepted: 23 June 2025 / Published: 25 June 2025
(This article belongs to the Section Digital Agriculture)

Abstract

The increasing global demand for resilient, sustainable agricultural systems has intensified the need for advanced monitoring strategies, particularly for climate-adaptive crops such as Moringa oleifera Lam. This study presents an integrated approach using Unmanned Aerial Vehicles (UAVs) equipped with multispectral and thermal cameras to monitor the vegetative performance and determine the optimal harvest period of four M. oleifera genotypes in a Mediterranean environment. High-resolution data were collected and processed to generate the NDVI, canopy temperature, and height maps, enabling the assessment of plant vigor, stress conditions, and spatial canopy structure. NDVI analysis revealed robust vegetative growth (0.7–0.9), with optimal harvest timing identified on 30 October 2024, when the mean NDVI exceeded 0.85. Thermal imaging effectively discriminated plant crowns from surrounding weeds by capturing cooler canopy zones due to active transpiration. A clear inverse correlation between NDVI and Land Surface Temperature (LST) was observed, reinforcing its relevance for stress diagnostics and environmental monitoring. The results underscore the value of UAV-based multi-sensor systems for precision agriculture, offering scalable tools for phenotyping, harvest optimization, and sustainable management of medicinal and aromatic crops in semiarid regions. Moreover, in this study, to produce M. oleifera leaf powder intended for use as a food ingredient, the leaves of four M. oleifera genotypes were dried, milled, and evaluated for their hygiene and safety characteristics. Plate count analyses confirmed the absence of pathogenic bacterial colonies in the M. oleifera leaf powders, highlighting their potential application as natural and functional additives in food production.

1. Introduction

The projected rise in the global population, to 10 billion by 2050, presents formidable challenges to food production systems, with far-reaching implications for food security, water and energy resources, and climate resilience [1]. Agricultural systems must evolve rapidly to meet these demands while coping with reduced labor availability, environmental degradation, and the escalating consequences of climate change. In this context, the digital transformation of agriculture offers significant opportunities for enhancing sustainability and productivity.
Recent advancements in smart agricultural technologies, particularly those aligned with Agriculture 5.0 (Ag5.0), are facilitating a transition toward autonomous, data-driven, and resource-efficient food production systems. Ag5.0 represents the latest phase in agricultural evolution, integrating artificial intelligence (AI), machine learning (ML), robotics, and big data analytics to enable predictive, adaptive, and precise management of crop systems [2,3,4,5]. These technologies are instrumental in automating routine tasks, enhancing decision-making, and reducing environmental impacts, thereby improving overall agricultural resilience.
Precision agriculture (PA) constitutes a cornerstone of Ag5.0, offering strategies for optimizing resource inputs and maximizing yields through site-specific management. By deploying sensors, Unmanned Aerial Vehicles (UAVs), and AI-driven platforms (Figure 1), PA facilitates real-time monitoring of key agronomic parameters such as plant health, soil variability, and water stress [6,7]. These technologies also align with the principles of Climate-Smart Agriculture (CSA), which seeks to sustainably increase productivity, strengthen resilience, and reduce greenhouse gas emissions [8,9].
In the Mediterranean basin, characterized by semiarid conditions, high evapotranspiration, and fragmented land use, the implementation of smart agricultural technologies is especially critical. The region faces growing vulnerabilities due to climate variability, necessitating adaptive cropping systems that enhance both productivity and sustainability. A promising candidate for such systems is Moringa oleifera Lam., a fast-growing, drought-tolerant plant known for its high nutritional and functional value [10,11,12,13]. The species has gained recognition for its adaptability to marginal environments and its potential to contribute to food and nutrition security, particularly in water-limited regions.
M. oleifera has been successfully introduced in parts of southern Italy, including Sicily, where it is cultivated as an intercrop alongside traditional cereals and forages. The plant’s multifunctional role spans nutritional, medicinal, agronomic, and environmental domains. It is used for leaf powder production, soil improvement, and as a bioenergy crop, and has demonstrated benefits in carbon sequestration and nutrient cycling [13,14].
Remote sensing technologies, particularly UAV-based multispectral and thermal imaging, offer scalable solutions for monitoring M. oleifera under Mediterranean conditions. Indices such as the Normalized Difference Vegetation Index (NDVI), Normalized Difference Red Edge (NDRE), and the Vegetation Index for Agricultural Remote Sensing (VARI) are effective in quantifying canopy vigor, chlorophyll concentration, and water stress [15,16]. Moreover, NDVI has a strong inverse correlation with Land Surface Temperature (LST), making it a useful proxy for evaluating crop evapotranspiration and drought response [17,18].
However, despite growing interest in UAV-based crop monitoring, most studies have focused on staple crops (e.g., maize, rice, wheat) and large-scale monocultures, often relying on a single sensor modality and without integration into downstream food quality or safety assessment. Few studies have investigated the use of multi-sensor UAV platforms for underutilized crops like Moringa oleifera, particularly under Mediterranean agro-climatic conditions. Even fewer have benchmarked UAV data against manual ground-truth measurements or incorporated post-harvest quality evaluations.
This study addresses these gaps by presenting a dual-focused approach that is novel in its integration of agronomic and food safety assessments. Specifically, we (i) use UAV-mounted multispectral and thermal cameras to monitor vegetative indices and canopy temperature in four M. oleifera genotypes, and (ii) assess the microbiological safety of the corresponding leaf powder to evaluate its suitability for food fortification. To ensure scientific robustness, we correlate UAV-derived data (e.g., NDVI, canopy height, temperature) with manual field measurements, such as plant height and SPAD chlorophyll readings, thereby providing a ground-truth validation framework. This approach allows us to critically evaluate the reliability of remote sensing tools in assessing crop performance and to propose a replicable model for integrating UAV monitoring with functional crop evaluation in climate-resilient agriculture.
With recent advances in AI and synthetic image generation, low-cost RGB imagery can now be transformed into thermal maps, broadening access to precision monitoring tools [19]. These innovations help reduce monitoring costs and increase the scalability of precision agriculture for smallholder farmers.
This study aims to evaluate the growth dynamics of four M. oleifera genotypes origin—African (A), Indian (I), Pakistani PKM1, and PKM2—using UAV-assisted remote sensing in a Mediterranean agricultural context. The specific objectives are: (i) to assess genotype-specific performance in semiarid Sicilian conditions through multispectral and thermal data analysis, and (ii) to investigate the microbiological safety and functional food potential of powdered Moringa leaf products cultivated under monitored conditions.
These findings aim to support future applications of smart agriculture for climate-resilient crops in water-scarce environments, offering insights for sustainable intensification, circular economy integration, and food security policy in the Mediterranean region and beyond.

2. Materials and Methods

2.1. Study Area and Experimental Design

On July 3, 2024, one-month-old M. oleifera seedlings were transplanted into the experimental field located in Santa Flavia (Palermo, Italy) at the Cooperativa Agricola Primo Sole (Lat 38°05′14.11″ N, Long 13°31′39.67″ E; WGS 84, 130 m a.s.l). The region has a Csa climate classification according to the Köppen–Geiger system, indicating a hot-summer Mediterranean climate [20]. The soil moisture regime is xeric, bordering aridic, with a thermic temperature regime.
Four genotypes of M. oleifera were tested: African (A), Indian (I), Pakistani PKM1, and Pakistani PKM2. The planting scheme featured a spacing of 1.5 meters between plants and 3 meters between rows. The field was divided into four replicated plots, each containing forty plants per genotype (Figure 2).
Throughout the vegetative season (July–October), surface inter-row tillage was periodically performed to manage weed growth and minimize soil evaporation by breaking capillary rise. No organic or mineral fertilizers were applied during the growing season to maintain consistent baseline conditions across genotypes.

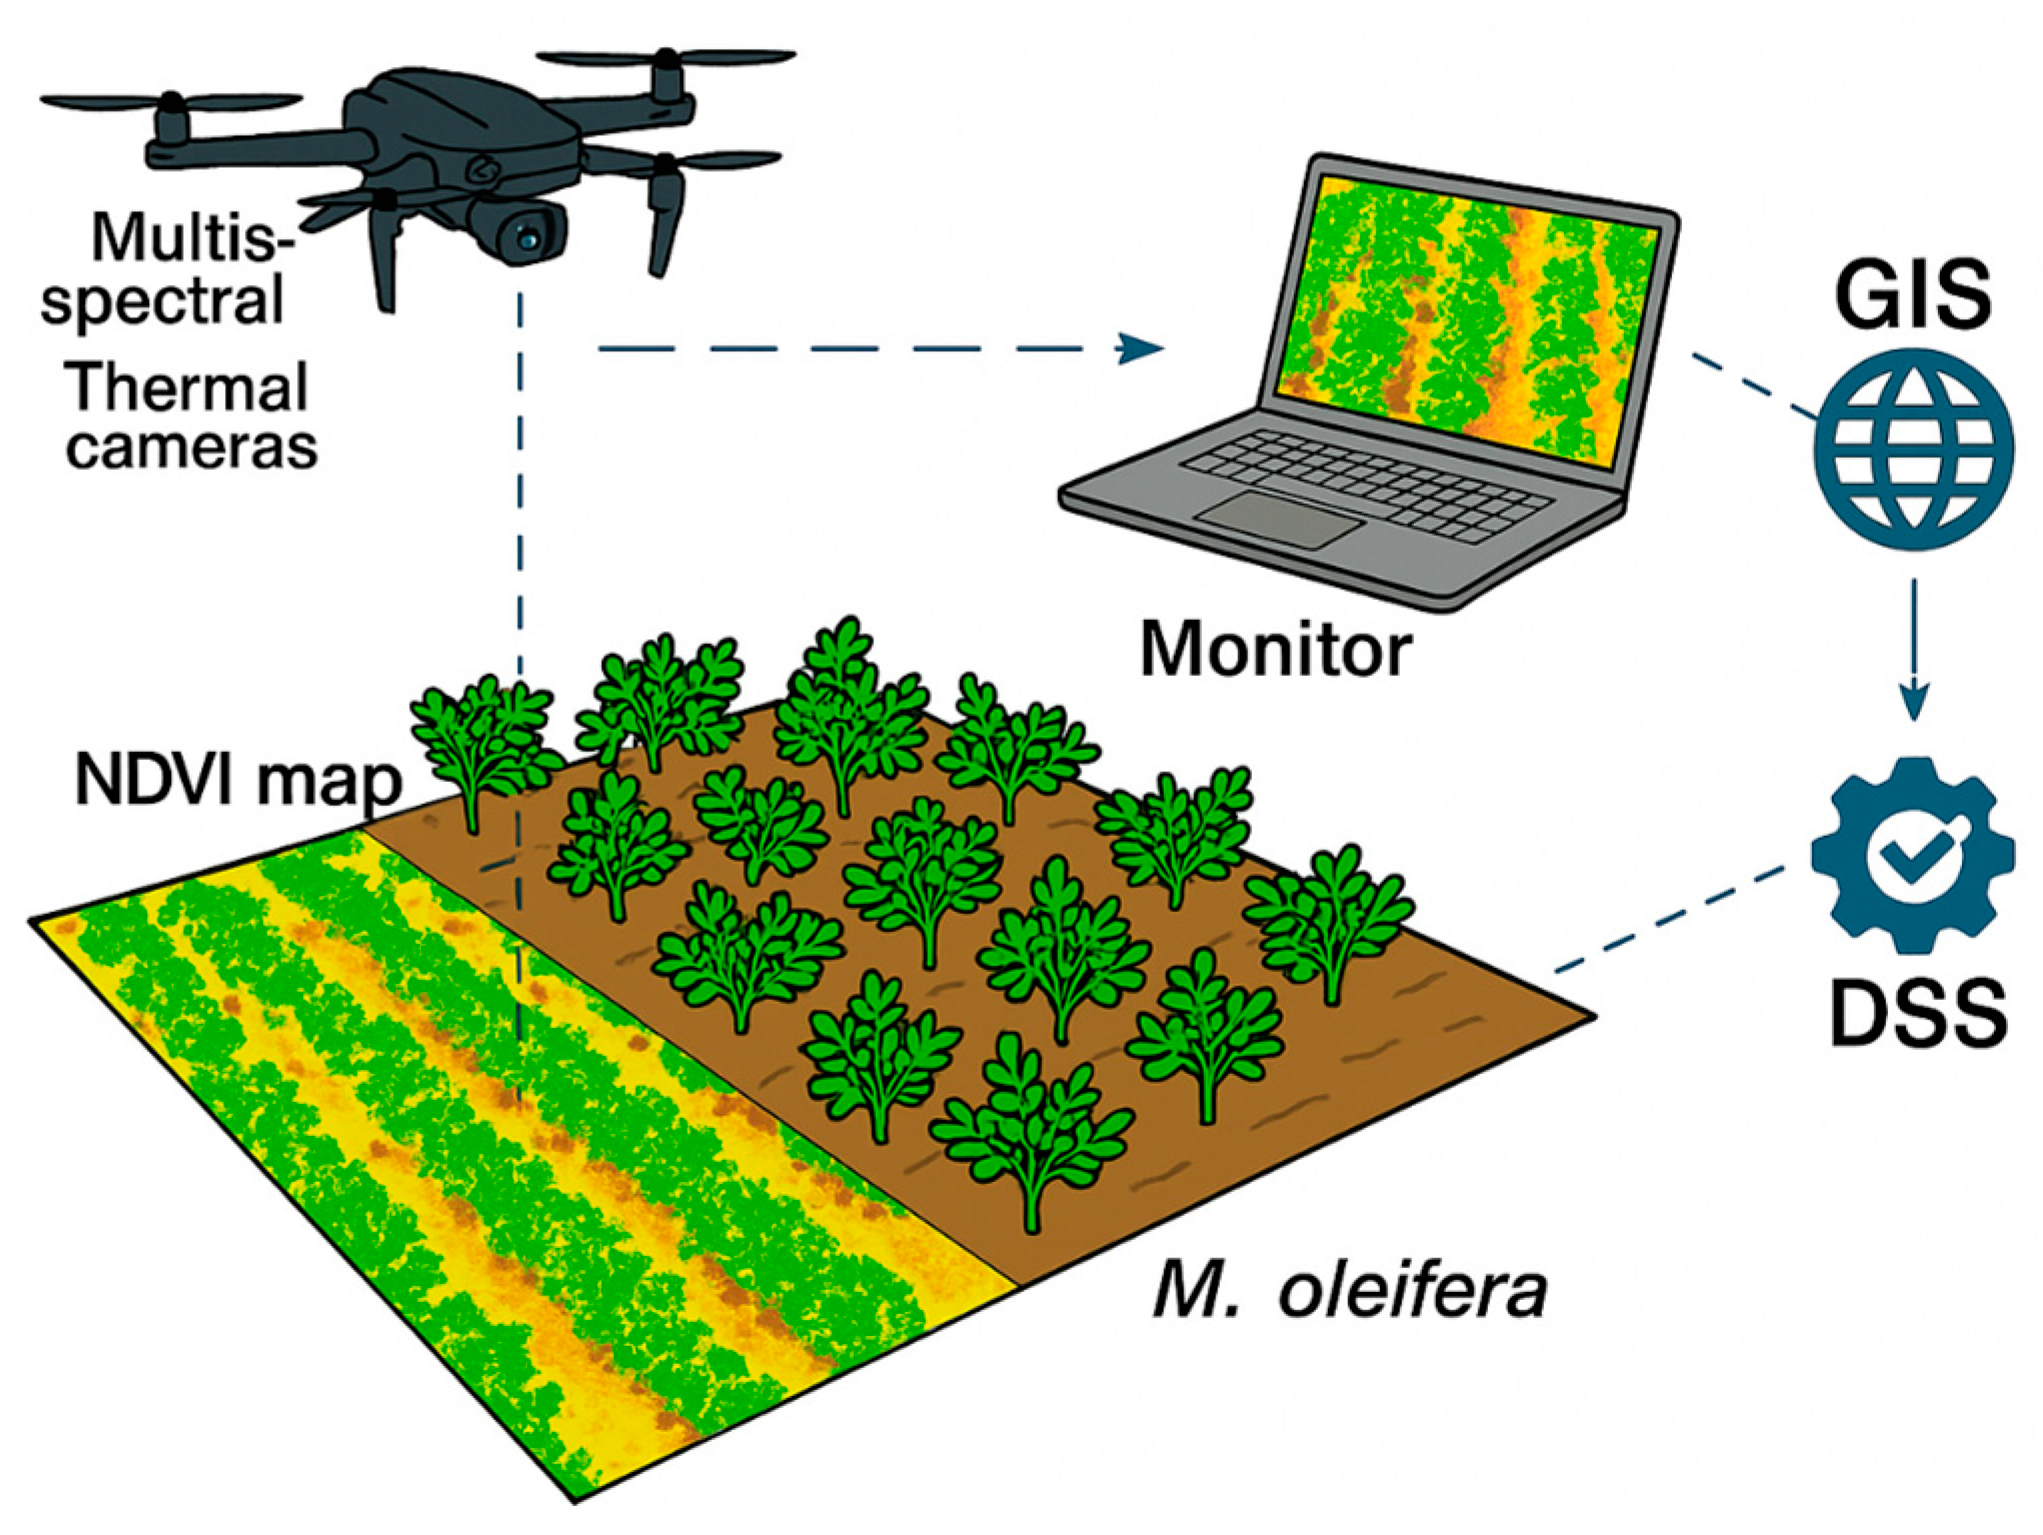
2.2. Moringa oleifera Growth Monitoring Through Precision Agriculture Technologies

The use of Unmanned Aerial Vehicles (UAVs) equipped with multispectral sensors and dedicated post-processing software has become an established methodology for monitoring Vegetation Indices (VIs) in the cultivation of Medicinal and Aromatic Plants (MAPs), contributing to the optimization of agricultural operations and enhancing productivity through spatially detailed crop assessments [21]. The monitoring of Precision Aromatic Crops (PACs) increasingly incorporates advanced tools such as GNSS, Variable Rate Application (VRA) technologies, Geographic Information Systems (GIS), and Decision Support Systems (DSS) to enable site-specific and data-driven crop management [21].
In the present study, the aerial monitoring of Moringa oleifera genotypes was performed using a DJI Mavic 3 Multispectral UAV (Dà-Jiāng Innovations Science and Technology Co., Ltd., Shenzhen, China), which integrates a five-band multispectral sensor and an RGB camera. The spectral bands recorded included: Blue (450 ± 16 nm), Green (560 ± 16 nm), Red (650 ± 16 nm), Red Edge (730 ± 16 nm), and Near-Infrared (NIR, 860 ± 26 nm). Flight missions were conducted autonomously along predefined routes, with flight parameters such as altitude, speed, and camera orientation configured via DJI Pilot 2 software (Ver. 2.5) to ensure uniform image acquisition.
Post-flight data processing was carried out using Agisoft Metashape Professional (v1.7.3), which generated both 2D orthomosaics and 3D spatial models through photogrammetric reconstruction techniques. Outputs included dense point clouds, mesh models, and digital elevation models (DEMs), followed by orthorectification and image mosaicking. Spectral canopy data were analyzed within QGIS (v3.16.6 Hannover) using an object-based image analysis (OBIA) workflow to extract vegetation features and compute the Normalized Difference Vegetation Index (NDVI) using the standard equation:
N D V I = ( N I R R ) ( N I R + R )
NDVI values were used to distinguish plant canopies from bare soil and to assess the temporal dynamics of vegetative vigor. Three UAV flights were conducted on 31 July, 4 September, and 30 October 2024, which corresponded to critical phenological phases of M. oleifera, including early growth, peak development, and late-season maturity. The NDVI analysis over this period enabled the identification of the optimal harvest window for each genotype based on peak vegetative performance. Corresponding RGB imagery confirmed visible changes in canopy density and greenness, reflecting biomass accumulation patterns and physiological development (Figure 3).
This precision monitoring was essential, as the aerial biomass was harvested and subjected to post-harvest processing—specifically drying—to evaluate the suitability of the material for nutraceutical and functional food applications [22,23,24].

2.3. Thermal and Multispectral Images Acquisition and Processing

Thermal imaging represents a powerful non-invasive tool for detecting early physiological stress in crops, including Moringa oleifera, particularly during key phenological stages from June to October. By capturing variations in leaf surface temperature, thermal sensors enable the indirect assessment of plant transpiration efficiency and stomatal conductance, which typically decrease under water-deficit conditions due to stomatal closure, resulting in elevated leaf temperatures [25,26,27].
The thermal response of the canopy can reveal stress symptoms well before they are visually detectable [28,29,30]. Among the most widely used thermal indices, the Crop Water Stress Index (CWSI) offers a normalized and sensitive proxy for quantifying canopy-level water stress. Derived from thermal infrared imagery, the CWSI allows precise assessment of crop water status and facilitates spatial mapping of stress zones [31,32,33].
In this study, the CWSI was calculated using the formula:
C W S I = ( T c T w e t ) ( T d r y T w e t )
where
Tc is the canopy temperature derived from UAV thermal imagery (°C),
Twet is the minimum temperature of a well-watered reference surface (°C),
Tdry is the maximum temperature of a non-transpiring, water-stressed reference surface (°C).
Reference temperatures were obtained using a handheld infrared thermometer targeting fully shaded (wet) and sun-exposed (dry) canopy zones. CWSI values range from 0 (no stress) to 1 (maximum stress), offering a practical metric for irrigation management and genotype comparison.
The thermal survey was conducted on 4 September 2024 using a DJI MATRICE 350 RTK UAV equipped with a Zenmuse H20T camera. The thermal sensor featured a resolution of 640 × 512 pixels and operated within a temperature range of −40 °C to +150 °C. Simultaneously, an integrated 1/2.3” CMOS RGB camera (20 MP) enabled dual imaging with adjustable zoom and field of view. The UAV system captured both thermal and RGB images, supporting integrated assessments of canopy structure and stress gradients across Moringa plots.
Thermal image acquisition was carried out under clear sky conditions between 11:00 and 13:00 local time to ensure optimal canopy–soil temperature contrast. UAV missions were pre-programmed using DJI GS Pro software, with flight parameters standardized at 35 m AGL, 3 m/s speed, and −90° gimbal angle. Additional thermal measurements were acquired using a FLIR LWIR (7.5–13.5 µm) handheld infrared sensor to validate reference temperatures.
Thermal imagery was processed using FLIR Tools and Pix4Dmapper, including preprocessing, distortion correction, and orthorectification. For enhanced resolution and accuracy, thermal orthomosaics were co-aligned with RGB data. Subsequently, all multispectral and thermal datasets were imported into Agisoft Metashape Professional (v1.7.3) for photogrammetric processing, generating orthomosaics, Digital Elevation Models (DEMs), and dense point clouds through Structure-from-Motion (SfM).
Final image analysis was performed in QGIS (v3.16.6 Hannover) using an Object-Based Image Analysis (OBIA) workflow to classify canopy features and extract quantitative vegetation metrics. The NDVI, derived from multispectral imagery, was monitored across genotypes to assess vegetative vigor. NDVI dynamics reflected physiological development stages observed in RGB images (Figure 3) and informed the timing of biomass harvest for leaf drying and food powder production [22,23,24].
Importantly, the integration of thermal and multispectral imaging supports genotypic differentiation in heat and drought tolerance, offering valuable applications in breeding programs for stress-resilient crops [26,34]. Such imaging tools are applicable both in open-field and controlled greenhouse environments [35,36], and their combined use yields a comprehensive picture of crop health, physiology, and spatial variability [37,38]. UAV-mounted thermal sensors enable large-area, high-resolution monitoring, while handheld thermal cameras remain useful for ground-truthing and localized inspections [39,40]. This dual-scale approach enhances decision-making for sustainable and precision crop management [41,42].

2.4. Moringa oleifera Leaves Collection, Drying and Powder Production

To produce M. oleifera leaf powder intended for use as a food ingredient, leaves from the four cultivated plant genotypes were manually harvested using alcohol-sanitized disposable gloves and flame-sterilized stainless-steel scissors. The harvested leaves were pre-washed with tap water for 5 min. Subsequently, two consecutive washing steps were performed: the first involved immersion in a 0.2% (v/v) chlorinated water solution for 30 min, followed by a second rinse with tap water to remove any residual chlorine [43]. The leaves were then spin-dried for 1 min using a manual centrifuge to remove residual moisture [44], and placed on trays to be dried using a smart solar drying system [22,23,24]. Finally, the dried leaves were placed in sterile plastic bags and transported at ambient temperature to the Laboratory of Agricultural, Food and Environmental Microbiology at the University of Palermo, where they were milled to a particle size of 250 μm using a Retsch centrifugal mill (Model ZM1, Haan, Germany).

2.5. Microbiological Analysis of Moringa oleifera Leaf Powders

A culture-dependent approach was employed to assess the hygienic and safety characteristics of the powders obtained from the four M. oleifera genotypes. This evaluation followed the methodology described by Viola et al. [45], which involved homogenizing 10 g of each powder with 90 mL of Ringer’s solution (Oxoid, Hampshire, UK) using a Stomacher Bag-Mixer 400 (Interscience, Saint-Nom, France). The homogenized powders were serially diluted (1:10), and the resulting cell suspensions were used for the enumeration and detection of the main pathogenic bacteria, following the guidelines of the International Organization for Standardization (ISO). Specifically, the presence of total mesophilic microorganisms (TMM) [46], coagulase-positive staphylococci (CPS) [47], Escherichia coli [48], Listeria monocytogenes [49], Salmonella spp. [50] was evaluated. All analyses were performed in triplicate using culture media and supplements purchased from Oxoid.

2.6. Statistical Analysis

One-way analysis of variance (ANOVA) was used to statistically assess the differences among the four M. oleifera genotypes (African, Indian, Pakistani M1 and Pakistani M2) in terms of their microbial load. This analysis was applied to the counts of total mesophilic microorganisms (TMM), with genotype considered the sole fixed factor. ANOVA enabled the evaluation of whether significant differences existed among the genotypes with regard to microbial contamination levels. All measurements were performed in triplicate, and statistical significance was determined at a 95% confidence level (p < 0.05).
A hierarchical clustered heat map analysis (HMCA) was conducted to investigate the relationships among four M. oleifera genotypes based on five standardized variables: canopy temperature, plant height, and NDVI values recorded in July, September, and October. The data were standardized using the (n − 1) method, and clustering was performed using Ward’s method with Euclidean distance as the dissimilarity metric. The intensity of each parameter was represented on a color scale ranging from red (<−1) to green (>1), with intermediate values transitioning through black, allowing for intuitive visualization of the relative intensities of each parameter. All analyses were conducted using XLStat software ver. 2019.2.2 (Addinsoft, New York, NY, USA).

3. Results and Discussion

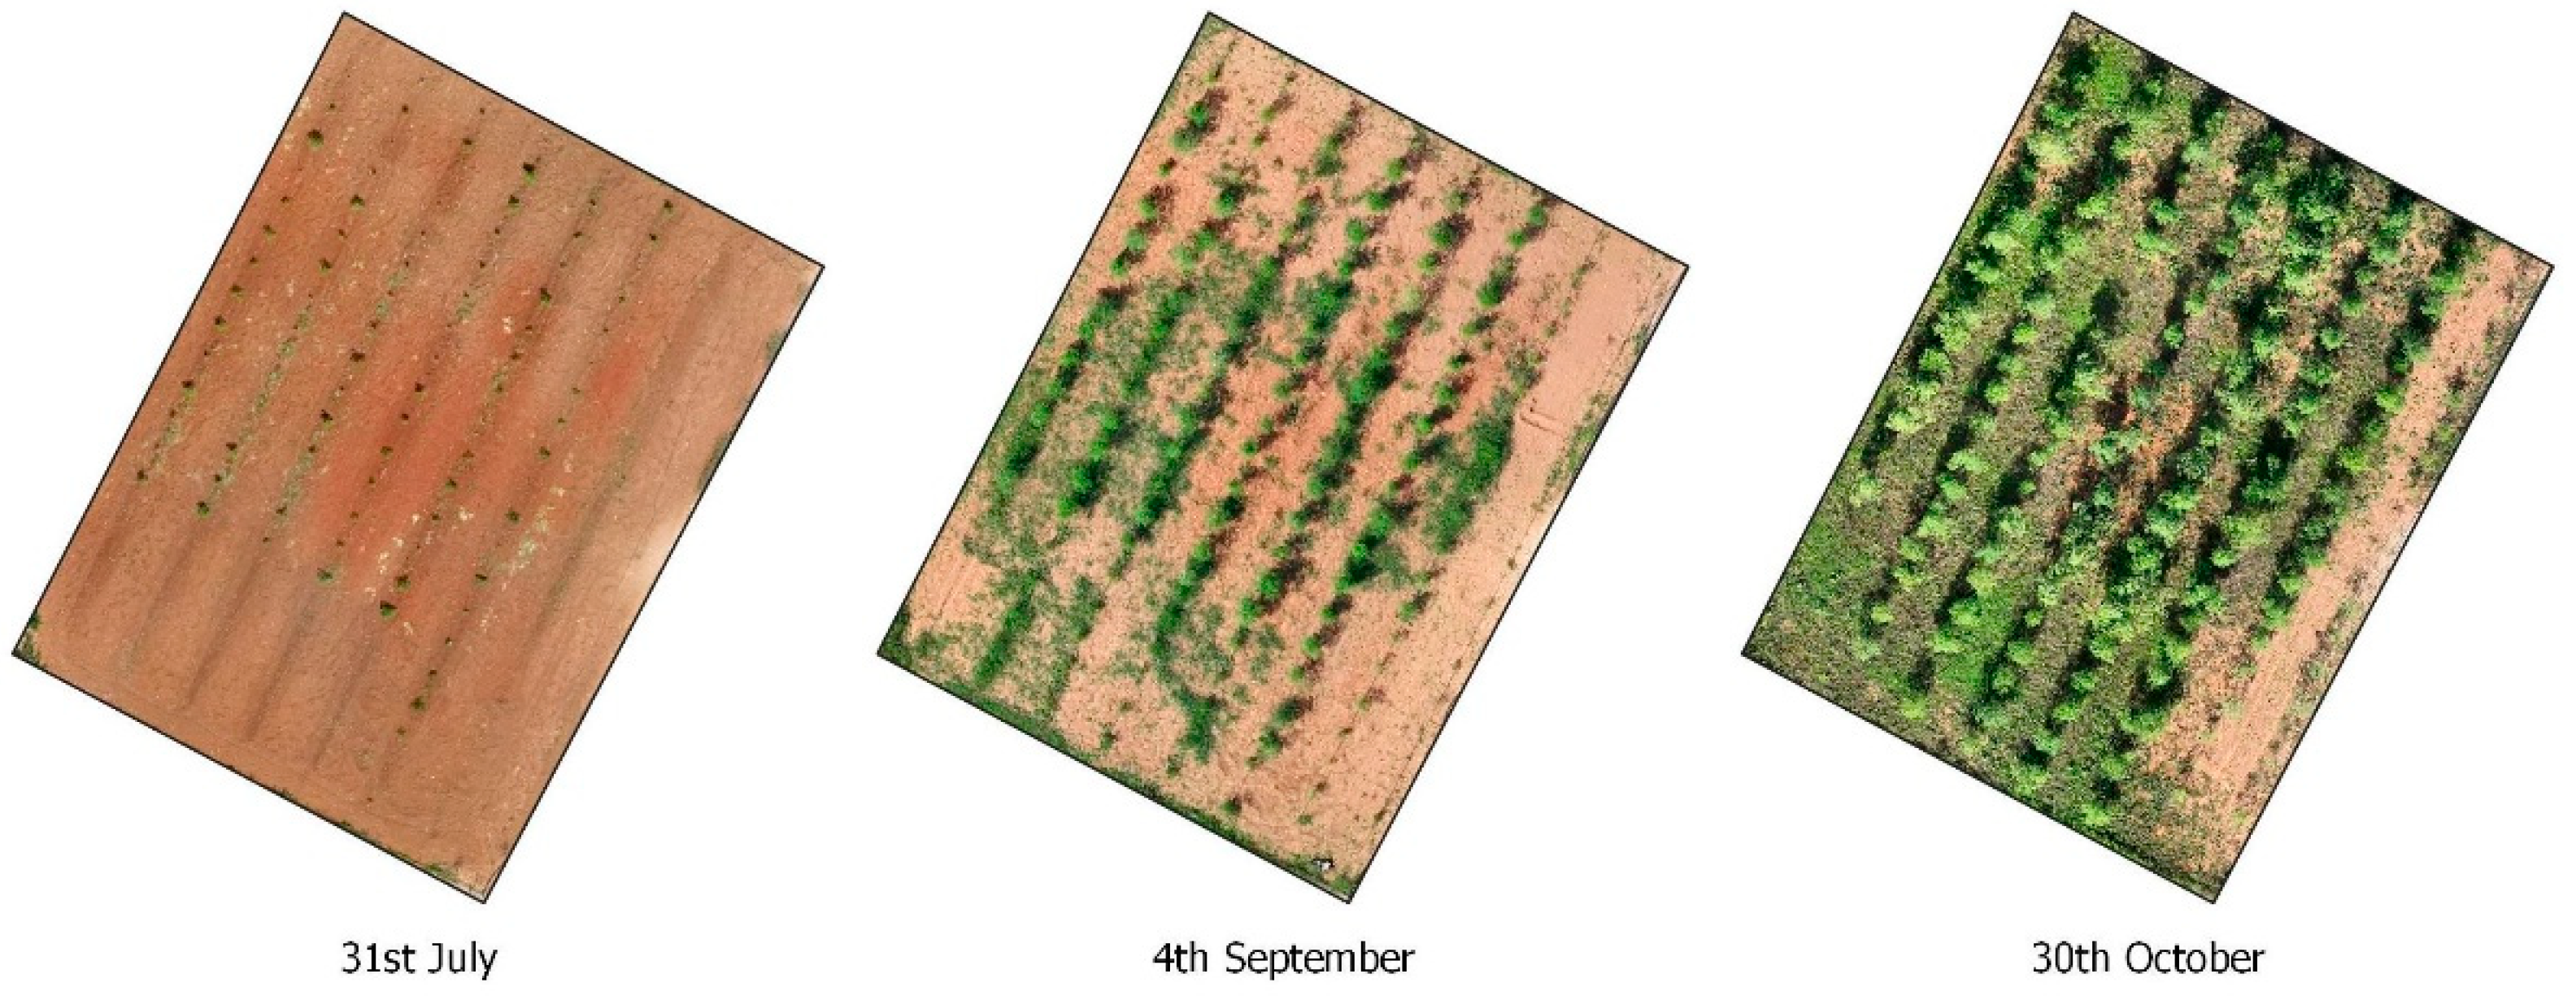
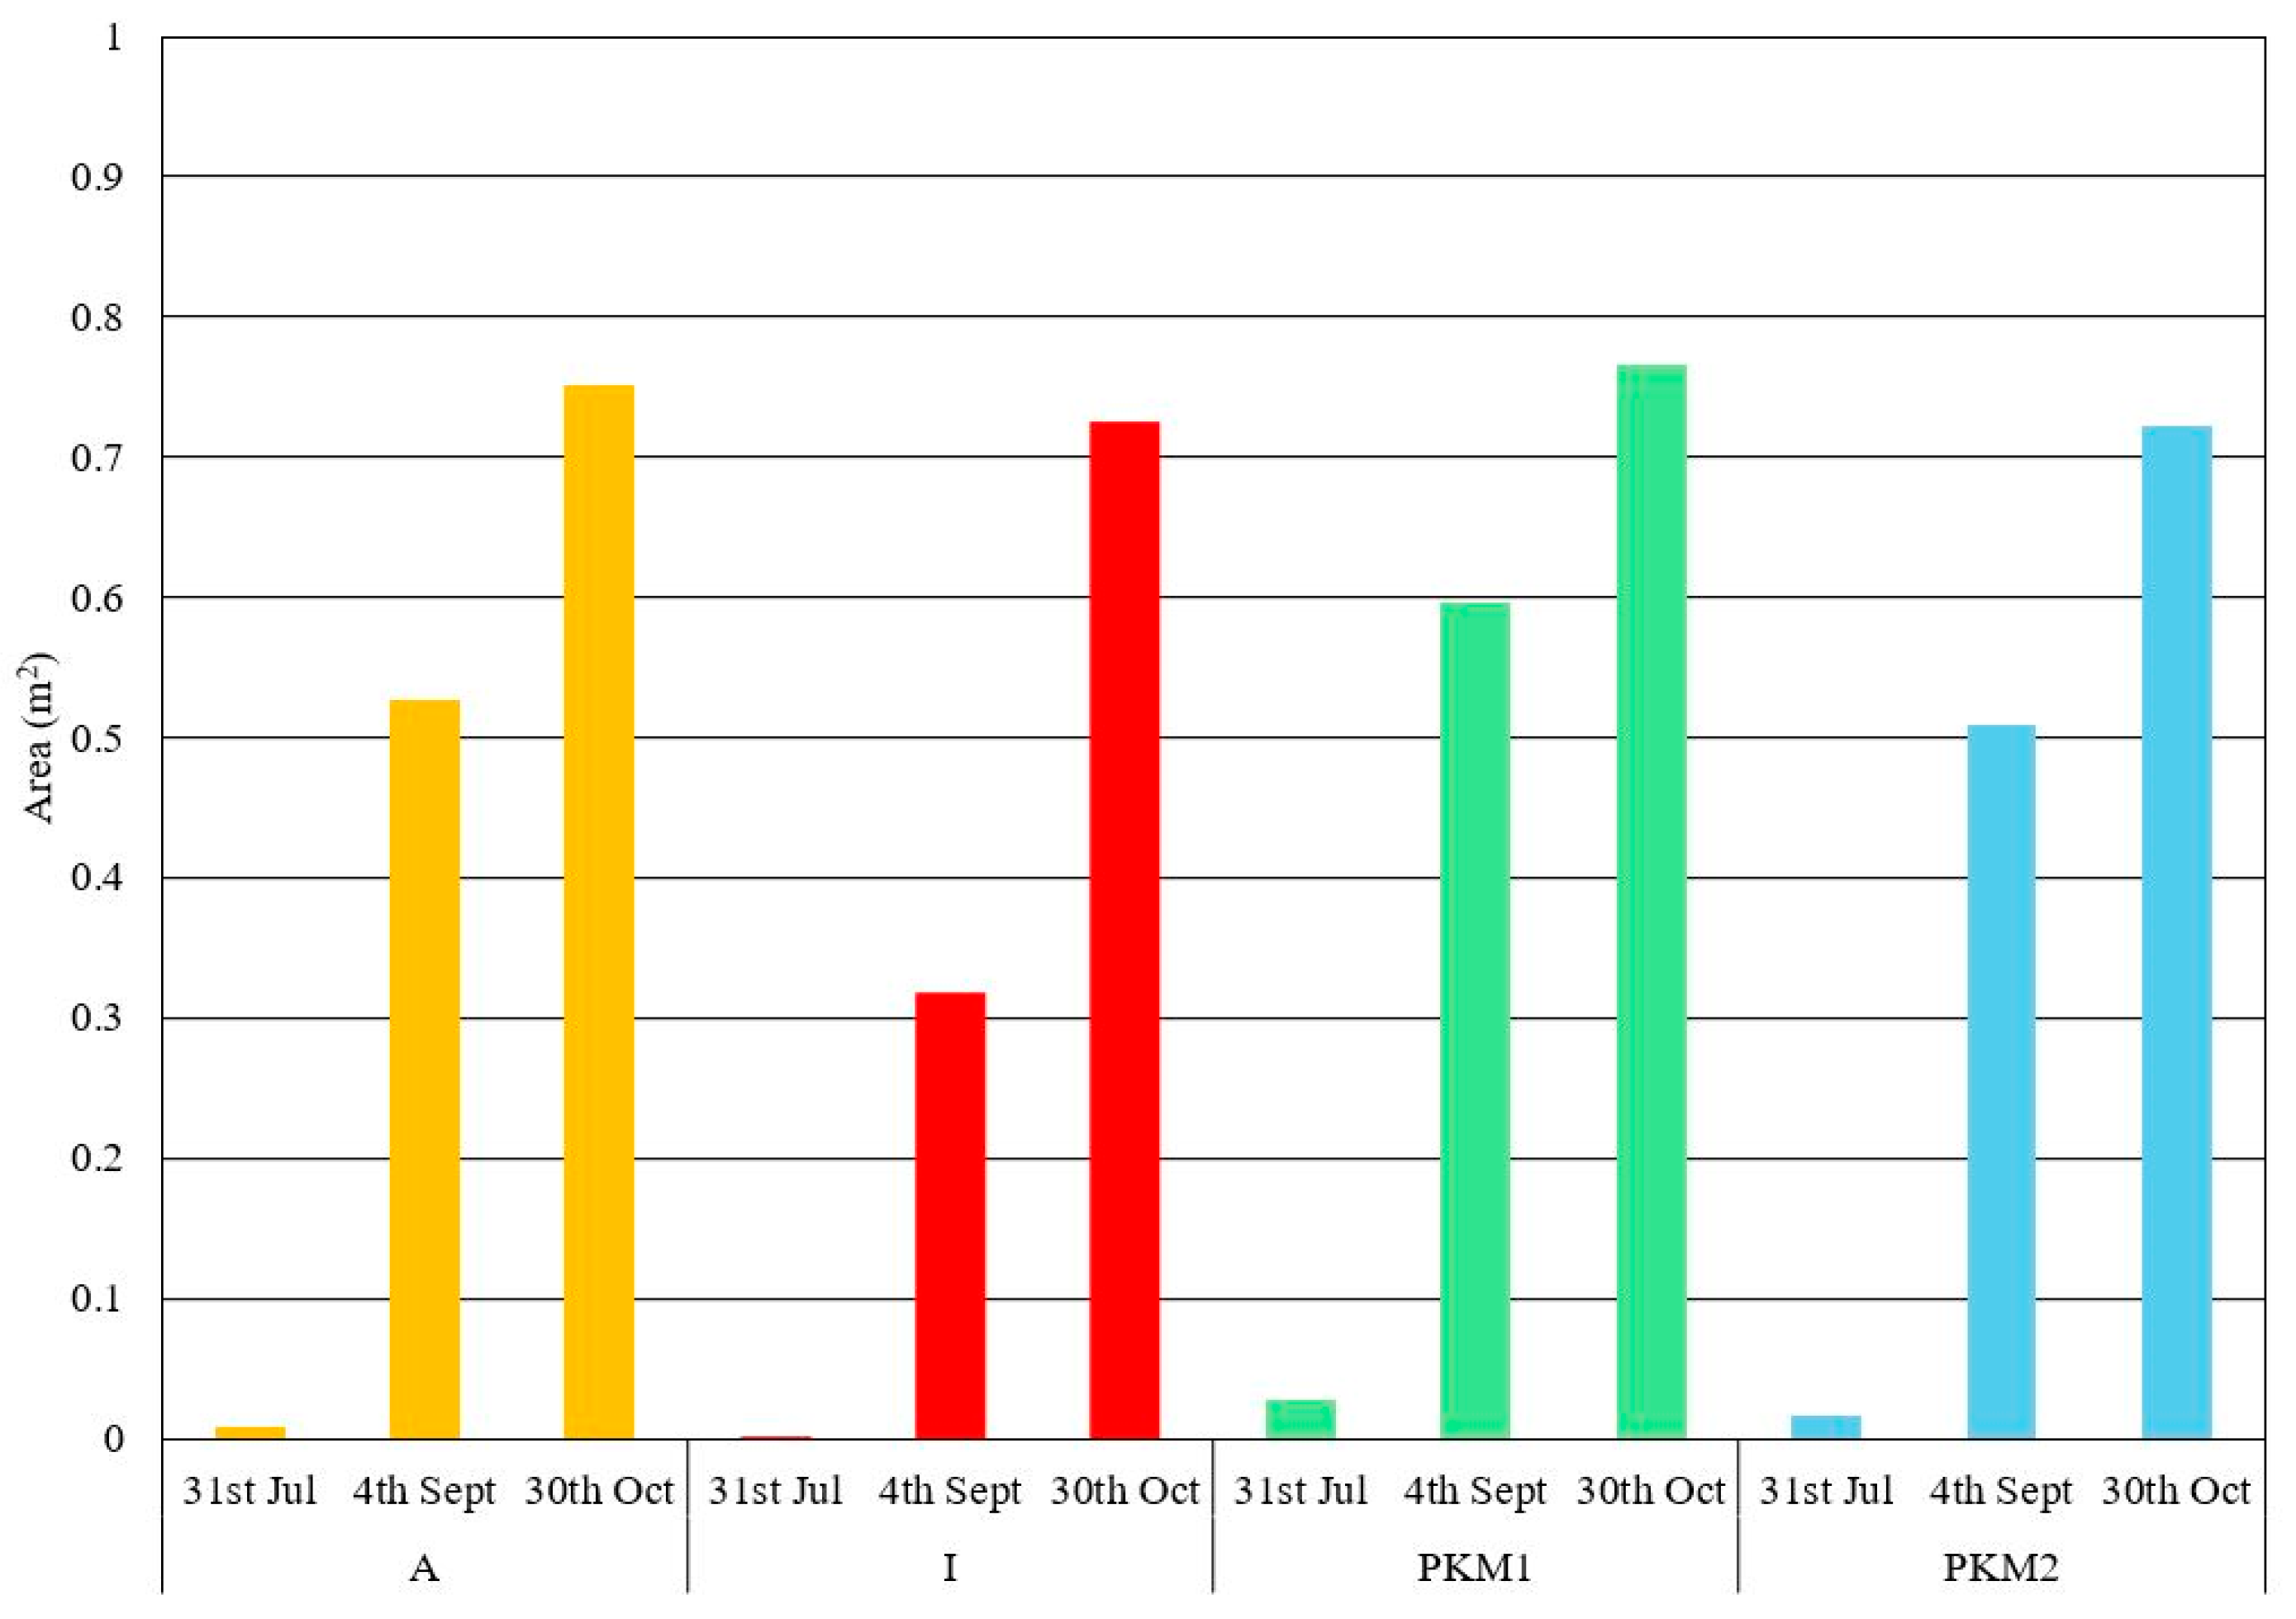
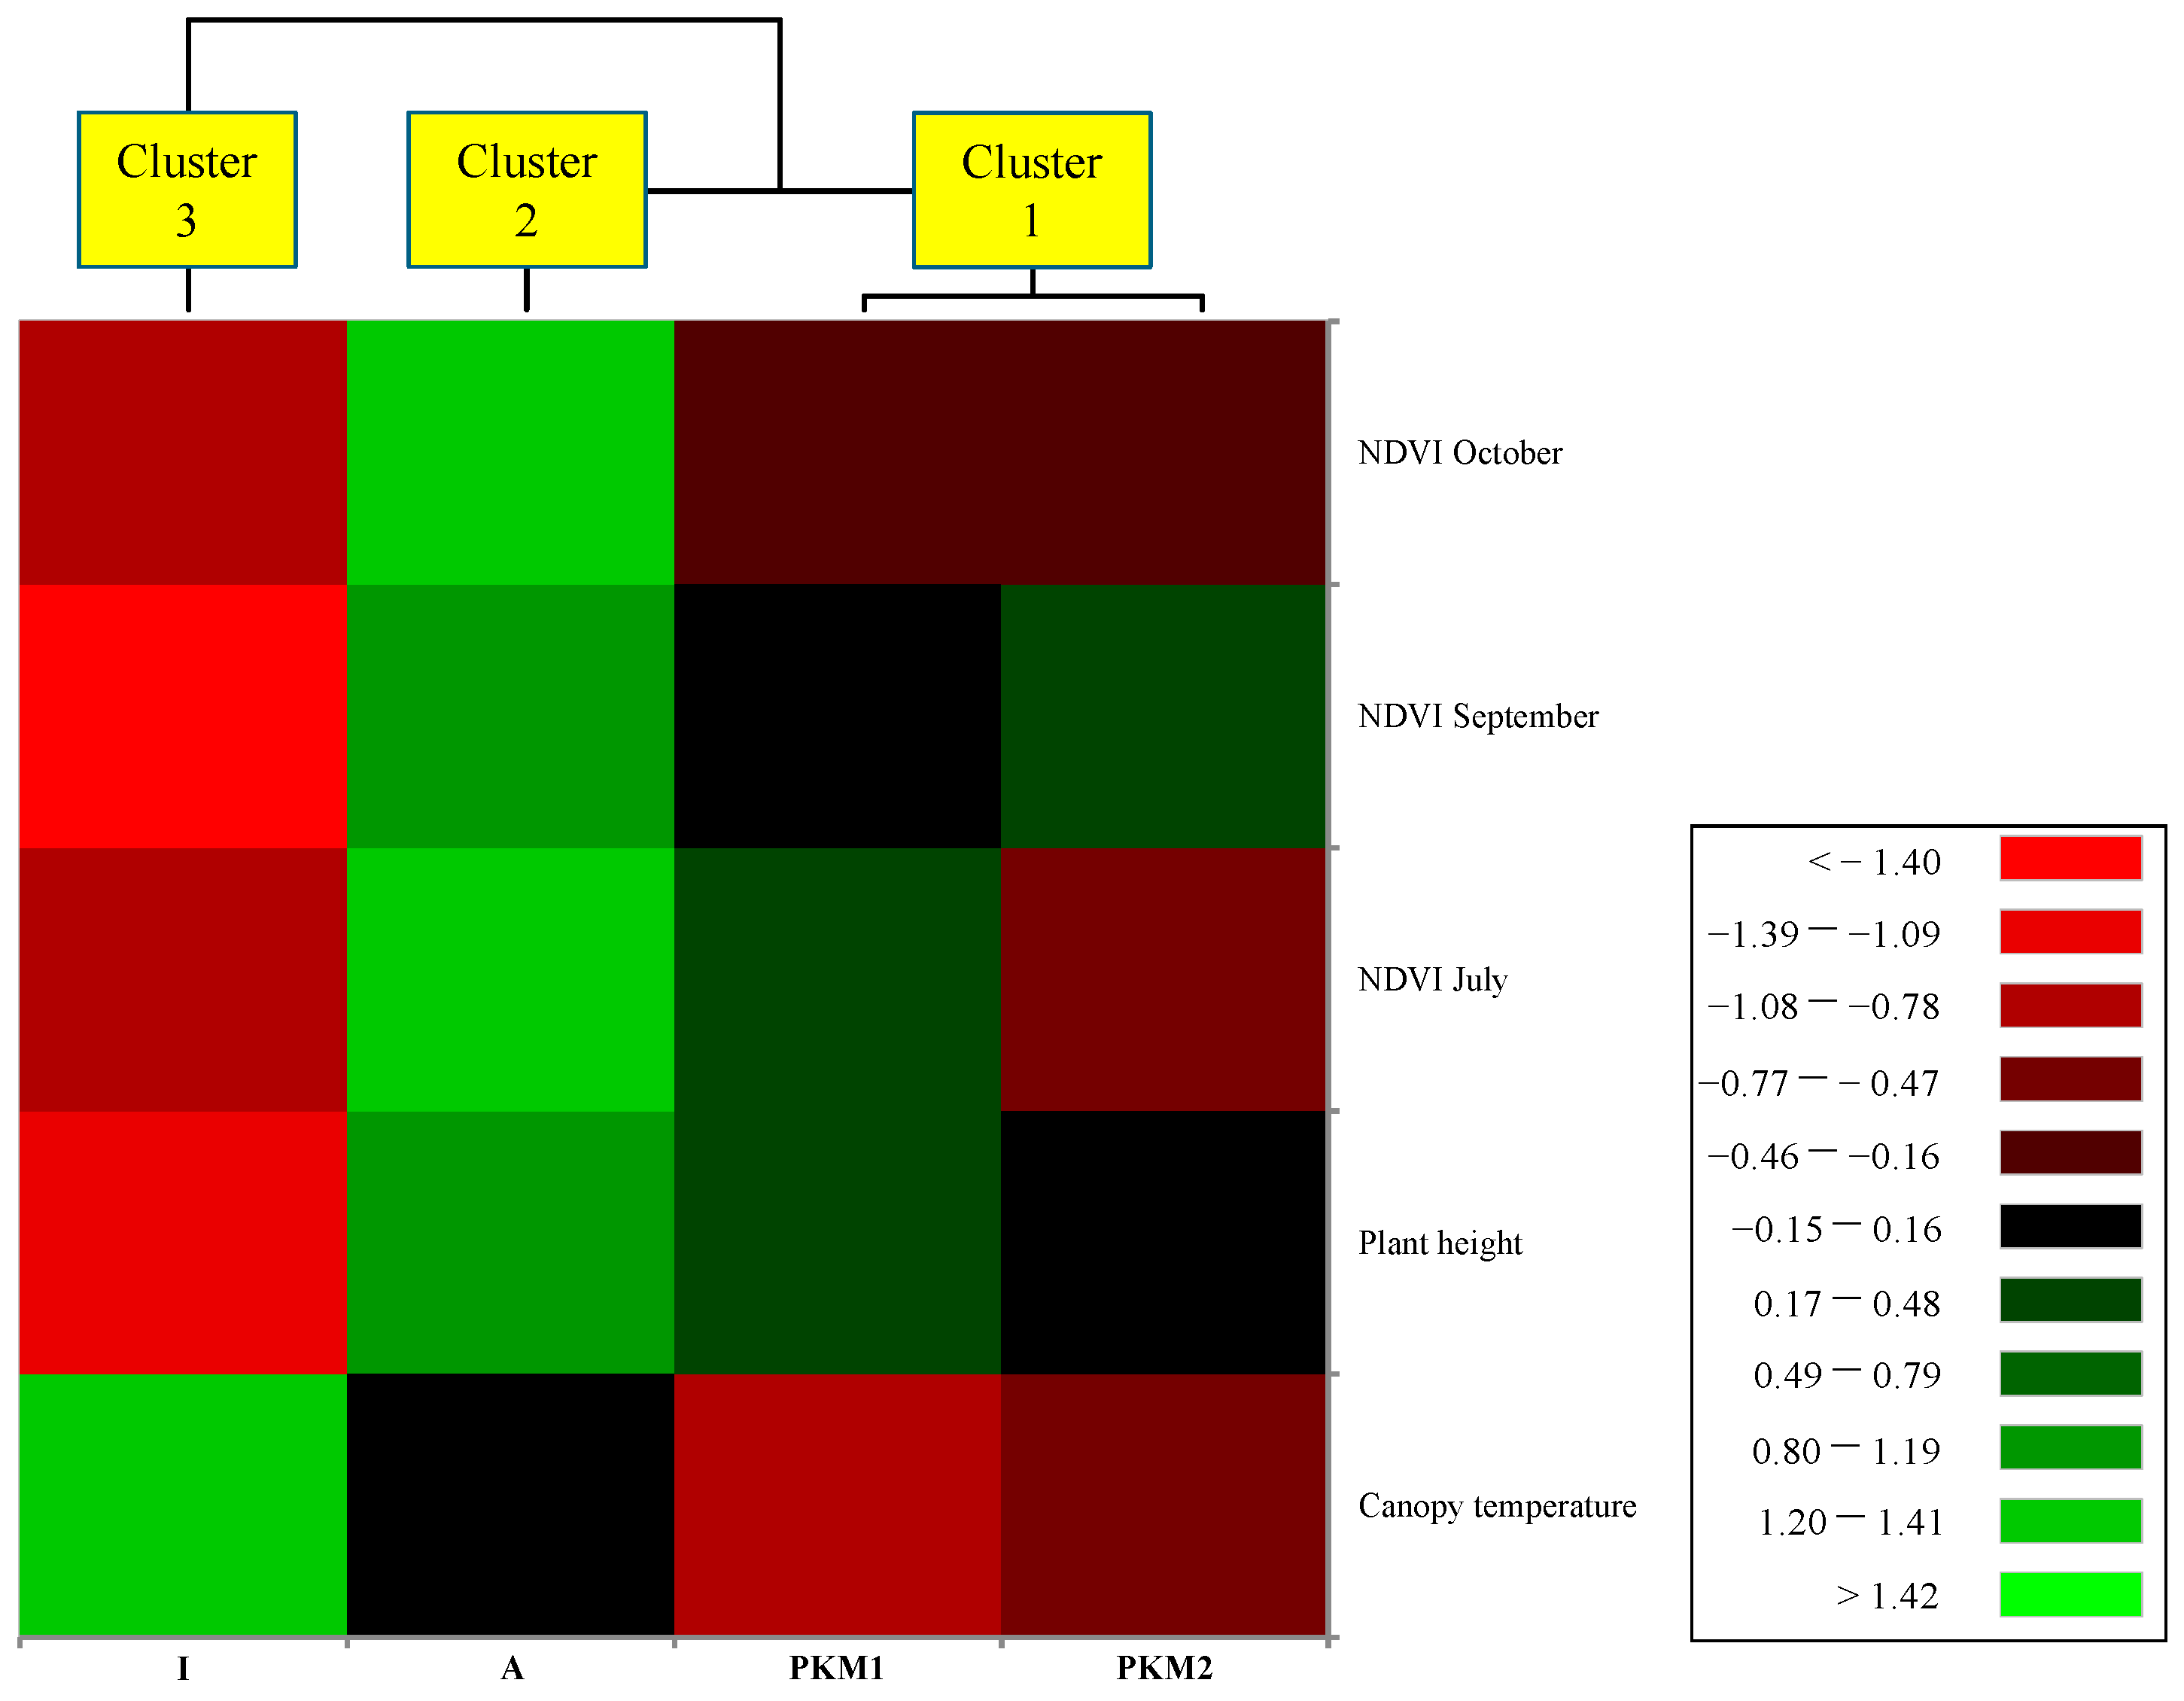
3.1. NDVI-Based Determination of Optimal Harvest Time for Moringa oleifera

NDVI values were calculated during three key periods—July, September, and October—to evaluate the vegetative development of M. oleifera and identify optimal harvest windows. Image analysis through QGIS enabled the calculation of zonal statistics, providing surface area estimates for different NDVI classes and supporting data-driven crop management decisions.
The spectral information obtained from UAV-acquired multispectral images allowed for the generation of false-color composites, which enhanced the visualization of vegetation density and vigor across the plots. Typical NDVI values ranged between 0.7 and 0.9 during peak vegetative stages, indicating high photosynthetic activity and biomass accumulation.
On 31 July, NDVI values averaged 0.3, with 89% of the land area exhibiting bare soil and minimal vegetative cover. These early-season values reflect the dormant status of the plants following winter dormancy and initial establishment.
By 4 September, the vegetative development was markedly improved, with over 54% of the plot area showing NDVI values associated with healthy and vigorous vegetation. This period coincided with favorable climatic conditions and peak leaf expansion.
On 30 October, 67% of the cultivated surface demonstrated robust vegetative vigor, confirming continued growth and indicating an approaching optimal harvest stage. These findings suggest that NDVI monitoring is an effective method to pinpoint phenological maturity and to support biomass collection for drying processing.
Overall, UAV-based multispectral imaging, coupled with advanced data processing tools, provided valuable insights for optimizing crop management and decision-making in precision farming, particularly for medicinal and aromatic plants (MAPs) such as M. oleifera. The optimal harvest time was identified when mean NDVI values reached 0.85, and the mean minimum temperature exceeded 10 °C—a critical threshold below which M. oleifera begins to shed its leaves and exhibits reduced vegetative activity. Based on this criterion, the period of 30 October 2024, was selected as the optimal harvest time.
Figure 4 illustrates the estimated canopy projection of four M. oleifera genotypes—African (A), Indian (I), Pakistani PKM1, and Pakistani PKM2—over three UAV monitoring dates during the 2024 season. The surface area was derived from multispectral image analysis and represents the horizontal projection of canopy cover (in square meters) at ground level. Across all genotypes, a consistent increase in canopy surface area is evident between July and October, with PKM1 and PKM2 showing the most extensive coverage by late October. The African and Indian genotypes also exhibited substantial growth, although the Indian genotype showed a more moderate increase. On average, on 30 October, all plants have a projection area of around 0.7–0.75 m2 with minimal differences (Min 0.72–Max 0.77). These canopy projections are important indicators of biomass accumulation and are used in conjunction with NDVI data to inform optimal harvest timing [51].
Generally, our findings on chemical composition are in accordance with respective literature data. Some perceptible discrepancies between data of various investigations in biomass composition might be associated with the differences in edaphoclimatic conditions, fertilizer applications, cultivars involved and other reasons.

3.2. NDVI, Thermal and H Canopy Images

Figure 5 illustrates the integrative potential of UAV-derived data by presenting a composite map comprising NDVI (left), thermal imagery (center), and canopy height (right), all collected during the monitoring period. The NDVI layer depicts spatial variations in vegetative vigor, with values above 0.80 corresponding to photosynthetically active zones and indicating optimal plant health and productivity [24]. The thermal map reveals heterogeneity in canopy surface temperatures, with warmer areas (30–40 °C) signaling possible water or heat stress. The canopy height map delineates architectural variability, showing that taller individuals (height > 2.0 m) generally align with regions of high NDVI and lower thermal emission.
This multimodal dataset highlights the ability of UAV-based sensing systems to perform accurate and spatially explicit phenotyping of Moringa oleifera under real field conditions. The synergy of spectral, thermal, and structural data enhances early detection of physiological stress, facilitates biomass quantification, and allows for genotype performance evaluation across time and space.
Importantly, the NDVI layer also reveals medium-green and yellow patches interspersed within otherwise vigorous zones, corresponding to weed presence within crop rows. While this complicates interpretation using NDVI alone, the thermal map provides additional contrast by showing elevated canopy temperatures in non-target vegetation. This thermal differentiation—rooted in transpiration-driven cooling—enables precise discrimination between M. oleifera canopies and surrounding weeds or bare soil.
The canopy height layer reinforces this distinction by confirming the presence of well-developed plant crowns (>2.0 m) in cooler, highly vigorous zones. The integration of these three UAV-derived data types thus significantly improves the accuracy of vegetation mapping and supports precision interventions for crop management.
Multitemporal NDVI data were captured at three phenological stages—31 July, 4 September, and 30 October 2024—corresponding to early development, peak growth, and maturity, respectively. These measurements facilitated the identification of the optimal harvest window and supported agronomic decisions related to drying and processing of leaf biomass for food-grade powder [22,23,24].
Thermal data played a critical role in stress detection. Increased canopy temperature was linked to reduced stomatal conductance and decreased transpiration efficiency under suboptimal conditions [25,26,27]. The application of the Crop Water Stress Index (CWSI) enabled quantitative evaluation of plant water status, with values ranging from 0 (fully irrigated) to 1 (severely stressed) [31,32,33]. CWSI values derived from thermal orthomosaics indicated increasing stress in late October, with an average CWSI of 0.67 across all genotypes. These data were strongly inversely correlated with NDVI (R2 = −0.82), confirming the physiological relevance of both indices.
RGB orthomosaics collected concurrently provided additional visual assessment of canopy density and color changes, further validating NDVI trends. The Zenmuse H20T thermal sensor enabled precise mapping of temperature distributions across the canopy, offering a proxy for water stress and transpiration dynamics. The combined use of thermal and NDVI data improved the accuracy of stress detection and contributed to optimized harvest scheduling.
Table 1 summarizes the performance of four Moringa oleifera genotypes—African (A), Indian (I), Pakistani M1 (PKM1), and Pakistani M2 (PKM2)—cultivated under Mediterranean field conditions. The analysis is based on UAV-derived indices (NDVI, canopy temperature, CWSI) and ground-truth measurements (biomass yield, leaf dry weight, chlorophyll content via SPAD).
The Normalized Difference Vegetation Index (NDVI), recorded on 30 October, reflects the photosynthetic activity and canopy density of each genotype. PKM2 recorded the highest NDVI (0.91), indicating superior vegetative vigor and canopy development. The African genotype (A) followed closely with an NDVI of 0.88. PKM1, although known for drought tolerance, showed a lower NDVI (0.79), suggesting more modest canopy development at the end of the growing season.
Canopy temperature and CWSI are critical indicators of water status. PKM2 exhibited the lowest canopy temperature (29.3 °C) and lowest CWSI value (0.36), signifying better transpiration efficiency and minimal water stress. In contrast, PKM1 showed the highest canopy temperature (32.0 °C) and highest CWSI (0.61), suggesting significant heat and water stress. The Indian genotype also displayed moderate stress levels, with a canopy temperature of 31.4 °C and CWSI of 0.55.
These differences highlight genotypic variation in stomatal regulation and thermoregulatory capacity, with PKM2 emerging as the most physiologically resilient under semiarid Mediterranean conditions.
In terms of aboveground biomass, PKM2 again led with a yield of 2.7 kg per plant, followed by the African genotype at 2.4 kg. PKM1 produced the lowest biomass (1.8 kg), aligning with its lower NDVI and higher canopy temperature. Leaf dry weight percentage followed a similar trend, with PKM2 achieving the highest value (23.3%), indicating superior foliar biomass accumulation and potential for higher post-harvest yield efficiency.
The SPAD values, indicative of chlorophyll content and nitrogen status, further reinforce these observations. PKM2 achieved the highest SPAD index (47.5), followed by the African genotype (45.2). The Indian and PKM1 genotypes had lower SPAD readings (41.6 and 40.3, respectively), possibly reflecting lower photosynthetic potential or earlier senescence.
The UAV image processing workflow was central to transforming raw data into actionable agronomic insights. Thermal images were first converted to TIFF format using DJI Image Processor. These, along with RGB and multispectral datasets, were imported into Agisoft Metashape Professional (v1.7.3) to generate orthomosaics, DEMs, and dense point clouds through Structure-from-Motion (SfM) photogrammetry. Orthorectification and color calibration enhanced the interpretability of vegetation layers. Final analyses were conducted in QGIS (v3.16.6 Hannover) using an Object-Based Image Analysis (OBIA) framework, allowing for vegetation classification, zonal statistics, and false-color composite generation.
This integrated workflow not only improved processing efficiency but also ensured high spatial accuracy for field-level applications. The canopy surface area exhibited consistent expansion over the three monitoring periods, further confirming the utility of multispectral imaging for phenotyping purposes.
Among the tested genotypes, PKM1 and PKM2 exhibited superior vegetative vigor and lower canopy temperature, suggesting a greater resilience to Mediterranean climatic stressors. These findings underscore the role of UAV-based sensing in supporting genotype selection, adaptive management, and climate-smart agriculture for M. oleifera and similar MAP species [21,24].
Overall, the methodologies presented in this study demonstrate the applicability of UAV-integrated sensing systems for optimizing input use, enhancing yield prediction, and supporting sustainable cultivation of drought-tolerant crops in semiarid environments.
Overall, PKM2 consistently outperformed the other genotypes across all measured parameters—demonstrating superior vegetative vigor, thermal regulation, and physiological performance under Mediterranean conditions. These results suggest that PKM2 is a promising candidate for sustainable, high-yielding M. oleifera cultivation in semiarid environments. In contrast, PKM1 showed signs of water stress and lower productivity, despite being genetically selected for arid conditions, highlighting the importance of localized phenotyping before genotype recommendation.
These findings underscore the utility of UAV-based monitoring in capturing complex genotype–environment interactions, supporting genotype selection, harvest scheduling, and precision irrigation strategies in the cultivation of underutilized, climate-resilient crops like Moringa oleifera.
This composite figure demonstrates the integrative potential of multispectral, thermal, and structural imaging in smart agriculture. The NDVI layer reveals overall vegetative vigor, while also highlighting the presence of weed cover within the Moringa oleifera plots. In contrast, the thermal map effectively isolates active crop canopies—where cooler surface temperatures are associated with greater transpiration—from warmer zones of lower vegetative activity, such as weedy or bare areas. The canopy height map adds a structural dimension, confirming the spatial distribution and volume of the aerial plant components.
The combination of these three maps allows for a nuanced discrimination of crop crowns from weeds and soil, enhancing monitoring accuracy. Notably, the correlation between NDVI and Land Surface Temperature (LST) is clearly evident: areas with higher NDVI values correspond with reduced surface temperatures. This inverse relationship is extensively documented in the scientific literature and plays a critical role in climate modeling, crop phenotyping, and environmental monitoring.
Persistent scientific interest in spatio-temporal NDVI–LST clusters reflects the broader importance of understanding vegetation dynamics and temperature interactions—both for mitigating urban heat island effects and for improving decision-making in precision agriculture and climate-smart farming strategies.
The HMCA (Figure 6) revealed three main clusters. Cluster 1 grouped PKM1 and PKM2, which showed similar profiles characterized by moderate canopy temperatures and NDVI values and slightly above-average plant height. Cluster 2 was represented by the African genotype, characterized by high NDVI values across all months and the highest plant height, indicating robust vegetative development. The third and most distinct cluster included the Indian genotype, which exhibited the highest canopy temperature but the lowest values for plant height and NDVI. This suggests a potential stress response or a different adaptation strategy.
The color scale ranged from red (<−1.40) to green (>1.42), with intermediate values transitioning through black. This allows for an intuitive visualization of the relative intensity of each parameter. The dendrogram confirmed the proximity of PKM1 and PKM2, while the African and Indian genotypes were more distant, reflecting their divergent physiological and environmental profiles.
Table 2 presents the validation of UAV-based measurements by comparing them with conventional ground-based methods across three critical parameters in Moringa oleifera monitoring: plant height, NDVI, and canopy temperature. Each parameter is evaluated in terms of its coefficient of determination (R2) and Root Mean Square Error (RMSE), which collectively indicate the degree of agreement between remote and direct sensing approaches under Mediterranean field conditions.
UAV-derived plant height was obtained through the differential analysis of Digital Surface Models (DSMs) and Digital Terrain Models (DTMs) generated using Structure-from-Motion (SfM) photogrammetry from RGB and multispectral imagery. Ground-truth data were collected through manual measurement using a tape or ruler. The comparison yielded a high correlation (R2 = 0.92) and low RMSE (0.08 m), indicating that UAV-derived spatial models provide an accurate and non-invasive method for quantifying canopy height in M. oleifera. These findings are consistent with previous studies that validate SfM photogrammetry as a reliable technique for height estimation in herbaceous and shrub crops cultivated in open fields.
NDVI values were computed from reflectance in the Red and Near-Infrared (NIR) spectral bands captured by the multispectral sensor onboard the UAV. Corresponding ground-based measurements of chlorophyll content were obtained using a SPAD-502 meter, which is widely accepted as a proxy for leaf greenness and nitrogen status. The resulting correlation (R2 = 0.85) and RMSE (0.04) underscore the robustness of NDVI as a surrogate for chlorophyll content in M. oleifera. The strength of this relationship aligns with previous work on aromatic and leafy crops, where NDVI has proven effective in characterizing foliar development and nutrient uptake under variable environmental conditions.
Thermal imagery acquired from UAV-mounted longwave infrared (LWIR) sensors was validated against spot measurements taken with a handheld IR thermometer directed at the sunlit portion of the upper canopy. The correlation between the two datasets was strong (R2 = 0.81), with an RMSE of 1.2 °C. While minor discrepancies are expected due to differences in spatial resolution and averaging methods, these results confirm that UAV thermal imaging provides a reliable spatial representation of canopy temperature gradients. Such capability is essential for detecting water stress through transpiration-related temperature changes and supports early intervention strategies.
Overall, the results presented in Table 2 validate the utility of UAV platforms for high-precision monitoring of key biophysical parameters in Moringa oleifera. All correlation coefficients exceeded 0.80, and RMSE values remained within acceptable margins, confirming the accuracy and reliability of remote sensing methods relative to traditional techniques. These outcomes reinforce the feasibility of integrating UAV-based approaches into routine agronomic surveillance, particularly for climate-resilient crops grown in semiarid environments.
By enabling rapid, non-destructive, and spatially explicit data acquisition, UAV technologies support real-time decision-making for crop management, including the scheduling of harvest operations, assessment of genotype performance, and optimization of irrigation practices. Such innovations are pivotal for enhancing resource efficiency and sustainability in Mediterranean agroecosystems.

3.3. Hygiene and Safety Assessment of Moringa oleifera Leaf Powders

The four M. oleifrera leaf powders produced in this study were subjected to plate counts to assess the presence of the main potentially harmful bacteria (Salmonella spp., CPS, E. coli, L. monocytogenes) recognized as essential indicators of food hygiene and safety [52] (Table 3). This evaluation is particularly crucial given the rising number of notifications in Europe regarding the detection of these pathogens in spices, herbs, and seasoning mixes [53]. Furthermore, the publication of the Food and Drug Administration report, “FDA Risk Profile: Pathogens and Filth in Spices”, underscores the need for improved microbiological safety and overall quality standards in the spice industry [54]. As shown in Table 3, none of the analyzed samples contained detectable levels of Salmonella spp., CPS, E. coli, and L. monocytogenes. Viable cells were detected only for TMM, with concentrations of approximately 3.0 Log CFU/g across all analyzed samples.
Given that TMM are classified as environmental contaminants [55] the lack of statistically significant differences among the samples (p > 0.05) is unsurprising, as the plants were cultivated in the same geographical area. However, according to the International Commission on Microbiological Specifications for dried vegetables, levels below 4.0 Log CFU/g of these microorganisms do not pose a health risk to consumers [56]. These findings confirm the hygienic and safety suitability of the four M. oleifera powders produced in this study, supporting their potential use as natural and functional additives in food production.

4. Conclusions

This study provides a comprehensive assessment of the effectiveness of UAV-based multispectral and thermal imaging technologies for the precision monitoring and management of Moringa oleifera cultivated under Mediterranean climatic conditions. The integration of spectral indices, thermal imaging, and field-based validation enabled the accurate characterization of genotype-specific traits, physiological stress responses, and biomass accumulation dynamics throughout the growing season.
Vegetation analysis through NDVI mapping identified the temporal evolution of vegetative vigor, with 30 October emerging as the optimal harvest window when NDVI values exceeded 0.85 and minimum night temperatures remained above 10 °C. Canopy temperature data derived from thermal imagery allowed early detection of water stress, as reflected in increasing CWSI values (mean CWSI = 0.67), with a strong inverse correlation (R2 = −0.82) between NDVI and CWSI across genotypes.
Validation results, as reported in Table 2, demonstrated strong agreement between UAV-derived and ground-truth data for plant height (R2 = 0.92; RMSE = 0.08 m), chlorophyll content (NDVI vs. SPAD, R2 = 0.85), and canopy temperature (R2 = 0.81; RMSE = 1.2 °C), thereby confirming the reliability of UAV-based indices in real-field applications. The structural data (canopy height), spectral metrics (NDVI), and thermal maps provided complementary insights into plant architecture, vigor, and physiological status (Figure 5), supporting a multifactorial approach to crop performance evaluation.
In addition to in-field monitoring, a novel aspect of the research was the incorporation of post-harvest microbiological quality assessments. These confirmed the hygienic suitability of M. oleifera leaf powders for human consumption, thereby connecting remote sensing outputs with product safety standards and extending the application of UAV technologies from precision agriculture to functional food production.
The comparative analysis of genotypes (Table 1) further highlighted the superior performance of the PKM2 genotype, which exhibited the highest NDVI (0.91), lowest canopy temperature (29.3 °C), and greatest biomass yield (2.7 kg/plant). These results underscore the potential of UAV-based phenotyping for guiding genotype selection and resource-efficient cultivation in water-limited environments.
Overall, this research presents a replicable and validated UAV-based workflow that spans the full agricultural value chain—from real-time crop monitoring and stress detection to post-harvest quality assurance. The methodology contributes to the advancement of smart, sustainable agriculture in semiarid regions and supports the integration of non-conventional, climate-resilient crops like M. oleifera into circular bioeconomy frameworks. Future applications could further benefit from integrating decision support systems, yield prediction models, and automated UAV tasking protocols to enhance operational scalability and precision.

Author Contributions

Conceptualization, C.G., R.G. and M.M.M.; methodology, C.G., R.G., S.O., S.C. and M.M.M.; software, A.A. and S.O.; validation, L.S. and S.C.; formal analysis, C.G., R.G., A.A. and S.O.; investigation, L.S. and A.A.; resources, S.C. and M.M.M.; data curation, C.G. and S.O.; writing—original draft preparation, C.G., R.G. and S.O.; writing—review and editing, C.G., R.G., L.S. and A.A.; visualization, C.G., L.S., S.O., S.C. and M.M.M. All authors have read and agreed to the published version of the manuscript.

Funding

The author(s) declare that financial support was received for the research and/or publication of this article. This research was funded by Convenzione GAL Rocca di Cerere Geopark/CREA DC dal Titolo: Valorizzazione di Specie Vegetali di Interesse Agroalimentare e Nutraceutico con Tecniche Innovative e sostenibili—Val. S. A N. I. S.—Cup: G78H23001250007.

Institutional Review Board Statement

Not applicable.

Data Availability Statement

The raw data supporting the conclusions of this article will be made available by the authors on request.

Acknowledgments

The authors would like to thank the Cooperativa Agricola Primo Sole for hosting the field experiments in Santa Flavia (Palermo, Italy), and Salvatore Amoroso of the technical staff for their support in field maintenance and UAV data collection. This study was conducted as part of a broader initiative on precision agriculture and climate-resilient crops in Mediterranean environments within the “CONTRATTO DI SOVVENZIONE Rif. Progetto. Numero A1-1.1-159, Recherche et innovation dans le domaine des espèces végétales d’intérêt agroalimentaire, nutraceutique et en voie d’extinction en Sicile et en Tunisie, RÉINVESTIR—codice CUP B73C25000290002—INTERREG NEXT Italie—Tunisie 2021 -2027” and within the first Food District Call—District Contract Program “Distretto del Cibo Bio Slow Pane e Olio”—CUP: J95B02000030007. Piano di diffusione delle innovazioni nell’ambito del primo Bando Distretti del cibo—Programma del Contratto di Distretto “Distretto del cibo Bio Slow Pane e Olio”: J95B02000030007.

Conflicts of Interest

The authors declare no conflicts of interest.

References

  1. Taha, M.F.; Mao, H.; Zhang, Z.; Elmasry, G.; Awad, M.A.; Abdalla, A.; Mousa, S.; Elwakeel, A.E.; Elsherbiny, O. Emerging Technologies for Precision Crop Management Towards Agriculture 5.0: A Comprehensive Overview. Agriculture 2025, 15, 582. [Google Scholar] [CrossRef]
  2. Fountas, S.; Malounas, I.; Athanasakos, L.; Avgoustakis, I.; Espejo-Garcia, B. AI-assisted vision for agricultural robots. AgriEngineering 2022, 4, 674–694. [Google Scholar] [CrossRef]
  3. Fountas, S.; Espejo-García, B.; Kasimati, A.; Gemtou, M.; Panoutsopoulos, H.; Anastasiou, E. Agriculture 5.0: Cutting-Edge Technologies, Trends, and Challenges. IT Prof. 2024, 26, 40–47. [Google Scholar] [CrossRef]
  4. Karagiannis, P.; Kotsaris, P.; Xanthakis, V.; Vasilaros, P.; Michalos, G.; Makris, S.; van Evert, F.K.; Nieuwenhuizen, A.T.; Fountas, S.; Chryssolouris, G. On an intelligent system to plan agricultural operations. Smart Agric. Technol. 2025, 10, 100707. [Google Scholar] [CrossRef]
  5. Mourtzis, D.; Angelopoulos, J.; Panopoulos, N. A Literature Review of the Challenges and Opportunities of the Transition from Industry 4.0 to Society 5.0. Energies 2022, 15, 6276. [Google Scholar] [CrossRef]
  6. Behmann, J.; Mahlein, A.-K.; Rumpf, T.; Römer, C.; Plümer, L. A Review of Advanced Machine Learning Methods for the Detection of Biotic Stress in Precision Crop Protection. Precis. Agric. 2015, 16, 239–260. [Google Scholar] [CrossRef]
  7. Shafi, U.; Mumtaz, R.; García-Nieto, J.; Hassan, S.A.; Zaidi, S.A.R.; Iqbal, N. Precision Agriculture Techniques and Practices: From Considerations to Applications. Sensors 2019, 19, 3796. [Google Scholar] [CrossRef]
  8. Gemtou, M.; Isakhanyan, G.; Fountas, S. Advancing climate-smart agriculture: integrating technology, behavioural insights and policy for a sustainable future. Smart Agric. Technol. 2025, 11, 100861. [Google Scholar] [CrossRef]
  9. Polymeni, S.; Skoutas, D.N.; Sarigiannidis, P.; Kormentzas, G.; Skianis, C. Smart agriculture and greenhouse gas emission mitigation: A 6G-IoT perspective. Electronics 2024, 13, 1480. [Google Scholar] [CrossRef]
  10. Ndubuaku, U.M.; Uchenna, N.V.; Baiyeri, K.P.; Ukonze, J. Anti nutrient, vitamin and other phytochemical compositions of old and succulent moringa (Moringa oleifera Lam) leaves as influenced by poultry manure application. Afr. J. Biotech. 2015, 14, 2502–2509. [Google Scholar] [CrossRef]
  11. Daba, M. Miracle tree: a review on multi-purposes of Moringa oleifera and its implication for climate change mitigation. J. Earth. Sci. Clim. Change 2016, 7, 366. [Google Scholar] [CrossRef]
  12. Yang, K.H.; Lee, M.H.; Yoe, H. Designing an Open Field Precision Agriculture System Using Drones. In Proceedings of the 2023 Congress in Computer Science, Computer Engineering & Applied Computing (CSCE), Las Vegas, NV, USA, 24–27 July 2023; pp. 1691–1694. [Google Scholar] [CrossRef]
  13. Garofalo, G.; Buzzanca, C.; Ponte, M.; Barbera, M.; D’Amico, A.; Greco, C.; Mammano, M.M.; Franciosi, E.; Piazzese, D.; Guarrasi, V.; et al. Comprehensive analysis of Moringa oleifera leaves’ antioxidant properties in ovine cheese. Food Biosci. 2024, 61, 104974. [Google Scholar] [CrossRef]
  14. Conte, L.; Prakofjewa, J.; Floridia, T.; Stocco, A.; Comar, V.; Gonella, F.; Lo Cascio, M. Learning from farmers on potentials and limits for an agroecological transition: a participatory action research in Western Sicily. Front. Environ. Sci. 2024, 12, 1347915. [Google Scholar] [CrossRef]
  15. Jiang, R.; Sánchez-Azofeifa, G.A.; Laakso, K.; Wang, P.; Xu, Y.; Zhou, Z.; Luo, X.; Lan, Y.; Zhao, G.; Chen, X. UAV-based partially sampling system for rapid NDVI mapping in the evaluation of rice nitrogen use efficiency. J. Clean. Prod. 2021, 289, 125705. [Google Scholar] [CrossRef]
  16. Solano-Alvarez, N.; Valencia-Hernández, J.A.; Vergara-Pineda, S.; Millán-Almaraz, J.R.; Torres-Pacheco, I.; Guevara-González, R.G. Comparative Analysis of the NDVI and NGBVI as Indicators of the Protective Effect of Beneficial Bacteria in Conditions of Biotic Stress. Plants 2022, 11, 932. [Google Scholar] [CrossRef]
  17. Malik, M.S.; Shukla, J.P.; Mishra, S. Relationship of LST, NDBI and NDVI using Landsat-8 data in Kandaihimmat Watershed, Hoshangabad, India. Indian J. Geo-Mar. Sci. 2019, 48, 25–31. [Google Scholar]
  18. Govil, H.; Guha, S.; Diwan, P.; Gill, N.; Dey, A. Analyzing linear relationships of LST with NDVI and MNDISI using various resolution levels of Landsat 8 OLI and TIRS data. In Data Management, Analytics and Innovation: Proceedings of ICDMAI 2019; Springer: Singapore, 2020; Volume 1, pp. 171–184. [Google Scholar]
  19. Budiman, I.; Asri, E.D.; Aidha, Z.R. The Smart Agriculture based on Reconstructed Thermal Image. In Proceedings of the 2nd International Conference on Intelligent Technologies (CONIT), Hubli, India, 24–26 June 2022; pp. 1–6. [Google Scholar] [CrossRef]
  20. Kottek, M.; Grieser, J.; Beck, C.; Rudolf, B.; Rubel, F. World map of the Köppen-Geiger climate classification updated. Meteorol. Z. 2006, 15, 259. [Google Scholar] [CrossRef] [PubMed]
  21. Greco, C.; Catania, P.; Orlando, S.; Vallone, M.; Mammano, M.M. Assessment of vegetation indices as tool to decision support system for aromatic crops. In Proceedings of the Conference SHWA: Safety, Health and Welfare in Agriculture and Agro-food Systems 2024, Ragusa, Italy, 6–9 September 2023; pp. 322–331. [Google Scholar]
  22. Mammano, M.M.; Comparetti, A.; Ciulla, S.; Greco, C.; Orlando, S. A Prototype of Photovoltaic Dryer for Nutraceutical and Aromatic Plants. In AIIA 2022: Biosystems Engineering Towards the Green Deal. AIIA 2022; Ferro, V., Giordano, G., Orlando, S., Vallone, M., Cascone, G., Porto, S.M.C., Eds.; Lecture Notes in Civil Engineering; Springer: Cham, Switzerland, 2023; Volume 337. [Google Scholar] [CrossRef]
  23. Greco, C.; Gaglio, R.; Settanni, L.; Sciurba, L.; Ciulla, S.; Orlando, S.; Mammano, M.M. Smart Farming Technologies for Sustainable Agriculture: A Case Study of a Mediterranean Aromatic Farm. Agriculture 2025, 15, 810. [Google Scholar] [CrossRef]
  24. Greco, C.; Catania, P.; Orlando, S.; Vallone, M.; Mammano, M.M. A Sustainable Smart Dryer for Aromatic Herbs. In Biosystems Engineering Promoting Resilience to Climate Change—AIIA 2024—Mid-Term Conference. MID-TERM AIIA 2024; Sartori, L., Tarolli, P., Guerrini, L., Zuecco, G., Pezzuolo, A., Eds.; Lecture Notes in Civil Engineering; Springer: Cham, Switzerland, 2025; Volume 586. [Google Scholar] [CrossRef]
  25. Costa, J.M.; Grant, O.; Chaves, M. Use of Thermal Imaging in Viticulture: Current Application and Future Prospects. In Methodologies and Results in Grapevine Research; Delrot, S., Medrano, H., Or, E., Bavaresco, L., Grando, S., Eds.; Springer: Dordrecht, the Netherlands, 2010. [Google Scholar] [CrossRef]
  26. Wen, T.; Li, J.H.; Wang, Q.; Gao, Y.Y.; Hao, G.F.; Song, B.A. Thermal imaging: The digital eye facilitates high-throughput phenotyping traits of plant growth and stress responses. Sci. Total Environ. 2023, 899, 165626. [Google Scholar] [CrossRef] [PubMed]
  27. Pou, A.; Diago, M.P.; Medrano, H.; Baluja, J.; Tardaguila, J. Validation of thermal indices for water status identification in grapevine. Agric. Water Manag. 2014, 134, 60–72. [Google Scholar] [CrossRef]
  28. Boesch, R. THERMAL REMOTE SENSING WITH UAV-BASED WORKFLOWS. Int. Arch. Photogramm. Remote Sens. Spatial Inf. Sci. 2017, XLII-2/W6, 41–46. [Google Scholar] [CrossRef]
  29. Ipate, G.; Cotici, C.D.; Ionescu, A.; Fătu, V.; Găgeanu, I.; Cujbescu, D.; Nicolau, A.M. Evaluation of the thermal behavior of plants in the microgreenhouse with microbolometric image sensors. INMATEH Agric. Eng. 2023, 71, 558–565. [Google Scholar] [CrossRef]
  30. Almeida, T.A.B.; Montenegro, A.A.A.; da Silva, R.A.B.; de Lima, J.L.M.P.; Carvalho, A.A.d.; da Silva, J.R.L. Evaluating Daily Water Stress Index (DWSI) Using Thermal Imaging of Neem Tree Canopies under Bare Soil and Mulching Conditions. Remote Sens. 2024, 16, 2782. [Google Scholar] [CrossRef]
  31. Gerhards, M.; Rock, G.; Schlerf, M.; Udelhoven, T. Water stress detection in potato plants using leaf temperature, emissivity, and reflectance. Int. J. Appl. Earth Obs. Geoinf. 2016, 53, 27–39. [Google Scholar] [CrossRef]
  32. Kusnierek, K.; Korsaeth, A. Challenges in using an analog uncooled microbolometer thermal camera to measure crop temperature. Int. J. Agric. Biol. Eng. 2014, 7, 60–74. [Google Scholar]
  33. Möller, M.; Alchanatis, V.; Cohen, Y.; Meron, M.; Tsipris, J.; Naor, A.; Ostrovsky, V.; Sprintsin, M.; Cohen, S. Use of thermal and visible imagery for estimating crop water status of irrigated grapevine. J. Exp. Bot. 2007, 58, 827–838. [Google Scholar] [CrossRef] [PubMed]
  34. Jones, H.G.; Serraj, R.; Loveys, B.R.; Xiong, L.; Wheaton, A.; Price, A.H. Thermal infrared imaging of crop canopies for the remote diagnosis and quantification of plant responses to water stress in the field. Funct. Plant Biol. 2009, 36, 978–989. [Google Scholar] [CrossRef]
  35. Shafiekhani, A.; Fritschi, F.B.; DeSouza, G.N. A New 4D-RGB Mapping Technique for Field-Based High-Throughput Phenotyping. In Proceedings of the BMVC 2018, Newcastle, UK, 3–6 September 2018; p. 322. [Google Scholar]
  36. Raza, S.E.A.; Prince, G.; Clarkson, J.P.; Rajpoot, N.M. Automatic detection of diseased tomato plants using thermal and stereo visible light images. PLoS ONE 2015, 10, e0123262. [Google Scholar] [CrossRef] [PubMed]
  37. Aversano, R. Integration of thermal and RGB sensors in precision agriculture: A review. Agric. Syst. 2022, 195, 103303. [Google Scholar]
  38. Poblete, T.; Gonzalez-Dugo, V.; Hornero, A.; Zarco-Tejada, P.J. Water stress detection in olive at the farm level using high-resolution multispectral airborne imagery: assessment against canopy temperature. In Proceedings of the II International Symposium on Precision Management of Orchards and Vineyards 2023, Tatura, VIC, Australia, 3–8 December 2023; Volume 1395, pp. 23–30. [Google Scholar]
  39. Zubler, D.; Yoon, S. Smartphone-enabled thermal monitoring for field applications. Agric. Sci. 2020, 11, 873–884. [Google Scholar]
  40. Younsuk, D.; Sloan, G.; Chappuies, J. Open-Source Time-Lapse Thermal Imaging Camera for CanopyTemperature Monitoring. Smart Agric. Technol. 2024, 7, 100430. [Google Scholar] [CrossRef]
  41. Chappuies, J.; Dong, Y. Creating Thermographic Profiles of Blueberry Plants using Open-Source Thermal Imaging and RGB Cameras. In Proceedings of the 2024 ASABE Annual International Meeting, Anaheim, CA, USA, 28–31 July 2024; American Society of Agricultural and Biological Engineers: St. Joseph, MI, USA, 2024; p. 1. [Google Scholar]
  42. Messina, G.; Modica, G. Applications of UAV Thermal Imagery in Precision Agriculture: State of the Art and Future Research Outlook. Remote Sens. 2020, 12, 1491. [Google Scholar] [CrossRef]
  43. Miceli, A.; Gaglio, R.; Francesca, N.; Ciminata, A.; Moschetti, G.; Settanni, L. Evolution of shelf life parameters of ready-to-eat escarole (Cichorium endivia var. Latifolium) subjected to different cutting operations. Sci. Hortic. 2019, 247, 175–183. [Google Scholar]
  44. Alfonzo, A.; Gaglio, R.; Miceli, A.; Francesca, N.; Di Gerlando, R.; Moschetti, G.; Settanni, L. Shelf life evaluation of fresh-cut red chicory subjected to different minimal processes. Food Microbiol. 2018, 73, 298–304. [Google Scholar] [CrossRef] [PubMed]
  45. Viola, E.; Buzzanca, C.; Tinebra, I.; Settanni, L.; Farina, V.; Gaglio, R.; Di Stefano, V. A functional end-use of avocado (cv. Hass) waste through traditional semolina sourdough bread production. Foods 2023, 12, 3743. [Google Scholar] [CrossRef]
  46. ISO 4833; Microbiology of Food and Animal Feeding Stuffs: Horizontal Method for the Enumeration of Microorganisms: Colony-Count Technique at 30 °C. International Organization for Standardization: Geneva, Switzerland, 2003.
  47. ISO 6888-2; Microbiology of Food and Animal Feeding Stuffs—Horizontal Method for the Enumeration of Coagulase Positive Staphylococci (Staphylococcus aureus and Other Species): Part 2: Technique Using Rabbit Plasma Fibrinogen Agar Medium. International Organization for Standardization: Geneva, Switzerland, 1999.
  48. ISO 7251: 2005; Microbiology of Food and Animal Feeding Stuffs—Horizontal Method for the Detection and Enumeration of Presumptive Escherichia coli—Most Probable Number Technique. International Standardization Organization: Geneva, Switzerland, 2005.
  49. ISO 11290-1; Microbiology of the Food Chain—Horizontal Method for the Detection and Enumeration of Listeria monocytogenes and of Listeria spp. Part 1: Detection Method. International Organization for Standardization: Geneva, Switzerland, 2017.
  50. ISO 6579-1; Microbiology of the Food Chain—Horizontal Method for the Detection, Enumeration and Serotyping of Salmonella–Part 1: Detection of Salmonella spp. International Organization for Standardization: Geneva, Switzerland, 2017.
  51. Greco, C.; Catania, P.; Orlando, S.; Calderone, G.; Mammano, M.M. Rosemary Biomass Estimation from UAV Multispectral Camera. In Biosystems Engineering Promoting Resilience to Climate Change—AIIA 2024—Mid-Term Conference. MID-TERM AIIA 2024; Sartori, L., Tarolli, P., Guerrini, L., Zuecco, G., Pezzuolo, A., Eds.; Lecture Notes in Civil Engineering; Springer: Cham, Switzerland, 2025; Volume 586. [Google Scholar] [CrossRef]
  52. Commission Regulation (EC). No 2073/2005 of 15 November 2005 on microbiological criteria for foodstuffs. Off. J. Eur. Union 2005, 338, 1–26. [Google Scholar]
  53. Banach, J.L.; Stratakou, I.; van der Fels-Klerx, H.J.; Besten, H.M.W.; de Zwietering, M.H. European alerting and monitoring data as inputs for the risk assessment of microbiological and chemical hazards in spices and herbs. Food Control. 2016, 69, 237–249. [Google Scholar] [CrossRef]
  54. Food and Drug Administration (FDA). FDA Draft Risk Profile: Pathogens and Filth in Spices; Center for Food Safety and Applied Nutrition, US Department of Health and Human Services: College Park, MD, USA, 2013.
  55. Gerba, C.P.; Pepper, I.L. Microbial contaminants. Environ. Pollut. Sci. 2019, 191–217. [Google Scholar]
  56. ICMSF. International Commission on Microbiological Specifications for Foods. Spices, herbs, and vegetable seasonings. In Microorganisms in Foods, Microbial Ecology of Food Commodities; ICMSF: Montreal, QC, Canada, 2005; pp. 360–372. [Google Scholar]
Figure 1. UAV-based Smart Monitoring System for M. oleifera.
Agriculture 15 01359 g001
Figure 2. Experimental design with the four genotypes origin.
Agriculture 15 01359 g002
Figure 3. M. oleifera monitoring through Precision Agriculture. RGB orthomosaic and canopy structure of Moringa oleifera genotypes across three phenological stages. Orthomosaic images collected on 31 July, 4 September, and 30 October 2024, at 35 m altitude. Visual differences in canopy density and color intensity reflect physiological development and biomass accumulation. North is oriented upwards. Each subplot represents a 10 m × 10 m area. No filtering applied. Scale bar = 5 m.
Agriculture 15 01359 g003
Figure 4. Projected canopy surface area (m2) of four genotypes (A, I, PKM1, PKM2) of Moringa oleifera across three periods (31 July, 4 September, 30 October 2024). NDVI maps derived from multispectral UAV data showing vegetative vigor dynamics in Moringa oleifera. NDVI values range from 0.2 (red, low vigor) to 0.9 (dark green, high vigor). Maps correspond to flights on 31 July, 4 September, and 30 October 2024. The color bar legend is included to represent vegetative vigor categories. Scale bar = 5 m.
Agriculture 15 01359 g004
Figure 5. UAV-based spatial analysis outputs for Moringa oleifera showing NDVI (left), canopy temperature (middle), and plant height (right). Thermal orthomosaics show surface temperature maps (°C) for selected genotypes. Data were acquired on 4 September and 30 October 2024, at midday (11:00–13:00 CEST) under clear sky conditions. Temperature values range from 21 °C (blue) to 36 °C (red), as shown in the legend. Hotspots indicate potential water stress. Maps were generated using FLIR Tools and QGIS. Scale bar = 5 m.
Agriculture 15 01359 g005
Figure 6. Distribution of canopy temperature, plant height, and NDVI values (July, September, and October) among four Moringa oleifera genotypes. Abbreviations: A, African genotype; I, Indian genotype; PKM1, Pakistani M1 genotype; PKM2, Pakistani M2 genotype. The heat map plot depicts the relative intensity of each variable (variables clustering on the y-axis) within each genotype (x-axis clustering).
Agriculture 15 01359 g006
Table 1. Vegetative and physiological traits of Moringa oleifera genotypes under Mediterranean conditions.
GenotypeNDVI (30 October)Canopy Temp (°C)CWSIBiomass Yield (kg/Plant)Leaf Dry Weight (%)Chlorophyll Index (SPAD)
A0.8830.10.422.422.545.2
I0.8231.40.552.120.141.6
PKM10.7932.00.611.819.840.3
PKM20.9129.30.362.723.347.5
Abbreviations: A, African genotype; I, Indian genotype; PKM1 Pakistani M1 genotype; PKM2, Pakistani M2 genotype.
Table 2. Comparison between UAV-derived and ground-truth measurements in Moringa oleifera monitoring.
ParameterUAV-Derived MeasurementGround MeasurementCorrelation Coefficient (R2)RMSE
Plant height (m)Based on DSM/DTMManual measurement (ruler/tape)0.920.08 m
NDVI (unitless)Multispectral sensor (Red and NIR)SPAD chlorophyll meter0.850.04
Canopy temperature (°C)Thermal infrared imagingHandheld IR thermometer0.811.2 °C
Table 3. Microbial loads of microorganisms in four M. oleifera leaf powder samples.
SampleTMMCPSE. coliL. monocytogenesSalmonella spp.
A2.95 ± 0.29 an.d.n.d.n.d.n.d.
I3.07 ± 0.18 an.d.n.d.n.d.n.d.
PKM13.14 ± 0.15 an.d.n.d.n.d.n.d.
PKM22.84 ± 0.23 an.d.n.d.n.d.n.d.
p value0.405n.e.n.e.n.e.n.e.
Abbreviations: A, African genotype; I, Indian genotype; PKM1 Pakistani M1 genotype; PKM2, Pakistani M2 genotype; TMM, total mesophilic microorganisms; CPS, coagulase-positive staphylococci; n.d., not detected; n.e., not evaluated. Values in the same column followed by the same letter are not significantly different, as determined by Tukey’s test.
Disclaimer/Publisher’s Note: The statements, opinions and data contained in all publications are solely those of the individual author(s) and contributor(s) and not of MDPI and/or the editor(s). MDPI and/or the editor(s) disclaim responsibility for any injury to people or property resulting from any ideas, methods, instructions or products referred to in the content.

