Article

Evaluation of Split Root Nutrient Film Technique (SR-NFT) for Yield and Tipburn of Hydroponically Grown Lettuce (Lactuca sativa L.) Under Differing Nutrient Concentrations

1
School of Integrative Plant Science, Cornell University, Ithaca, NY 14850, USA
2
School of Agriculture and Aquatic Sciences, Aurora State College of Technology, Bazal Campus, Maria Aurora, Aurora 3202, Philippines
*
Author to whom correspondence should be addressed.
Agriculture 2025, 15(13), 1350; https://doi.org/10.3390/agriculture15131350
Submission received: 9 May 2025 / Revised: 11 June 2025 / Accepted: 13 June 2025 / Published: 24 June 2025

Abstract

Previous research has shown the benefits of splitting nutrient application to plant roots either temporally or spatially. A split-root nutrient film technique (SR-NFT) was developed for lettuce where an NFT channel is divided longitudinally into two separate channels, each with its own input and drain line. In this system, plant roots can be intentionally divided to supply different nutrient solutions without mixing them. Plant growth was observed using combinations of three different hydroponic fertilizer concentrations: EC 0.5 dS∙m−1 (L, tap water), EC 1.8 dS∙m−1 (M, nutrient solution), and EC 3.1 dS∙m−1 (H, nutrient solution). For the same average concentration of solution (EC 1.8 dS∙m-1), SR-NFT that supplied different concentrations of solution on the left and right side (SHL, Left; EC 0.5 dS∙m−1, Right; EC 3.1 dS∙m−1) increased the shoot fresh and dry weight by 15%, shoot dry weight by 14%, and root dry weight by 25% without increasing number of tipburn leaves compared to conventional NFT (MM, EC 1.8 dS∙m−1). In addition, the lowest concentration with SR-NFT (SML, Left; EC 1.8 dS∙m−1, Right; EC 0.5 dS∙m−1) reduced the number of tipburn leaves without reducing the shoot fresh weight in all conditions except SMM (Left; EC 1.8 dS∙m−1, Right; EC 1.8 dS∙m−1). In other words, the use of tap water on one side is expected to suppress tipburn or increase yield.

1. Introduction

Lettuce (Lactuca sativa) is an economically important crop, with over 28.08 million tons of lettuce produced in open fields and greenhouses in 2023 [1]. The global lettuce harvested area in 2023 was 1.26 million hectares [1]. Global lettuce production had been increasing until 2018, but growth has slowed down in recent years. The United States was the second-largest lettuce-producing country in 2023, following mainland China, and the third-largest in harvested area, following mainland China and India. In 2023, lettuce production in the U.S. was 4.71 million tons, with a production area of 134 thousand hectares. In 2019, lettuce was the third most consumed food in the U.S., after potatoes and tomatoes, with 25.1 pounds consumed per capita per year [2]. Charles et al. showed that the annual yield of lettuce was higher in a greenhouse than in a field [3]. This is due to year-round production cycles in a greenhouse, while field production is limited by season.
There are a variety of production methods used in greenhouse lettuce cultivation, including nutrient film technique (NFT) and deep water culture (DWC) [4]. The two methods differ mostly by the volume of water that the roots are grown in; NFT uses a shallow stream of water, while DWC fully submerges the root system. DWC is more stable with less fluctuation in nutrient concentration, pH, and water temperature due to its larger volume per plant [4].
Tipburn is a significant physiological issue that reduces the quality and marketable value of lettuce. There are two types of tipburn: inner leaf tipburn and outer leaf marginal necrosis [5]. Inner leaf tipburn is caused by an insufficient calcium supply to the growing young leaves. High humidity, lack of airflow, or poor root development will limit plant transpiration, resulting in insufficient calcium supply to the plants. There are three ways to prevent inner leaf tipburn. The first is to ensure that the nutrient solution contains sufficient calcium. The second is to promote transpiration of plants, using lower humidity and better ventilation to promote transpiration of the plants. Vertical air flow (VAF) fans can be used to provide sufficient air to the lettuce center. The third is to avoid excessive daily light integrals (DLI). Tipburn occurs more frequently when DLI exceeds 17 mol∙m2∙d−1 [6].
Previous research has shown tipburn symptoms were greatest at electric conductivity (EC) 1.8 dS∙m−1, while lower EC exhibited reduced symptoms [7]. However, while lower EC reduced tipburn symptoms, it also resulted in reduced yield [8]. The application of a foliar calcium chloride spray has been shown to reduce tipburn symptoms. However, this approach can lead to excess moisture on the surface of the leaves, potentially contributing to foliar diseases such as powdery mildew [9].
Nutrient delivery can be adjusted both temporally (over time) and spatially (delivering different concentrations to different parts of the root system). Overall, studies have shown that, the higher the nutrient concentration, the more nutrients are absorbed [7,10]. Cresswell (1991) showed that, when nutrient concentrations were higher during the day than at night, shoot fresh weight did not differ, but tipburn was reduced compared to when concentrations were the same during the day and night for lettuce [11]. Masuda et al. (1990) showed that tomatoes and cucumbers absorbed more water and nutrients during the day than at night [12]. Also, the amount of nutrients per unit volume of water absorbed was higher at night than during the day. Both daytime and nighttime water absorption decrease with increased nutrient concentrations. Nutrient absorption, except for Ca, increased during the day and at night as nutrient concentrations were increased. Ca absorption during the day decreases with increasing nutrient solution concentration but increases at night. Albornoz (2016) et al. investigated whether the daily pattern of absorption of each nutrient was affected by the age of the plants [13]. N, P, and K absorption decreased with age, but not for Ca, Mg, and S. In general, water and nutrients are absorbed by transpiration during the day and by osmotic pressure at night. Additionally, this study showed that all nutrients are released at some time during the day and night. Albornoz et al. (2015) showed that, at 25 °C and 600 PPF, the nighttime uptake rate of Ca, Mg, and S was negative, meaning that nutrients were released [14]. In other words, the release of calcium at night may increase the risk of tipburn.
A technique known as split root system (SRS) has been used in plant biology studies for decades, allowing for adjusted spatial delivery of nutrients to plant root systems. The oldest study of the split root system is by Wiersum in 1958 [15]. This was a study of the effect of peas on roots in response to single ions in pot culture. Tomatoes grown in different concentrations of nutrient solution under SRS had higher yields and lower blossom end rot (BER) than tomatoes grown in uniform concentrations of nutrient solution [16]. Furthermore, the calcium content in leaves and stems was higher at uneven concentrations. Italian ryegrass was supplied with nitrate to only half of the root system via SRS, showing that nitrate-containing roots were able to absorb more nitrate to make up for the deficiency [17]. Root biomass was higher for roots that had uneven nitrate supply than for roots that had even nitrate supply. Corina et al. explored the effects of locally high concentrations of phosphorus on plant growth and nitrate uptake [18]. The results showed that nitrate absorption was inhibited when the entire root was highly phosphate. However, localized high concentrations of phosphate resulted in the same amount of nitrate absorption as plants whose roots were exposed to medium concentrations. Cucumbers grown in SRS with calcium and phosphorus were supplied separately to prevent sedimentation, resulting in increased chlorophyll concentration and stomatal conductance, improved photosynthesis, and increased biomass and yield [19]. In a tomato experiment with SRS supplying nutrient solution and clear water for 30 days, shoot and root dry weight were not found to be significantly different from nutrient solution only [20]. Another tomato experiment found that the combination of high salinity nutrient solution and clear water increased yield for both high salinity concentrations, but the combination of medium salinity concentration and clear water did not increase it [21]. No research on hydroponic SRS lettuce production has been reported to date. Further, most previous research on SRS has focused on scientific aspects of root nutrient uptake rather than crop yield and quality. For this study, we developed a Split Root Nutrient film technique (SR-NFT) where an NFT channel is divided longitudinally into two separate channels with their own input and drain line. In the system, plant roots can be intentionally divided to supply different nutrient solutions to each half without mixing them.
This study aims to inform about the potential benefits and limitations of SR-NFT, especially in relation to nutrient management strategies. In that aim, our experiment had two specific objectives. First, we investigated the impact of SR-NFT on yield and tipburn compared to conventional NFT with the same nutrient concentrations. We hypothesized that uniform nutrient concentrations would not affect plants in NFT and SR-NFT. In other words, there would be no difference in plant response between NFT and SR-NFT. Second, we investigated the effects of SR-NFT on yield and tipburn at non-uniform nutrient concentrations. We hypothesized that, when SRS had uniform nutrient concentrations, their growth would not be affected vs. traditional NFT with a single nutrient concentration. However, when SRS had uneven nutrient concentrations, plant growth and quality would be impacted.

2. Materials and Methods

2.1. Seedling Nursery System

A butterhead lettuce (Lactuca sativa) variety, ‘Rex’, was used for this experiment as it is one of the most common butterhead lettuce varieties in controlled environment agriculture (CEA) and was selected to be suitable for research on the effects of tipburn. Plants were germinated in cell trays (128 pcs) in 1-inch rockwool cubes for 1 week, then transplanted into 1-inch net pots and irrigated with nutrient solution in a growth chamber for an additional week (Figure 1). During this nursery stage, air pumps and air stones were used to increase the dissolved oxygen in the nutrient solution to allow the roots to grow large enough to extend beyond the rockwool cubes to facilitate transplanting in SR-NFT. The nutrient solution was 15 N-5 P-15 K Jack’s CA-MG LX (J.R. Peters Inc., Allentown, PA, USA) (0.9 g∙L−1). Lighting fixtures were used at 340 µmol∙m2∙s−1 for a photoperiod of 16 h per day, resulting in a DLI of 19.6 mol∙m2∙s−1. Plants were kept in a growth chamber with 23 °C (73.4 F) day and night temperatures.

2.2. Growing System

Nutrient film technique (NFT) and split root nutrient film technique (SR-NFT) (Figure 2) channels (HydroCycle 4″ Pro NFT Series–1.5″ Deep) were used for this experiment. The SR-NFT was created by fixing plastic plates 3 mm thick and 23 mm in the center of the NFT channel. The plates were caulked with silicone to provide a water-tight seal along the center divider to avoid mixing of the nutrient solution and the plant roots. In the system design, drain lines at the end of the channel returned each EC-specific nutrient solution back to the proper reservoir for subsequent recirculation.
Plants were transplanted from the growth chamber to these systems in the greenhouse at 14 days after seeding (Figure 1). All plants were irrigated with the same nutrient solution (EC 1.8 dS∙m−1) for the initial 2 days or 3 days after transplanting (Figure 1). Three trials were conducted with seeding on 5 July, 28 July, and 21 August 2023.
After that, the following treatments were used: Low (L, EC = 0.5 dS∙m−1), Medium (M, EC = 1.8 dS∙m−1), or High (H, EC = 3.1 dS∙m−1). Two emitters (12.1 L∙h−1) were used to supply nutrients to each NFT channel. For each crop cycle, we had two blocks (each with one NFT channel consisting of seven plants per treatment) with a total of three replicate crop cycles. The following treatments were implemented: control (no split root, traditional NFT): MM and five split root treatments based on a combination of EC conditions (SR-NFT treatments, beginning with an S): SMM, SML, SHM, SHL, and SHH (Table 1). The circulating hydroponics nutrient solution was made by combing equal parts (0.99 g∙L−1 each for EC 1.8 dS∙m−1, 1.82 g∙L−1 each for EC 3.1 dS∙m−1) of 5 N-12 P-26 K part A (J.R. Peter’s Inc., Allentown, PA, USA) and 15.5 N-0 P-0 K YaraLiva Calcinit (Yara International, Oslo, Norway) [22] (Table 2). The clear water had an EC of 0.5 dS∙m−1. The nutrient solution pH was adjusted daily to a range of 5.5–6.0 using 1 M KOH and 1 M H2SO4. Each nutrient solution was measured daily for pH, EC, and water temperature (Bluelab Combo Meter; Bluelab, New Zealand) (Table 3). The nutrient solution in each reservoir was completely replaced weekly to maintain EC and nutrient content.
Temperature and light in the greenhouse were recorded and controlled by the Argus control system. Daily light integral (DLI) is typically set at 17 mol∙m2∙d−1 for lettuce [23]. In this experiment, however, the DLI was set higher than DLI 19 mol∙m2∙d−1 to encourage tipburn expression (Table 4, Figure 3). Photosynthetically Active Radiation was logged using a single full-spectrum quantum sensor (SQ-520, Apogee Instruments, Logan, UT, USA) for each block. The supplemental lighting schedule was from about 18 to 19 h daily, and fine-scale adjustment was made for each trial to take into account seasonal patterns in ambient DLI to achieve >19 mol∙m2∙d−1.

2.3. Measurements

The following measurements were collected on a weekly basis: tipburn index (the same person evaluated the score from 0 (none) to slight (1 point), medium (3 points), and heavy (5 points) (Figure 4) [24]), plant height (cm, from base to tallest leaf), rosette diameter (cm, two measurements taken at widest point and perpendicular to that point), and Chlorophyll content index (SPAD-502; Konica Minolta Sensing, Inc., Tokyo, Japan).
The volume was calculated assuming a semi-ellipsoid with the following equation:
V = 4 3 π × 1 2 D 1 × 1 2 D 2 × H × 1 2
V = Volume (cm3); D1 = D2 = Diameter (cm); H = Height (cm).
All plants were measured for shoot fresh weight (SFW), shoot dry weight (SDW), root dry weight (RDW), leaf count, and tipburn count (number of leaves with symptoms of tipburn) at harvest in Week 5. Seedlings were placed in a paper bag and into a mechanical convection oven (Freas 645; Thermo Electron Corp., Marietta, OH, USA) maintained at 70 °C for a minimum of 3 d to measure SDW and RDW. After measuring RDW, tissues from 14 plants were pooled together and ground into a fine powder. Three grams from each sample were submitted for tissue elemental analysis (JR PETERS LABORATORY). For tissue analysis, samples were dried for 24–72 h at 121 °C in a large convection oven [25]. After drying, the tissue was ground into a fine powder and turned into ash in a muffle furnace at 450 °C overnight. The ash was then digested with 2 mL of 6% HNO3 acid. Then, the solution was filtered through Whatman #40 filter paper. The resulting solution was analyzed for macronutrients (P, K, Ca, and Mg) and micronutrients (Fe, Mn, B, Cu, Zn, Al, and Na) using an inductively coupled plasma atomic emission spectrometer [26]. Sulfur (S) and nitrogen (N) were measured by the Carlo-Erba combustion oxidation/reduction reaction [27].

2.4. Statistical Analysis

The experiment was replicated over time for three trials. Within each trial, there were two blocks with each containing all six SRS treatments, where a randomized complete block design (RCBD) was used to determine the location for each treatment. Each SRS treatment was one NFT channel containing seven plants. Treatments within a block were re-randomized for each trial. All data were analyzed using Rstudio (Version 4. 3. 3.). Analysis of variance (ANOVA) and Tukey’s honest significance difference (HSD) test were used to determine differences in measurements based on each treatment. The plants used for the data were six plants per block, 36 plants per treatment in total, with the lowest SFW for each treatment excluded.

3. Results

3.1. Shoot

Volume increased over time in all treatments, with SHL showing the largest values, but these were not significantly different for all treatments and times (Table 5). Chlorophyll content index decreased once from week 3 of transplanting in all treatments and showed a maximum value in week 5 of the harvest. There are also no significant differences for all treatments and times (Table 5). Tipburn was observed only in SHH in week 3, but was not significantly different among all treatments. In Week 4, all treatments showed tipburn expression, with SHH having the highest value, and MM, SMM, and SML showing significant differences from SHH. In Week 5, like Week 4, SHH had the highest value, and MM and SML were significantly different from SHH (Table 5).
Regarding biomass, when a medium EC solution was used for both split root sections (i.e., SMM), SFW was not statistically larger than the traditional NFT with medium EC (i.e., MM). However, numerically, SFW was 9% greater for SMM vs. MM (Figure 5a). SHL and SHH had a 15% greater SFW than MM. While the treatments SHL and SHH were not statistically greater than SMM, there was a numerical pattern of 5% and 6% greater SFW than SMM; SDW showed almost the same pattern as SFW (Figure 5a). SHL, SHH, and SHM were 14%, 16%, and 14% higher than MM and significantly different. SMM was 5% higher than MM, but no significant difference (Figure 5b). The SR-NFT was shown to be equal to or higher in both SFW and SDW than traditional NFT.
There was no statistically significant difference in the number of leaves at harvest, though there is a numerical pattern similar to SFW/SDW, whereby some SR-NFT combinations had more leaves than the control treatment, MM (Figure 6a). SHH had the greatest number of tipburn leaves, which was greater than MM, SMM, and SML. SHL and SHM had statistically the same number of tipburn leaves as MM and SMM, and a greater amount than SML (Figure 6b).
Water content was calculated with the following equation:
W C = S F W S D W S F W × 100
WC = Water content (%), SFW = Shoot fresh weight (g), SDW = Shoot dry weight (g).
Water content was not significantly different based on treatments (Figure 7).
Leaf tissue nutrient concentration was not affected by split-root treatment for 9 out of 12 evaluated nutrients (N, P, K, Ca, Mg, S, Fe, Mn, B, Cu, Zn, Mo) (Figure 8). The dashed line shows five grades according to Patrick et al. [28]. Below purple indicates deficient levels, between purple and blue low, between blue and red insufficient, between red and green high, and green and above indicate excessive. All except sulfur and copper were sufficient or high. For phosphorus, boron, and molybdenum there was an effect of split-root treatment on leaf concentration. For example, for phosphorus, SHL had a greater concentration than SMM. For boron, SMM had a greater leaf concentration than MM and SHL, while SHL had a greater boron concentration than SHL (Figure 8).

3.2. Root

The total dry weight of the roots showed no significant difference between MM and SMM (Figure 9a). SHL exhibited the greatest shoot dry weight, which was greater than MM and SMM and SHM. Percent dry matter root was calculated with the following equation:
P D M R = R D W R D W + S D W × 100
PDMR = percent dry matter root (%), PDW = root dry weight (g), SDW = shoot dry weight (g).
Percent dry matter root showed almost the same pattern as root dry weight (Figure 9b). MM and SMM were not significantly different. The highest PDMR was for SHL, which was significantly greater than the lowest treatment.
The left side was supplied with a higher or the same concentration of nutrient solution compared to the right side. SMM and SHH had the same concentration of nutrient solution supplied and almost the same RDW on both left and right sides and were not significantly different (Figure 10a). The root rate is also close to 50% (Figure 10b). SML and SHM had an EC difference of 1.3 dS∙m−1 between the left and right nutrient solutions. RDWs on the left side of SML and SHM and on the right side of SML and SHM are almost the same and not significantly different (Figure 10a). SML and SHM root rates showed more roots on the left side (Figure 10b). SHH had an EC difference of 2.6 dS∙m−1 between the left and right nutrient solutions. SHL is highest on the left side of RDW and significantly different (Figure 10a). SHL was shown to have 67.8% of roots on the left side (Figure 10b).
Table 6 shows the analysis of variance of p-values of shoot fresh weight, shoot dry weight, root dry weight, number of leaves, and number of tip burn leaves.

4. Discussion

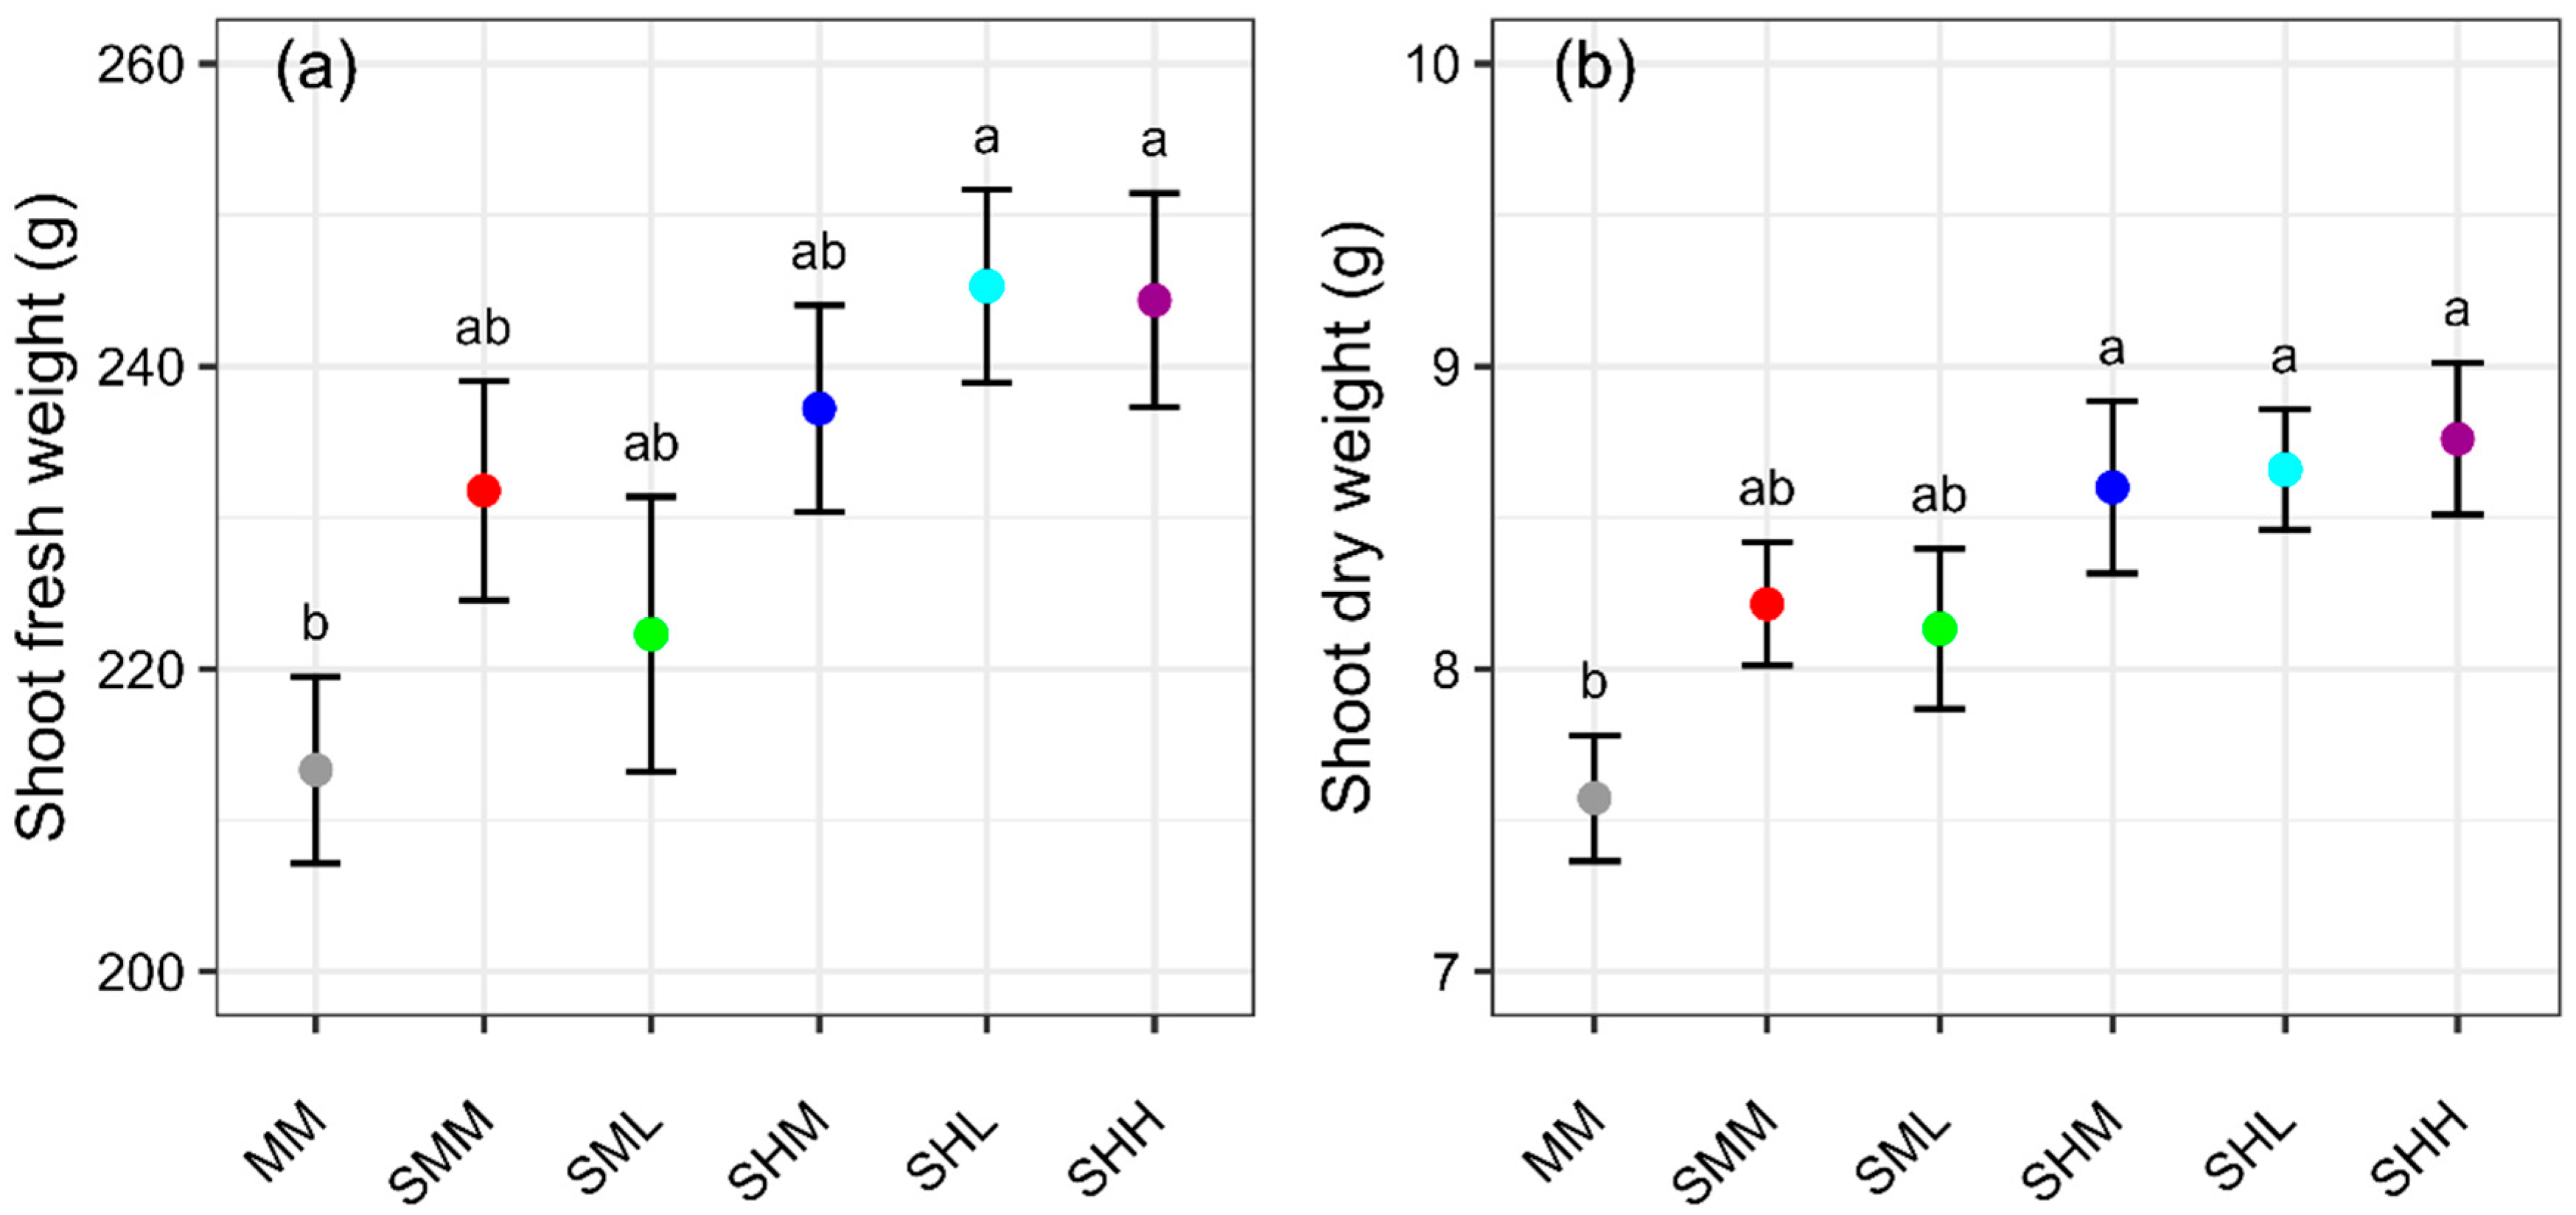
Comparing MM, SMM, and SHL (all had the same average EC of 1.8 dS∙m
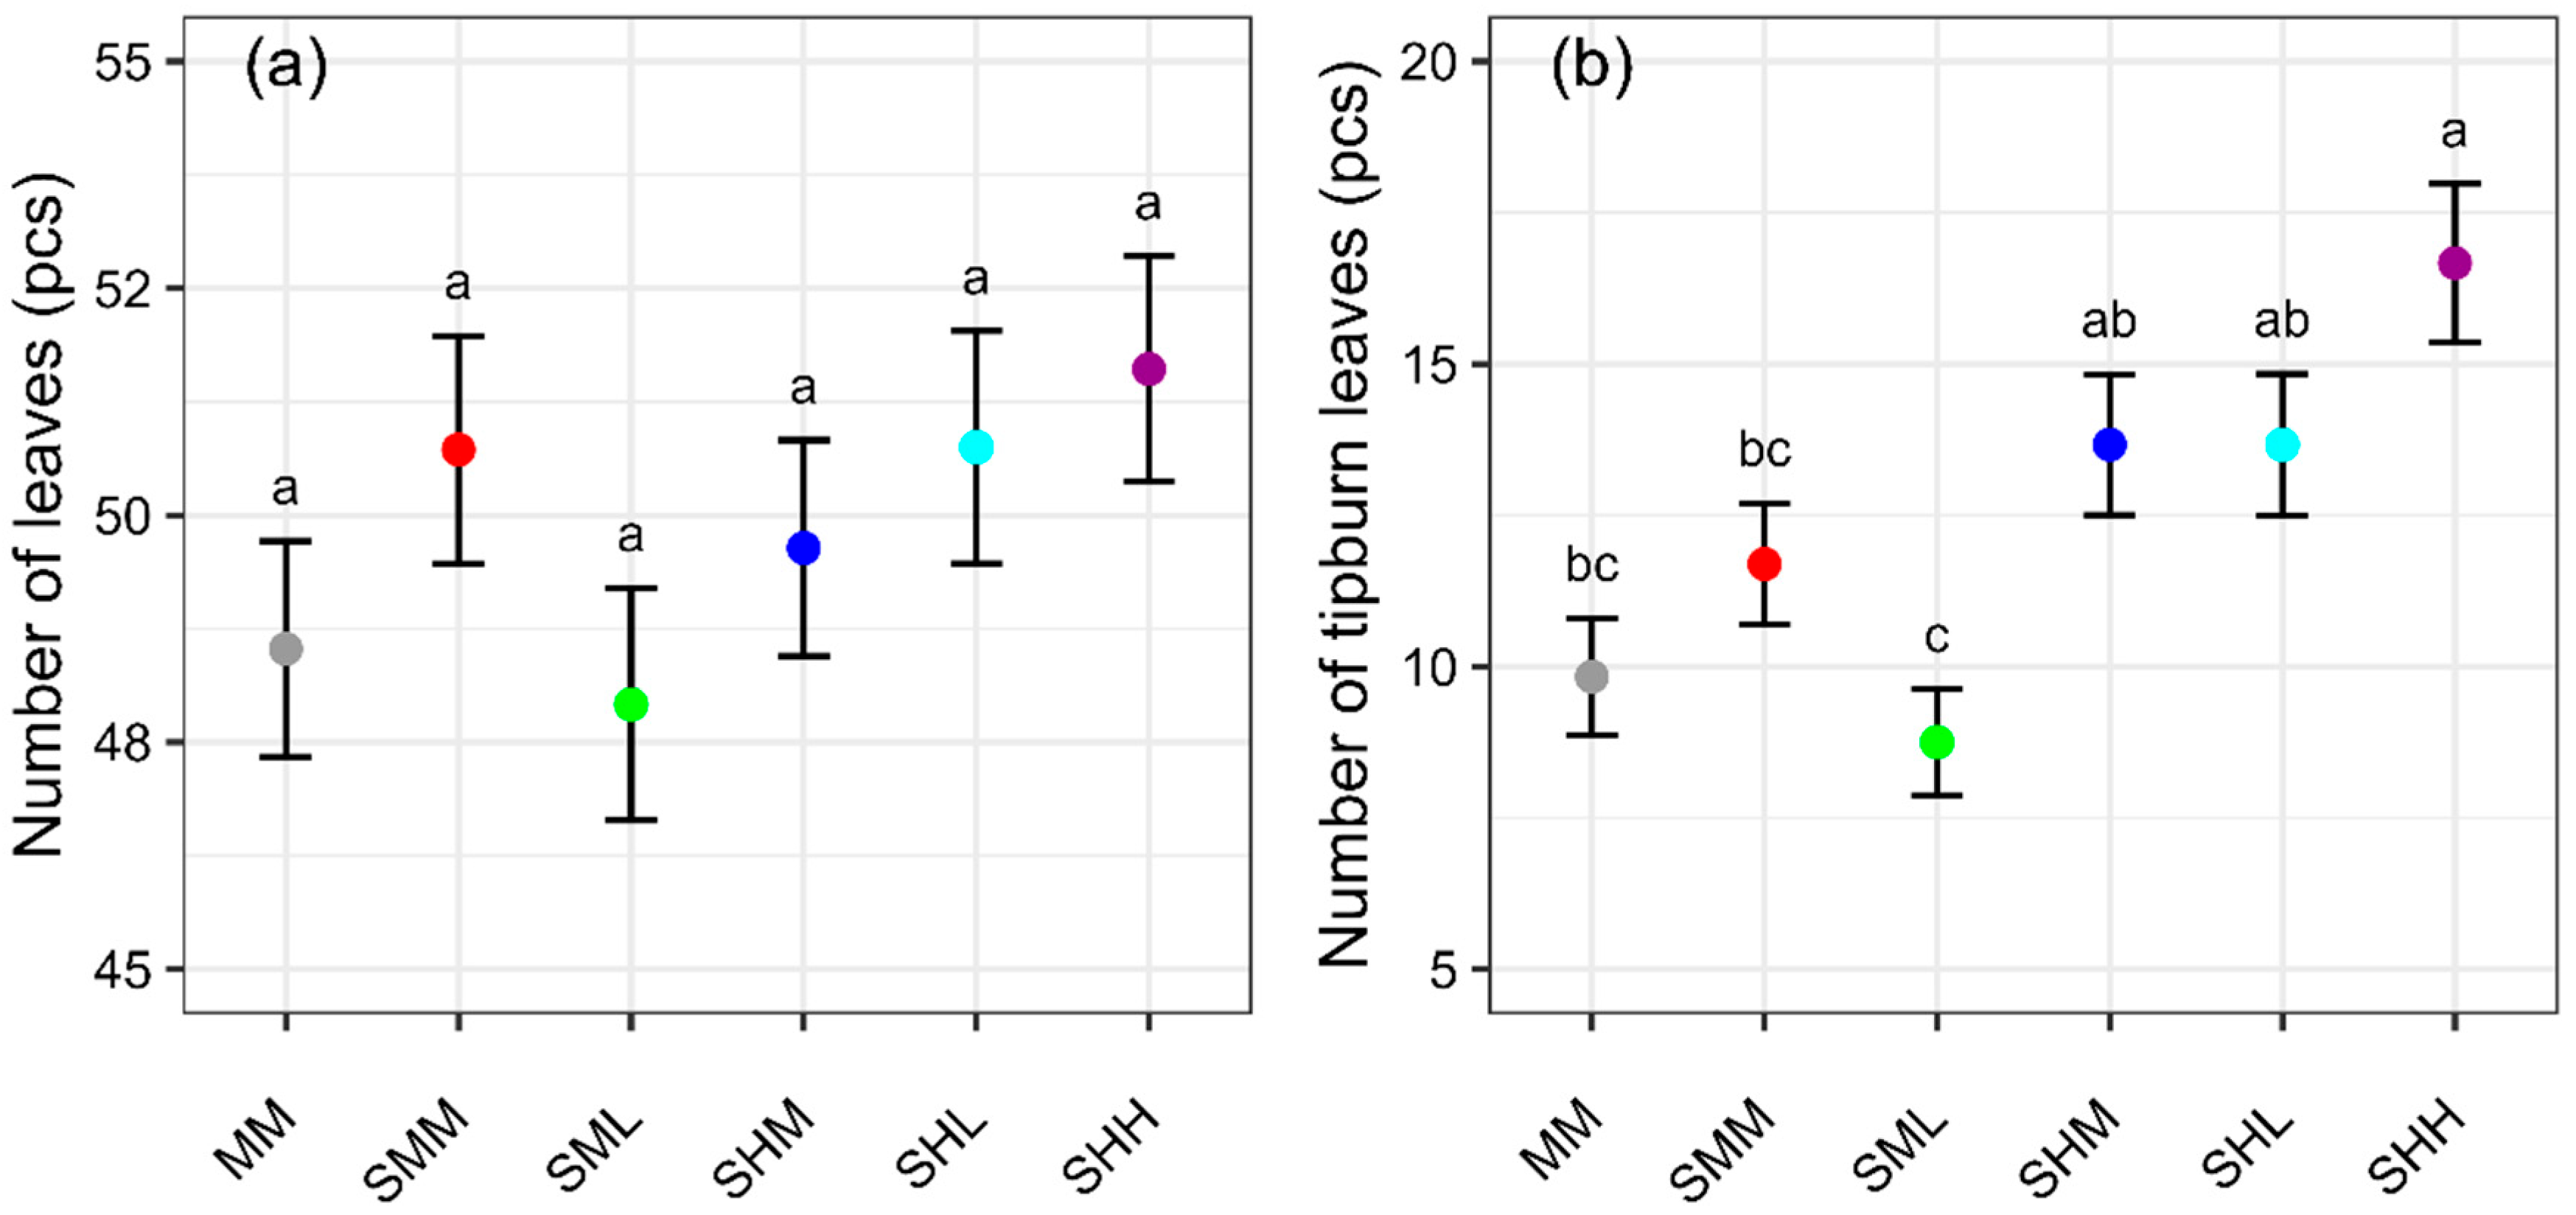
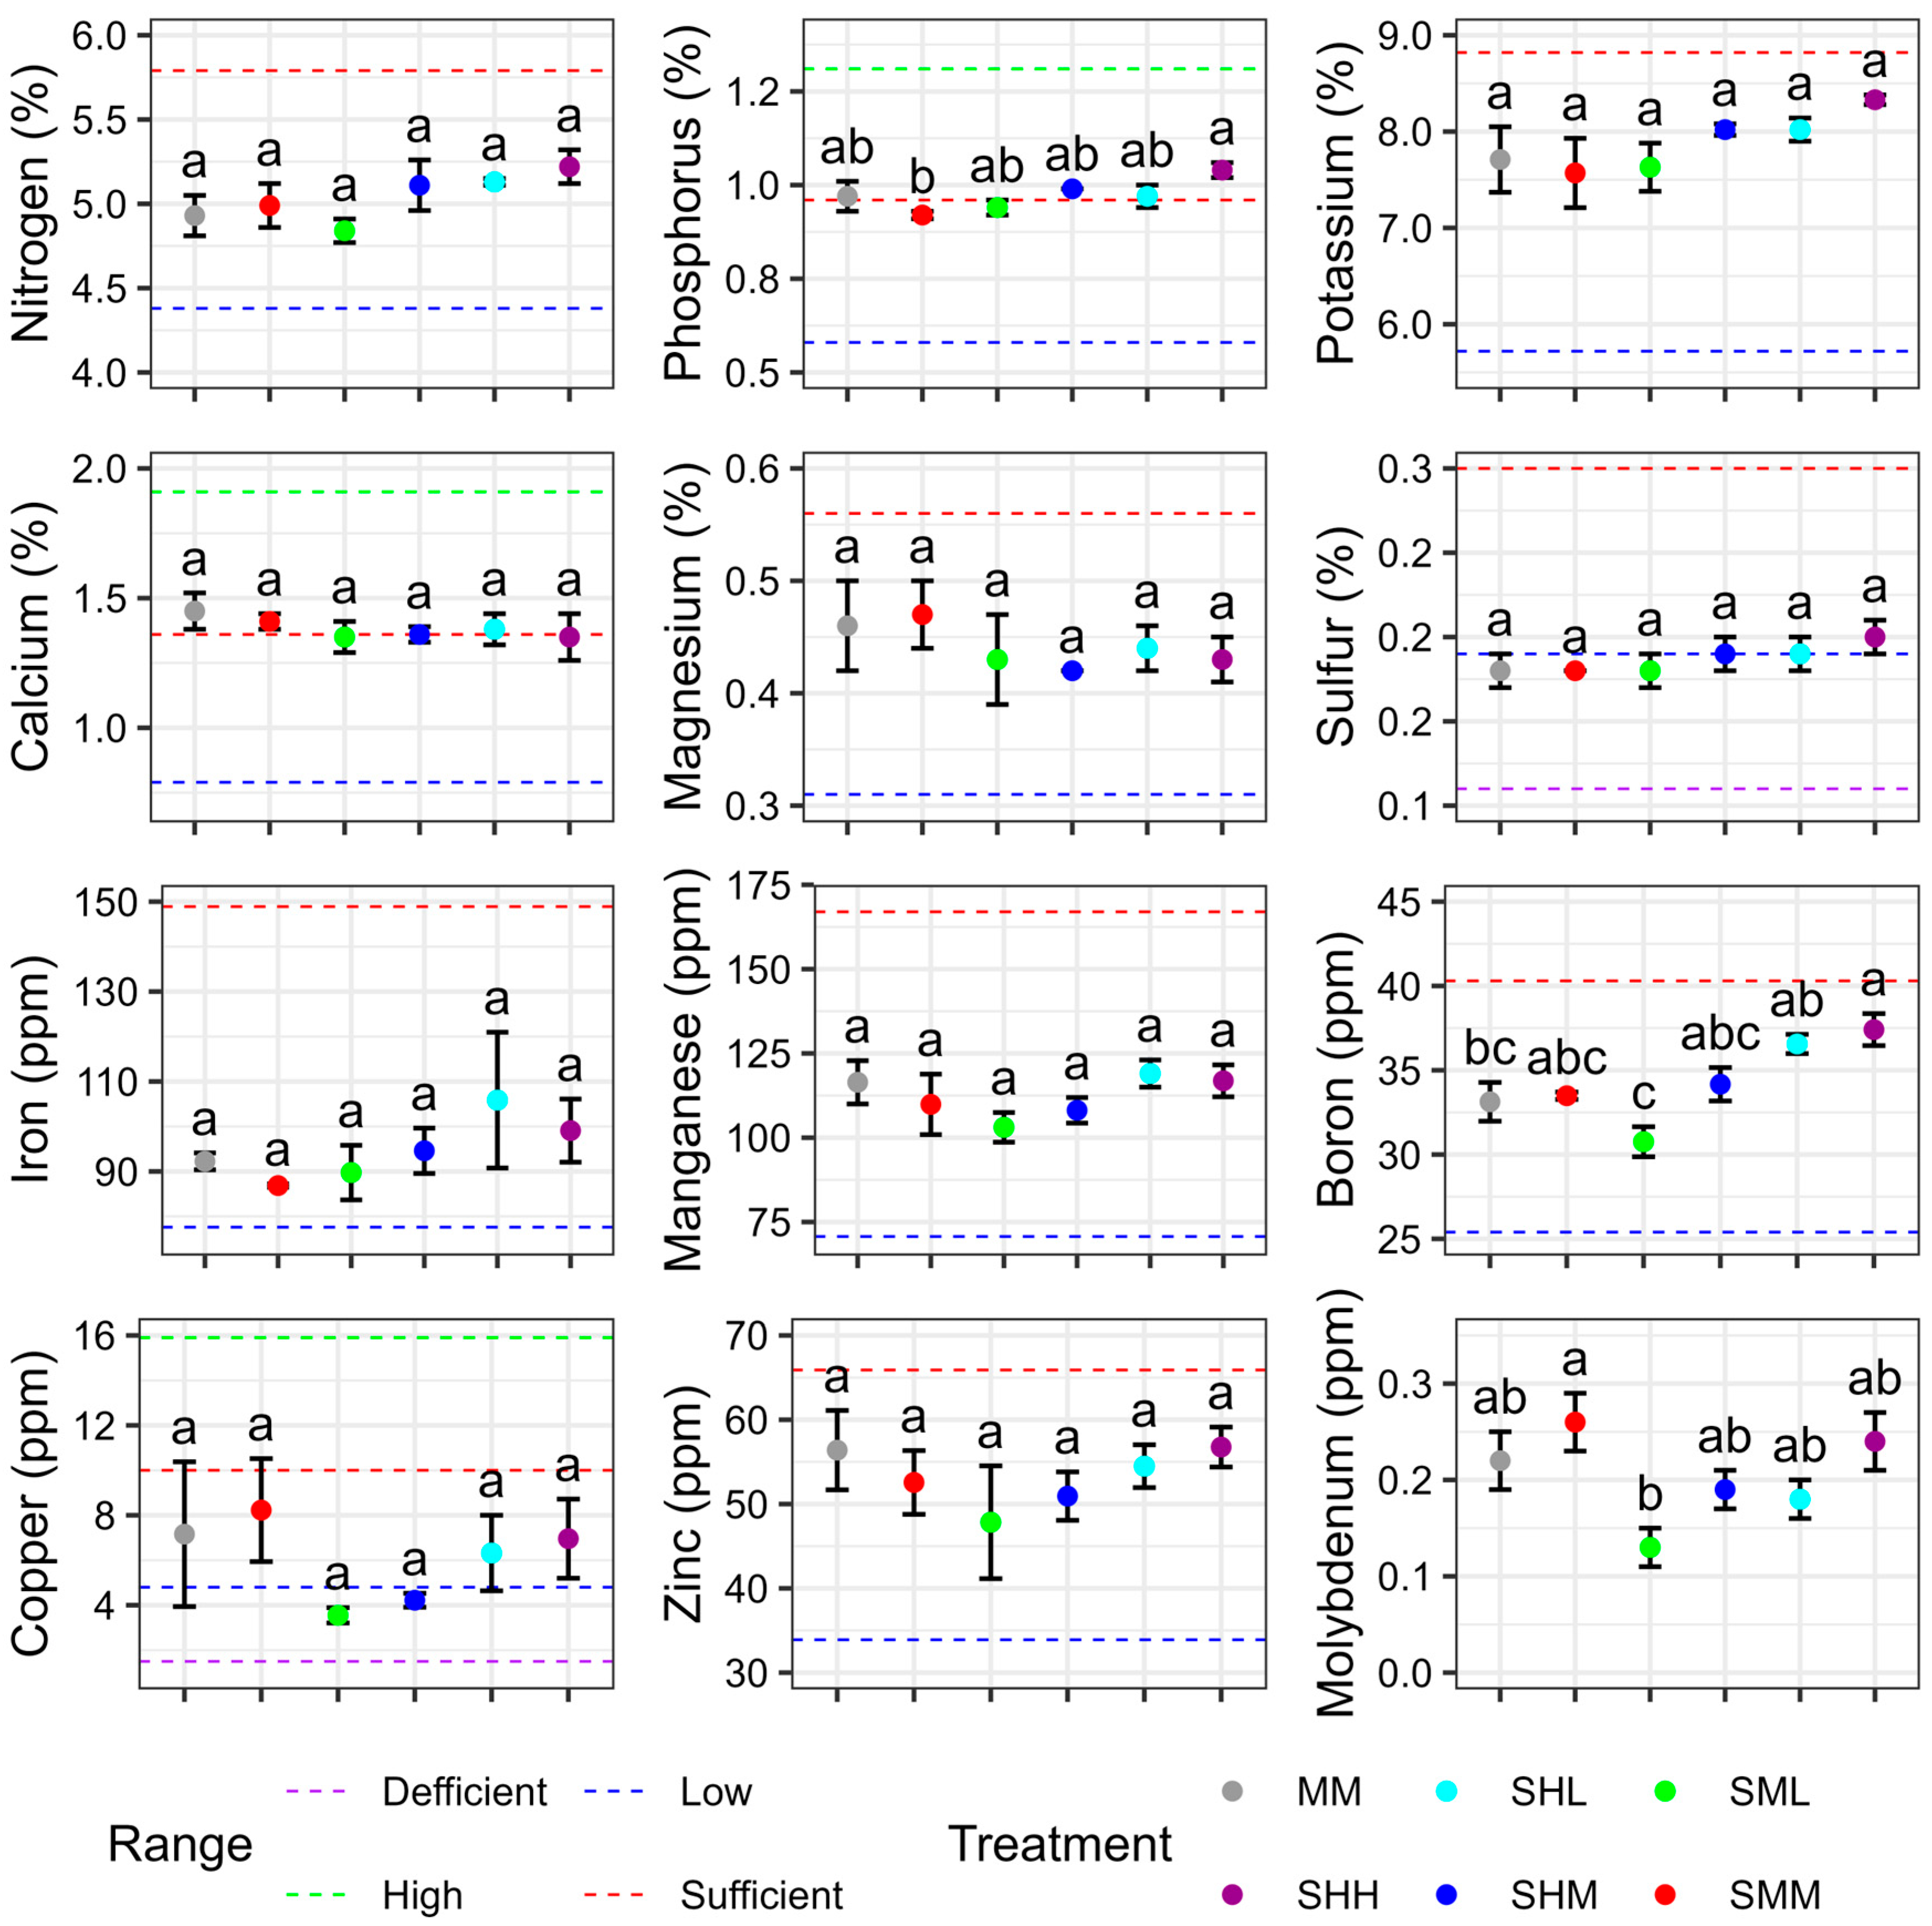
−1), SFW was significantly higher (by 15%) for SHL compared to MM. This result indicated that SFW increased with SRS at uneven concentrations. The number of tipburn leaves and calcium concentration in leaf tissue were not significantly different in SHL and MM. This is an interesting finding as typical lettuce plants with a larger biomass have a greater incidence of tipburn [23]. Growing tomatoes under uneven nutrient concentrations resulted in increased SFW and lower incidence of blossom end rot (BER) caused by calcium deficiency, more than under uniform nutrient concentrations [17]. There is a strong negative correlation between the incidence of BER and the amount of exudation [17]. When nutrients are unevenly distributed, exudation increases due to low osmotic pressure in low-concentration areas, resulting in a lower incidence of BER. Supplying low concentrations of nutrients or only calcium nitrate at night reduced tipburn without reducing lettuce yields [11]. The calcium content of young leaves was also found to be higher when supplied at lower concentrations or only with calcium nitrate during the night. The research team hypothesized that supplying low concentrations or calcium nitrate at night increased root pressure, causing the plants to absorb more calcium during the night. Increasing root pressure flow successfully prevented leaf tipburn in cabbage [29]. In an experiment with strawberries, low concentrations of nutrient solution at night cause positive water pressure in the xylem, which results in greater calcium translocation to the leaves [30]. Therefore, we conclude that our experimental SHL treatment decreased tipburn, in part due to the low EC nutrient solution facilitating greater calcium uptake at night. Francisco et al. showed that when nutrient concentrations were higher at night than during the day, shoot fresh weight did not differ, but nutrient content decreased compared to when concentrations were the same during the day and at night for lettuce [
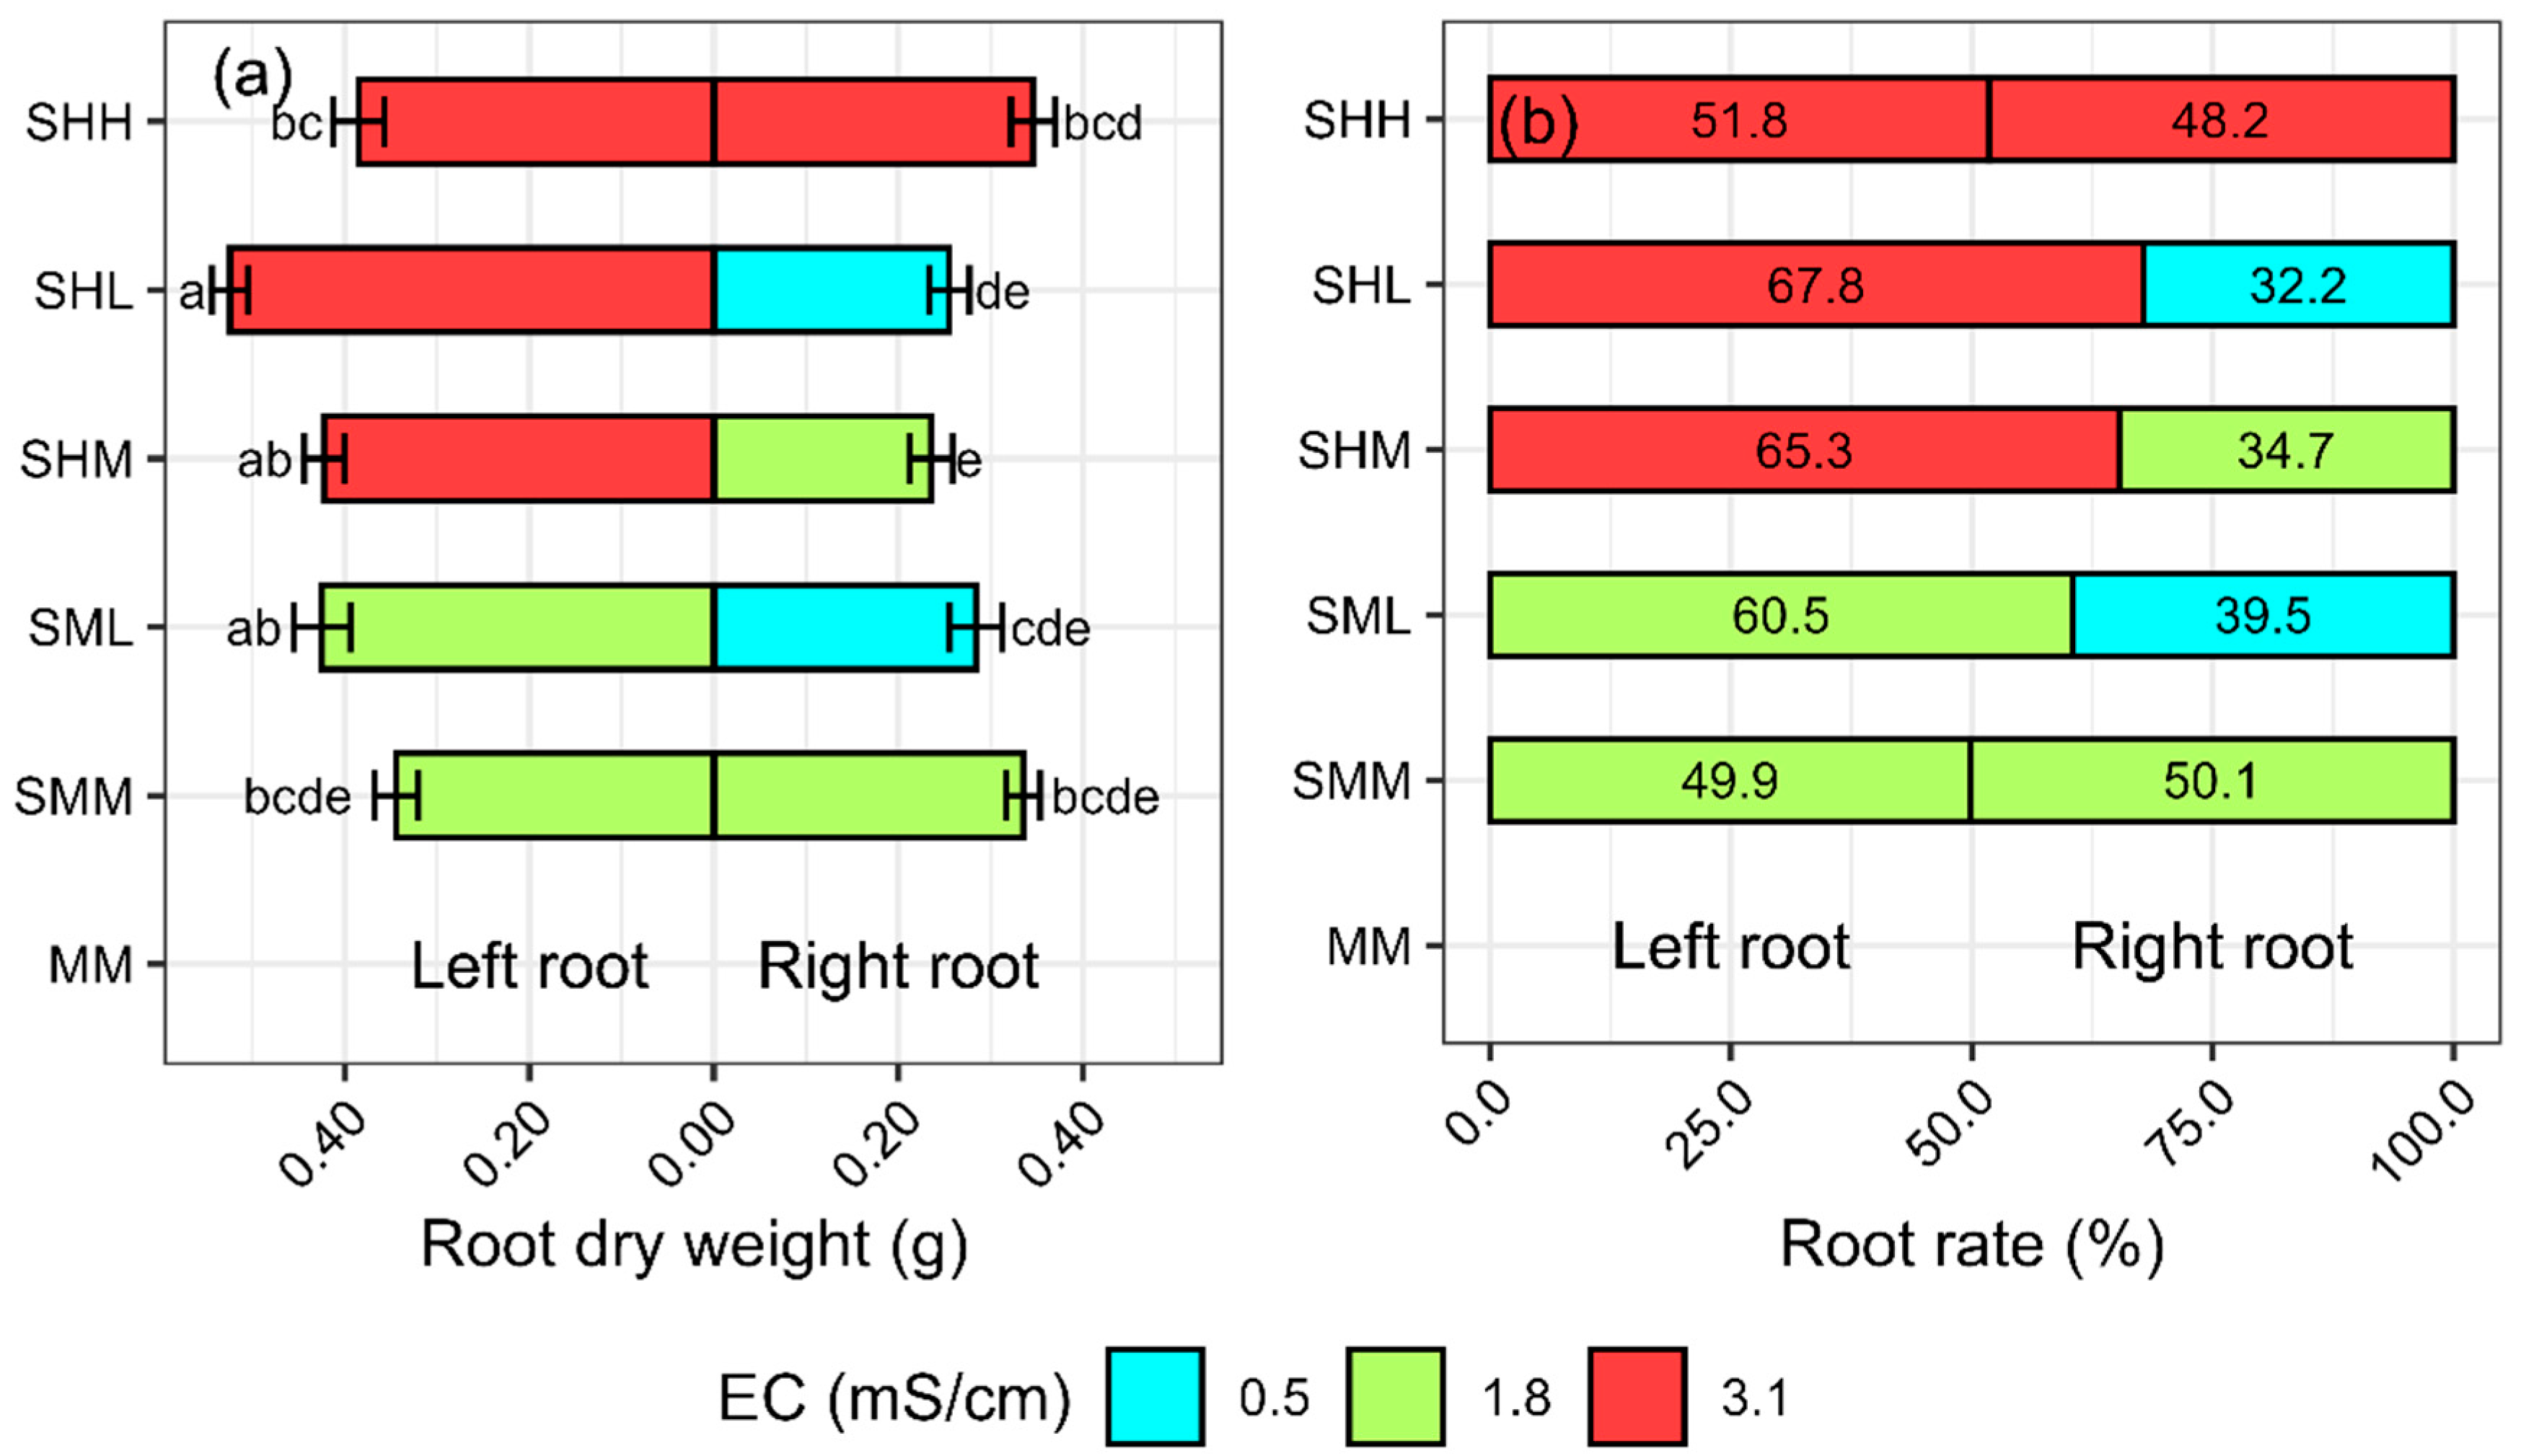
31]. This allows the same yield with less fertilizer. The total root dry weight was 25% higher for SHL than for MM. The dry weight of the SHL root at the higher concentration was 5% greater than at the lower concentration.
All nutrients in leaf tissue were not significantly different between SHL and MM. When P. Laine et al. used SR-NFT to locally supply nitrate to plant roots, root dry weight was greater in the nutrient solution containing nitrate than in the nutrient solution without nitrate [18]. Furthermore, the rate of nitrate uptake was the same as plants that were uniformly supplied with nitrate. These assisted in supplementing the nitrate deficiency. Anna et al. showed that a localized supply of nitrate increased the rate of nitrate uptake [32]. Therefore, localized supply of nitrate, or non-uniform concentration, increases the dry weight of roots and the rate of nitrate absorption. The increased dry weight of the roots is also thought to increase the root surface area, and, therefore, other nutrients may have been absorbed to a greater extent.
Comparing SMM (EC 1.8 dS∙m−1) and SHH (EC 3.1 dS∙m−1), which were supplied in an even concentration to both sides of the roots, SFW and SDW were higher for SHH than SMM, but not significantly different. The number of tipburn leaves was significantly greater for SHH than SMM. However, Samarakoon et al. (2020) showed that SFW and tipburn increased from EC 1.4 to 1.8 dS∙m−1 yet decreased from EC 1.8 to 2.0 dS∙m−1 [8]. Serio et al. (2001) showed that SFW reaches a maximum at EC 1.5 dS∙m−1 and decreases as EC increases (EC 2.5, 3.5 dS∙m−1) [33]. Scuderi et al. (2009) conducted experiments under high EC (2.8, 3.8, 4.8 dS∙m−1) and showed that the yield was maximum at EC 2.8 dS∙m−1 and decreased with increasing EC [34]. Previous research has shown that too high EC decreases SFW, but the suitable EC depends on the cultivar. If the Mattson et al. (2014) nutrient solution recipe we referred to used water with EC 0 dS∙m−1, the solution would be EC 1.8 dS∙m−1 [22]. This would suggest that EC 3.1 dS∙m−1 is too high and, therefore, SFW would decrease. However, our experiments showed the opposite result. This result may have been affected by the cultivar or SR-NFT, but further research is needed.
There were statistically significant differences observed in the number of tipburn leaves in SR-NFT (SML vs. SHM, SHL, SHH). As mentioned above, this result may be due to the lower EC nutrient solution side, which promotes calcium uptake at night, thus leading to reduced tipburn. There were no statistically significant differences found in SFW and SDW with the SR-NFT treatments (SMM, SML, SHM, SHL, SHH). However, numerically, SFW and SDW were greater with higher average EC, except for SHL. This result matched that of the tomato experiment, where the combination of high concentration and clear water increased yield more than both medium concentrations, but the combination of medium concentration and clear water did not increase yield [21]. These results indicate that the use of clear water on one side is expected to suppress tipburn or increase yield.
We evaluated the comparative performance of traditional NFT (i.e., MM, no split root with EC 1.8 dS∙m−1) and SR-NFT (i.e., SMM, EC of 1.8 dS∙m−1 on both sides of the channel). There were no statistically significant differences in all parameters (volume, chlorophyll content index, tipburn index, SFW, SDW, number of leaves, number of tipburn leaves, water content, RDW, and percent dry matter root). However, numerically, SFW, SDW, and RDW were 8–9% greater for SMM vs. MM. The Pearson correlation, which measures the degree of correlation between two variables, showed a value of 0.62 (p < 0.001) for SFW and RDW. The increase in RDW is thought to have increased the root surface area. Root length and root surface area are related to the plant’s ability to uptake nutrients [35]. These indicate that the roots absorb more water and nutrients by growing more, resulting in increased SFW and SDW.
Future research should focus on clarifying the absorption mechanism of SR-NFT at uneven concentrations to increase the shoot fresh and dry weight and suppress tipburn. In addition, multiple cultivars should be compared to see if there is a consistent SRS response from one cultivar to another. Our experiments were conducted with hydroponics in greenhouses, but, in the future, this strategy could be adopted for outdoor field production. As Jing (2020) indicated, irrigating every other row would meet the transpiration demands of the crop, and providing a small amount of nutrients in the remaining rows would allow for increased yields and tipburn suppression in fields [36]. In addition, if recirculating aquaponics and conventional hydroponics are used with SR-NFT, it could allow aquaponic nutrients to be supplemented with conventional nutrients, which are often lacking in aquaponics solutions. The commercial use of SR-NFT requires more pumps and solution tanks than usual, and there are also problems with the need to separate the roots when transplanting, which requires skilled techniques and funds. Therefore, we believe that a practical SR-NFT should be developed.

5. Conclusions

This is the first paper, to our knowledge, to examine the effect of split root nutrient applications on hydroponic lettuce. For the same average concentration of solution (EC 1.8 dS∙m−1), the SR-NFT that supplied different concentrations of solution on the left and right side (i.e., SHL, Left; EC 0.5 dS∙m−1, Right; EC 3.1 dS∙m−1) can increase the shoot fresh weight by 15%, shoot dry weight by 14%, and root dry weight by 25% without increasing tipburn compared to conventional NFT (i.e., MM, EC 1.8 dS∙m−1).
Furthermore, there were no statistically significant differences in all parameters between SR-NFT with the same concentration on the left and right sides (i.e., SMM) and conventional NFT (i.e., MM). This suggests that SRSs are more effective when different nutrient concentrations are used.
There were no significant differences in SFW and SDW for SHL vs. SMM, but biomass tended to increase as the average nutrient solution concentration increased in all conditions, with the exception of SHL, where the concentration difference was greatest. In addition, the lowest concentration (SML) reduced tipburn without reducing the shoot fresh weight in all conditions except SMM. In other words, the use of low EC water on one side is expected to suppress tipburn or increase yield.

Author Contributions

Conceptualization, Y.I., N.S.M. and N.S.K.; methodology, Y.I., N.S.M. and N.S.K.; formal analysis, Y.I.; investigation, Y.I., N.S.K., C.F.S. and J.O.; resources, N.S.M.; data curation, Y.I.; writing—original draft preparation, Y.I.; writing—review and editing, Y.I., N.S.K., C.F.S., J.O. and N.S.M.; supervision, N.S.K.; project administration, N.S.M.; funding acquisition, N.S.M. All authors have read and agreed to the published version of the manuscript.

Funding

This work was supported by joint research under Accession Number 7005941 and an extension program funded by the Cornell University Agricultural Experiment Station (Hatch/Multistate funds) and Cornell Cooperative Extension (Smith Lever funds), received from the National Institutes of Food and Agriculture (NIFA), U.S. Department of Agriculture (USDA). Any opinions, findings, conclusions, or recommendations expressed in this publication are those of the authors and do not necessarily reflect the views of the USDA.

Institutional Review Board Statement

Not applicable.

Data Availability Statement

The data presented in this research are available on request from the corresponding author.

Acknowledgments

We would like to thank all other members of Neil Mattson’s lab and greenhouse staff at the Kenneth Post Laboratory at Cornell University.

Conflicts of Interest

The authors declare no conflicts of interest. The funders had no role in the design of this study; in the collection, analyses, or interpretation of data; in the writing of the manuscript; or in the decision to publish the results.

Abbreviations

The following abbreviations are used in this manuscript:
SR-NFTSplit root nutrient film technique
NFTNutrient film technique
DWCDeep water culture
VAFVertical air flow
DLIDaily light integral
ECElectric conductivity
SRSSplit-root system
CEAControl environment agriculture
SFWShoot fresh weight
SDWShoot dry weight
RDWRoot dry weight
ANOVAAnalysis of variance
HSDTukey’s honest significance difference
WCWater content
PDMRPercent dry matter root

References

  1. Faostat, F. Food and Agriculture Organization of the United Nations FAO Stat. Available online: http://www.fao.org/faostat/en/#data/QC (accessed on 23 February 2025).
  2. USDA Food Availability (Per Capita) Data System. Available online: https://www.ers.usda.gov/data-products/food-availability-per-capita-data-system/ (accessed on 23 February 2025).
  3. Nicholson, C.F.; Eaton, M.; Gómez, M.I.; Mattson, N.S. Economic and Environmental Performance of Controlled-Environment Supply Chains for Leaf Lettuce. Eur. Rev. Agric. Econ. 2023, 50, 1547–1582. [Google Scholar] [CrossRef]
  4. Niu, G.; Masabni, J. Chapter 9—Hydroponics. In Plant Factory Basics, Applications and Advances; Kozai, T., Niu, G., Masabni, J., Eds.; Academic Press: Cambridge, MA, USA, 2022; pp. 153–166. ISBN 978-0-323-85152-7. [Google Scholar]
  5. Mattson, N.S. Tipburn of Hydroponic Lettuce. e-GRO Alert 2015, 4, 1–7. Available online: https://www.e-gro.org/pdf/2015_431.pdf (accessed on 9 February 2025).
  6. Both, A.J.; Albright, L.D.; Langhans, R.W.; Reiser, R.A.; Vinzant, B.G. Hydroponic Lettuce Production Influenced by Integrated Supplemental Light Levels in a Controlled Environment Agriculture Facility: Experimental Results. Acta Hortic. 1997, 1, 45–52. [Google Scholar] [CrossRef]
  7. Samarakoon, U.C.; Fyffe, C.; Bale, J.; Ling, P.; Basnagala, S.; Donley, N.; Altland, J. Effect of Electrical Conductivity on the Productivity and Nutrient Uptake of Lactuca sativa L. Grown Using Nutrient Film Technique (NFT). Acta Hortic. 2019, 1266, 137–144. [Google Scholar] [CrossRef]
  8. Uttara, S.; Palme, J.; Ling, P.; Altland, J. Effects of Electrical Conductivity, pH, and Foliar Application of Calcium Chloride on Yield and Tipburn of Lactuca sativa Grown Using the Nutrient–Film Technique. HortScience 2020, 55, 1265–1271. [Google Scholar] [CrossRef]
  9. Scheckelhoff, B. Powdery Mildew on Greenhouse-Grown Lettuce. E-AGRO Alert 2015, 4, 39. [Google Scholar]
  10. Samarakoon, U.C.; Wessrasinghe, P.A.; Weerakkody, W.A.P. Effect of Electrical Conductivity [EC] of the Nutrient Solution on Nutrient Uptake, Growth and Yield of Leaf Lettuce (Lactuca sativa L.) in Stationary Culture. Trop. Agric. Res. 2006, 18, 12–21. [Google Scholar]
  11. Cresswell, G.C. Effect of Lowering Nutrient Solution Concentrationat Night on Leaf Calcium Levels and the Incidence Oftipburn in Lettuce (Var. Gloria). J. Plant Nutr. 1991, 14, 913–924. [Google Scholar] [CrossRef]
  12. Masuda, M.; Tanaka, T.; Matsunari, S. Uptake of Water and Minerals during the Day and the Night in Tomato and Cucumber Plants. J. Jpn. Soc. Hortic. Sci. 1990, 58, 951–957. [Google Scholar] [CrossRef]
  13. Albornoz, F.; Lieth, J.H. Daily Macronutrient Uptake Patterns in Relation to Plant Age in Hydroponic Lettuce. J. Plant Nutr. 2016, 39, 1357–1364. [Google Scholar] [CrossRef]
  14. Albornoz, F.; Lieth, J.H. Diurnal Macronutrients Uptake Patterns by Lettuce Roots under Various Light and Temperature Levels. Plant Nutr. 2015, 38, 2028–2043. [Google Scholar] [CrossRef]
  15. Wiersum, L.K. Density of Root Branching as Affected by Substrate and Separate Ions. Acta Bot. Neerl. 1958, 7, 174–190. [Google Scholar] [CrossRef]
  16. Guan, B.; Gao, N.; Min, C.; Grace, A.C.; Aixin, H.; Guangxuan, H.; Xiaoyan, T. Seedling Adaptive Characteristics of Phragmites Australis to Nutrient Heterogeneity under Salt Stress Using a Split-Root Approach. Aquat. Sci. 2021, 83, 56. [Google Scholar] [CrossRef]
  17. Tabatabaie, S.J.; Gregory, P.J.; Hadley, P. Uneven Distribution of Nutrients in the Root Zone Affects the Incidence of Blossom End Rot and Concentration of Calcium and Potassium in Fruits of Tomato. Plant Soil 2004, 258, 169–178. [Google Scholar] [CrossRef]
  18. Laine, P.; Ourry, A.; Boucaud, J.; Salette, J. Effects of a Localized Supply of Nitrate on NO3 Uptake Rate and Growth of Roots in Lolium Multiflorum La. Plant Soil 1998, 202, 61–67. [Google Scholar] [CrossRef]
  19. Crawford, N.M.; Forde, B.G. Molecular and Developmental Biology of Inorganic Nitrogen Nutrition. Am. Soc. Plant Biol. 2002, 1, e0011. [Google Scholar] [CrossRef]
  20. Zhu, Y.; Ito, T. Effects of Nutrient Stress by Split-Root System on the Growth and K, Ca, and Mg Contents at Different Stages of Hydroponically-Grown Tomato Seedlings. J. Jpn. Soc. Hortic. Sci. 2000, 69, 677–683. [Google Scholar] [CrossRef]
  21. Tabatabaie, S.J.; Gregory, P.J.; Hadley, P.; Ho, L. Use of Unequal Salinity in the Root Zone to Improve Yield and Quality in Hydroponically Grown Tomato. South Pac. Soil. Cult. Conf.-SPSCC 2003, 648, 47–54. [Google Scholar] [CrossRef]
  22. Mattson, N.S.; Peters, C. A Recipe for Hydroponic Success. Inside Grow. 2014, 2014, 16–19. [Google Scholar]
  23. Both, A.J. Ten Years of Hydroponic Lettuce Research; The State University of New Jersey: New Brunswick, NJ, USA, 2002; pp. 1–14. [Google Scholar]
  24. Beacham, A.M.; Hand, P.; Teakle, G.R.; Barker, G.C.; Pink, D.A.C.; Monaghan, J.M. Tipburn Resilience in Lettuce (Lactuca spp.)—The Importance of Germplasm Resources and Production System-Specific Assays. J. Sci. Food Agric. 2023, 103, 4481–4488. [Google Scholar] [CrossRef]
  25. Miller, R.O. High-Temperature Oxidation: Dry Ashing. In Handbook and Reference Methods for Plant Analysis; Kalra, Y., Ed.; CRC Press: Boca Raton, FL, USA, 1997; Volume 5, pp. 53–56. [Google Scholar]
  26. Isaac, R.A.; Johnson, W.C. Elemental Analysis of Plant Tissue by Plasma Emission Spectroscopy: Collaborative Study. J. Assoc. Off. Anal. Chem. 1985, 68, 499–505. [Google Scholar] [CrossRef]
  27. Bellomonte, G.; Costantini, A.; Giammarioli, S. Comparison of Modified Automatic Dumas Method and the Traditional Kjeldahl Method for Nitrogen Determination in Infant Food. J. Assoc. Off. Anal. Chem. 1987, 70, 227–229. [Google Scholar] [CrossRef]
  28. Veazie, P.; Chen, H.; Hicks, K.; Holley, J.; Eylands, N.; Mattson, N.; Boldt, J.; Brewer, D.; Lopez, R.; Whipker, B.E. A Data-Driven Approach for Generating Leaf Tissue Nutrient Interpretation Ranges for Greenhouse Lettuce. HortScience 2024, 59, 267–277. [Google Scholar] [CrossRef]
  29. Tibbitts, T.W.; Palzkill, D.A. Requirement for Root-pressure Flow to Provideadequate Calcium to Low-transpiring Tissue. Commun. Soil Sci. Plant Anal. 1979, 10, 251–257. [Google Scholar] [CrossRef]
  30. Guttridge, C.G.; Bradfield, E.G.; Holder, R. Dependence of Calcium Transport into Strawberry Leaves on Positive Pressure in the Xylem. Ann. Bot. 1981, 48, 473–480. [Google Scholar] [CrossRef]
  31. Albornoz, F.; Heinrich Lieth, J.; Gonzalez-Fuentes, J.A. Effect of Different Day and Night Nutrient Solution Concentrations on Growth, Photosynthesis, and Leaf NO3- Content of Aeroponically Grown Lettuce. Chil. J. Agric. Res. 2014, 74, 240–245. [Google Scholar] [CrossRef]
  32. Gorska, A.; Ye, Q.; Holbrook, N.M.; Zwieniecki, M.A. Nitrate Control of Root Hydraulic Properties in Plants: Translating Local Information to Whole Plant Response. Plant Physiol. 2008, 148, 1159–1167. [Google Scholar] [CrossRef]
  33. Serio, F.; Elia, A. Lettuce Growth, Yield and Nitrate Content as Affected by Electrical Conductivity of Nutrient Solution. Acta Hortic. 2001, 559, 563–568. [Google Scholar] [CrossRef]
  34. Scuderi, D.; Giuffrida, F.; Noto, G. Effects of Nutrient Solution EC on Yield, Quality and Shelf-Life of Lettuce Grown in Floating System. Acta Hortic. 2009, 809, 221–226. [Google Scholar] [CrossRef]
  35. Barber, S.A.; Silberbush, M. Plant Root Morphology and Nutrient Uptake. In Roots, Nutrient and Water Influx, and Plant Growth; John Wiley & Sons, Ltd.: Hoboken, NJ, USA, 1984; Volume 49, pp. 65–87. ISBN 978-0-89118-315-0. [Google Scholar]
  36. Yan, J.; Bogie, N.A.; Ghezzehei, T.A. Root Uptake under Mismatched Distributions of Water and Nutrients in the Root Zone. Biogeosciences 2020, 17, 6377–6392. [Google Scholar] [CrossRef]
Figure 1. Timeline of this experiment.
Agriculture 15 01350 g001
Figure 2. (a) Photographs of the experimental devices, (b) detailed diagram of the split root nutrient film technique, and (c) detailed diagram of the split root nutrient film technique from the front. The photograph was taken just before harvest (6 weeks).
Agriculture 15 01350 g002
Figure 3. Daily light integral for each trial.
Agriculture 15 01350 g003
Figure 4. The Tipburn index was used in this research. Tipburn symptoms were scored from left to right; 0 (none) to slight (1 point), medium (3 points), and heavy (5 points).
Agriculture 15 01350 g004
Figure 5. (a) Shoot fresh weight (SFW) and (b) shoot dry weight (SDW) of lettuce ‘Rex’ at harvest (five weeks). Data represent means and standard errors calculated in two blocks of six plants in three replications in a completely randomized block design. Letters represent mean separation comparison among treatments using Tukey’s honestly significant difference (alpha = 0.05).
Agriculture 15 01350 g005
Figure 6. (a) Number of leaves and (b) number of tipburn leaves of lettuce ‘Rex’ at harvest (five weeks). Data represent means and standard errors calculated in two blocks of six plants in three replications in a completely randomized block design. Letters represent mean separation comparison among treatments using Tukey’s honestly significant difference (alpha = 0.05).
Agriculture 15 01350 g006
Figure 7. Water content of lettuce ‘Rex’ at harvest (five weeks). Data represent means and standard errors calculated in two blocks of six plants in three replications in a completely randomized block design. Letters represent mean comparison among treatments using Tukey’s honestly significant difference (alpha = 0.05).
Agriculture 15 01350 g007
Figure 8. Nutrient concentration for lettuce shoot grown in each treatment. The data are a sample of 14 seedlings mixed per treatment in one trial, repeated three times, and the mean and standard error are expressed as the mean and standard error. The dashed line shows five grades according to Patrick et al. [28]. Below purple indicates deficient, between purple and blue low, between blue and red insufficient, between red and green high, and green and above indicates excessive. Letters represent mean separation comparison among treatments using Tukey’s honestly significant difference (alpha = 0.05).
Agriculture 15 01350 g008
Figure 9. (a) Total root dry weight and (b) percent dry matter root of lettuce ‘Rex’ at harvest (five weeks). Data represent means and standard errors calculated in two blocks of six plants in three replications in a completely randomized block design. Letters represent mean separation comparison among treatments using Tukey’s honestly significant difference (alpha = 0.05).
Agriculture 15 01350 g009
Figure 10. (a) Root dry weight on the left and right, and (b) percentage of each root divided by the total root dry weight of lettuce ‘Rex’ at harvest (five weeks). The values in the graph (b) show the percentage of each root. Data represent means and standard errors calculated in two blocks of six plants in three replications in a completely randomized block design. Letters represent mean comparison among treatments using Tukey’s honestly significant difference (alpha = 0.05).
Agriculture 15 01350 g010
Table 1. The six experimental treatments used to evaluate conventional NFT (MM) and split-root (S) treatments for hydroponic lettuce. The EC treatments were adjusted to be Low (L, EC = 0.5 dS∙m−1), Medium (M, EC = 1.8 dS∙m−1), or High (H, EC = 3.1 dS∙m−1). The system used NFT or SR-NFT.
TreatmentEC (dS·m−1)System
LeftRight
MMM (1.8)NFT
SMMM (1.8)M (1.8)SR-NFT
SMLM (1.8)L (0.5)SR-NFT
SHMH (3.1)M (1.8)SR-NFT
SHLH (3.1)L (0.5)SR-NFT
SHHH (3.1)H (3.1)SR-NFT
Table 2. The nutrient solution recipe used for medium EC split-root treatments for hydroponic lettuce [22]. The low EC treatment was tap water only, and the high EC treatment was prepared at double-strength nutrient concentration within the same tap water.
ppm
Nitrogen (N)150
Phosphorus (P)39
Potassium (K)162
Calcium (Ca)139
Magnesium (Mg)47
Iron (Fe)2.3
Manganese (Mn)0.38
Zinc (Zn)0.11
Boron (B)0.38
Copper (Cu)0.113
Molybdenum (Mo)0.075
Table 3. The daily average pH and EC of three different tanks from the time of transplanting in NFT or SR-NFT and setting the nutrient solution to the conditions in Table 1 until harvest. The tank is adjusted to have Low (EC = 0.5 dS·m−1), Middle (EC = 1.8 dS·m−1) and High (EC = 3.1 dS·m−1).
Tank1st Trial2nd Trial3rd Trial
MeanSEMeanSEMeanSE
pHHigh5.6±0.046.0±0.046.0±0.05
Middle6.0±0.046.1±0.066.1±0.05
Low5.7±0.056.2±0.066.2±0.06
EC (dS·m−1)High3.1±0.023.0±0.033.0±0.03
Middle1.8±0.011.8±0.011.9±0.02
Low0.5±0.040.7±0.030.7±0.02
Table 4. The temperature (°C) and humidity (%) and DLI (mol∙m−2∙d−1) mean and standard error (SE) of the greenhouse after transplanting.
1st Trial2nd Trial3rd Trial
Mean(SD)Mean(SD)Mean(SD)
Temperature (°C)22.6(0.1)21.9(0.1)21.8(0.1)
Humidity (%)64.4(0.6)64.8(0.6)61.3(0.6)
DLI (mol/m2/d)20.8(0.4)19.3(0.7)20.1(0.5)
Table 5. Volume, chlorophyll content index, and tipburn index of lettuce ‘Rex’ for two, three, four, and five weeks. Data represent means and standard errors (SEs) calculated in two blocks of six plants in three replications in a completely randomized block design.
TimeTreatmentVolume (cm3)Chlorophyll Content IndexTipburn Index (1–5)
(Weeks) Mean(SE) Mean(SE) Mean(SE)
2MM185.1(18.7)a 125.0(0.5)a0.0(0.0)a
SMM211.4(19.1)a25.3(0.5)a0.0(0.0)a
SML199.5(19.3)a25.0(0.5)a0.0(0.0)a
SHM206.8(19.5)a24.9(0.4)a0.0(0.0)a
SHL204.6(19.4)a24.9(0.5)a0.0(0.0)a
SHH212.9(19.7)a25.0(0.5)a0.0(0.0)a
3MM564.3(32.4)a24.2(0.3)a0.0(0.0)a
SMM640.0(53.1)a24.5(0.4)a0.0(0.0)a
SML532.1(39.8)a24.5(0.3)a0.0(0.0)a
SHM577.9(44.7)a24.3(0.3)a0.0(0.0)a
SHL587.4(39.3)a24.8(0.3)a0.0(0.0)a
SHH628.4(43.2)a24.8(0.4)a0.1(0.0)a
4MM1741.6(65.5)a24.8(0.4)a0.4(0.1)b
SMM1915.4(80.9)a24.9(0.3)a0.4(0.1)b
SML1682.5(90.3)a24.5(0.4)a0.4(0.1)b
SHM1815.1(82.8)a25.0(0.4)a0.6(0.1)ab
SHL1939.4(74.5)a24.8(0.4)a0.6(0.1)ab
SHH1846.9(77.2)a25.3(0.4)a1.1(0.2)a
5MM3073.3(81.9)a28.2(0.4)a1.7(0.2)b
SMM3092.7(81.9)a28.5(0.4)a1.9(0.2)ab
SML3154.9(96.6)a27.7(0.3)a1.4(0.2)b
SHM3051.9(78.3)a28.2(0.4)a2.2(0.2)ab
SHL3326.2(76.8)a28.0(0.3)a2.1(0.2)ab
SHH3098.6(79.0)a28.9(0.4)a2.7(0.3)a
1 Means with different letters are significantly different among treatments and weeks using Tukey’s honestly significance difference test at p ≤ 0.05.
Table 6. Analysis of variance of p-value of shoot fresh weight, shoot dry weight, root dry weight, number of leaves, and number of tipburn leaves.
TreatmentTrialTreatment × TrialDegrees of FreedomCoefficient of Variation (%)
Shoot fresh weight*******1019.008
Shoot dry weight******NS1017.595
Root dry weight******NS1020.778
Number of leavesNS***NS1014.964
Number of tipburn leaves*******1056.431
NS, *, *** denotes nonsignificant or significant at p ≤ 0.05 or 0.001, respectively. NS means nonsignificant.
Disclaimer/Publisher’s Note: The statements, opinions and data contained in all publications are solely those of the individual author(s) and contributor(s) and not of MDPI and/or the editor(s). MDPI and/or the editor(s) disclaim responsibility for any injury to people or property resulting from any ideas, methods, instructions or products referred to in the content.

