Abstract
Tea is one of the most widely consumed non-alcoholic beverages globally, yet its yield and quality are significantly impacted by herbivory from tea geometrids. To accurately detect herbivory stress in tea leaves, this study integrated metabolomics with visible-near-infrared spectroscopy (VIS-NIRS) to explore its in situ capabilities and underlying mechanisms. The results demonstrated that metabolomic data, combined with PCA-based linear dimensionality reduction, could effectively distinguish between tea leaves subjected to herbivory by different densities of tea geometrids. VIS-NIRS successfully identified herbivore-damaged leaves, achieving an optimal average classification accuracy of 0.857. Furthermore, VIS-NIRS was able to differentiate leaves subjected to herbivory on different days. The application of appropriate preprocessing techniques significantly enhanced temporal classification, achieving the highest average classification accuracy of 0.773. By integrating metabolomics and spectral band analysis, the spectral range of 800–2500 nm was found to more accurately identify leaves exposed to herbivory for a prolonged period. Compared to using the full spectrum, the model built within this wavelength range improved classification accuracy by 10%. In conclusion, this study provides a solid theoretical foundation for the in situ, rapid detection of tea geometrid herbivory stress in the field using VIS-NIRS, offering key technical support for future applications.
1. Introduction
Tea, as a natural and health-promoting beverage, not only possesses unique flavor characteristics but also exhibits significant antioxidant activity and other beneficial health effects [1]. Although tea has become the most widely consumed non-alcoholic beverage worldwide, the yield and quality of tea are still severely affected by insect pests [2]. Among these, the tea geometrid (Ectropis grisescens) is one of the most destructive pests in Chinese tea plantations [3]. Once an outbreak occurs, its population can rapidly spread across the plantation, defoliating tea plants almost completely [4], which significantly reduces the yield of summer and autumn teas in the same year and spring teas in the following year, causing substantial economic losses. At present, chemical control remains the primary method for pest management in Chinese tea gardens [5]. Studies have shown that the rational use of pesticides can substantially increase crop yields [6]. However, due to the lack of rapid and accurate pest monitoring technologies, pesticide application in the field often suffers from positional uncertainty, resulting in inappropriate dosages. Sublethal doses not only induce pest resistance but may also stimulate population growth [7], while excessive application can lead to pesticide residues exceeding safety standards, polluting the environment, and posing risks to tea safety [8]. In this context, the development of a precision pesticide application system, based on the spatiotemporal distribution of pests, is crucial for enabling the quantitative use of chemical pesticides. This approach will be key to balancing effective pest control with environmental protection and ensuring the safety of tea as a consumable product.
Analyzing the physiological responses of infested plants can provide insights into the spatiotemporal dynamics of pest infestations. When plants are subjected to herbivory, the organic chemical compounds involved in their growth, development, and metabolic processes undergo significant changes [9]. This phenomenon offers a theoretical foundation for pest monitoring based on shifts in plant metabolite profiles. Existing studies have shown that technologies such as metabolomics and proteomics have successfully elucidated the defense mechanisms and metabolic profile alterations in tea plants under insect stress [7,8]. However, these techniques often require complex sample preparation procedures and involve high analytical costs, limiting their practicality in large-scale pest early warning systems. In contrast, infrared spectroscopy has emerged as a rapid and efficient detection method. Due to its sensitivity to changes in plant chemical composition, it has been widely applied in diagnosing plant stress conditions [10]. Specifically in the context of pest monitoring, this technology has demonstrated successful applications in nondestructive detection of insect infestation, assessment of damage severity, and tracking of pest migration dynamics across multiple dimensions [11,12,13].
Aaron et al. investigated the use of spectroscopy (350–2500 nm) and multispectral cameras to detect the impact of spider mites on banana plants. By analyzing spectral data using various classification models such as PLSDA, they found that the red edge and near-infrared bands played a significant role in detection. The results demonstrated that spectral-based remote sensing methods could effectively detect spider mite infestations, and multispectral sensors have commercial application potential, with prediction accuracy reaching 0.82 [14]. Fu et al. developed a quantitative monitoring model for cotton aphid severity based on Sentinel-2 satellite multispectral data. Using spectral ratio derivatives and random forest algorithms, they extracted cotton areas and analyzed the spectral features of aphids. The results showed that cotton aphids at different levels exhibited significantly different spectral reflectance curves, with a positive correlation between the visible light range and aphid severity, and a negative correlation in the near-infrared range. The DRS algorithm effectively removed background interference, enhancing aphid spectral features. By applying the random forest model, processed Sentinel-2 images could efficiently classify aphid severity, achieving an overall classification accuracy of 0.80 [15]. Xu et al. explored the use of drone remote sensing technology to monitor the damage caused by bamboo leaf-eating pests in Moso bamboo forests. By extracting damage-sensitive features from multispectral images captured by drones and using machine learning algorithms such as support vector machines, random forests, and extreme gradient boosting trees, they trained detection models. The results indicated that extreme gradient boosting trees outperformed the other two algorithms in detecting healthy bamboo, as well as light, moderate, and severe damage, providing a technical reference for pest monitoring and control in Moso bamboo areas [16]. However, these studies did not explore the detection capability of VIS-NIRS for determining the timing of pest infestations. Furthermore, in the field of tea geometrid stress detection, there is a lack of research on the detection mechanisms of VIS-NIRS.
Therefore, this study applied different density gradient treatments of tea geometrid herbivory to the tea plantation and analyzed the VIS-NIRS of treated and control groups over five days, along with metabolomics data from the final days’ leaves. This study explored the ability of VIS-NIRS, combined with machine learning algorithms, to identify leaves damaged by tea geometrids and determine the timing of herbivory. Additionally, by integrating leaf metabolomics data, the research analyzed the detection mechanisms of VIS-NIRS in identifying tea geometrid stress. This research lays an important theoretical foundation for in situ, rapid field detection of tea geometrid stress using VIS-NIRS and provides crucial technical support for future applications.
2. Materials and Methods
2.1. Sample Preparation
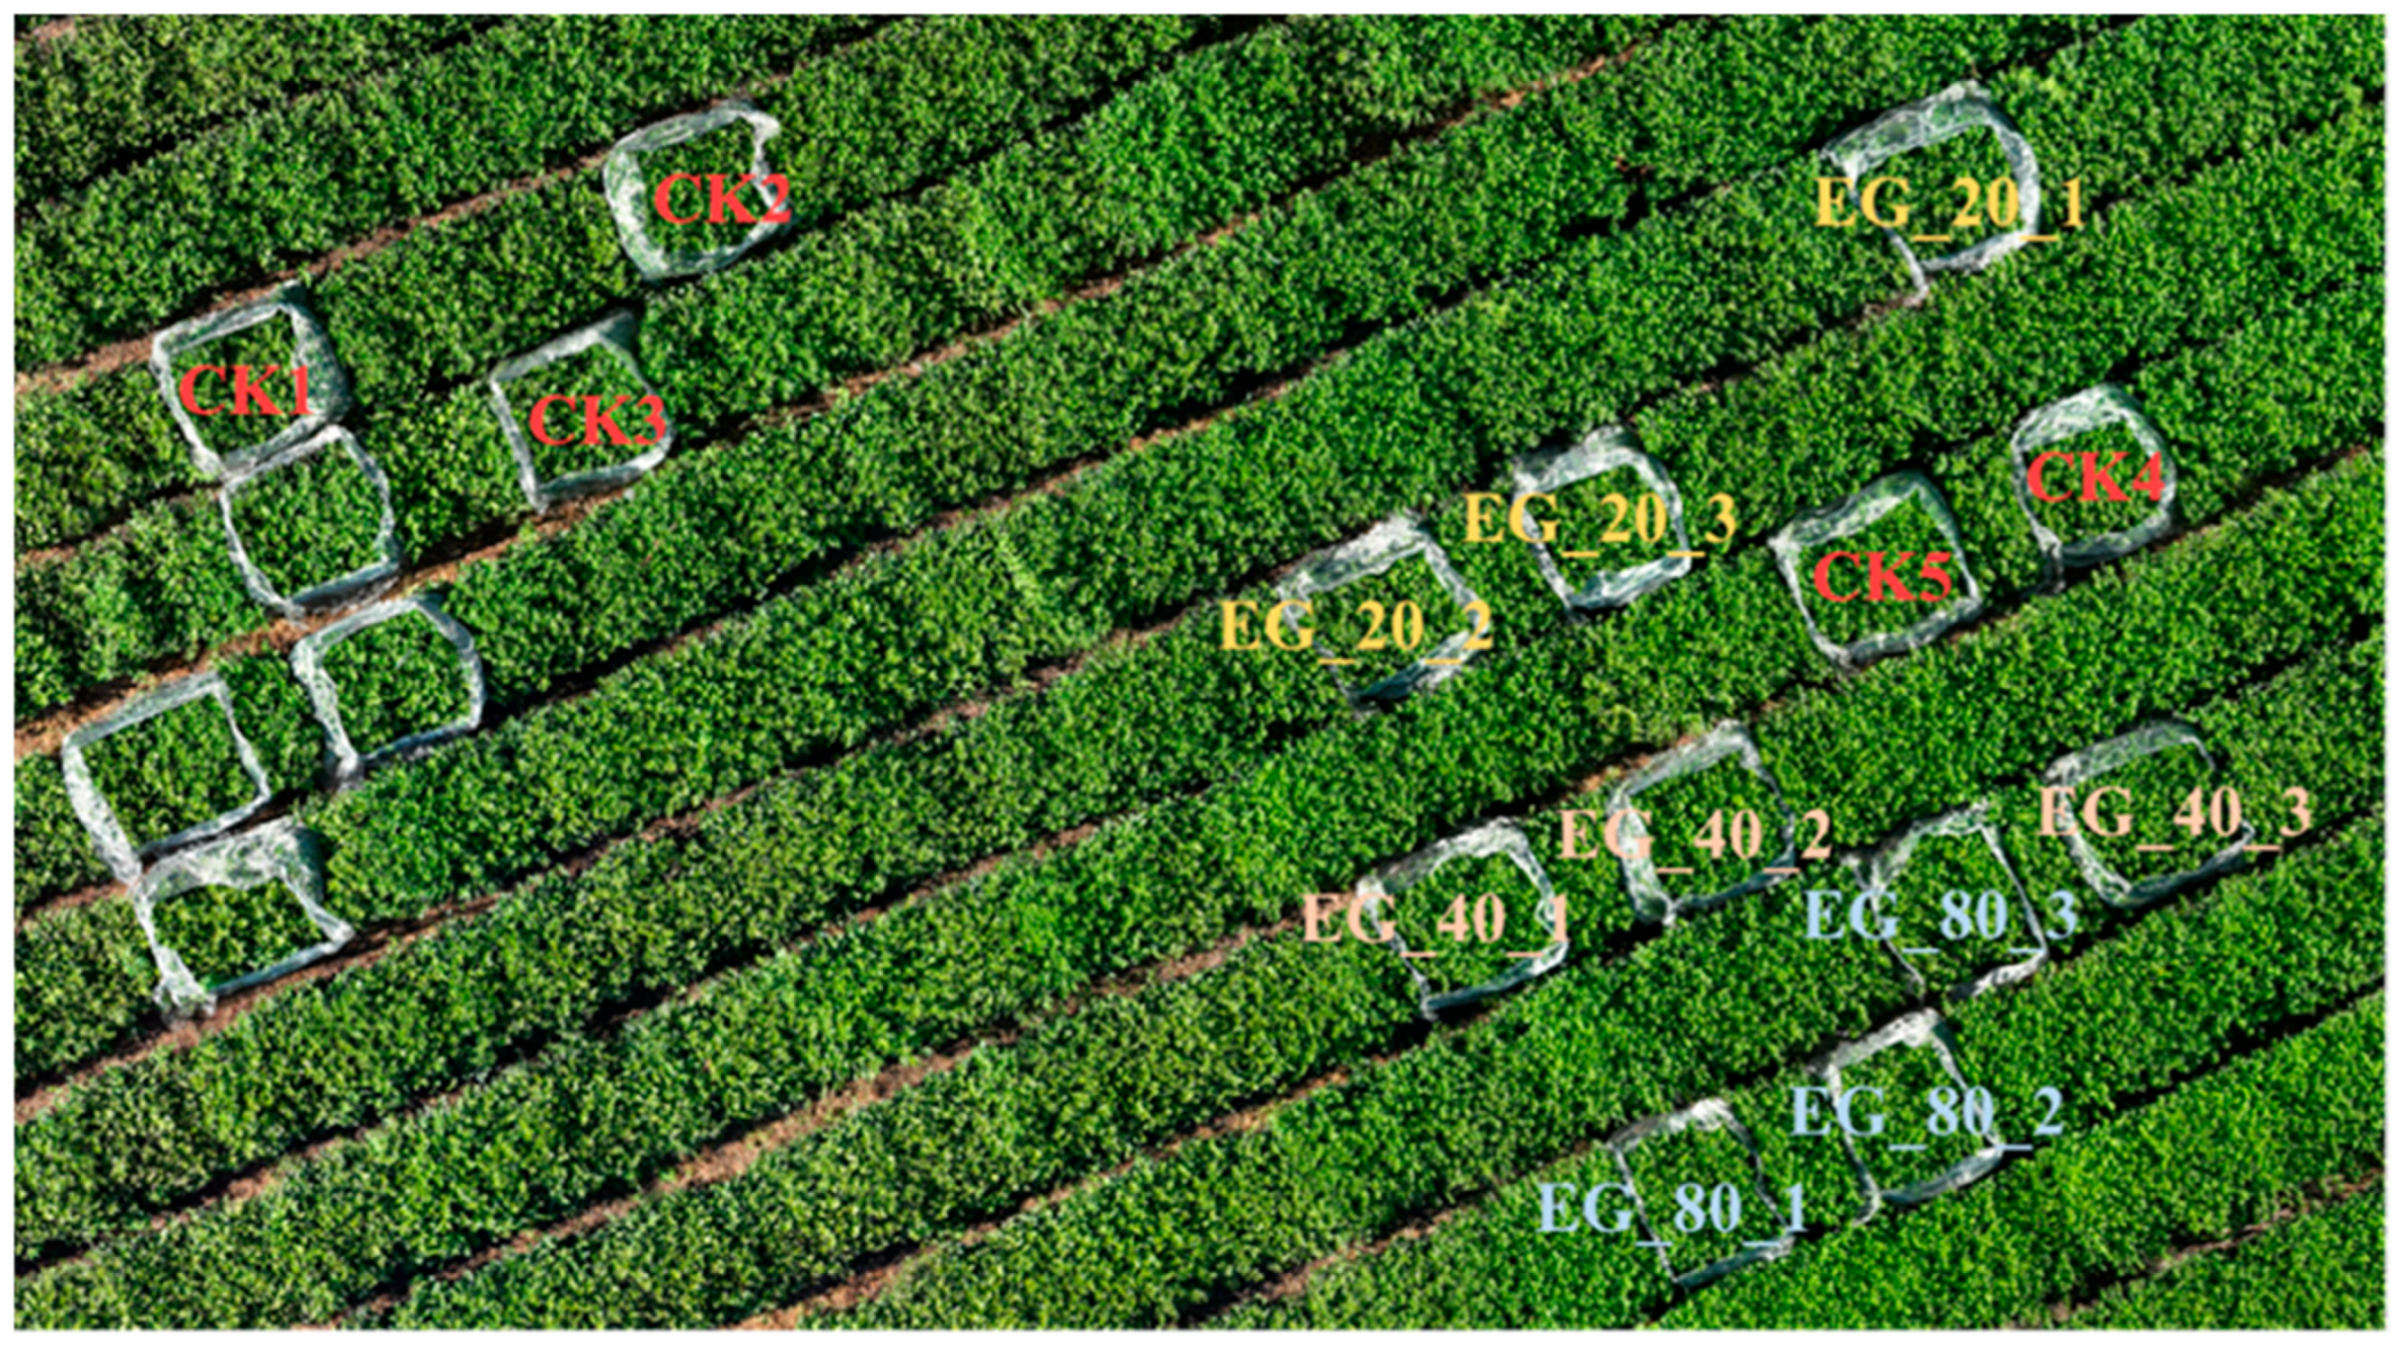
This experiment was conducted at the Tea Research Institute of the Hangzhou Academy of Agricultural Sciences, located in a well-managed and generally healthy tea plantation in Hangzhou City. The geographical coordinates of the experimental site are 30°11′0″ N latitude and 120°4′8″ E longitude. The researchers set up 14 rectangular enclosures, each measuring 1.5 × 2 m, using wire mesh, as shown in Figure 1. Starting at noon on 12 September 2024, 500 tea geometrids (2nd–3rd instar) were subjected to starvation treatment. Prior to introducing the larvae, we carefully inspected the selected plots and confirmed that only a few leaves showed signs of prior herbivory. These leaves were removed, and the area was enclosed with wire mesh to prevent the entry of other pests. At 9:00 PM that day, the tea geometrids were placed into the corresponding enclosures as shown in Figure 1. The EG_20 enclosure contained 20 tea geometrids, EG_40 contained 40 tea geometrids, and EG_80 contained 80 tea geometrids, while the CK enclosure served as the blank control. On the following morning, before data collection, we conducted another thorough inspection and manually removed all visible larvae. To ensure that any differences in herbivory were not confounded by natural variation in the tea plants themselves, two additional CK enclosures (CK4 and CK5) were placed between the herbivory treatment enclosures, and the enclosures for the same geometrid density gradients were distributed across different tea plots.
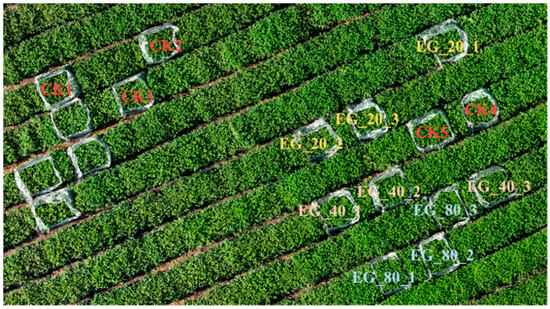
Figure 1.
Barbed wire frames correspond to the processing type.
To simulate a realistic field environment, no specific measures were taken to exclude other pests during the experiment. However, on the day following the release of tea geometrid larvae, we marked the branches corresponding to newly damaged leaves that exhibited characteristic feeding notches caused by the larvae. In the subsequent data collection process, only the leaves from these tagged branches were selected for spectral measurements. This approach ensured that all sampled leaves showing herbivory damage were indeed the result of tea geometrids feeding.
2.2. VIS-NIRS Acquisition
The VIS-NIR spectra were collected using ASD spectrometers (Malvern Panalytical, UK), which offer a spectral resolution of 3 nm in the VNIR region and 8 nm in the SWIR region. From September 13 to September 18 (weather conditions detailed in Table 1), spectral data were collected on rain-free mornings. No spectral data were collected on September 16 due to consistently poor weather conditions throughout the day. For the control group, spectra were collected from healthy tea leaves. For the treatment groups, leaves exhibiting newly formed insect feeding marks near the insect release points were selected. During data acquisition, the spectrometer probe was placed in direct contact with the leaf surface, and the built-in halogen lamp was used as the light source. White reference calibration was performed every 15 min during spectral acquisition. Integration time was adjusted to prevent white reference overexposure while maximizing signal intensity. Each recorded spectrum was the average of 10 individual scans.

Table 1.
Daily weather during the experiment.
2.3. Collection and Processing of Metabolome Samples
After collecting ASD spectra on September 18, leaf samples were harvested for metabolomic analysis. For the CK group, three biological replicates were collected from the five enclosures (CK1–CK5), with each replicate consisting of 20 healthy leaves. For the EG treatment groups, 20 leaves showing visible feeding marks were collected from each enclosure as a single sample, yielding three biological replicates for each geometrid density level (EG_20, EG_40, EG_80). Immediately after sampling, the leaves were placed into cryogenic tubes, with 2–3 leaves per tube. Each tube was labeled and promptly submerged in liquid nitrogen. Once all samples were collected, the cryogenic tubes were packed in dry ice and shipped to MetWare Biotechnology Co., Ltd. (Wuhan, China) for metabolomic analysis.
2.4. Construction of the Stress Identification Model Based on VIS-NIRS
PLSDA and RF models are commonly used as spectral data-based plant stress detection models [17]. Spectral data preprocessing can enhance the performance of models built using spectral data [18]. Savitzky–Golay smoothing (SG) and min–max normalization (MM) are widely used spectral preprocessing methods, which are commonly applied in both spectral classification and quantitative models [19,20,21].
This study utilized PLSDA and RF to distinguish different treatment types within the same day and to differentiate the number of days for each treatment type (CK and EG). SG smoothing combined with min–max normalization (SG + MM) preprocessing was applied, and the effects of using preprocessing versus no preprocessing on classification performance were compared. In distinguishing between different treatment types on the same day, this study attempted to classify CK, EG_20, EG_40, and EG_80 separately, or directly distinguish between CK and EG. Hyperparameter optimization was performed for both the number of principal components in PLSDA and the number of decision trees in each random forest. Specifically, the number of principal components for PLSDA was tested in the range of 5 to 30, while the number of trees in the random forest was set to 100, 200, and 300 for comparison. This study adopted 10-fold cross-validation. All algorithm implementations in this study were carried out using Python 3.8 and executed within the PyCharm Community Edition 2024.1.1 development environment.
3. Results and Discussion
3.1. Metabolomics Analysis of Field Samples
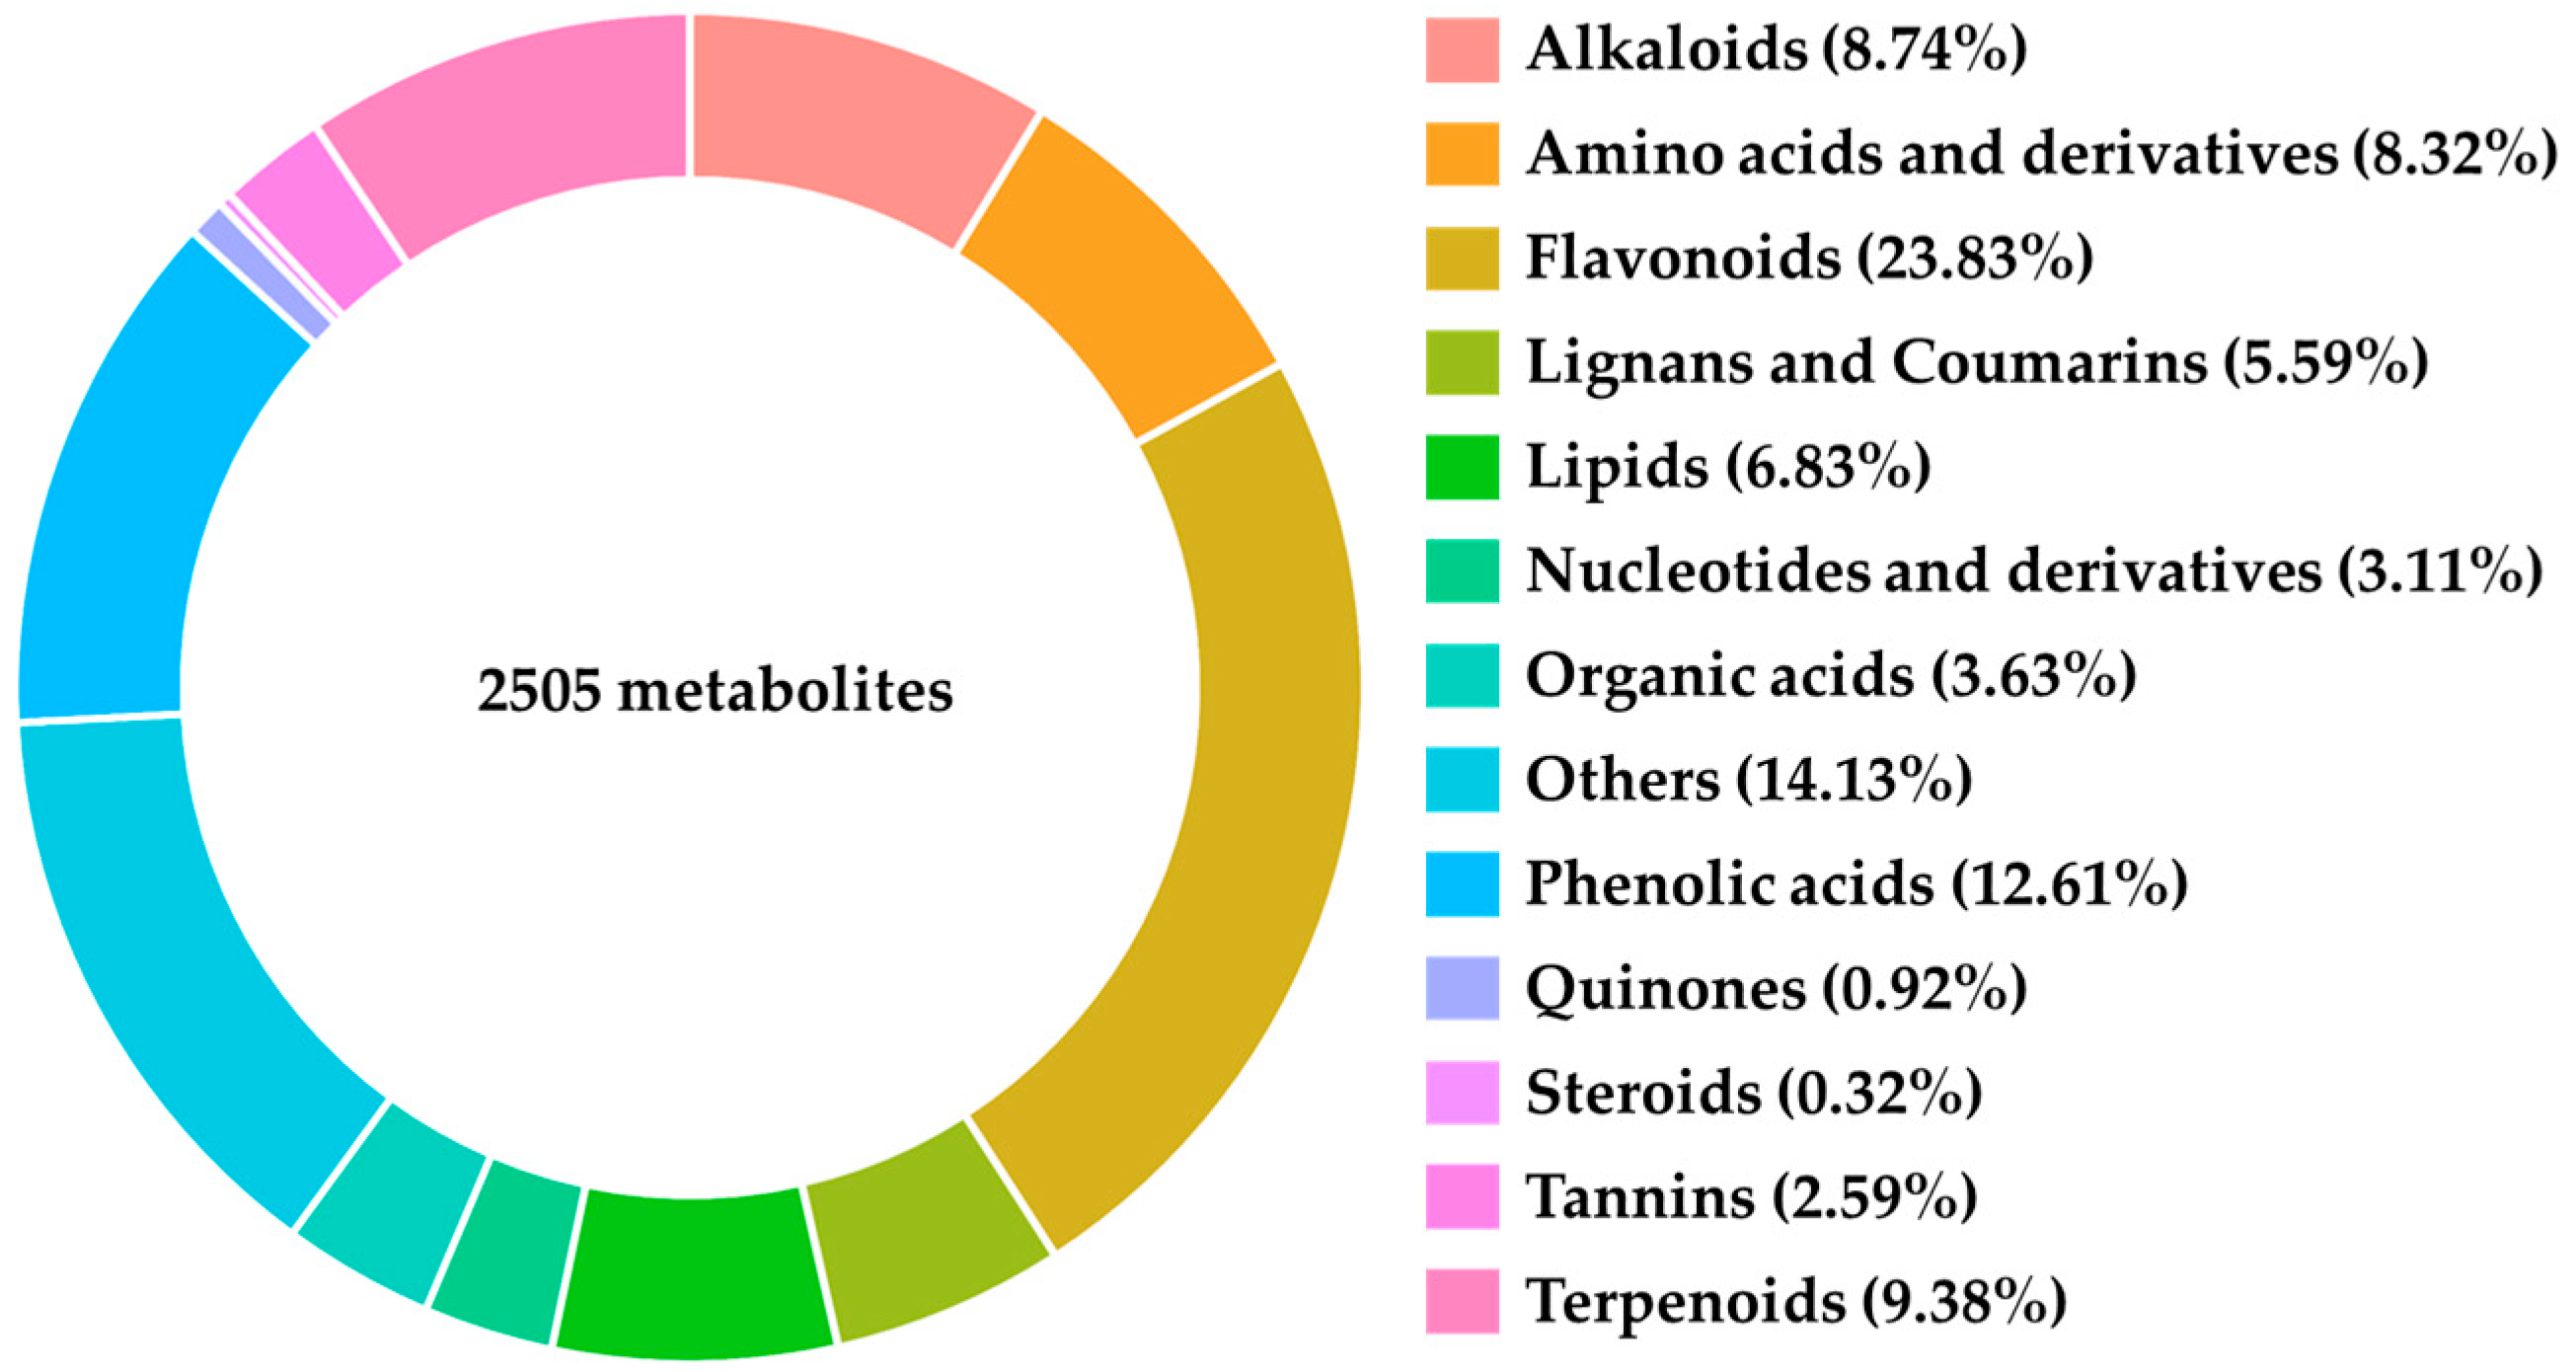
Metabolomic analysis was conducted on samples collected on the sixth day, resulting in the identification of 2505 distinct metabolites, including Alkaloids, Amino Acids and Derivatives, Flavonoids, Lignans and Coumarins, Lipids, Nucleotides and Derivatives, Organic Acids, Phenolic Acids, Quinones, Steroids, Tannins, and Terpenoids (Figure 2).
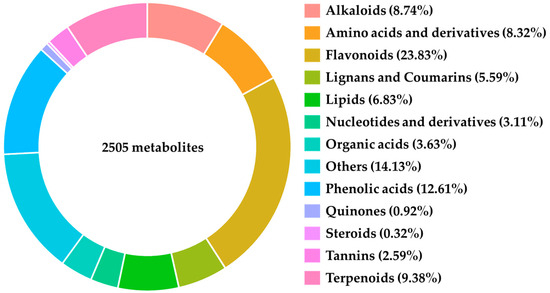
Figure 2.
Primary classification of metabolites detected by metabolomics.
After dimensionality reduction using PCA, the first two principal components clearly distinguished the CK group from the three different treatments: EG_20, EG_40, and EG_80 (Figure 3). Notably, the second principal component was significantly lower in samples subjected to tea geometrid feeding, and the first principal component decreased progressively with increasing tea geometrid density. This suggests that both feeding activity and increasing herbivore density induce notable changes in leaf metabolite profiles. The metabolite composition of leaves varied with tea geometrid density, further confirming that density changes stimulate the emission of signaling compounds by tea plants, thereby affecting the metabolism of neighboring tea plants. It is important to note that this metabolic shift differs from the changes caused directly by herbivore feeding on intact tea leaves. This explains why the PCA patterns differ between increasing geometrid density and herbivore feeding on intact tea leaves.
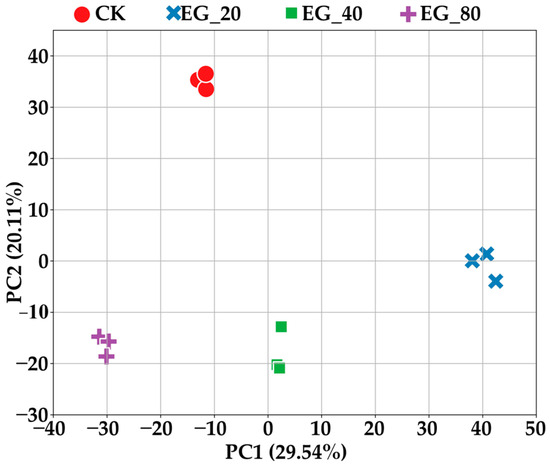
Figure 3.
The first two principal components of PCA distinguish the CK group, EG_20, EG_40, and EG_80 treatment groups.
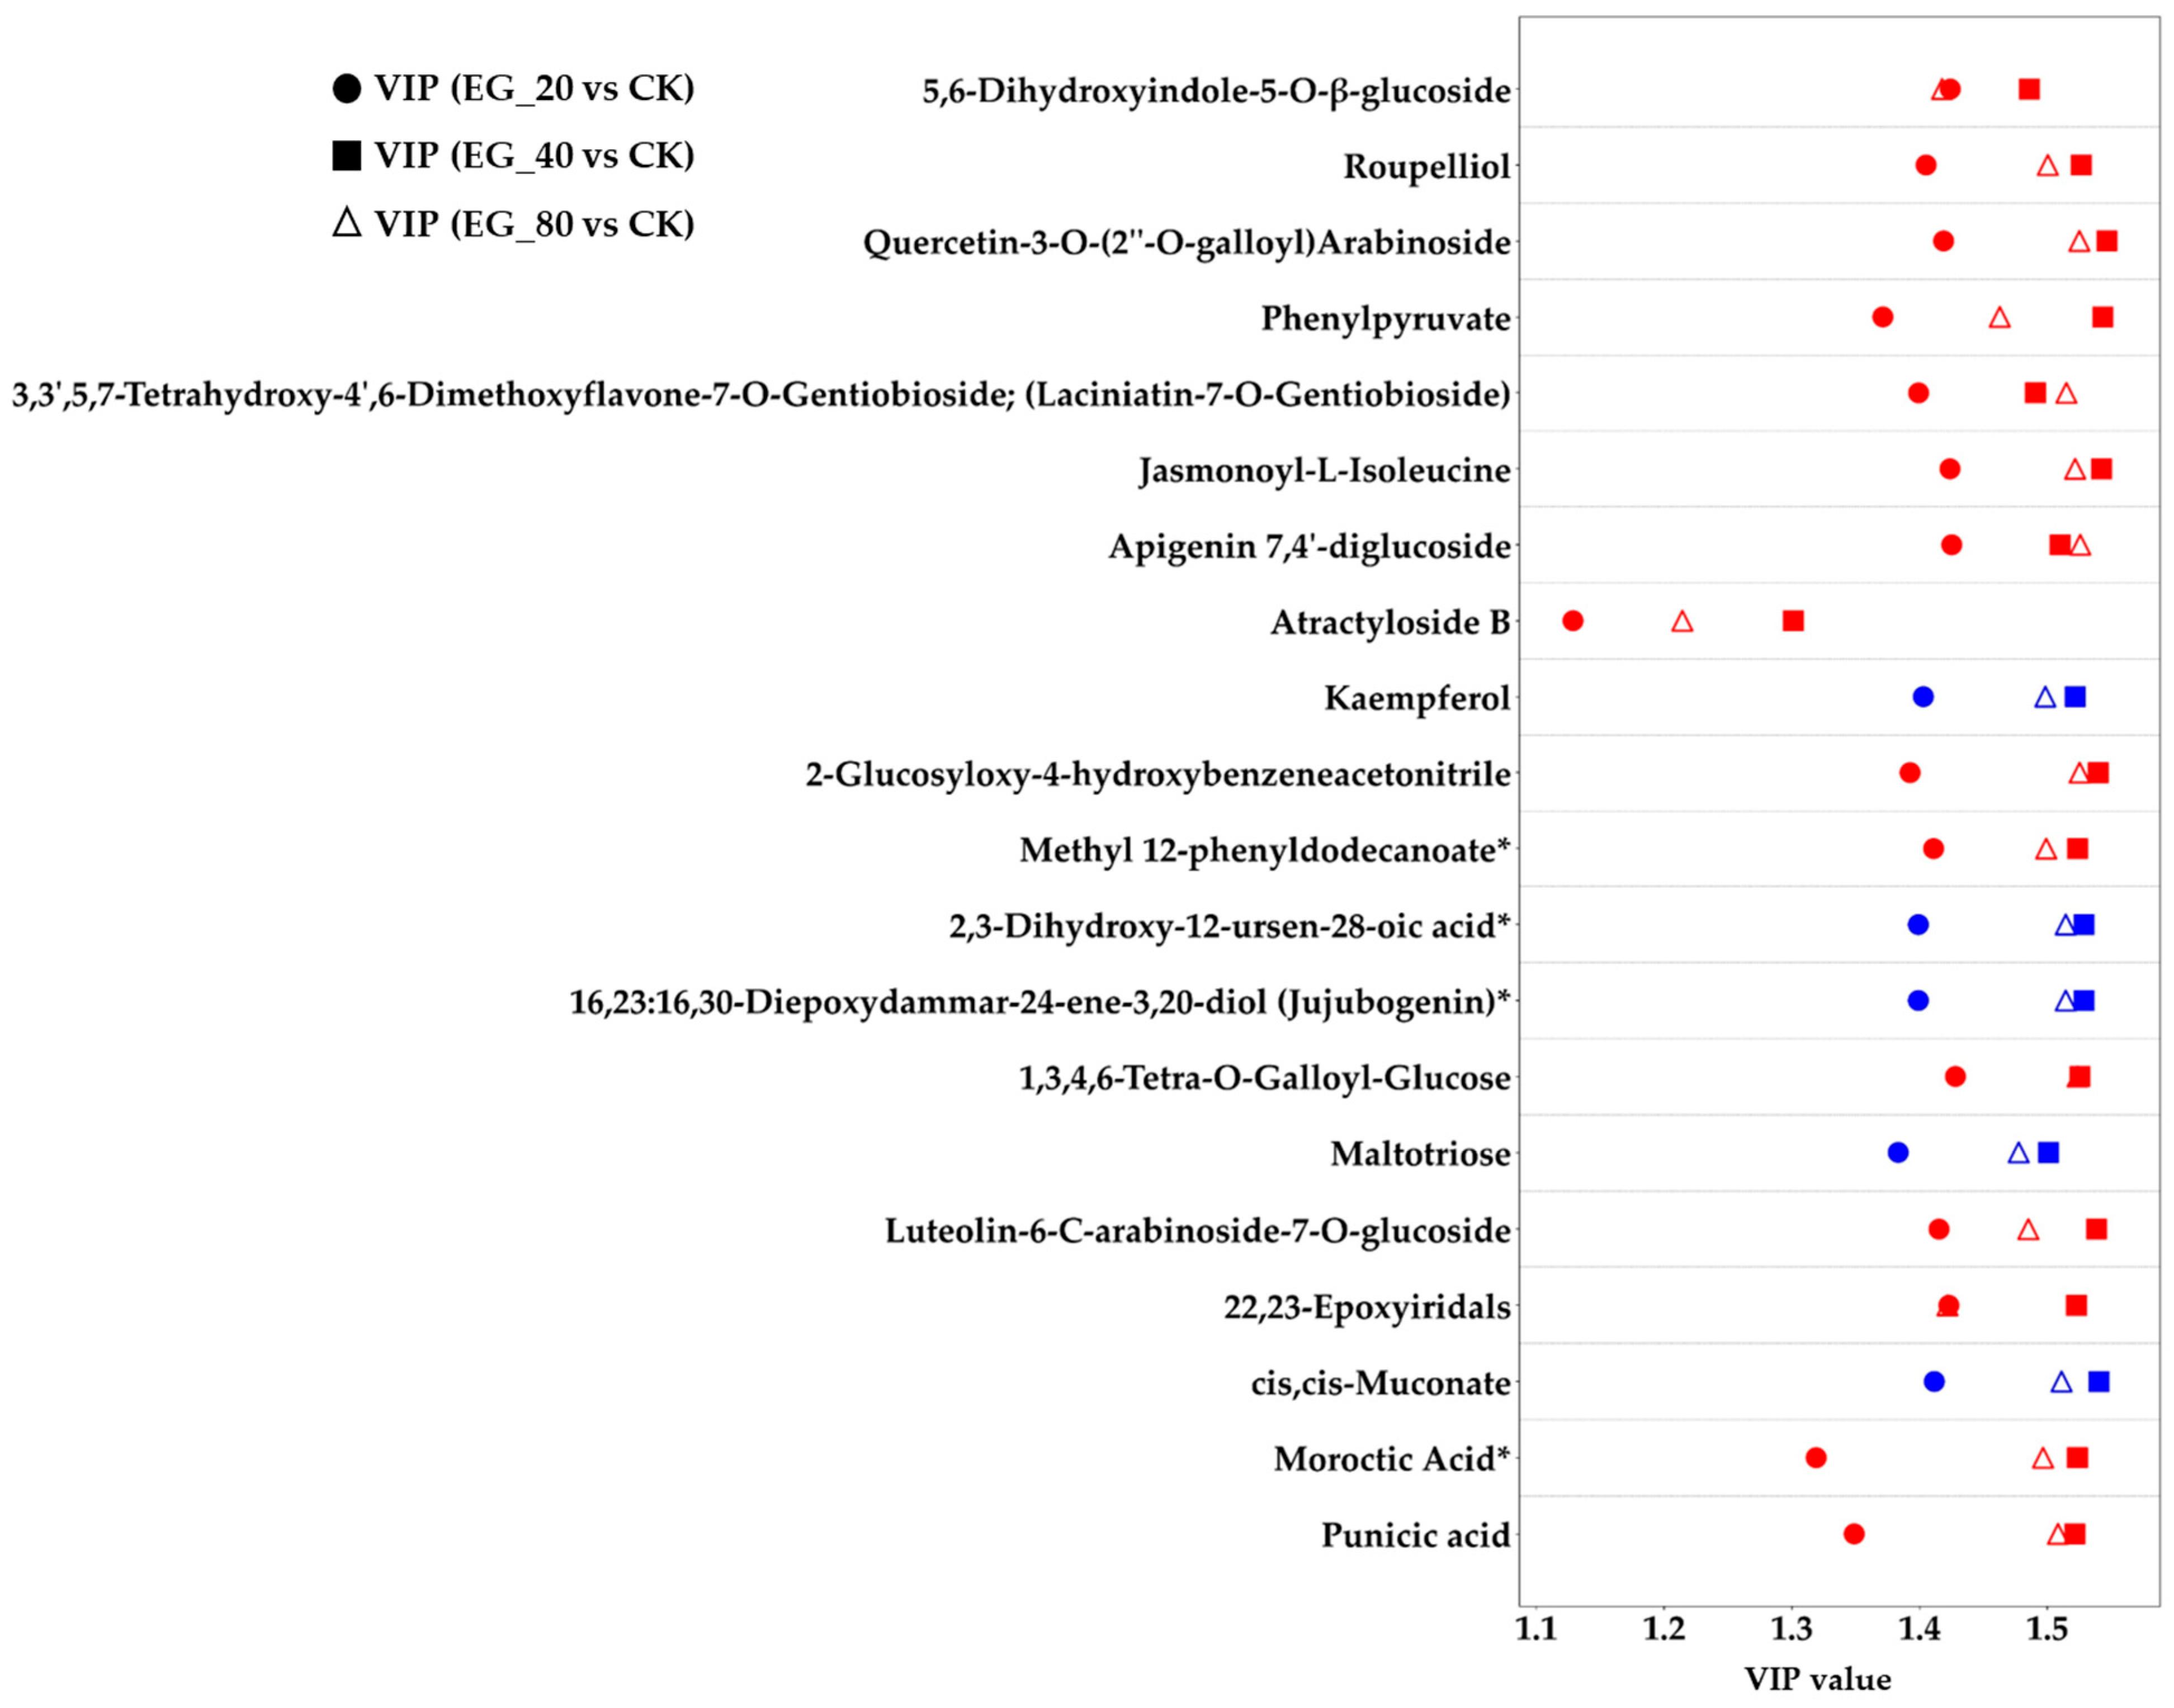
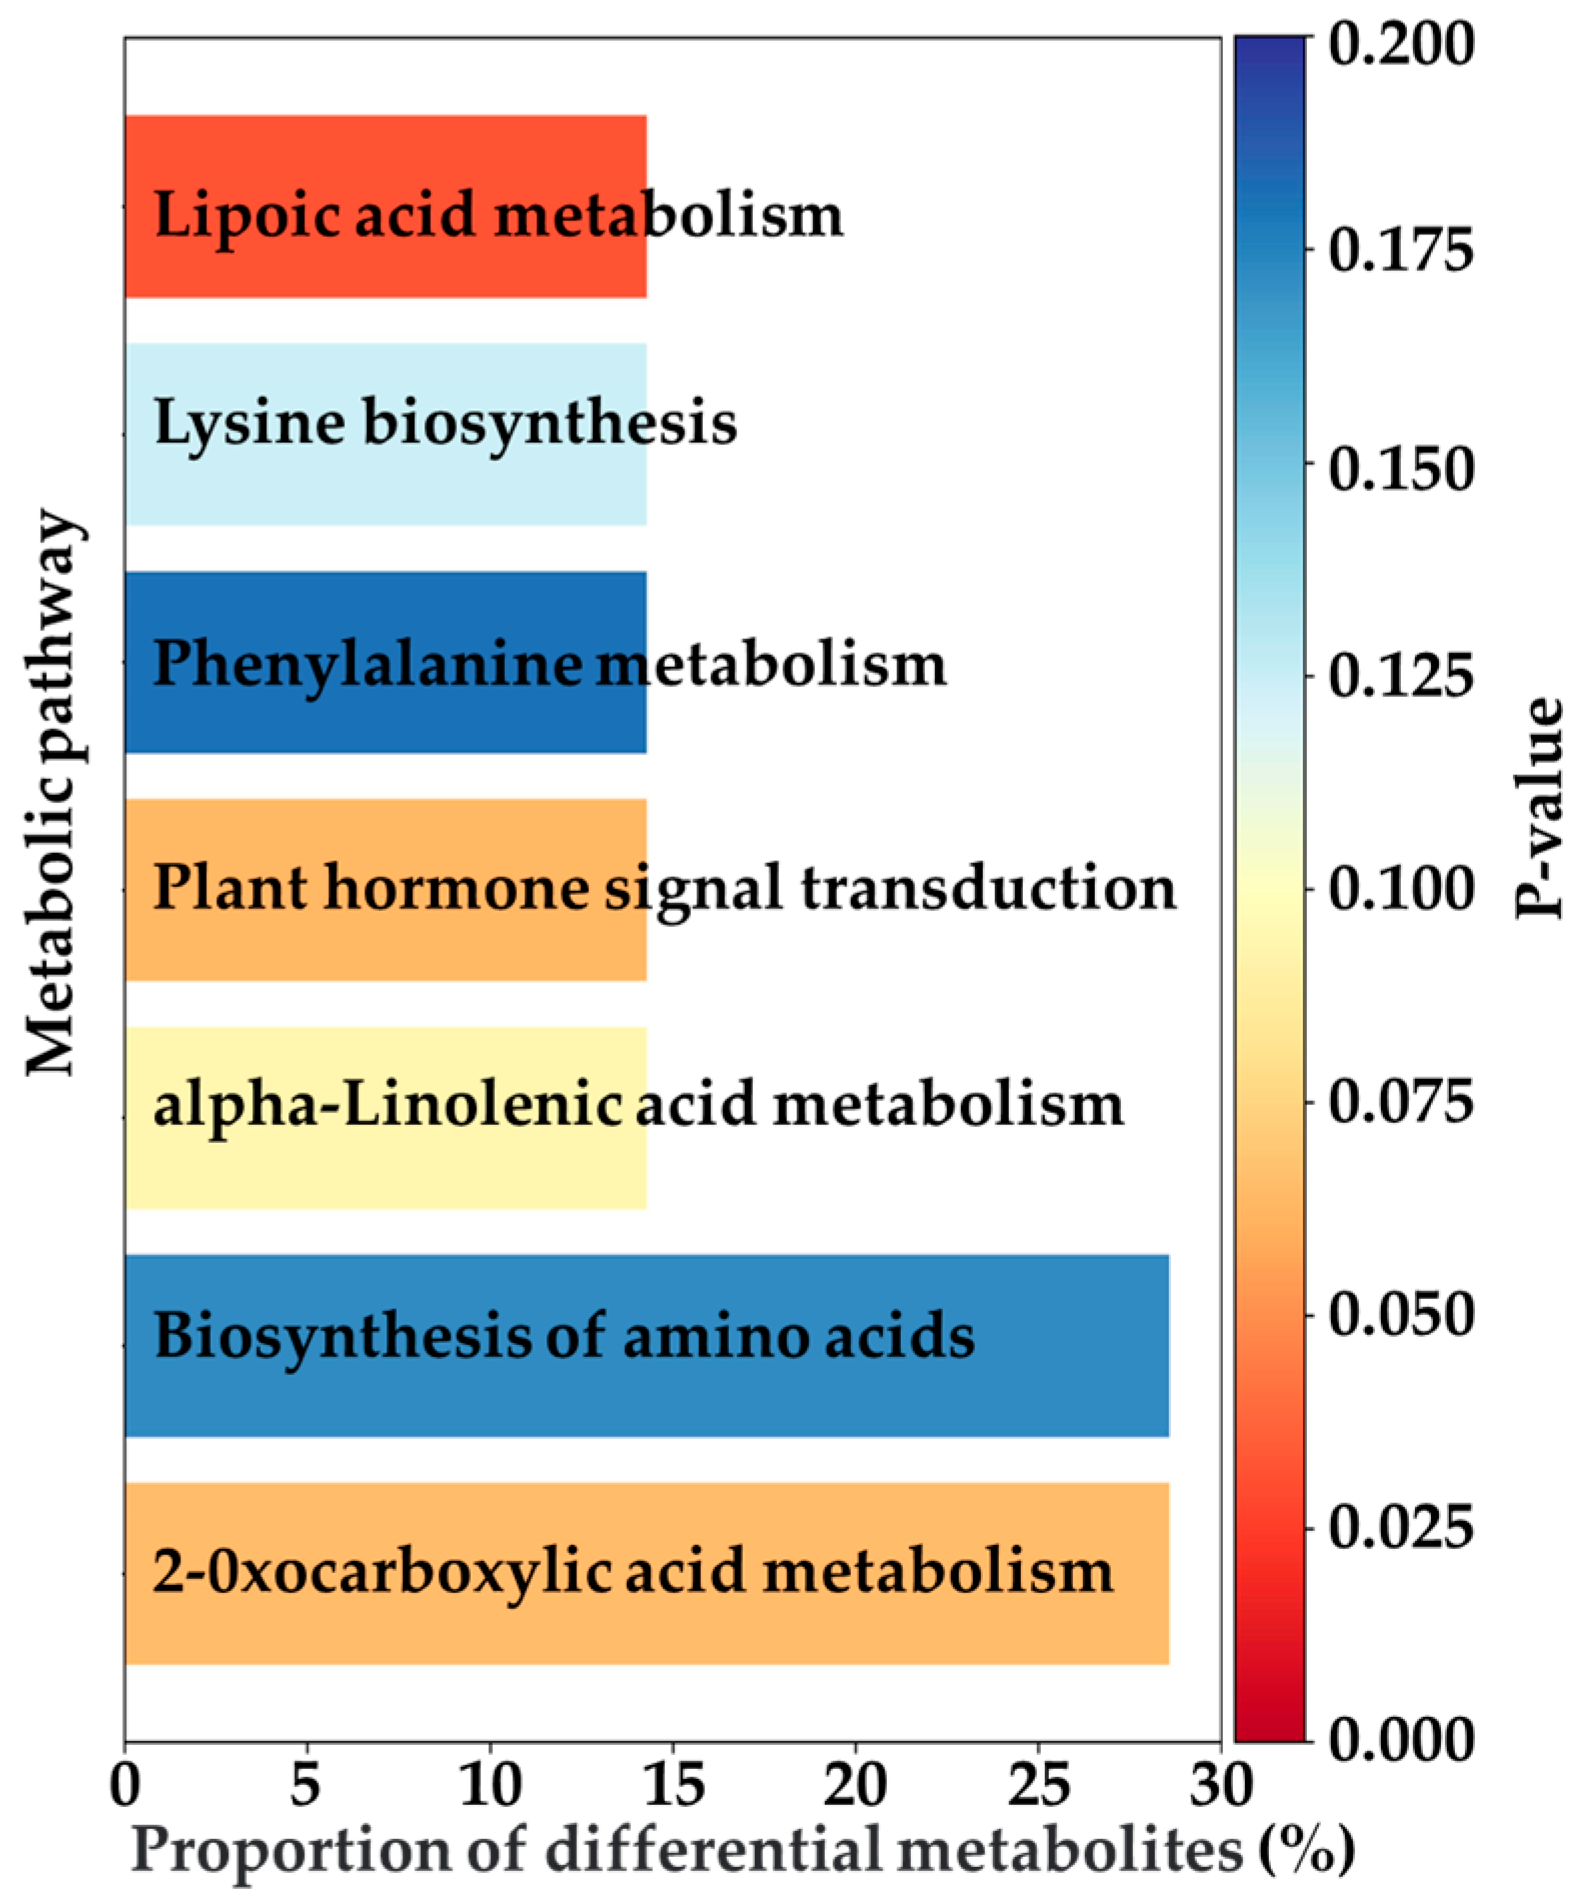
This study further investigated the differential metabolites and identified 49 common differentially expressed metabolites across the three EG treatments (EG_20, EG_40, EG_80) compared to the CK group (Table 2). These metabolites were consistently upregulated or downregulated across all EG treatments. They primarily belonged to the categories of terpenoids, fatty acids, alkaloids, and flavonoids. These metabolic changes are supported by previous research findings. Specifically, monoterpenes and sesquiterpenes are key components of plant volatiles, playing crucial roles in the long-distance host location of herbivorous insects and their natural enemies. Some terpenes can directly repel ovipositing adults, while certain oxygenated derivatives are capable of attracting predators of pests [22]. Fatty acids (linoleic acid and α-linolenic acid) are closely linked to the jasmonic acid (JA) signaling pathway, often participating in the synthesis and metabolism of JA, which is vital to insect resistance in plants [23]. Alkaloids serve a variety of biological functions, such as interfering with insect enzyme activity, altering physiological processes, inhibiting DNA synthesis and repair, or significantly affecting the insect nervous system [24]. Plants increase the production of flavonoids, including chalcones and anthocyanins, by upregulating genes such as chalcone synthase in the flavonoid biosynthesis pathway. This response helps eliminate excess reactive oxygen species and inhibits the growth and development of herbivorous insects [23]. Figure 4 illustrates 20 of these common differential metabolites, notably showing that 88.8% of them were upregulated. The Variable Importance in Projection (VIP) score is a statistical metric commonly used in metabolomics [25]. A metabolite is considered to exhibit a significant change in response to treatment when its VIP score exceeds 1. Subsequently, this study analyzed the pathways associated with metabolite changes induced by tea geometrid feeding (Figure 5). The upregulated metabolites were mainly enriched in pathways including lipoic acid metabolism, lysine biosynthesis, phenylalanine metabolism, plant hormone signal transduction, α-linolenic acid metabolism, amino acid biosynthesis, and 2-oxocarboxylic acid metabolism. Among these, significant enrichment in the α-linolenic acid pathway is directly related to the activation of plant hormone signaling, thereby regulating the expression of defense-related genes. Activation of the phenylalanine metabolism pathway provides precursors for the biosynthesis of insect-resistant compounds such as flavonoids and lignin. The overall activation of amino acid biosynthesis not only supports the production of defensive substances but may also enhance leaf nitrogen content, potentially altering nutritional quality and indirectly affecting insect palatability [23].
Table 2.
The three groups of EG treatments (EG_20, EG_40, EG_80) had common differential metabolites relative to the CK group. The Type column indicates the direction of metabolite regulation, where “up” represents upregulated metabolites and “down” represents downregulated metabolites.

Figure 4.
EG_20, EG_40, EG_80 compared with CK’s VIP value graph of common differential metabolites (20 were randomly selected), where the ordinate represents metabolites and the abscess represents VIP value of difference detection. A metabolite is considered to exhibit a significant change in response to treatment when its VIP score exceeds 1. Red means upregulated, blue means downregulated. The asterisk (*) represents an uncertain isomer of the substance.

Figure 5.
Upregulated co-differential metabolite enrichment in each pathway.
During the experiment, field weather conditions fluctuated considerably (Table 1). However, key metabolites previously reported to be associated with tea geometrid herbivory still exhibited significant changes in tea leaves after feeding. These changes were not masked by environmental variability, providing a solid foundation for the subsequent design and data analysis of field-based spectral experiments.
3.2. Spectral Preprocessing Methods and Model Selection
To fully explore the potential of VIS-NIRS in detecting tea geometrid herbivory stress, this study first conducted a screening of classification models and preprocessing methods. Using the collected VIS-NIRS (Figure 6), two detection tasks were considered: distinguishing between the CK group and three EG treatment groups (Treatment), and differentiating among EG treatment groups across different time points (Time). PLSDA and RF models were employed, representing typical linear and nonlinear classifiers, respectively. This study compared the impact of raw VIS-NIRS data, SG preprocessing, MM preprocessing, and the combined SG + MM preprocessing on model performance. The final results are presented in Table 3.
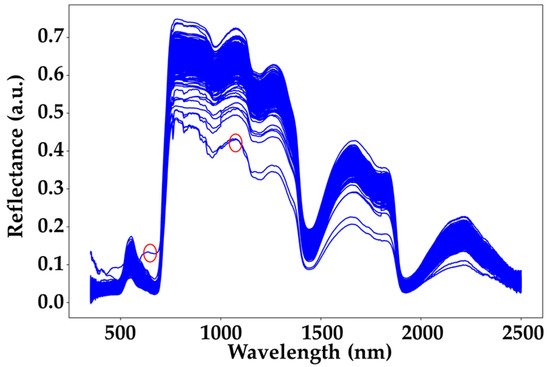
Figure 6.
ASD spectra chart. The blue curve represents all the collected spectral data, while the red circles indicate the outlier spectra.
Table 3.
The mean accuracy (ACTR_Mean) and standard deviation (ACTR_Std) of the training set, as well as the mean accuracy (ACVA_Mean) and standard deviation (ACVA_Std) of the validation set for different models and preprocessing methods (Pre-method). The red font highlights the best preprocessing results of each model. ** indicates a statistically significant difference (p < 0.01, t-test) compared to the best preprocessing method (ACVA_Mean) for each model. *** indicates a highly significant difference (p < 0.001, t-test) relative to the best preprocessing method (ACVA_Mean).
In the treatment task, all model and preprocessing combinations achieved perfect classification on the training set (ACTR_Mean = 1.000), indicating good model fitting. However, cross-validation accuracy varied significantly among the combinations. For the PLSDA model, both SG and MM preprocessing improved generalization compared to the raw spectra, with the SG + MM combination yielding the highest average validation accuracy (ACVA_Mean = 0.535). This suggests that the combined preprocessing enhanced the model’s ability to detect subtle differences between the EG and CK groups. In contrast, the RF model generally performed worse than PLSDA in this task, with its highest average validation accuracy reaching 0.482 under MM preprocessing. The improvement from SG + MM preprocessing was less pronounced in RF, possibly due to the model’s sensitivity to redundancy in high-dimensional data.
In the time task, performance divergence was more apparent. PLSDA consistently outperformed RF across all preprocessing conditions, with a maximum average validation accuracy (ACVA_Mean = 0.748) using SG + MM preprocessing, indicating its superior ability to capture spectral variations in stress responses over time. Both SG and MM preprocessing individually improved model performance, while their combination again showed a synergistic effect in PLSDA. Conversely, RF showed generally lower cross-validation accuracy in this task, with a maximum average validation accuracy of only 0.476 (SG + MM), indicating that the model has certain limitations in handling the continuous variations caused by temporal dynamics. It is worth noting that although the results indicate the presence of overfitting, this study focuses entirely on evaluating the potential of spectral data to identify tea geometrid feeding status and feeding duration based on validation set performance. Therefore, we did not delve into methods for mitigating overfitting. In fact, overfitting does not necessarily reduce a model’s predictive ability on the validation set.
Overall, the combination of PLSDA with SG + MM preprocessing achieved the best cross-validation performance in both detection tasks, indicating that linear models, when paired with appropriate preprocessing, can effectively extract stress-related information from VIS-NIRS in response to tea geometrid herbivory. Therefore, PLSDA with SG + MM preprocessing was selected for subsequent analyses.
3.3. Spectral Detection of Tea Geometrid Herbivory in Leaves
To further enhance the model’s performance, this study excluded obviously anomalous ASD spectra (indicated by the red circles in Figure 6). The identification of outlier spectra in this study was primarily based on expert judgment. As illustrated, the spectrum marked by the first red circle exhibits reflectance values significantly higher than those of other spectra at the same wavelengths, while the one marked by the second red circle is noticeably lower. Based on these observations, we defined spectra with reflectance values greater than 0.1 at 650 nm or less than 0.45 at 1050 nm as outliers and excluded them from further analysis. When distinguishing between the CK group and the EG treatment group at the same time point, the EG treatment group was first separated into individual categories (EG_20, EG_40, EG_80). The underlying mechanism for this classification is that when herbivorous insects feed on tea plants, the plants release monoterpenes and sesquiterpenes as volatiles to neighboring plants as signaling compounds [26]. These signaling compounds activate the pest defense response in nearby tea plants, leading to metabolic changes, which may be reflected in the spectral data of the tea leaves. Previous studies have also demonstrated that with the increase in pest density, the plant’s pest defense responses become more intense [27], potentially leading to more distinct spectral changes in tea leaves.
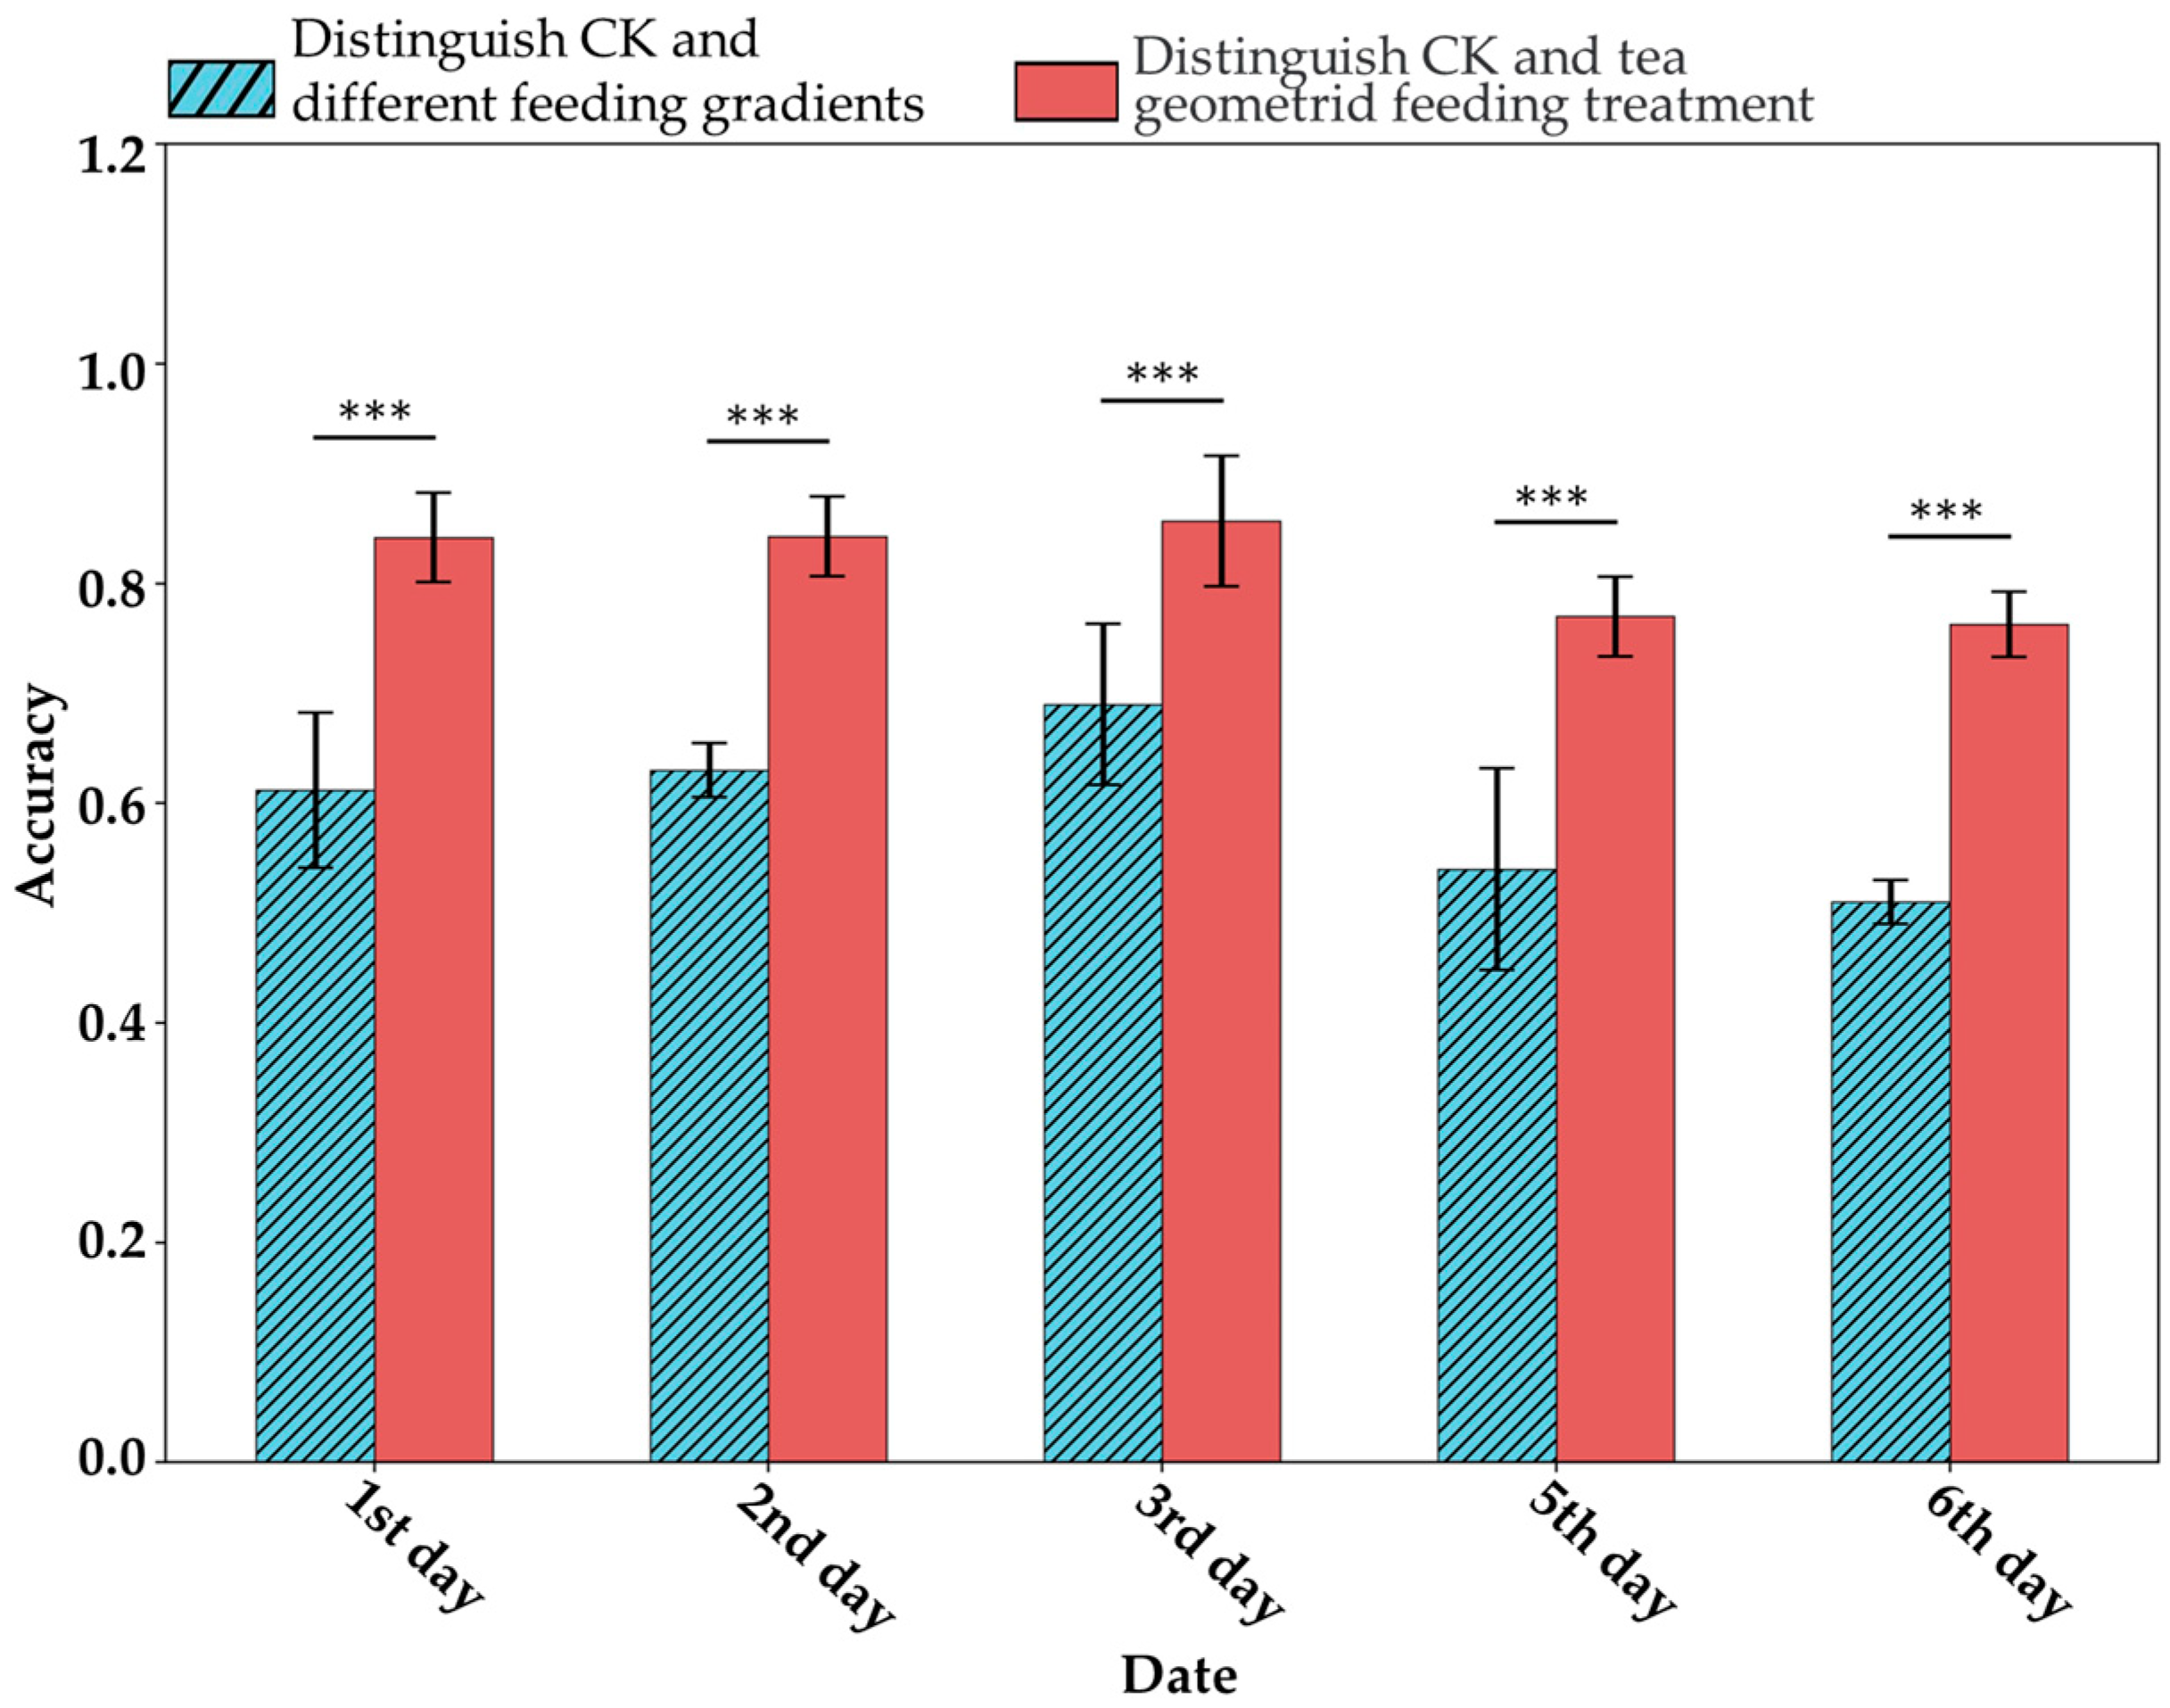
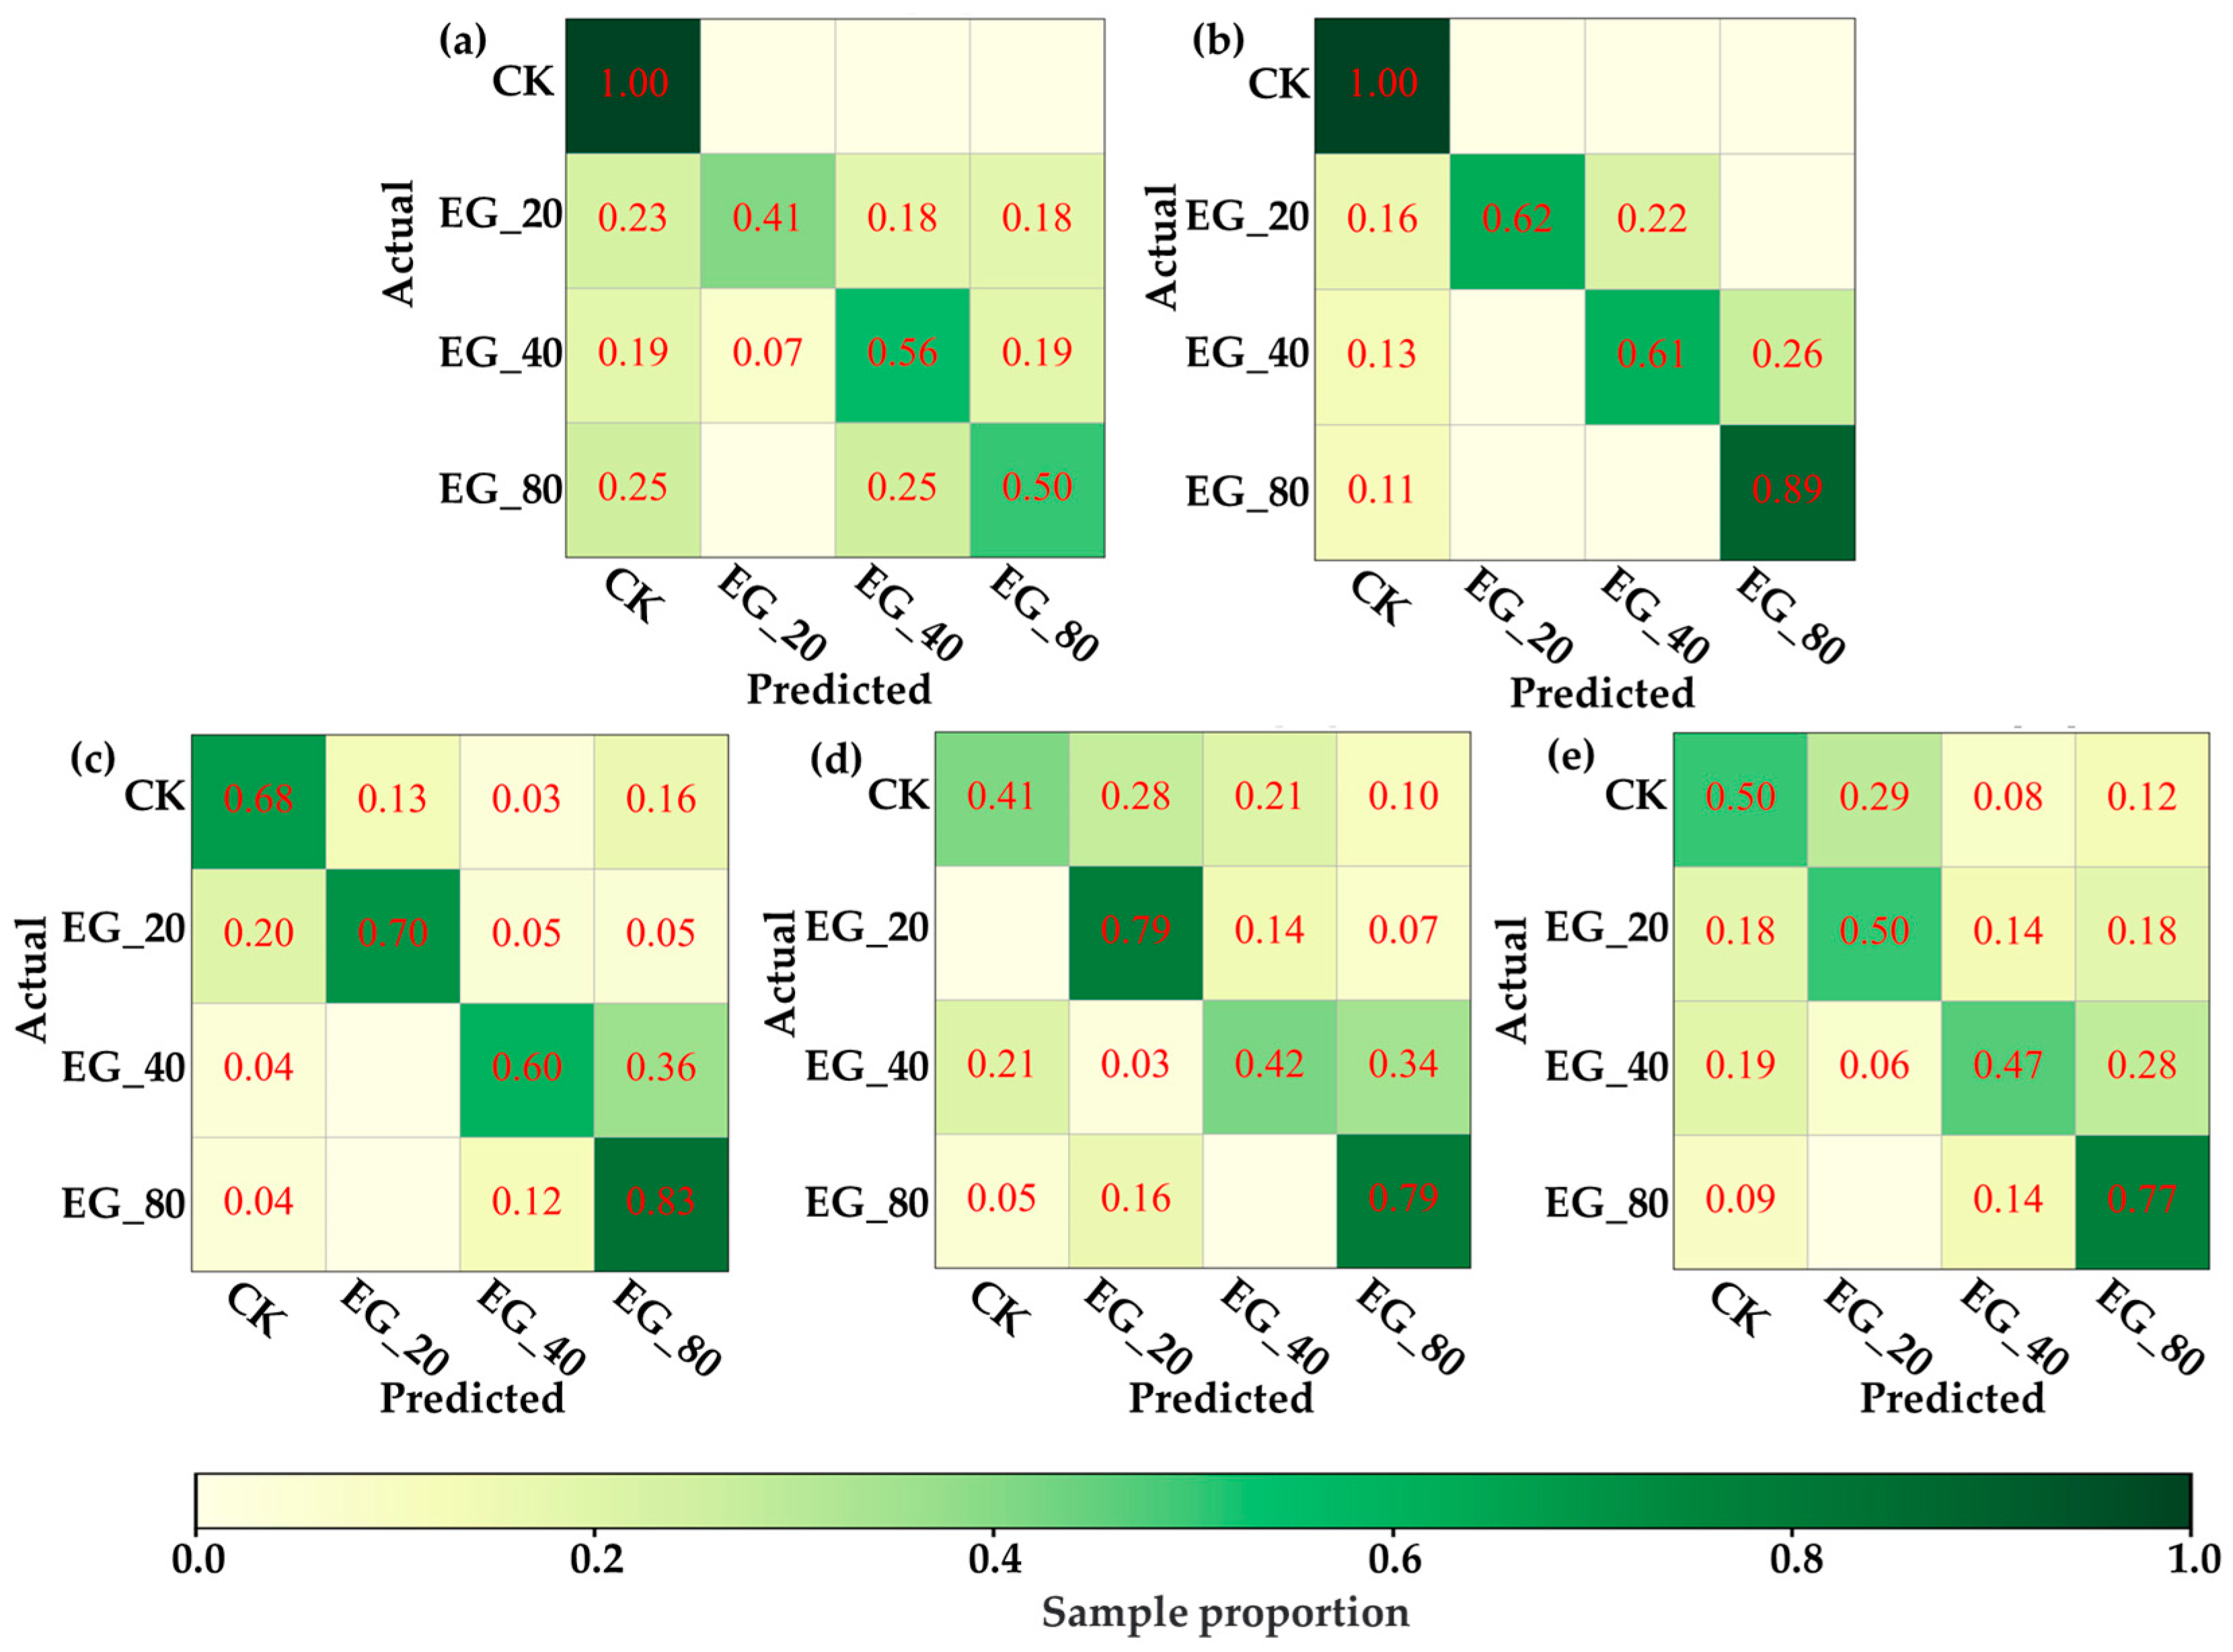
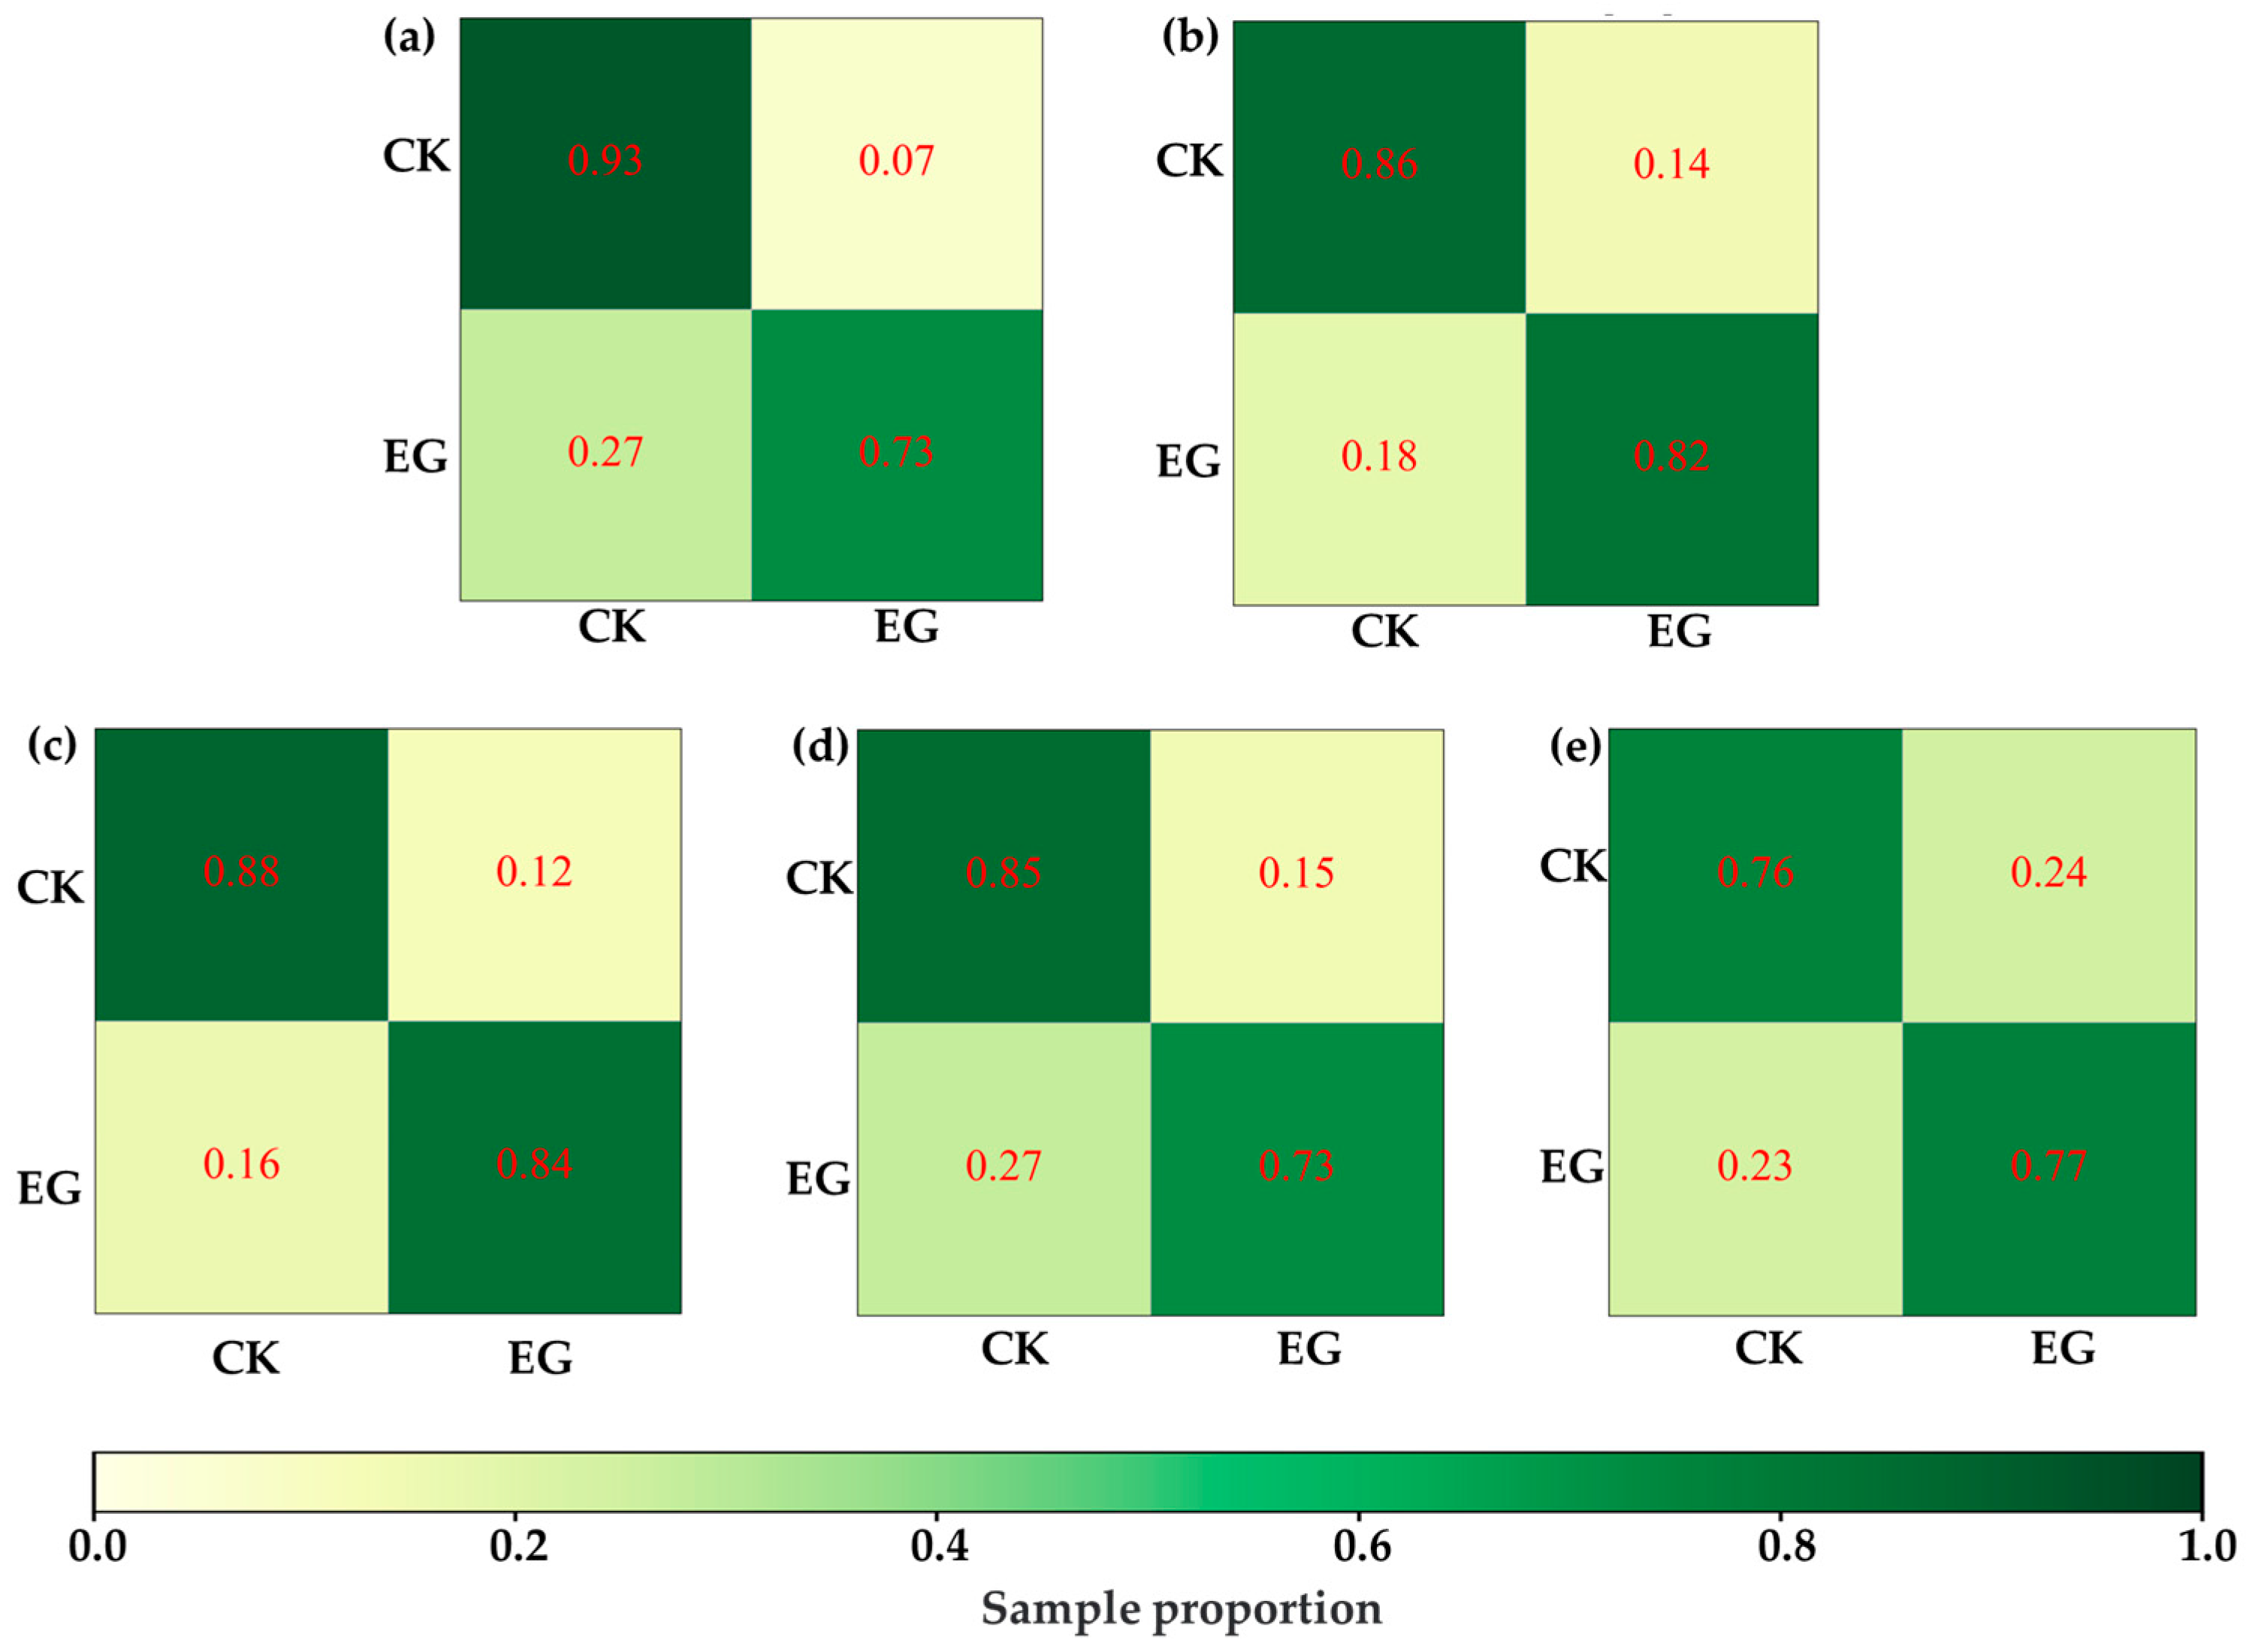
Under this hypothesis, this study attempted to distinguish VIS-NIRS of leaves under different pest density treatments, with the results shown in Figure 7. It was observed that on the second and third days, the VIS-NIRS performed best in distinguishing between the CK, EG_20, EG_40, and EG_80 groups (the blue striped bar). However, by the fifth and sixth days, the ability of VIS-NIRS to distinguish between different treatments significantly decreased. This could be due to the diminishing effects of the treatments on the plants over time, leading to a gradual disappearance of spectral differences in the leaves [28,29]. Figure 8 presents the confusion matrix for distinguishing treatments based on VIS-NIRS across different days. It can be seen that from the third day onward, distinguishing the CK group from the other treatment groups became more difficult. This may be because, starting on the third day (15 September), the weather in the tea garden changed noticeably (Table 1), making it harder to differentiate between EG_20, EG_40, and EG_80 [30]. Attempting to forcefully distinguish these three treatments could lead the model to learn incorrect features, making it more challenging to differentiate between the CK and EG treatment groups. However, when all EG treatment groups were combined into one category, the model was able to more effectively distinguish between the CK and EG groups across all days (the red bar of Figure 7 and Figure 9), with the best average classification accuracy of 0.857 (Table 4).

Figure 7.
ASD spectral classification for different treatments. The length of the error bars represents the standard deviation. *** indicates p < 0.001 based on t-test results.

Figure 8.
The confusion matrix of the optimal model distinguishing CK, EG_20, EG_40, and EG_80 based on ASD spectra. (a) Distinguish by the first day ASD spectrum. (b) Differentiation by next-day ASD spectrum. (c) Distinguish by the third day ASD spectrum. (d) by the fifth day ASD spectrum. (e) Distinguish by the sixth day ASD spectrum.

Figure 9.
ASD spectra distinguish the best model confusion matrix for CK and EG processing. (a) Distinguish by the first day ASD spectrum. (b) Differentiation by next-day ASD spectrum. (c) Distinguish by the third day ASD spectrum. (d) by the fifth day ASD spectrum. (e) Distinguish by the sixth day ASD spectrum.
Table 4.
Based on ASD spectrum, PLSDA combined with spectral preprocessing method was used to distinguish CK and EG processing on the same day. ACTR_Mean, ACTR_Std, ACVA_Mean, and ACVA_Std represent the mean training accuracy, the standard deviation of training accuracy, the mean validation accuracy, and the standard deviation of validation accuracy, respectively.
3.4. Spectral Detection of Tea Geometrid Herbivory Timing
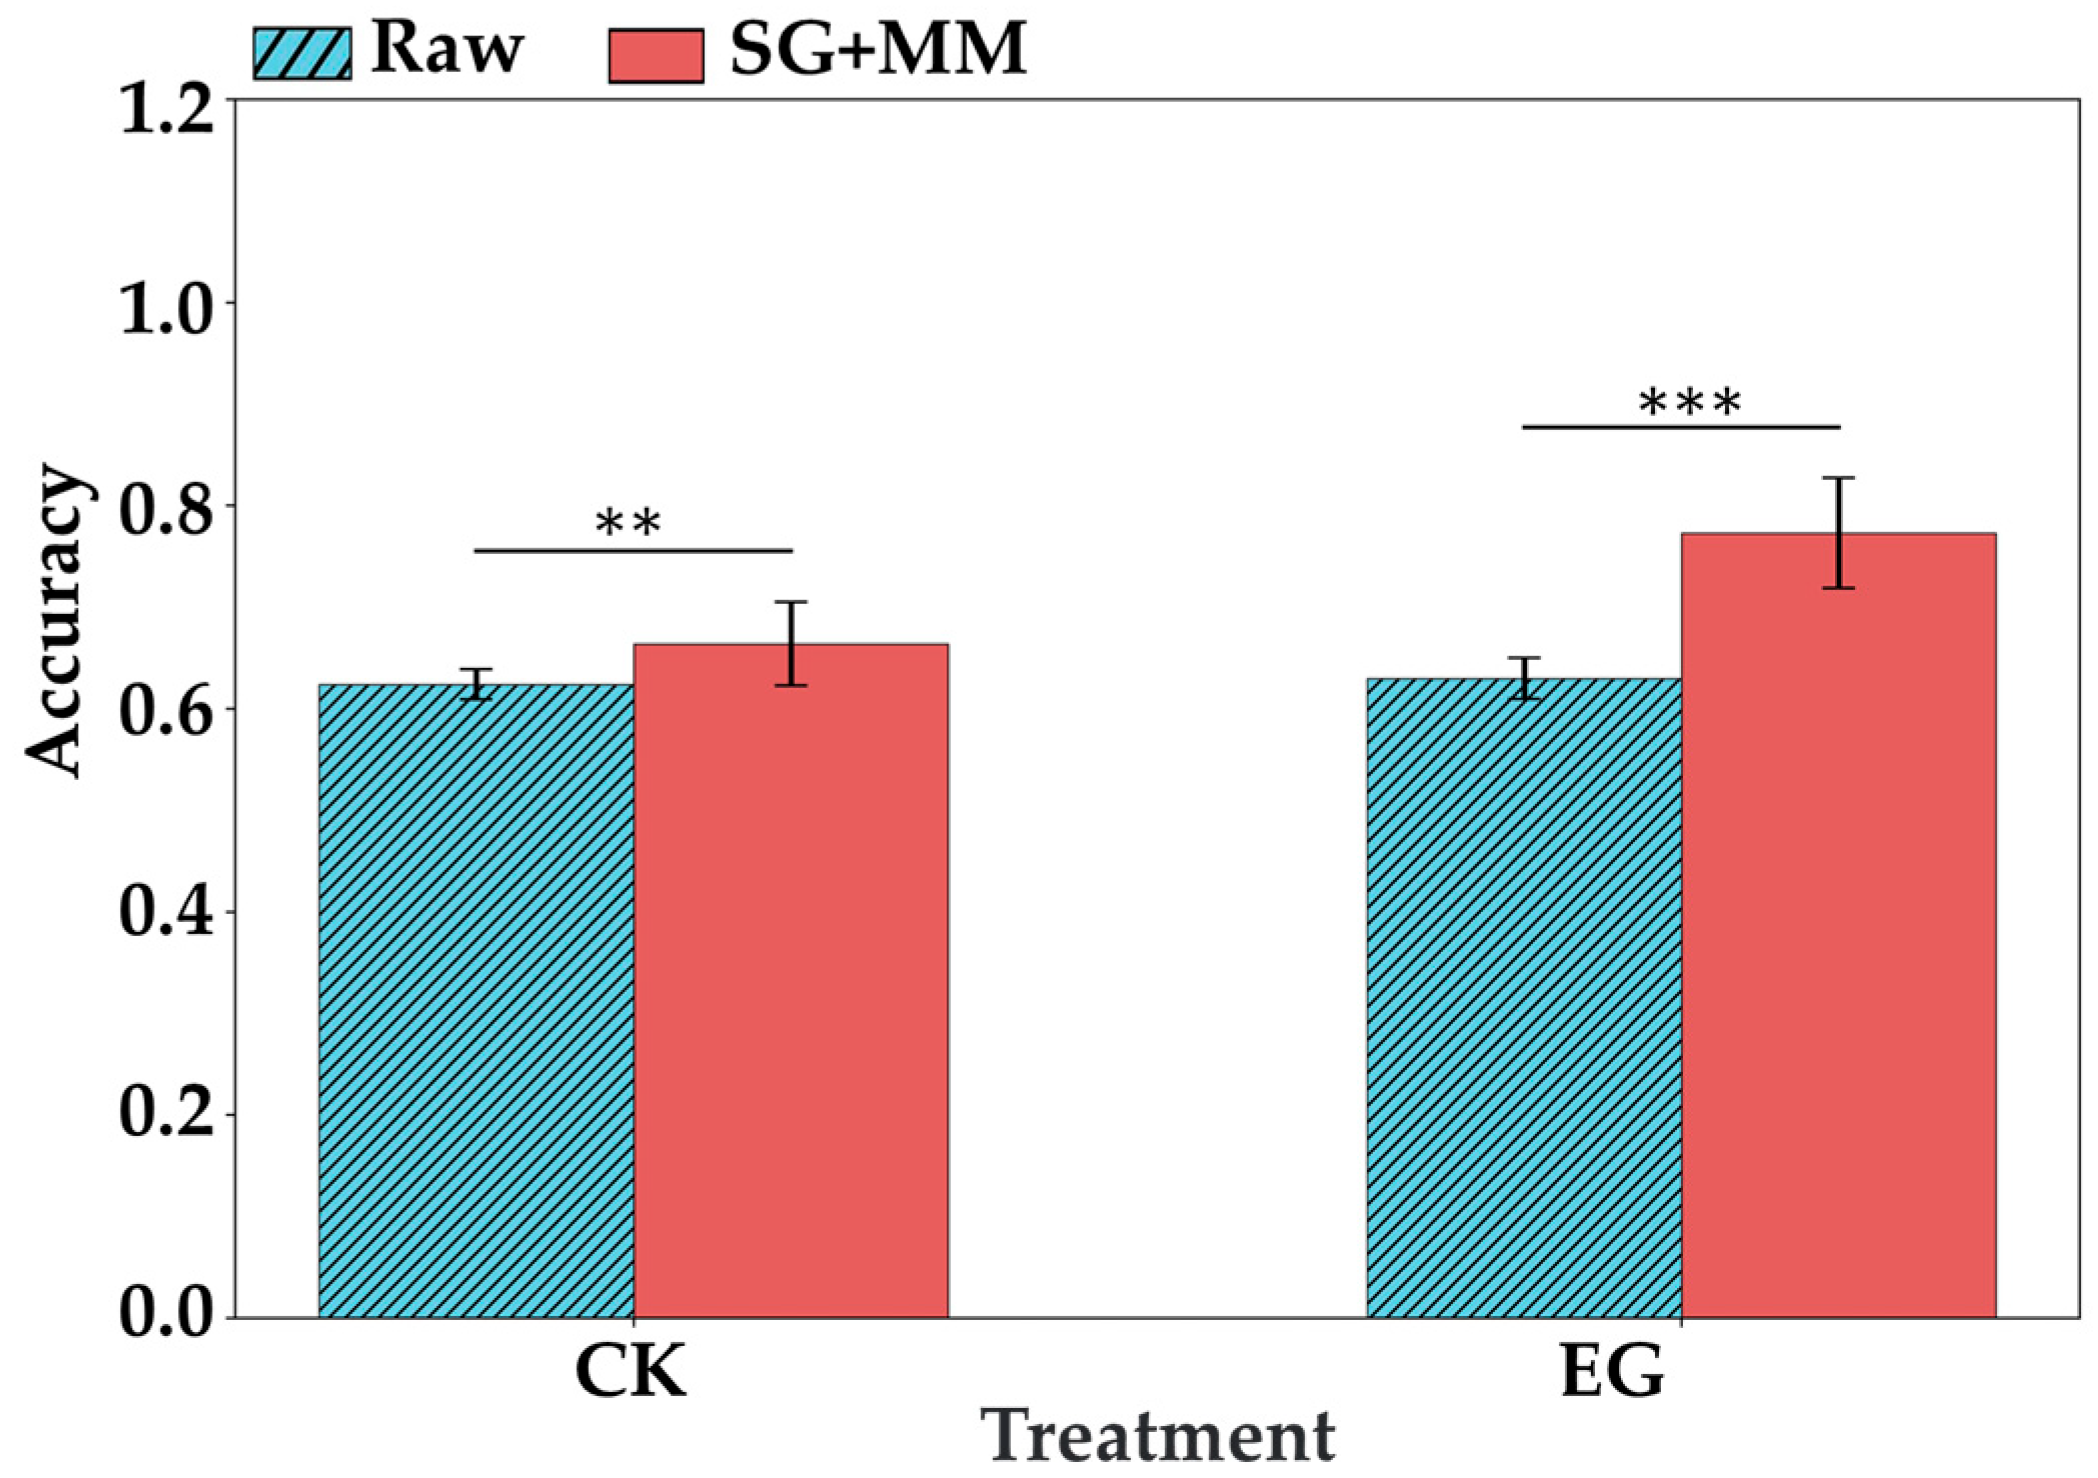
For both the CK group and the EG treatment group, this study further used spectral data to distinguish between different time points (Figure 10 and Figure 11). In terms of classification performance, the spectra of the CK group also exhibited daily variation. Without preprocessing, the model’s ability to differentiate between days in the CK group was comparable to that of the EG group. However, after applying SG + MM preprocessing, the spectral differentiation of time points in the EG group significantly outperformed that of the CK group, with a maximum classification accuracy of 0.773 (Table 5). This can be attributed to daily environmental fluctuations, which imposed a certain degree of stress on all tea plants, leading to changes in internal metabolite levels and, consequently, spectral variation in the CK group. In addition, natural leaf development can also lead to changes in leaf spectral properties. Wu et al. reported that leaf age significantly affects canopy spectral characteristics in evergreen Chinese fir forests, highlighting notable differences in near-infrared reflectance and transmittance between newly emerged and mature leaves [31]. Similarly, Richardson et al. found that MIR spectral differences among species became more pronounced and distinct as leaves matured [32]. Therefore, the natural growth of tea leaves may also contribute to the spectral variation observed in the CK group. In contrast, tea plants in the EG group were subjected to additional herbivory stress from tea geometrids. This additional stress likely induced more substantial metabolic changes, which in turn enabled more accurate spectral discrimination across different time points in the EG group, as reflected in the results shown in Figure 10 and Figure 11. These findings further demonstrate the significant potential of VIS-NIRS for distinguishing herbivory-induced temporal changes in field conditions.
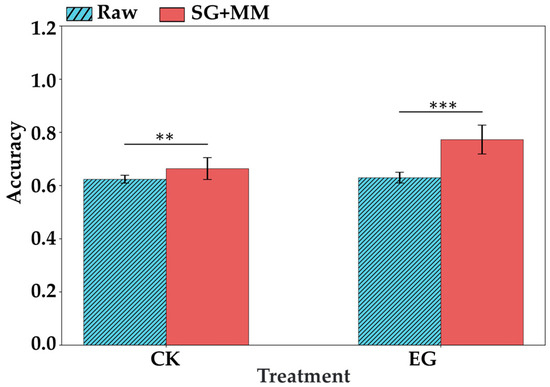
Figure 10.
ASD spectra combined with spectral preprocessing were used to distinguish the accuracy of CK group and EG group at different times. The length of the error bar indicates the standard deviation. ** indicates p < 0.01, and *** indicates p < 0.001 based on t-test results.
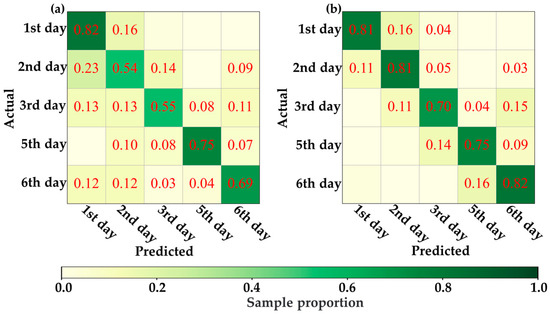
Figure 11.
Confusion matrix of the best model for distinguishing time based on ASD spectral data. (a) CK group and (b) EG treatment.
Table 5.
ASD spectra combined with spectral preprocessing were used to distinguish the accuracy of CK group and EG group at different times.
3.5. Analysis and Utilization of Feature Bands Based on Metabolomics
In the metabolomic analysis of tea leaf samples collected on the final day, 49 significantly different metabolites were identified (Table 2), which were mainly distributed across 16 distinct metabolite categories. This study selected the top five categories containing the highest number of differential metabolites and, based on existing literature, analyzed their characteristic absorption bands in the mid-infrared region. These bands were then used to roughly estimate the corresponding overtone and combination bands within the VIS-NIRS range. The resulting spectral regions were selected as characteristic bands for identifying tea leaves subjected to tea geometrid herbivory.
The analysis revealed that the metabolite categories with the most notable differences were free fatty acids, phenolic acids, flavonols, triterpenes, and organic acids (Table 6). The free fatty acids category contained nine significantly different characteristic metabolites. The characteristic peaks for these metabolites were primarily composed of a strong absorption peak at 1743 cm−1 (C=O stretching vibration) [33], a characteristic peak at 1465 cm−1 (CH2/CH3 scissoring bending vibration) [34], and a peak at 1160 cm−1 (C-O stretching and C-H bending vibrations) [33].
Table 6.
The characteristic bands corresponding to the important metabolite categories and their attribution.
The phenolic acids category included six significantly different characteristic metabolites. Their characteristic peaks in the 1625–1430 cm−1 range primarily originate from the C=C stretching vibrations of aromatic six-membered rings, with the strongest peaks typically observed around 1500 cm−1 [35]. Additionally, symmetric single C-H deformation vibrations generate peaks in the 1470–1435 cm−1 range [36]. The carbonyl (C=O) stretching of protonated carboxylic acids results in characteristic peaks between 1740–1705 cm−1 [37].
The flavonols category included five significantly different characteristic metabolites. Flavonoids generally contain one or more ether functional groups. The C-O stretching vibrations of aromatic ethers occur between 1310–1230 cm−1 [35,38]. Moreover, C-O-C pyranose ring stretching vibrations contribute to a characteristic peak near 1160 cm−1 [39]. The γ-pyrone moiety exhibits specific absorption bands due to combined C=O and C=C stretching vibrations, which appear around 1570–1540 cm−1, 1535–1525 cm−1, 1465–1445 cm−1, and 1420–1400 cm−1 [36].
The triterpenes category included five significantly different characteristic metabolites. Key absorption bands include those between 1788–1633 cm−1, especially at 1735 cm−1 due to C=O stretching vibrations [40]; additional characteristic peaks appear at 1093, 1043, and 900 cm−1, attributed to C-H bending vibrations [41], and a broad absorption band between 3550–3250 cm−1 arises from O-H stretching vibrations [41].
The organic acids category included four significantly different characteristic metabolites. Their main spectral features are found in the ranges of 1200–900 cm−1 (C-H stretching vibrations), 1500–1200 cm−1 (C-O stretching vibrations) [42], and 3300–2500 cm−1 due to O-H stretching [43].
After determining the mid-infrared spectral ranges associated with metabolites significantly altered by tea geometrid herbivory, this study calculated the corresponding overtone and combination bands within the 350–2500 nm region of the ASD spectrum. Considering that the actual position of the general frequency will be slightly lower than the theoretical value due to anharmonicity [44], this study calculated the overtone and combination bands using the following equations:
Table 7 presents the calculated overtone band results. The fundamental vibrational wavenumber range for C-containing bonds spans from 1788 to 900 cm−1, while that for O-H bonds lies within the 3500–2500 cm−1 range. Based on Equations (1)–(3), the corresponding overtone wavelength ranges were calculated, ensuring all fall within the spectrometer’s detection range of 350–2500 nm. As a result, the near-infrared overtone band range corresponding to the significantly altered metabolites was determined to be 840–2500 nm, covering nearly the entire near-infrared region, but excluding the visible spectrum.
Table 7.
The calculation result of the overtone signal.
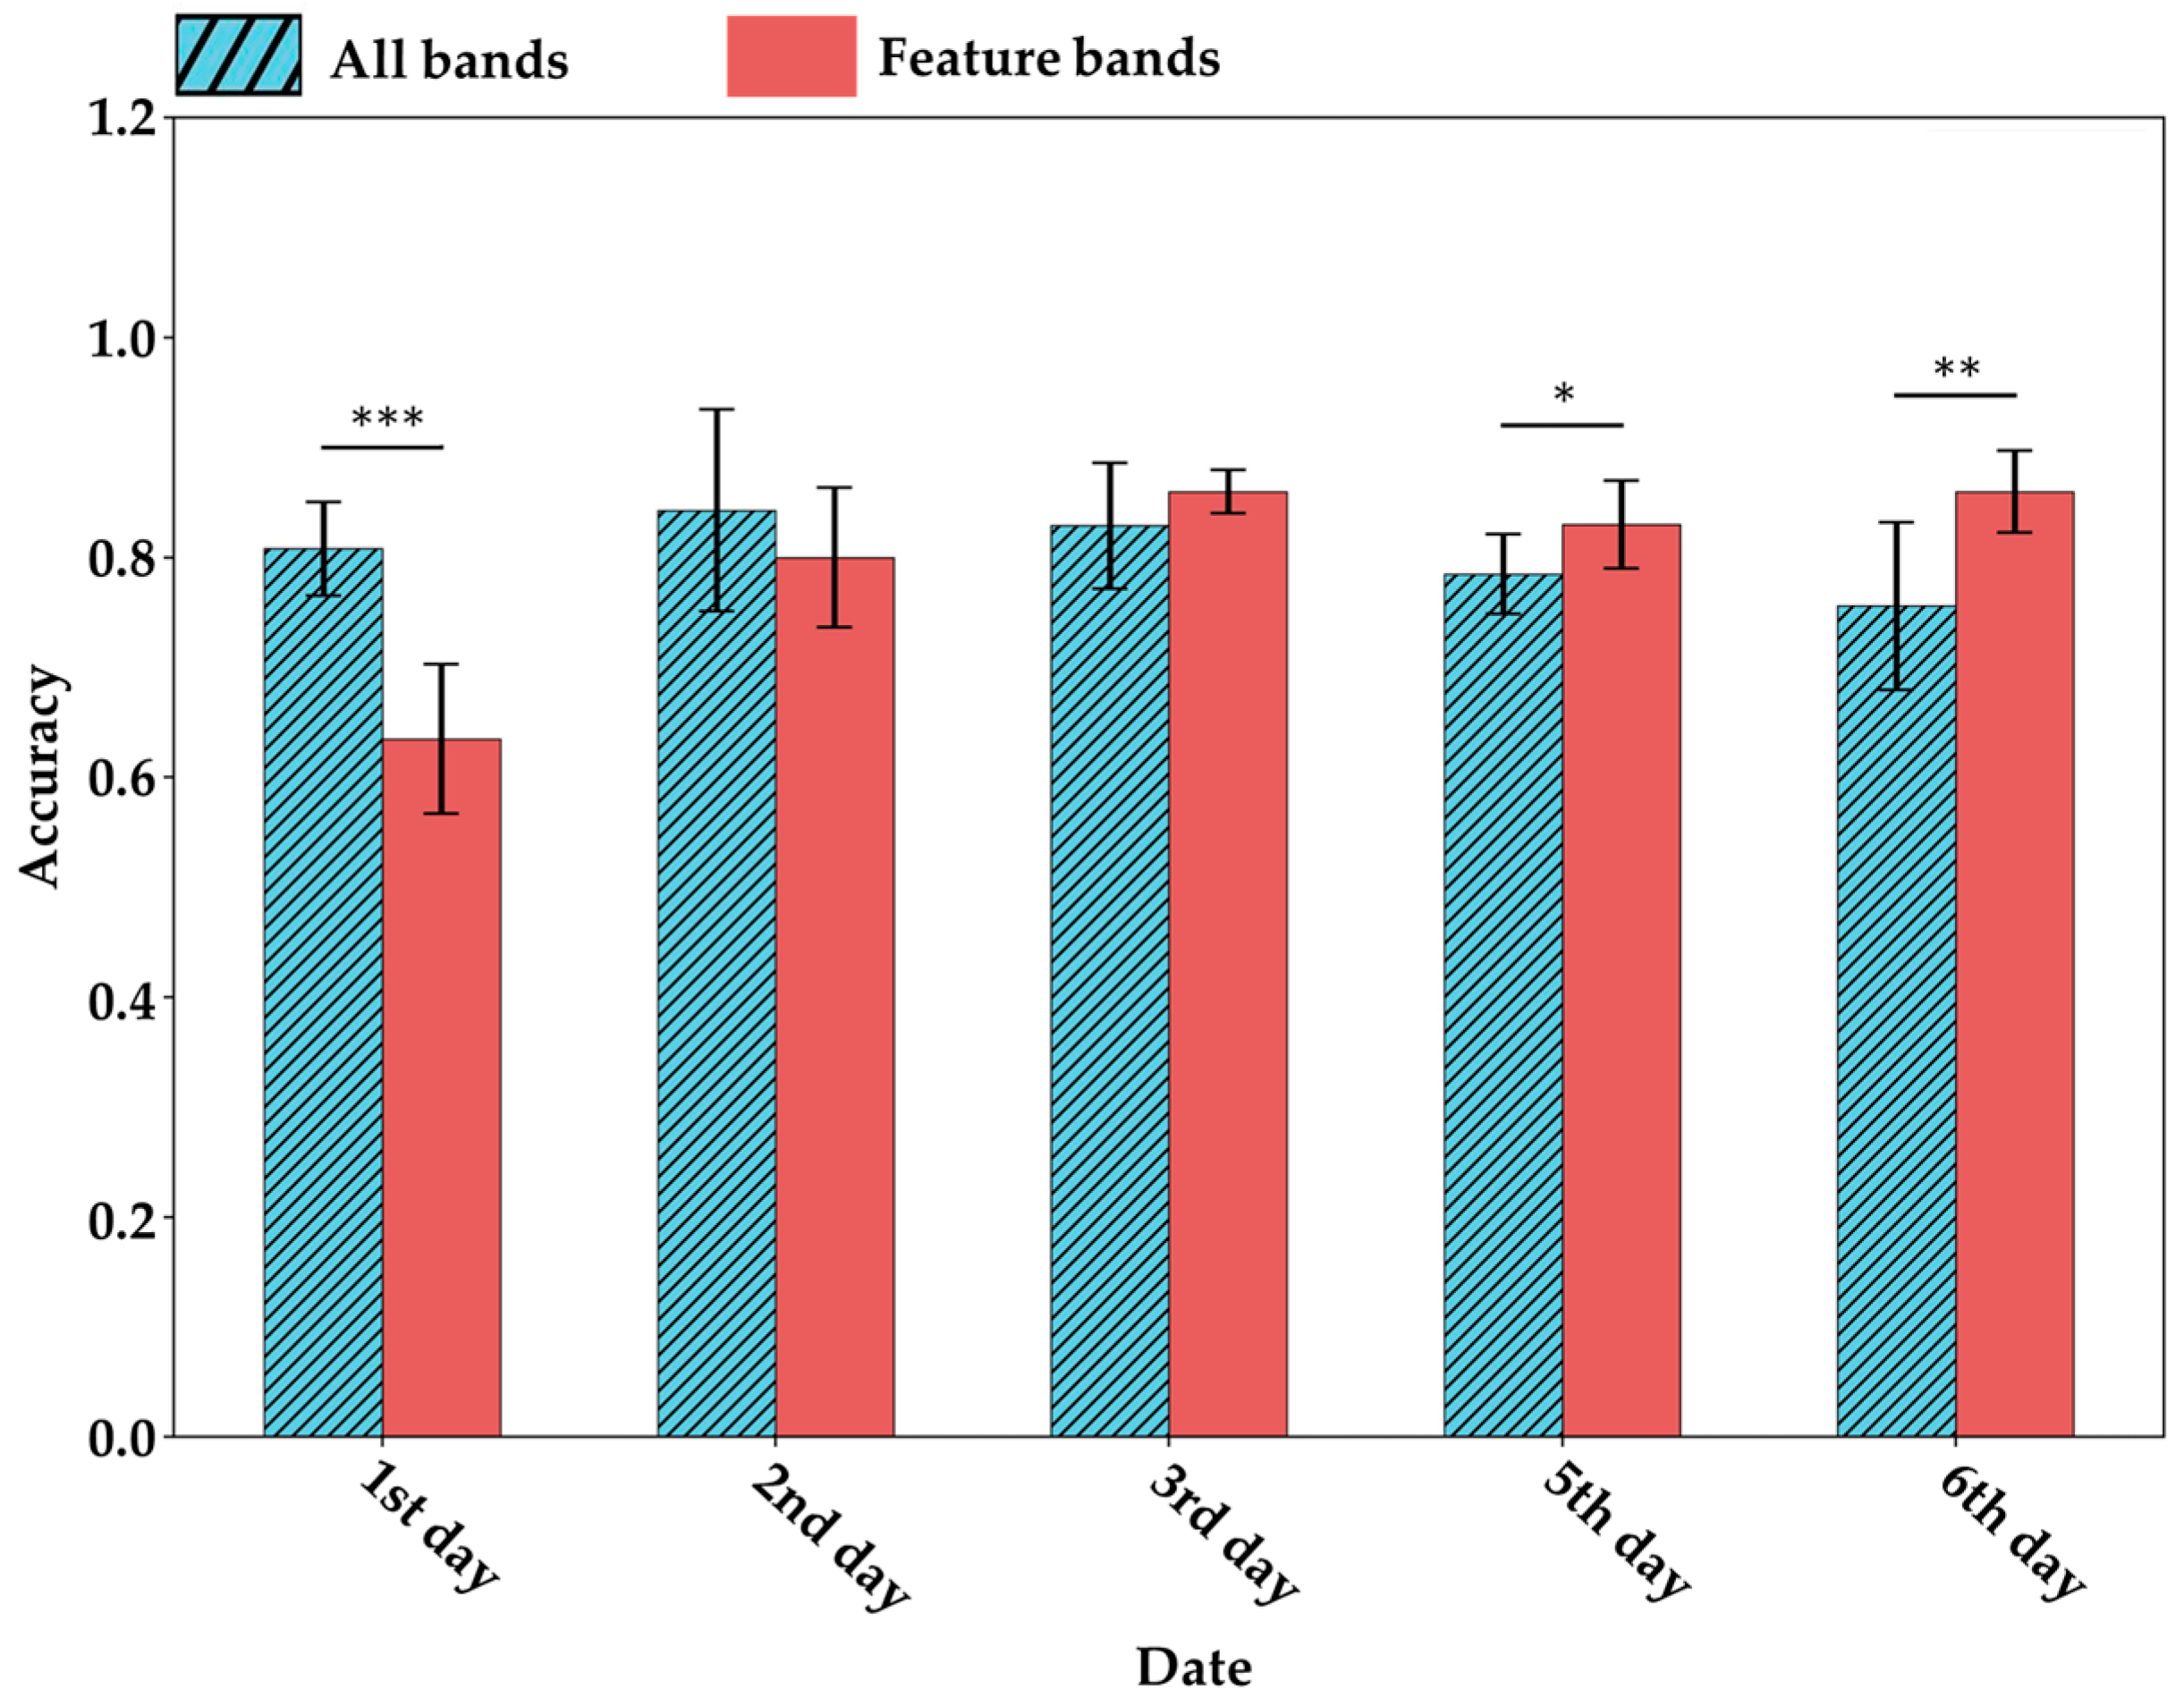
To validate the effectiveness of the extracted characteristic bands in identifying tea geometrid herbivory, this study compared the performance of full-spectrum data versus the characteristic bands in classifying herbivore-damaged leaves (Figure 12). The results showed that, over time, the characteristic bands provided stronger discriminatory power for detecting herbivory. On the third day, the classification accuracy using characteristic bands surpassed the average accuracy achieved using the full spectrum. In the following days, the performance of the full-spectrum approach declined progressively, while the classification accuracy based on characteristic bands remained stable. By the final day, the average accuracy using characteristic bands exceeded that of the full spectrum by more than 10%. This trend indicates that the closer the spectral data were collected to the metabolomics sampling time, the more informative the metabolomics-derived characteristic spectral bands became for detecting tea geometrid herbivory. Notably, the characteristic bands calculated in this study reflect metabolite concentration changes that were significantly induced by herbivory. Since these herbivory-driven metabolic changes accumulate over time, the detection ability of the characteristic bands correspondingly increases with time.
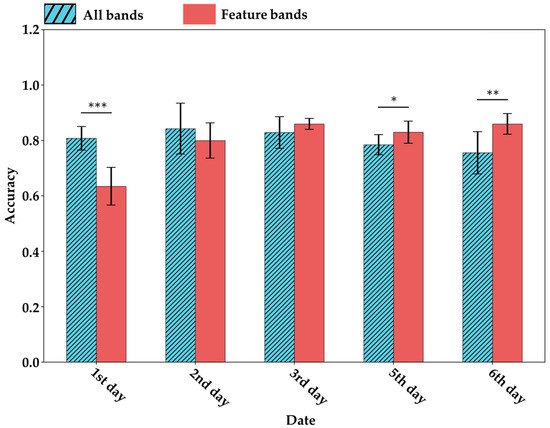
Figure 12.
Under the selection of feature bands, the average accuracy (bar) and standard deviation (error bar) of the valid set for distinguishing CK and EG at the same time. * indicates p < 0.05, ** indicates p < 0.01, and *** indicates p < 0.001 based on t-test results.
Based on metabolomic data, this section demonstrated that the VIS-NIRS signals corresponding to metabolites significantly altered by tea geometrid herbivory are more effective in identifying herbivore-damaged leaves. This finding provides mechanistic evidence for the use of VIS-NIRS in detecting tea geometrid stress and establishes a solid theoretical and practical foundation for its further application in field-based pest detection.
4. Conclusions
This study integrated metabolomics to investigate the capability and underlying mechanisms of visible-near-infrared spectroscopy (VIS-NIRS, 400–2500 nm) in detecting tea geometrid herbivory stress under field conditions. The results demonstrated that a PCA-based linear dimensionality reduction of metabolomic data from herbivore-fed leaves was sufficient to distinguish tea geometrid herbivory at different density gradients. Furthermore, this study showed that VIS-NIRS could effectively differentiate between leaves subjected to tea geometrid feeding and healthy leaves. By screening classification models and preprocessing methods, it was found that the combination of the PLSDA classifier and SG + MM preprocessing most effectively captured herbivory-induced spectral features. VIS-NIRS successfully identified herbivore-damaged leaves, achieving an optimal average classification accuracy of 0.857. Moreover, VIS-NIRS was able to differentiate leaves subjected to herbivory on different days. The application of appropriate preprocessing techniques significantly enhanced temporal classification, achieving the highest average classification accuracy of 0.773. Based on metabolomic analysis, 49 shared differential metabolites were identified across the three EG treatment groups (EG_20, EG_40, EG_80) compared to the CK group. These metabolites were either consistently upregulated or downregulated and have been reported to play critical roles in plant insect-resistance mechanisms. According to the fundamental vibrational spectra of these metabolites, their corresponding overtone bands were found to fall within the 840–2500 nm range, which more accurately identified leaves subjected to prolonged herbivory. Compared to using the full spectrum, models built within this wavelength range achieved up to a 10% improvement in classification accuracy. This study not only demonstrated the potential of VIS-NIRS for field-based detection of tea geometrid herbivory stress but also revealed its mechanistic foundation through metabolomic integration. The findings provide a strong theoretical foundation and technical support for developing portable, field-based VIS-NIRS monitoring systems for real-time detection of insect stress in tea plantations. In future studies, the practical field applicability of portable spectroscopic devices—such as multispectral UAVs—can be further explored. Additionally, a digital twin system for tea plantation pest management can be developed, integrating data from both UAVs and ASD spectrometers. This system would facilitate the construction of spatiotemporal distribution maps of pest activity, thereby enabling more informed, precise, and effective management of tea plantations.
Author Contributions
X.L. (Xuelun Luo): Conceptualization, Investigation, Methodology, Data curation, Writing—original draft, Writing—review and editing, Software, Validation, Formal analysis, Visualization. W.Z.: Validation, Data curation, Writing—review and editing. Z.H.: Validation, Data curation, Writing—review and editing. Y.H.: Conceptualization, Validation, Writing—review and editing. J.Z.: Conceptualization, Data curation, Supervision, Formal analysis, Validation, Writing—review and editing. X.L. (Xiaoli Li): Conceptualization, Supervision, Formal analysis, Validation, Writing—review and editing. All authors have read and agreed to the published version of the manuscript.
Funding
This research work was funded by the Key R&D Projects in Zhejiang Province (Project No: 2022C02044, 2023C02043, 2023C02009) and the National Natural Science Foundation of China (Project No: 32171889).
Institutional Review Board Statement
Not applicable.
Data Availability Statement
The raw data supporting the conclusions of this article will be made available by the authors on request.
Acknowledgments
This research work was supported by the Key R&D Projects in Zhejiang Province (Project No: 2022C02044, 2023C02043, 2023C02009) and the National Natural Science Foundation of China (Project No: 32171889).
Conflicts of Interest
The authors declare no conflicts of interest.
References
- Jin, J.Q.; Qu, F.R.; Huang, H.S.; Liu, Q.S.; Wei, M.Y.; Zhou, Y.; Huang, K.L.; Cui, Z.B.; Chen, J.D.; Dai, W.D.; et al. Characterization of two O-methyltransferases involved in the biosynthesis of O-methylated catechins in tea plant. Nat. Commun. 2023, 14, 5075. [Google Scholar] [CrossRef] [PubMed]
- Pan, Y.J.; Fang, G.Q.; Wang, Z.B.; Cao, Y.H.; Liu, Y.J.; Li, G.Y.; Liu, X.J.; Xiao, Q.; Zhan, S. Chromosome-level genome reference and genome editing of the tea geometrid. Mol. Ecol. Resour. 2021, 21, 2034–2049. [Google Scholar] [CrossRef] [PubMed]
- Cai, X.M.; Sun, X.L.; Dong, W.X.; Wang, G.C.; Chen, Z.M. Herbivore species, infestation time, and herbivore density affect induced volatiles in tea plants. Chemoecology 2014, 24, 1–14. [Google Scholar] [CrossRef]
- Yao, H.M.; Zhou, X.G. Analysis of the causes of the outbreak of tea inchworm in autumn 2016 and its prevention and control implications. China Tea 2016, 38, 21–22. [Google Scholar]
- Lou, S.; Zhang, B.R.; Zhang, D.H. Foresight from the hometown of green tea in China: Tea farmers’ adoption of pro-green control technology for tea plant pests. J. Clean. Prod. 2021, 320, 128817. [Google Scholar] [CrossRef]
- Javaid, S.; Naz, S.; Amin, I.; Jander, G.; Ul-Haq, Z.; Mansoor, S. Computational and biological characterization of fusion proteins of two insecticidal proteins for control of insect pests. Sci. Rep. 2018, 8, 4837. [Google Scholar] [CrossRef]
- Sial, M.U.; Zhao, Z.Z.; Zhang, L.; Zhang, Y.N.; Mao, L.G.; Jiang, H.Y. Evaluation of insecticides induced hormesis on the demographic parameters of Myzus persicae and expression changes of metabolic resistance detoxification genes. Sci. Rep. 2018, 8, 16601. [Google Scholar] [CrossRef]
- Ghamari, M.J.; Homayoonzadeh, M.; Allahyari, H.; Talebi, K. Acaricidal activity of Shirazian thyme and rosemary methanolic extracts in combination with spirodiclofen and propargite on Tetranychus urticae (Acari: Tetranychidae). Persian J. Acarol. 2021, 10, 481–489. [Google Scholar] [CrossRef]
- Coatsworth, P.; Gonzalez-Macia, L.; Collins, A.S.P.; Bozkurt, T.; Güder, F. Continuous monitoring of chemical signals in plants under stress. Nat. Rev. Chem. 2023, 7, 7–25. [Google Scholar] [CrossRef]
- Kong, C.H.; Zhang, S.Z.; Li, Y.H.; Xia, Z.C.; Yang, X.F.; Meiners, S.J.; Wang, P. Plant neighbor detection and allelochemical response are driven by root-secreted signaling chemicals. Nat. Commun. 2018, 9, 3867. [Google Scholar] [CrossRef]
- Armstrong, P.; Maghirang, E.; Ozulu, M. Determining damage levels in wheat caused by Sunn pest (Eurygaster integriceps) using visible and near-infrared spectroscopy. J. Cereal Sci. 2019, 86, 102–107. [Google Scholar] [CrossRef]
- Aziz, N.; Omar, W.; Kassim, R.; Kamarudin, N. Remote sensing measurement for detection of bagworm infestation in oil palm plantation. MPOB Inf. Ser. 2012, 589, 597. [Google Scholar]
- Huang, M.; Wan, X.M.; Zhang, M.; Zhu, Q.B. Detection of insect-damaged vegetable soybeans using hyperspectral transmittance image. J. Food Eng. 2013, 116, 45–49. [Google Scholar] [CrossRef]
- Aeberli, A.; Robson, A.; Phinn, S.; Lamb, D.W.; Johansen, K. A comparison of analytical approaches for the spectral discrimination and characterisation of mite infestations on banana plants. Remote Sens. 2022, 14, 5467. [Google Scholar] [CrossRef]
- Fu, H.; Zhao, H.; Song, R.; Yang, Y.; Li, Z.; Zhang, S. Cotton aphid infestation monitoring using Sentinel-2 MSI imagery coupled with derivative of ratio spectroscopy and random forest algorithm. Front. Plant Sci. 2022, 13, 1029529. [Google Scholar] [CrossRef]
- Xu, Z.; Zhang, Q.; Xiang, S.; Li, Y.; Huang, X.; Zhang, Y.; Zhou, X.; Li, Z.; Yao, X.; Li, Q. Monitoring the severity of Pantana phyllostachysae Chao infestation in Moso bamboo forests based on UAV multi-spectral remote sensing feature selection. Forests 2022, 13, 418. [Google Scholar] [CrossRef]
- Burnett, A.C.; Serbin, S.P.; Davidson, K.J.; Ely, K.S.; Rogers, A. Detection of the metabolic response to drought stress using hyperspectral reflectance. J. Exp. Bot. 2021, 72, 6474–6489. [Google Scholar] [CrossRef] [PubMed]
- Mishra, P.; Passos, D.; Marini, F.; Xu, J.L.; Amigo, J.M.; Gowen, A.A.; Jansen, J.J.; Biancolillo, A.; Roger, J.M.; Rutledge, D.N.; et al. Deep learning for near-infrared spectral data modelling: Hypes and benefits. TrAC-Trend. Anal. Chem. 2022, 157, 116804. [Google Scholar] [CrossRef]
- Agustika, D.K.; Mercuriani, I.; Purnomo, C.W.; Hartono, S.; Triyana, K.; Iliescu, D.D.; Leeson, M.S. Fourier transform infrared spectrum pre-processing technique selection for detecting PYLCV-infected chilli plants. Soectrochim Acta. A 2022, 278, 121339. [Google Scholar] [CrossRef]
- Sun, W.C.; Liu, S.; Zhang, X.; Li, Y. Estimation of soil organic matter content using selected spectral subset of hyperspectral data. Geoderma 2022, 409, 115653. [Google Scholar] [CrossRef]
- Xiao, Q.; Tang, W.; Zhang, C.; Zhou, L.; Feng, L.; Shen, J.; Yan, T.; Gao, P.; He, Y.; Wu, N. Spectral preprocessing combined with deep transfer learning to evaluate Chlorophyll content in cotton leaves. Plant Phenomics 2022, 2022, 9813841. [Google Scholar] [CrossRef]
- Bava, R.; Castagna, F.; Palma, E.; Marrelli, M.; Conforti, F.; Musolino, V.; Carresi, C.; Lupia, C.; Ceniti, C.; Tilocca, B. Essential oils for a sustainable control of honeybee varroosis. Vet. Sci. 2023, 10, 308. [Google Scholar] [CrossRef] [PubMed]
- Feng, Z.; Zhen, C.Y.; Bo, Y.K.; Li, Y.H.; Zhu, F. Research progress on Plant responses to drought and herbivorous insects based on transcriptome and metabolome. Chin. J. Eco-Agric. 2024, 32, 369–379. [Google Scholar]
- Mithöfer, A.; Boland, W. Plant defense against herbivores: Chemical aspects. Annu. Rev. Plant Biol. 2012, 63, 431–450. [Google Scholar] [CrossRef]
- Ye, Y.; Xia, C.; Hu, H.; Tang, S.; Huan, H. Metabolomics reveals altered metabolites in cirrhotic patients with severe portal hypertension in Tibetan population. Front. Med. 2024, 11, 1404442. [Google Scholar] [CrossRef]
- Jing, T.; Qian, X.; Du, W.; Gao, T.; Li, D.; Guo, D.; He, F.; Yu, G.; Li, S.; Schwab, W. Herbivore-induced volatiles influence moth preference by increasing the β-ocimene emission of neighbouring tea plants. Plant Cell Environ. 2021, 44, 3667–3680. [Google Scholar] [CrossRef] [PubMed]
- Ramirez, R.A.; Eubanks, M.D. Herbivore density mediates the indirect effect of herbivores on plants via induced resistance and apparent competition. Ecosphere 2016, 7, e01218. [Google Scholar] [CrossRef]
- Crisp, P.A.; Ganguly, D.R.; Smith, A.B.; Murray, K.D.; Estavillo, G.M.; Searle, I.; Ford, E.; Bogdanović, O.; Lister, R.; Borevitz, J.O. Rapid recovery gene downregulation during excess-light stress and recovery in Arabidopsis. Plant Cell 2017, 29, 1836–1863. [Google Scholar] [CrossRef]
- Sedaghatmehr, M.; Balazadeh, S. Autophagy: A key player in the recovery of plants from heat stress. J. Exp. Bot. 2024, 75, 2246–2255. [Google Scholar] [CrossRef]
- Bulut, M.; Karakas, E.; Fernie, A.R. Adjustments of plant primary metabolism in the face of climate change. J. Exp. Bot. 2025, eraf116. [Google Scholar] [CrossRef]
- Wu, Q.; Song, C.; Song, J.; Wang, J.; Chen, S.; Yu, B. Impacts of leaf age on canopy spectral signature variation in evergreen Chinese fir forests. Remote Sens. 2018, 10, 262. [Google Scholar] [CrossRef]
- Richardson, A.D.; Aubrecht, D.M.; Basler, D.; Hufkens, K.; Muir, C.D.; Hanssen, L. Developmental changes in the reflectance spectra of temperate deciduous tree leaves and implications for thermal emissivity and leaf temperature. New Phytol. 2021, 229, 791–804. [Google Scholar] [CrossRef] [PubMed]
- Arce, L.; Domínguez-Vidal, A.; Rodríguez-Estévez, V.; López-Vidal, S.; Ayora-Cañada, M.J.; Valcárcel, M. Feasibility study on the use of infrared spectroscopy for the direct authentication of Iberian pig fattening diet. Anal. Chim. Acta 2009, 636, 183–189. [Google Scholar] [CrossRef]
- Beriain, M.J.; Ibañez, F.C.; Beruete, E.; Gómez, I.; Beruete, M. Estimation of fatty acids in intramuscular fat of beef by FT-MIR spectroscopy. Foods 2021, 10, 155. [Google Scholar] [CrossRef]
- Socrates, G. Infrared Characteristic Group Frequencies: Tables and Charts; Wiley: Hoboken, NJ, USA, 1995. [Google Scholar]
- Abbas, O.; Compère, G.; Larondelle, Y.; Pompeu, D.; Rogez, H.; Baeten, V. Phenolic compound explorer: A mid-infrared spectroscopy database. Vib. Spectrosc. 2017, 92, 111–118. [Google Scholar] [CrossRef]
- Antolovich, M.; Li, X.; Robards, K. Detection of adulteration in Australian orange juices by stable carbon isotope ratio analysis (SCIRA). J. Agric. Food Chem. 2001, 49, 2626. [Google Scholar] [CrossRef]
- Nakanishi, K. Infrared Absorption Spectroscopy: Practical; Wiley: Hoboken, NJ, USA, 1962. [Google Scholar]
- Huang, A.; Zhou, Q.; Liu, J.; Fei, B.; Sun, S. Distinction of three wood species by Fourier transform infrared spectroscopy and two-dimensional correlation IR spectroscopy. J. Mol. Struct. 2008, 883–884, 160–166. [Google Scholar] [CrossRef]
- Cîntă-Pînzaru, S.; Dehelean, C.A.; Soica, C.; Culea, M.; Borcan, F. Evaluation and differentiation of the Betulaceae birch bark species and their bioactive triterpene content using analytical FT-vibrational spectroscopy and GC-MS. Chem. Cent. J. 2012, 6, 67. [Google Scholar] [CrossRef]
- Li, L.; Zhang, S.; Zuo, Z.T.; Wang, Y.Z. Data fusion of multiple-information strategy based on Fourier transform near infrared spectroscopy and Fourier-transform mid infrared for geographical traceability of Wolfiporia cocos combined with chemometrics. J. Chemom. 2022, 36, e3436. [Google Scholar] [CrossRef]
- Skoog, D.A.; Holler, F.J.; Crouch, S.R. Principles of Instrumental Analysis; Cengage Learn: Boston, MA, USA, 2019. [Google Scholar]
- Regmi, U.; Palma, M.; Barroso, C.G. Direct determination of organic acids in wine and wine-derived products by Fourier transform infrared (FT-IR) spectroscopy and chemometric techniques. Anal. Chim. Acta 2012, 732, 137–144. [Google Scholar] [CrossRef]
- Liu, Y.; Yang, F.; Wang, J. Ultrafast vibrational relaxation dynamics of C=O and C=C stretching modes of Ethyl acetoacetate in deuterated water and cyclohexane. Acta Chim. Sin. 2013, 71, 761. [Google Scholar] [CrossRef]


Disclaimer/Publisher’s Note: The statements, opinions and data contained in all publications are solely those of the individual author(s) and contributor(s) and not of MDPI and/or the editor(s). MDPI and/or the editor(s) disclaim responsibility for any injury to people or property resulting from any ideas, methods, instructions or products referred to in the content. |
© 2025 by the authors. Licensee MDPI, Basel, Switzerland. This article is an open access article distributed under the terms and conditions of the Creative Commons Attribution (CC BY) license (https://creativecommons.org/licenses/by/4.0/).