Article

Segmentation and Fractional Coverage Estimation of Soil, Illuminated Vegetation, and Shaded Vegetation in Corn Canopy Images Using CCSNet and UAV Remote Sensing

1
College of Information and Management Science, Henan Agricultural University, Zhengzhou 450002, China
2
School of Information Science and Technology, Beijing Forestry University, Beijing 100083, China
3
China Centre for Resources Satellite Data and Application, Beijing 100094, China
4
Key Laboratory of Quantitative Remote Sensing in Agriculture, Ministry of Agriculture and Rural Affairs, Information Technology Research Center, Beijing Academy of Agriculture and Forestry Sciences, Beijing 100097, China
5
College of Agriculture, Nanjing Agricultural University, Nanjing 210095, China
6
Key Lab of Smart Agriculture System, Ministry of Education, China Agricultural University, Beijing 100083, China
*
Authors to whom correspondence should be addressed.
These authors contributed equally to this work.
Agriculture 2025, 15(12), 1309; https://doi.org/10.3390/agriculture15121309
Submission received: 30 April 2025 / Revised: 31 May 2025 / Accepted: 15 June 2025 / Published: 18 June 2025
(This article belongs to the Special Issue Research Advances in Perception for Agricultural Robots)

Abstract

:
The accurate estimation of corn canopy structure and light conditions is essential for effective crop management and informed variety selection. This study introduces CCSNet, a deep learning-based semantic segmentation model specifically developed to extract fractional coverages of soil, illuminated vegetation, and shaded vegetation from high-resolution corn canopy images acquired by UAVs. CCSNet improves segmentation accuracy by employing multi-level feature fusion and pyramid pooling to effectively capture multi-scale contextual information. The model was evaluated using Pixel Accuracy (PA), mean Intersection over Union (mIoU), and Recall, and was benchmarked against U-Net, PSPNet and UNetFormer. On the test set, CCSNet utilizing a ResNet50 backbone achieved the highest accuracy, with an mIoU of 86.42% and a PA of 93.58%. In addition, its estimation of fractional coverage for key canopy components yielded a root mean squared error (RMSE) ranging from 3.16% to 5.02%. Compared to lightweight backbones (e.g., MobileNetV2), CCSNet exhibited superior generalization performance when integrated with deeper backbones. These results highlight CCSNet’s capability to deliver high-precision segmentation and reliable phenotypic measurements. This provides valuable insights for breeders to evaluate light-use efficiency and facilitates intelligent decision-making in precision agriculture.

1. Introduction

As a staple crop, corn makes a substantial contribution to global nutrition by providing carbohydrates, proteins, and essential micronutrients, while its derivatives serve as vital components in animal feed production [1,2,3,4]. The spatial distribution of shaded and sunlit vegetation within the canopy offers valuable insights into light availability and canopy architectural traits, both of which influence photosynthetic activity [5,6]. The segmentation results and fractional coverage estimates of soil, illuminated vegetation, and shaded vegetation provide essential baseline data for evaluating corn growth, canopy structure, and yield prediction [7,8,9]. Therefore, a comprehensive understanding of corn canopy structure and light conditions is essential for effective agricultural management and for assisting breeders in selecting high-yielding varieties [10,11,12,13].
Accurate phenotypic analysis, particularly of light-related traits, such as vegetation indices (VIs), derived from canopy structure and light distribution, serves as a cornerstone in modern crop breeding. These traits provide indirect yet effective indicators of photosynthetic efficiency, biomass accumulation, and stress resilience. By quantifying the spatial distribution of sunlit and shaded canopy components, breeders can evaluate the genetic potential of corn varieties in terms of light-use efficiency and yield stability under field conditions [14]. Classical segmentation approaches—including threshold-based partitioning, clustering algorithms, region-growing strategies, and edge detection methods—remain widely used in the existing studies [15,16,17,18]. These conventional methods typically rely on the manual extraction of image attributes, such as grayscale intensity, chromatic information, textural features, and spatial–geometric properties. By amplifying the differences between foreground and background regions based on these attributes, the target objects can be effectively separated [19,20,21]. As a fundamental segmentation technique, thresholding separates foreground and background regions by differentiating pixel grayscale values [22]. The Otsu algorithm is a classic example that automatically determines the optimal threshold by maximizing the between-class variance. Although simple and computationally efficient, this method performs poorly on images affected by noise and non-uniform grayscale distribution [23].
Clustering algorithms, including Gaussian Mixture Models (GMMs) and K-means, are widely used. K-means iteratively refines centroids by assigning pixels to their nearest clusters [24]. A GMM models data as a mixture of Gaussians and employs the Expectation–Maximization (EM) algorithm for parameter estimation [25]. Both methods are sensitive to initialization and computationally intensive in high-dimensional spaces. Region growing and splitting–merging are typical region-based segmentation methods. Region growing starts from seed points and merges adjacent pixels based on similarity. Splitting–merging recursively divides the image and merges similar regions. These methods are effective for connected regions but sensitive to parameter selection [17].
The advancement of computational hardware has accelerated the integration of deep learning into image classification and segmentation. A milestone was the success of AlexNet in the ImageNet challenge, which spurred the widespread adoption of CNNs [26]. This led to the development of Fully Convolutional Networks (FCNs), which replaced fully connected layers with convolutional ones to enable pixel-level predictions [27]. U-Net further enhanced segmentation performance with its encoder–decoder structure and skip connections, proving highly effective in biomedical applications [28]. More advanced models, such as the DeepLab series, incorporated atrous convolution and conditional random fields to improve accuracy [29,30], with PSPNet leveraging atrous spatial pyramid pooling (ASPP) for multi-scale context aggregation [31].
However, these deep learning methods often lack the close integration of contextual semantic information at different scales, leading to segmentation accuracy that does not meet the requirements for precise phenotypic extraction [31]. Particularly, in agricultural applications, the complex occlusion of leaves and the impact of sunlight angles often result in lower segmentation accuracy for crop objects than natural or artificial scenes [32,33]. Recent advancements in attention mechanisms and self-attention architectures, exemplified by Transformers, have propelled progress in image segmentation methodologies [34,35]. Wang et al. proposed Non-local Neural Networks, which significantly improved performance by computing global feature associations [36]. Further innovations, such as UNetFormer and PSPNet [31], integrate self-attention operations to simultaneously elevate segmentation precision and adaptability across diverse scenarios [37]. While deeper convolutional layers enhance feature extraction, they also increase computational demands and deployment constraints [38,39]. Most current methods emphasize high-level features while often overlooking low-level details essential for fine-grained information. This imbalance can impair performance in areas with complex textures or unclear boundaries [40]. Corn canopy imagery poses distinct challenges due to leaf occlusion and dynamic lighting, leading to heterogeneous distributions of soil, sunlit, and shaded vegetation. Thus, canopy segmentation frameworks should prioritize (i) harmonizing hierarchical features and (ii) integrating multi-scale context to ensure robust coverage estimation.
This study focuses on developing methods for segmenting and extracting fractional coverages of soil, illuminated vegetation, and shaded vegetation in high-resolution digital images of corn canopies captured by unmanned aerial vehicles (UAVs). To address these challenges, we propose CCSNet, a corn canopy segmentation network designed to improve segmentation performance in UAV-acquired imagery. The system operates by simultaneously extracting and merging features across different network depths, enhanced by a multi-receptive–field pooling structure that captures contextual information at varying scales. This study conducted a comprehensive evaluation of deep learning architectures for corn canopy analysis, benchmarking the proposed CCSNet against established models (U-Net, PSPNet, and UNetFormer) in both semantic segmentation and fractional coverage estimation tasks. The experimental results demonstrate that CCSNet’s novel architecture—combining shallow feature retention with pyramid pooling—achieves a superior performance in discriminating soil, sunlit vegetation, and shadowed canopy components.

2. Materials and Methods

2.1. Study Area and Experimental Design

The study area is located in the corn-breeding experimental field operated by Henan Jinyuan Seed Industry Co., Ltd., situated in Xingyang City, Zhengzhou, Henan Province (34°36′–34°59′ N, 113°7′–113°30′ E). The region, characterized by a temperate, continental, monsoon climate, experiences an average annual temperature of 14.3 °C, annual precipitation of 645.5 mm, and approximately 2367.7 h of sunshine per year. The dominant cropping system is a wheat–corn rotation: the wheat cultivation cycle spans from sowing in late October to harvesting in mid-June in the following year, while corn is planted in late June and harvested in October. Data were collected over two days: on 10 August 2024, corn canopy images were acquired from 30 planting plots (independent validation dataset, IVD), and on 30 August 2024, images were collected from 40 plots (training and validation dataset, TVD).
The experimental setup utilized a DJI Phantom 4 RTK UAV (DJI Co., Ltd., Shenzhen, China) for acquiring corn canopy images. During data collection, corn plants ranged in height from 2.0 to 2.5 m. The UAV-mounted 20 MP digital camera offered a maximum resolution of 5472 × 3648 pixels. To balance image clarity with operational safety, the UAV was flown at an altitude of 10 m. High-resolution canopy imagery was captured under optimal atmospheric conditions using this imaging configuration [41,42].
During the image acquisition process, the UAV flew to the central positions of various corn-variety planting plots and maintained a consistent flight altitude for imaging. The original UAV-captured images had a pixel resolution of 5472 × 3648 × 3. However, owing to significant distortion at the corners of images captured during low-altitude flight, we cropped the central regions of the original images to a resolution of 256 × 256 × 3 pixels to represent the canopy images of individual planting plots; these cropped images were then saved for further analysis.

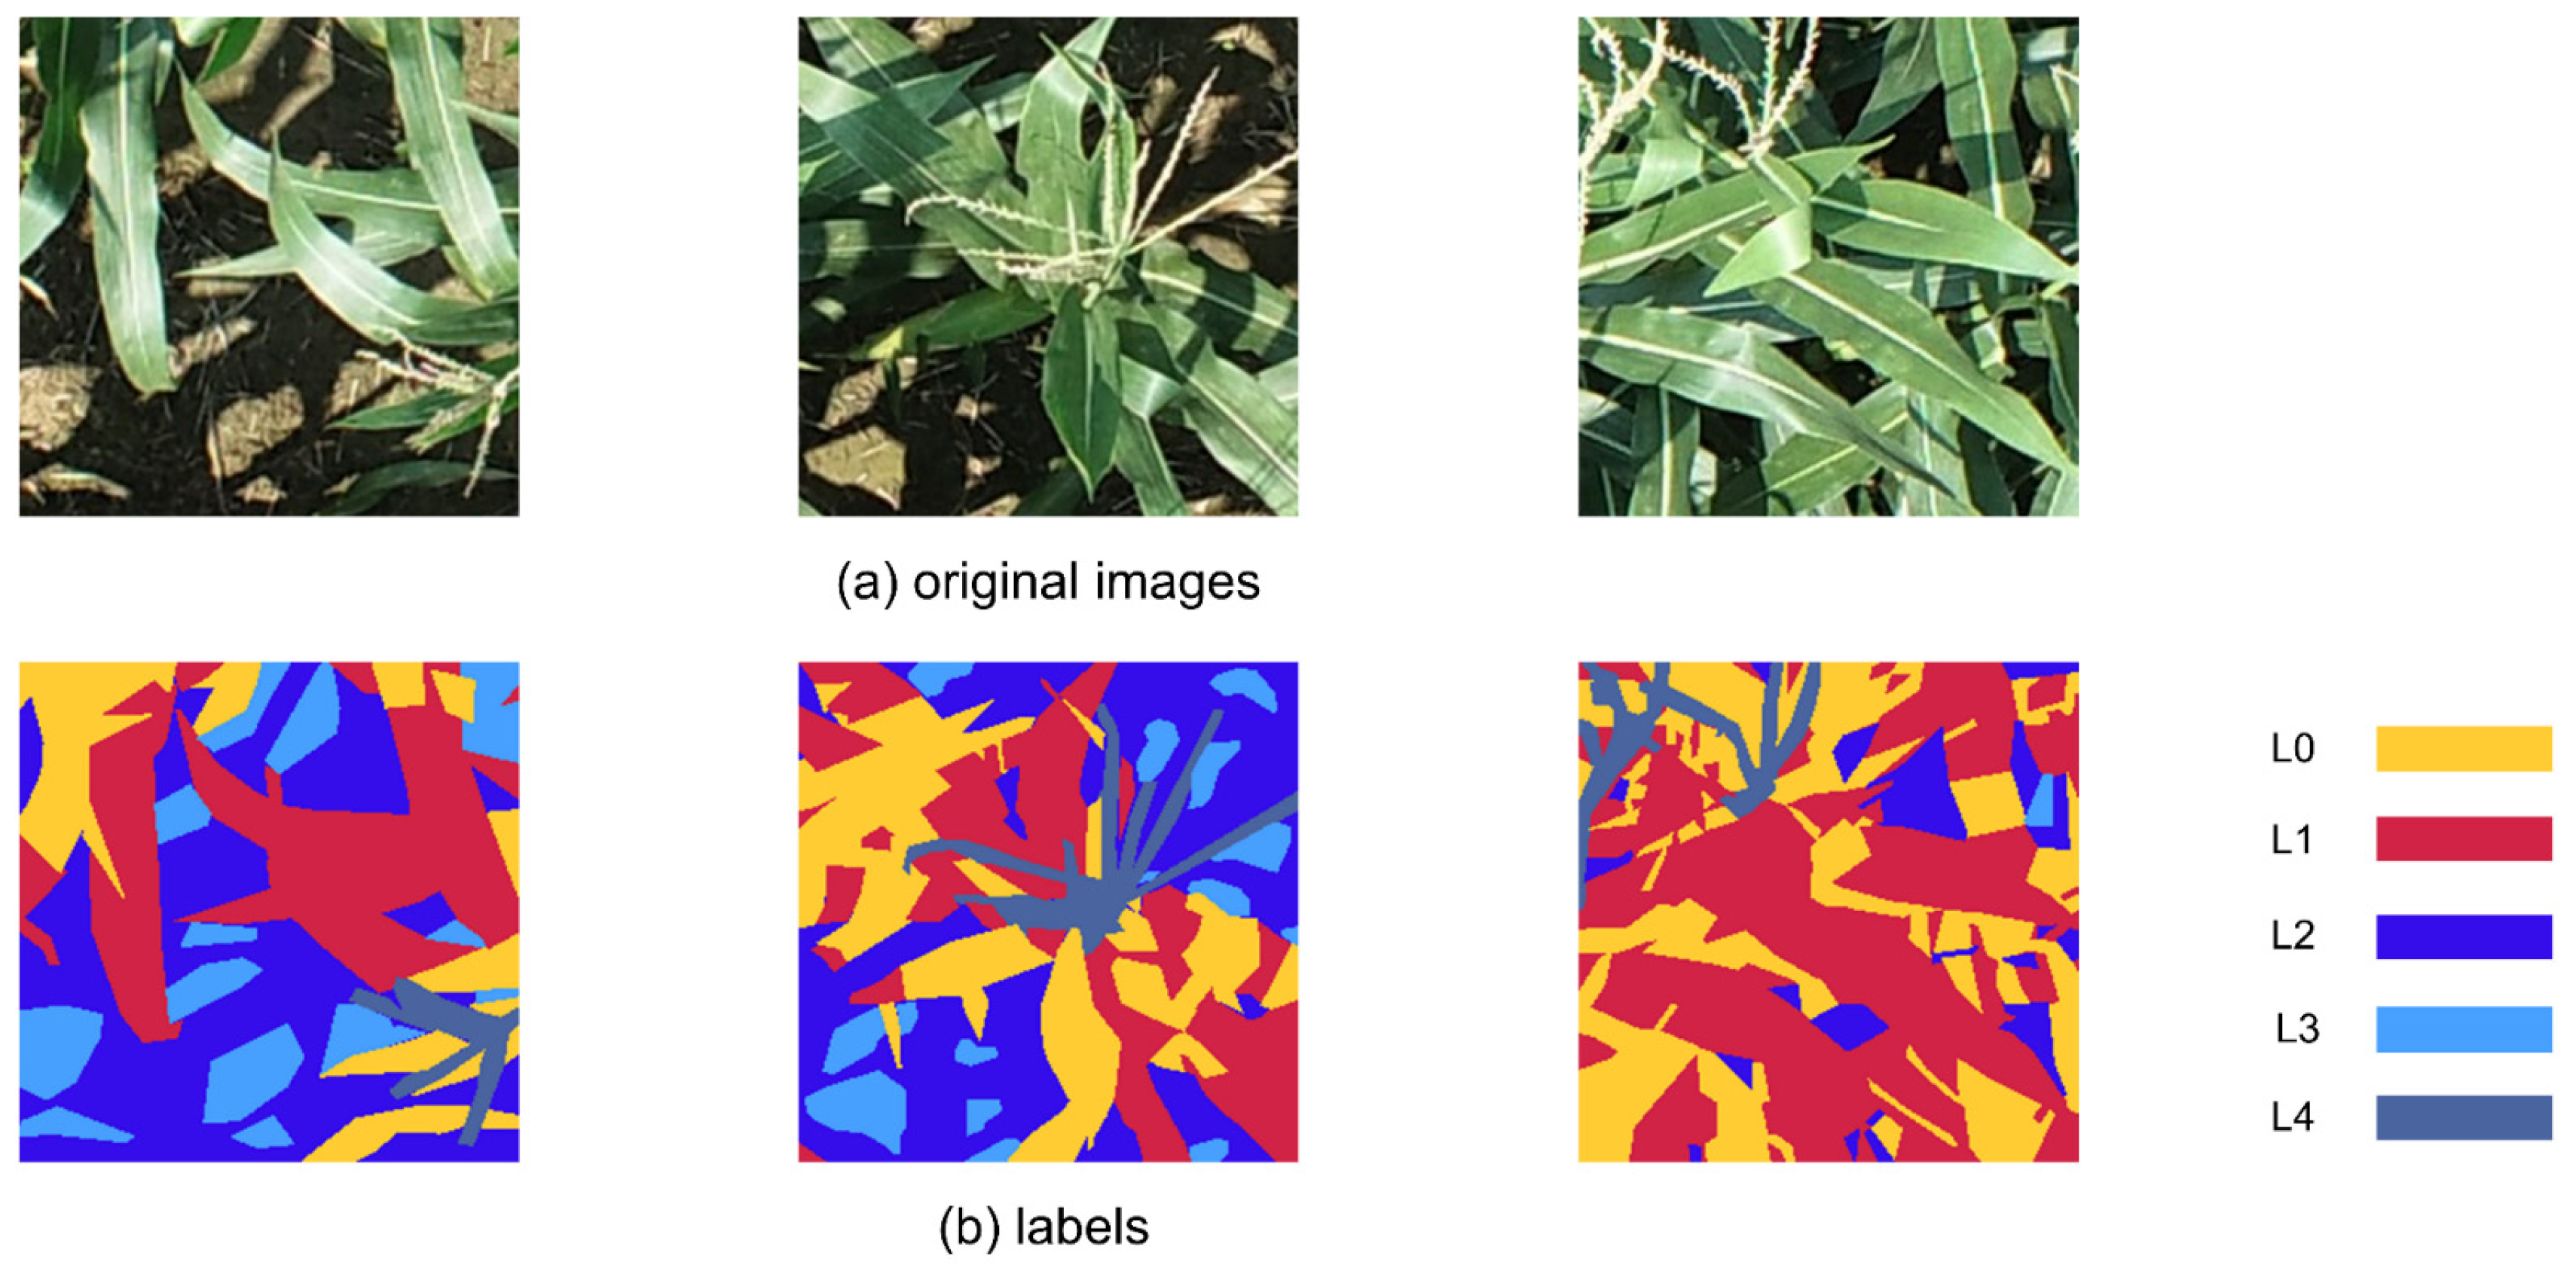
2.2. Data Annotation and Augmentation

After non-destructive cropping, the corn canopy images were manually annotated using the Computer Vision Annotation Tool 2.30.0 (CVAT) online platform, a specialized software for computer vision labeling tasks. Upon completion of annotation, the images were exported in segmentation mask mode, which automatically generated three-channel color label masks along with image name directory files. Subsequently, Python 3.12.7, NumPy 1.26.4, and OpenCV 4.10.0.84 libraries were employed to convert these masks into single-channel grayscale images for downstream model training. The corn canopy images were annotated as five distinct classes: “shaded soil,” “illuminated soil,” “shaded vegetation,” “illuminated vegetation,” and “tassel” (see Table 1). Figure 1 illustrates the raw corn canopy images alongside their corresponding annotation labels produced by the dataset labeling procedure.
After annotation, the canopy images in the TVD test dataset underwent multi-modal augmentation to enhance perspective diversity, increase structural complexity, and improve both representational richness and functional relevance. Specifically, six augmentation operations were applied to the images.
(1) Rotation Transformation: Randomly choosing a rotation angle within the range of −90° to 90° for the corn canopy images, causing positional changes in the various categories that need segmentation.
(2) Mirroring: Using horizontal and vertical mirroring to generate the original corn canopy images’ left–right and top–bottom symmetric effects.
(3) Adding Noise: Applying both Gaussian and camera sensor noise (randomly selected with 50% probability each) to simulate real acquisition noise.
(4) Filtering Changes: Using Gaussian and median filtering, one is chosen randomly (each with a 50% probability).
(5) Distortion Changes: Randomly selecting one of the two distortion methods, elastic transformation and grid distortion (each with a 50% probability), to distort the original images.
(6) Random Scaling: During data enhancement, a square size within the range of 86 × 86 × 3 to 170 × 170 × 3 pixels was randomly selected to non-destructively crop the original image at a random position and then scaled to 256 × 256 × 3 pixels.
The TVD comprises canopy images collected from 40 planting plots. Following augmentation, a total of 2880 sets of TVD test images and their corresponding annotations were generated. These augmented datasets were utilized to train and evaluate deep learning models in this study. The dataset was partitioned using a conventional split ratio: 70% (2016 images) allocated for model training, and the remaining 30% (864 images) reserved for validation to assess and optimize the model’s performance.
To comprehensively assess the model’s operational performance in real-world agricultural settings, canopy images from 30 planting plots within the IVD were employed for independent evaluation. This phase is crucial for assessing the model’s adaptability to novel data, thus validating its generalization capacity in actual agricultural environments. Furthermore, validation on independent datasets facilitates a comprehensive assessment of the model’s resilience to environmental variability encountered under field conditions, ensuring a stable and reliable recognition performance amid diverse and dynamic real-world settings. A total of 2880 TVD images and 30 IVD images were annotated. The average label distribution in the TVD is as follows: L0 (16.5%), L1 (26.9%), L2 (29.6%), L3 (22.2%), and L4 (4.8%). In comparison, the IVD exhibits an average label distribution of L0 (17.8%), L1 (15.6%), L2 (39.8%), L3 (23.3%), and L4 (3.5%).

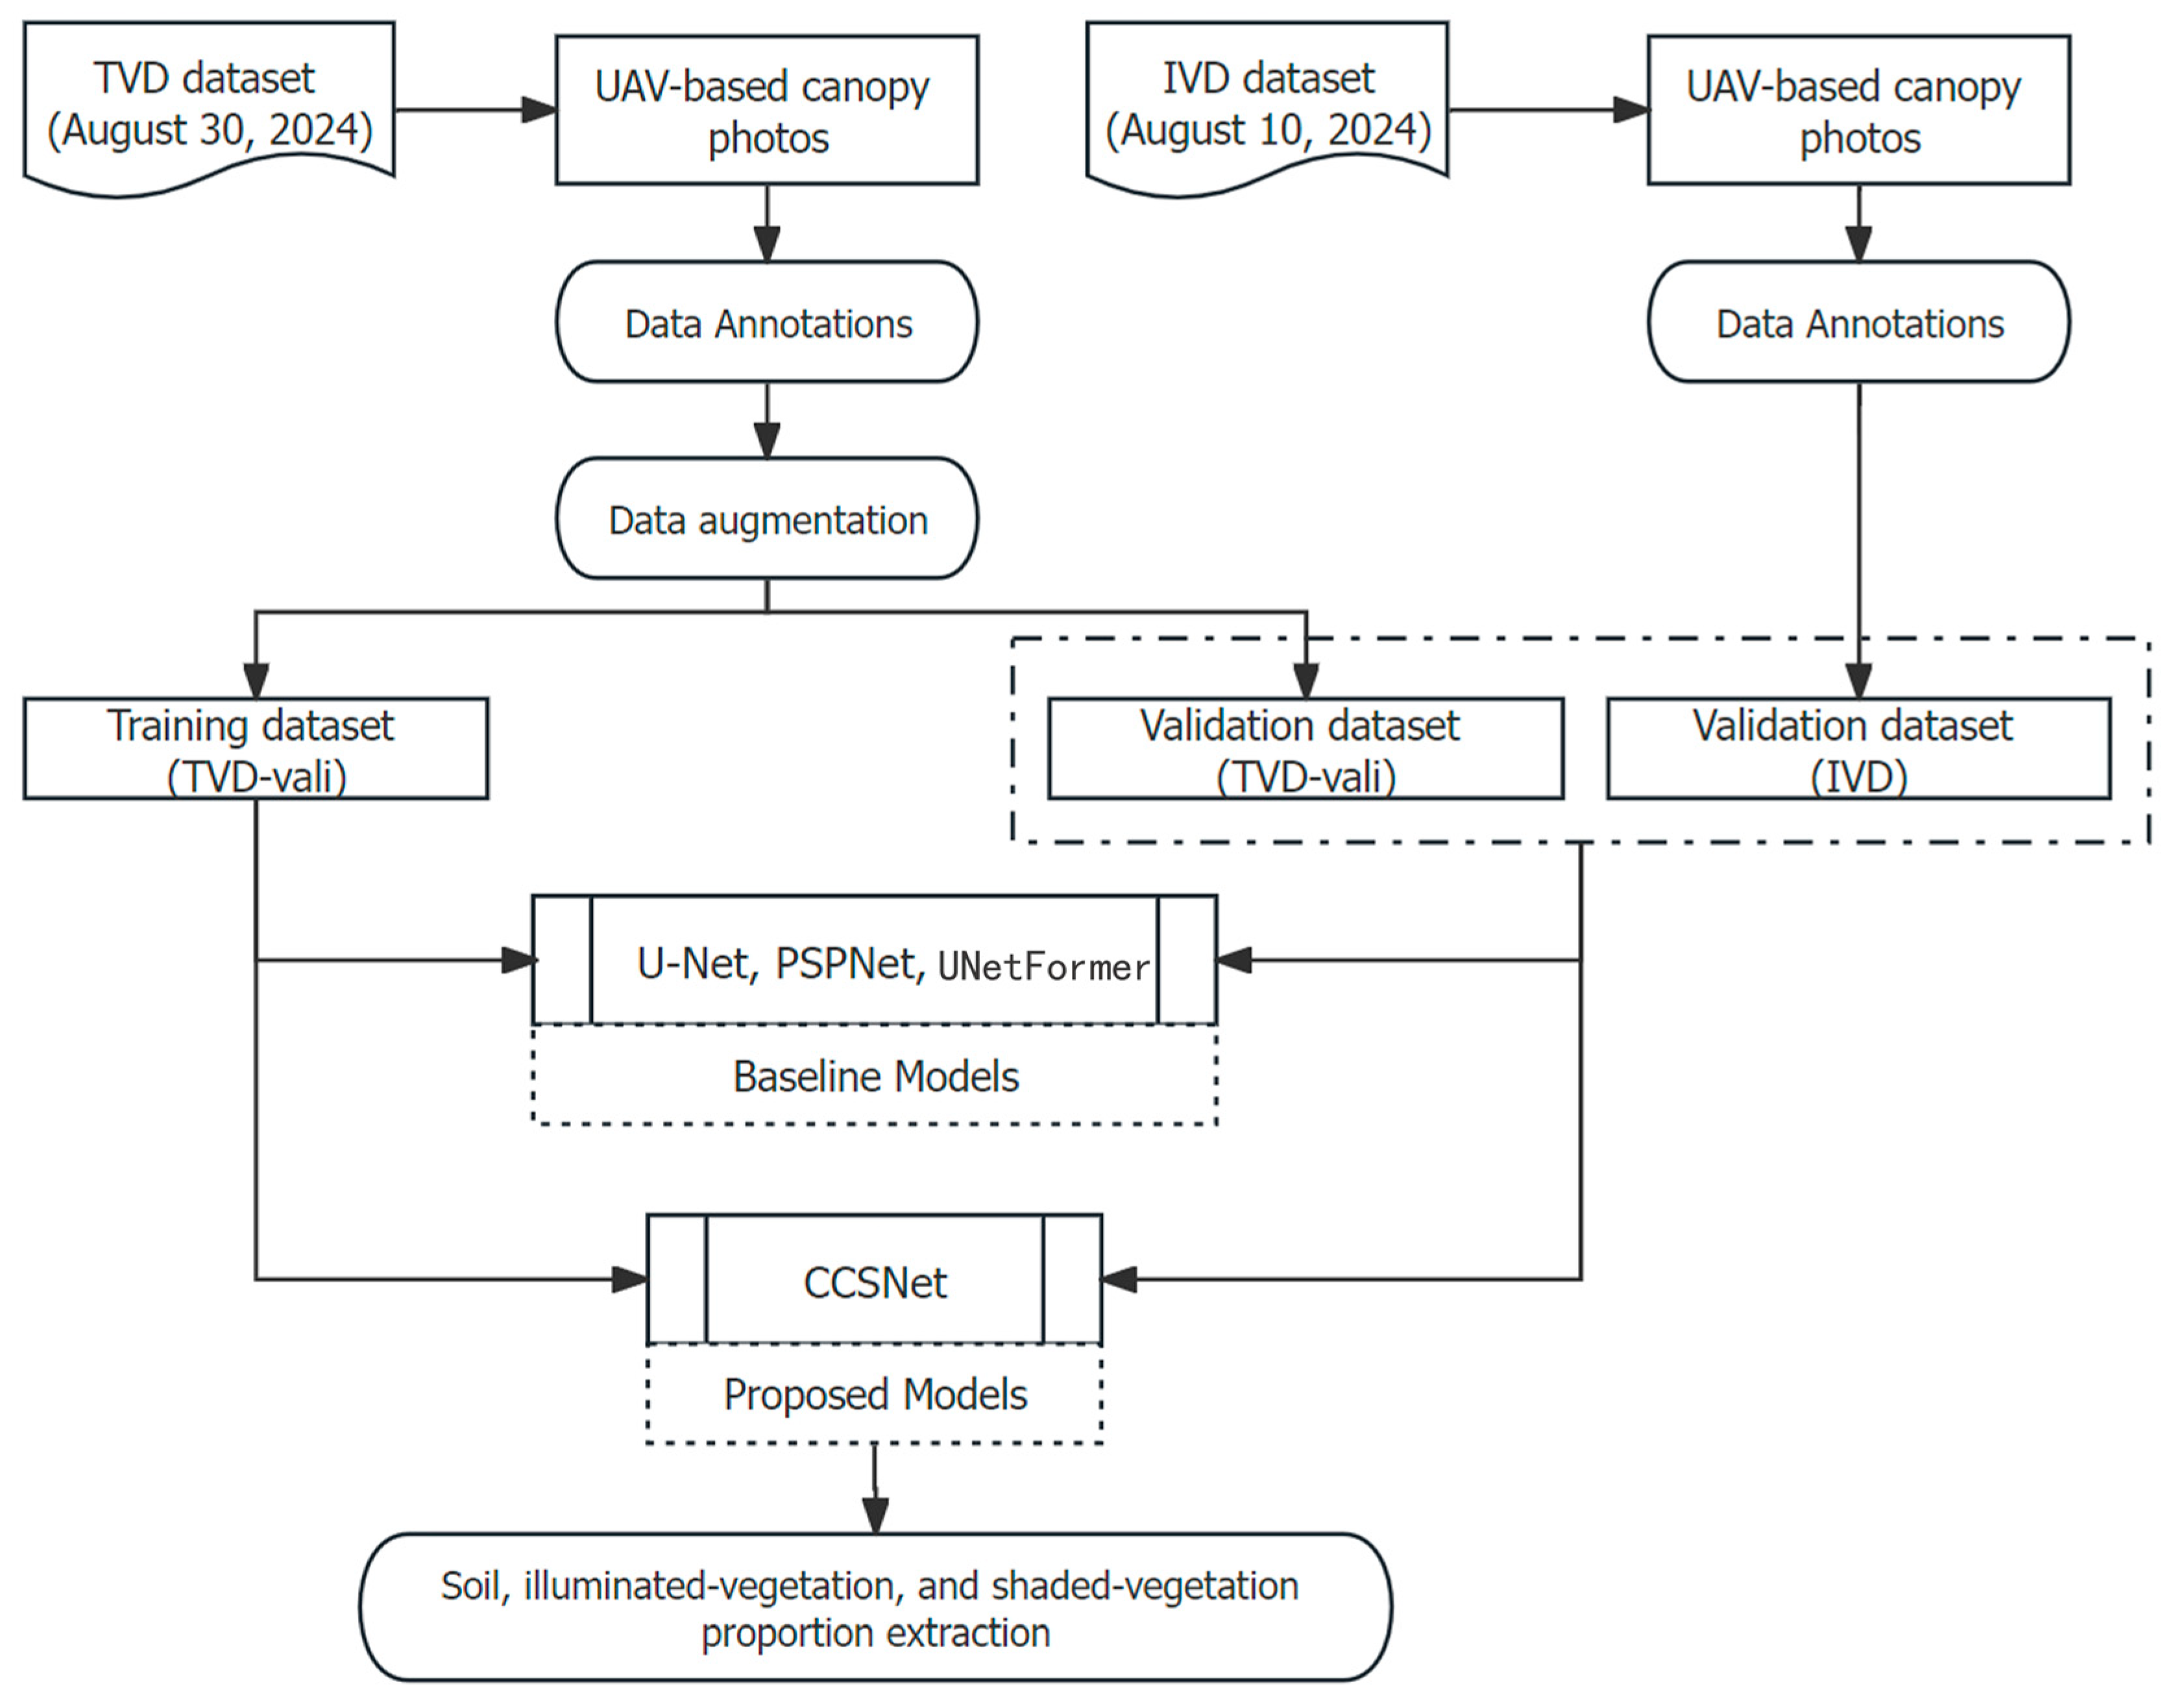
2.3. Methodology Framework

This study employed multiple semantic segmentation models alongside feature extraction backbone networks to segment images and extract fractional coverages of each category. The performance of each model was subsequently compared. The methodological framework is illustrated in Figure 2, with the principal procedural stages summarized as follows:
(1) UAV Flight and Photography: Corn canopy images were acquired at two distinct phenological stages within the corn-breeding field. The TVD was utilized for model training and testing, whereas the IVD served as an independent benchmark to evaluate the model’s generalization capacity and robustness across varying agricultural conditions.
(2) Data Preprocessing: Manual annotation categorized the dataset images into five distinct classes: “shaded soil,” “illuminated soil,” “shaded vegetation,” “illuminated vegetation,” and “tassel.” To enhance dataset diversity, transformations, such as rotation, horizontal and vertical flipping, and noise injection, were applied.
(3) Model Construction: The architectural design of CCSNet integrated MobileNetV2 and ResNet50 as foundational backbone networks for feature extraction.
(4) Accuracy Validation: The segmentation accuracy of CCSNet, U-Net, and PSPNet across the categories “shaded soil,” “illuminated soil,” “shaded vegetation,” “illuminated vegetation,” and “tassel” was compared using the TVD test and IVD. To quantify the individual contributions of architectural components, a systematic ablation analysis was conducted on CCSNet.

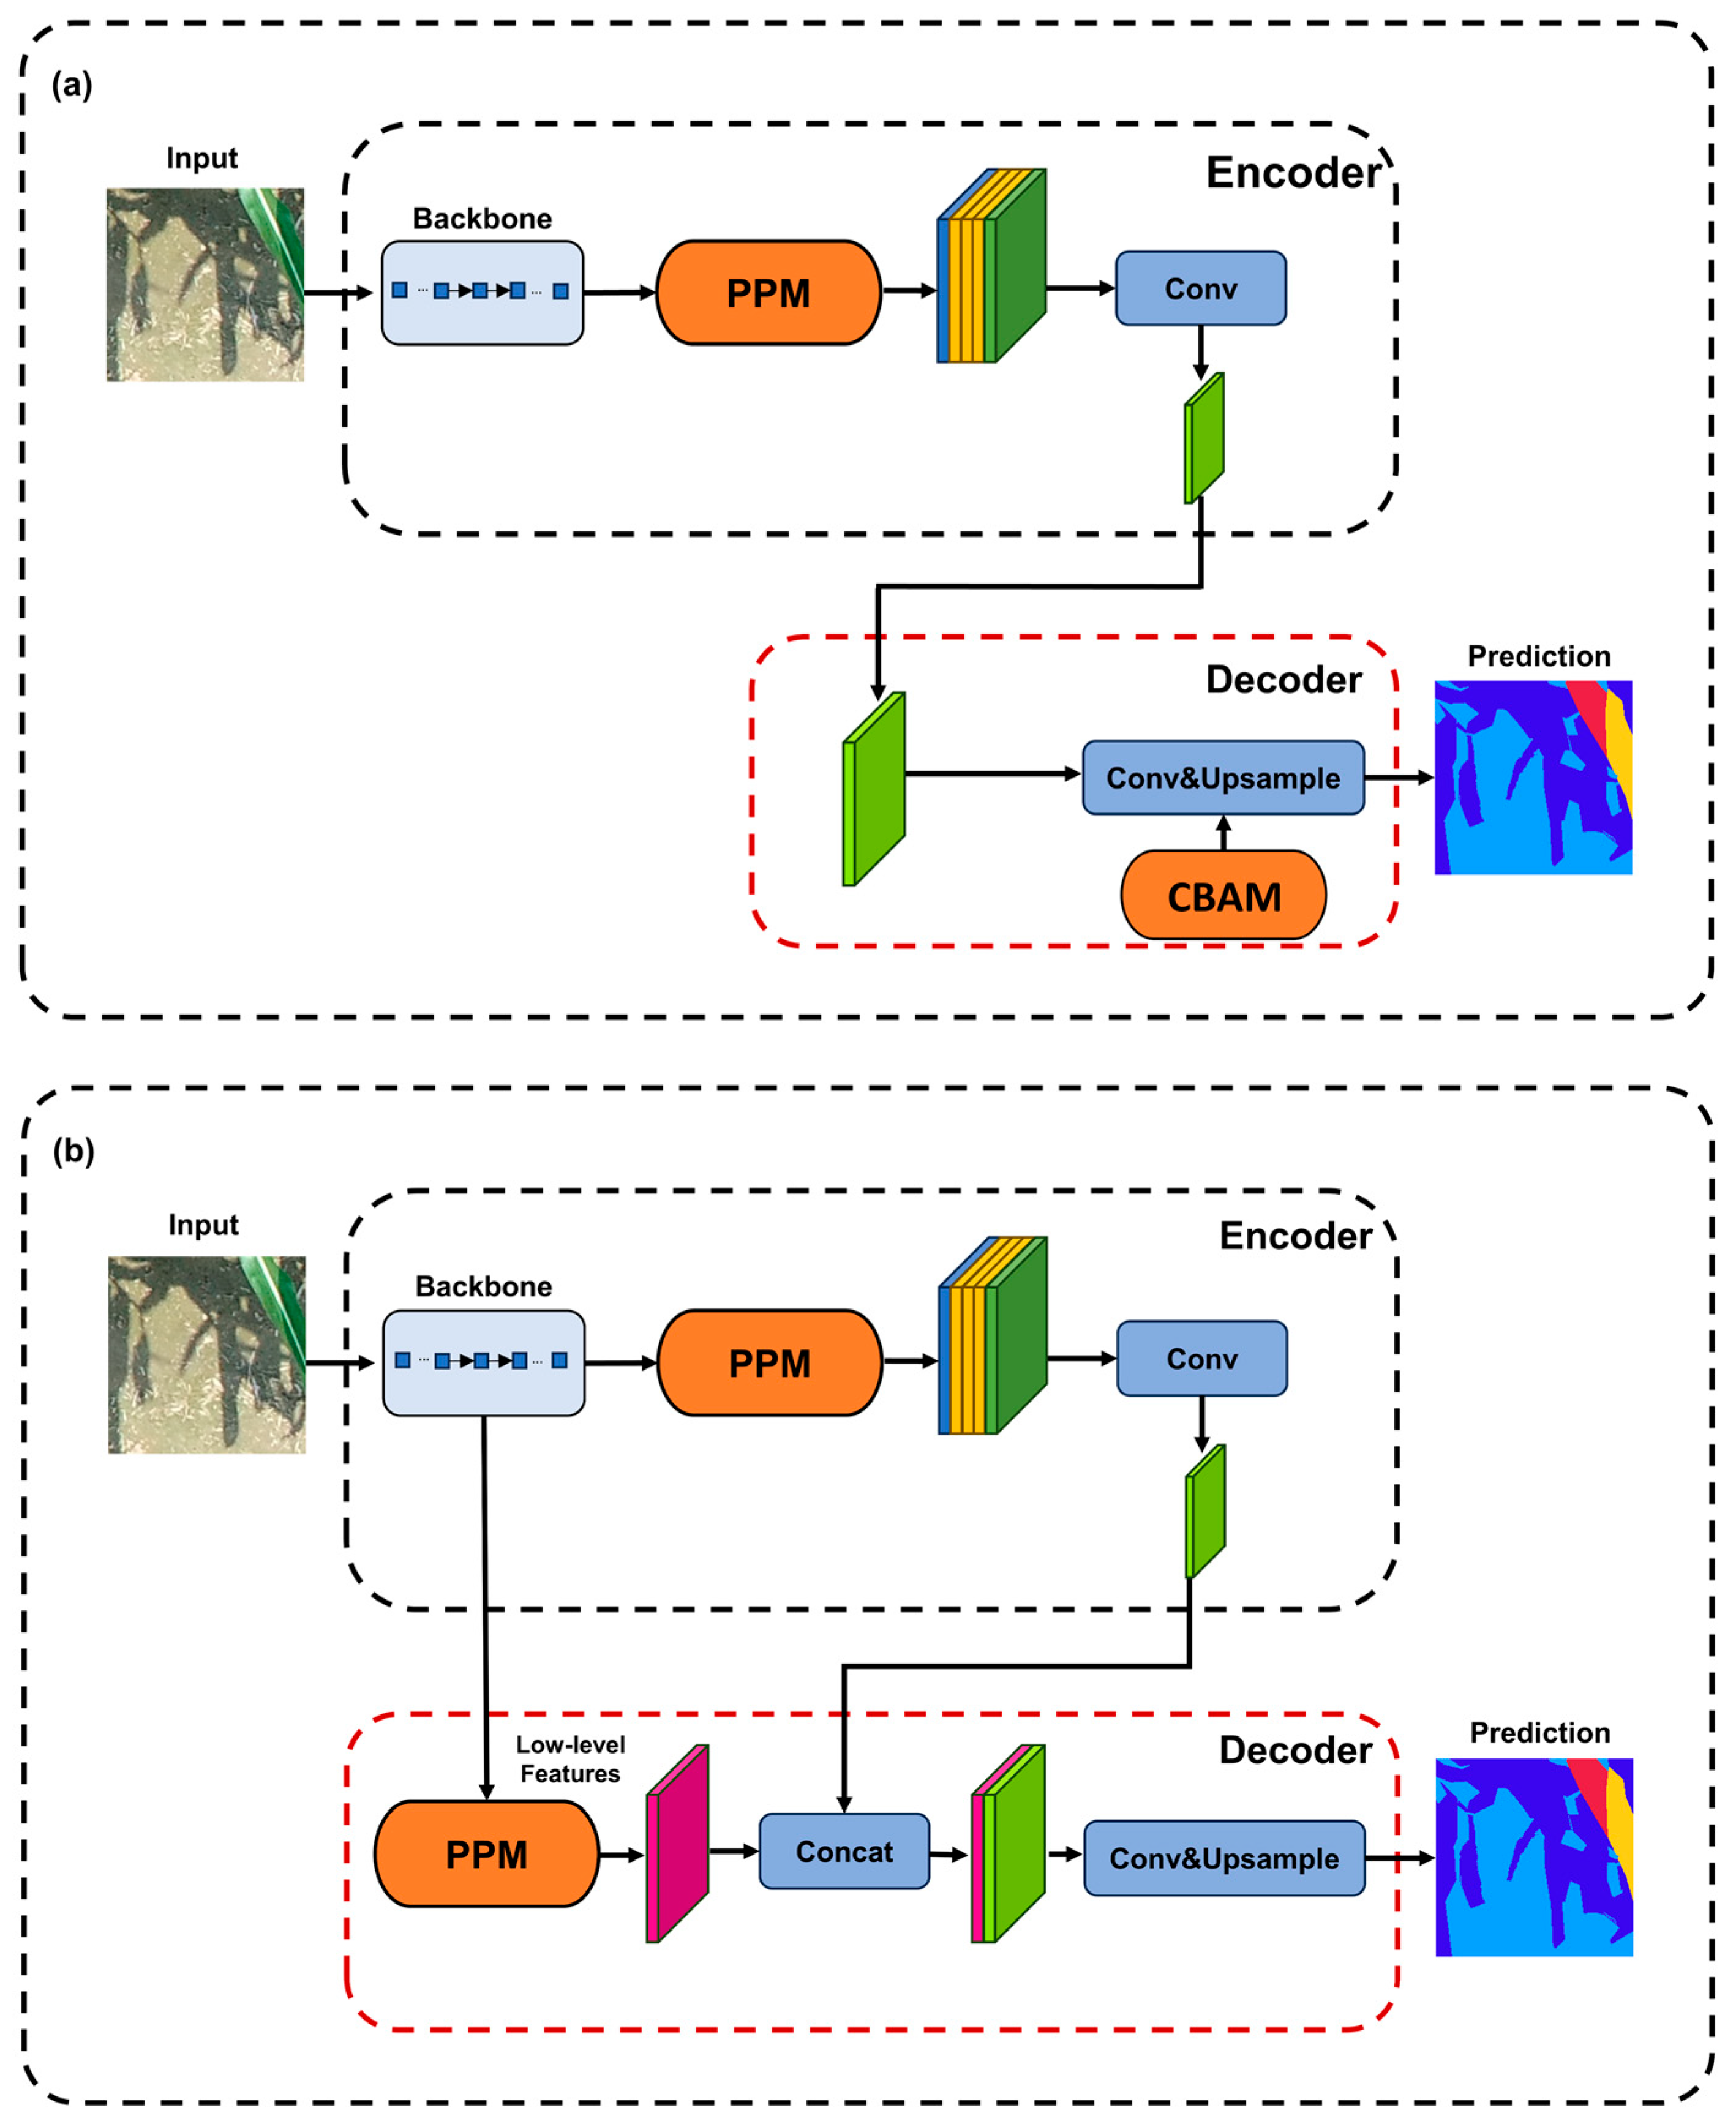
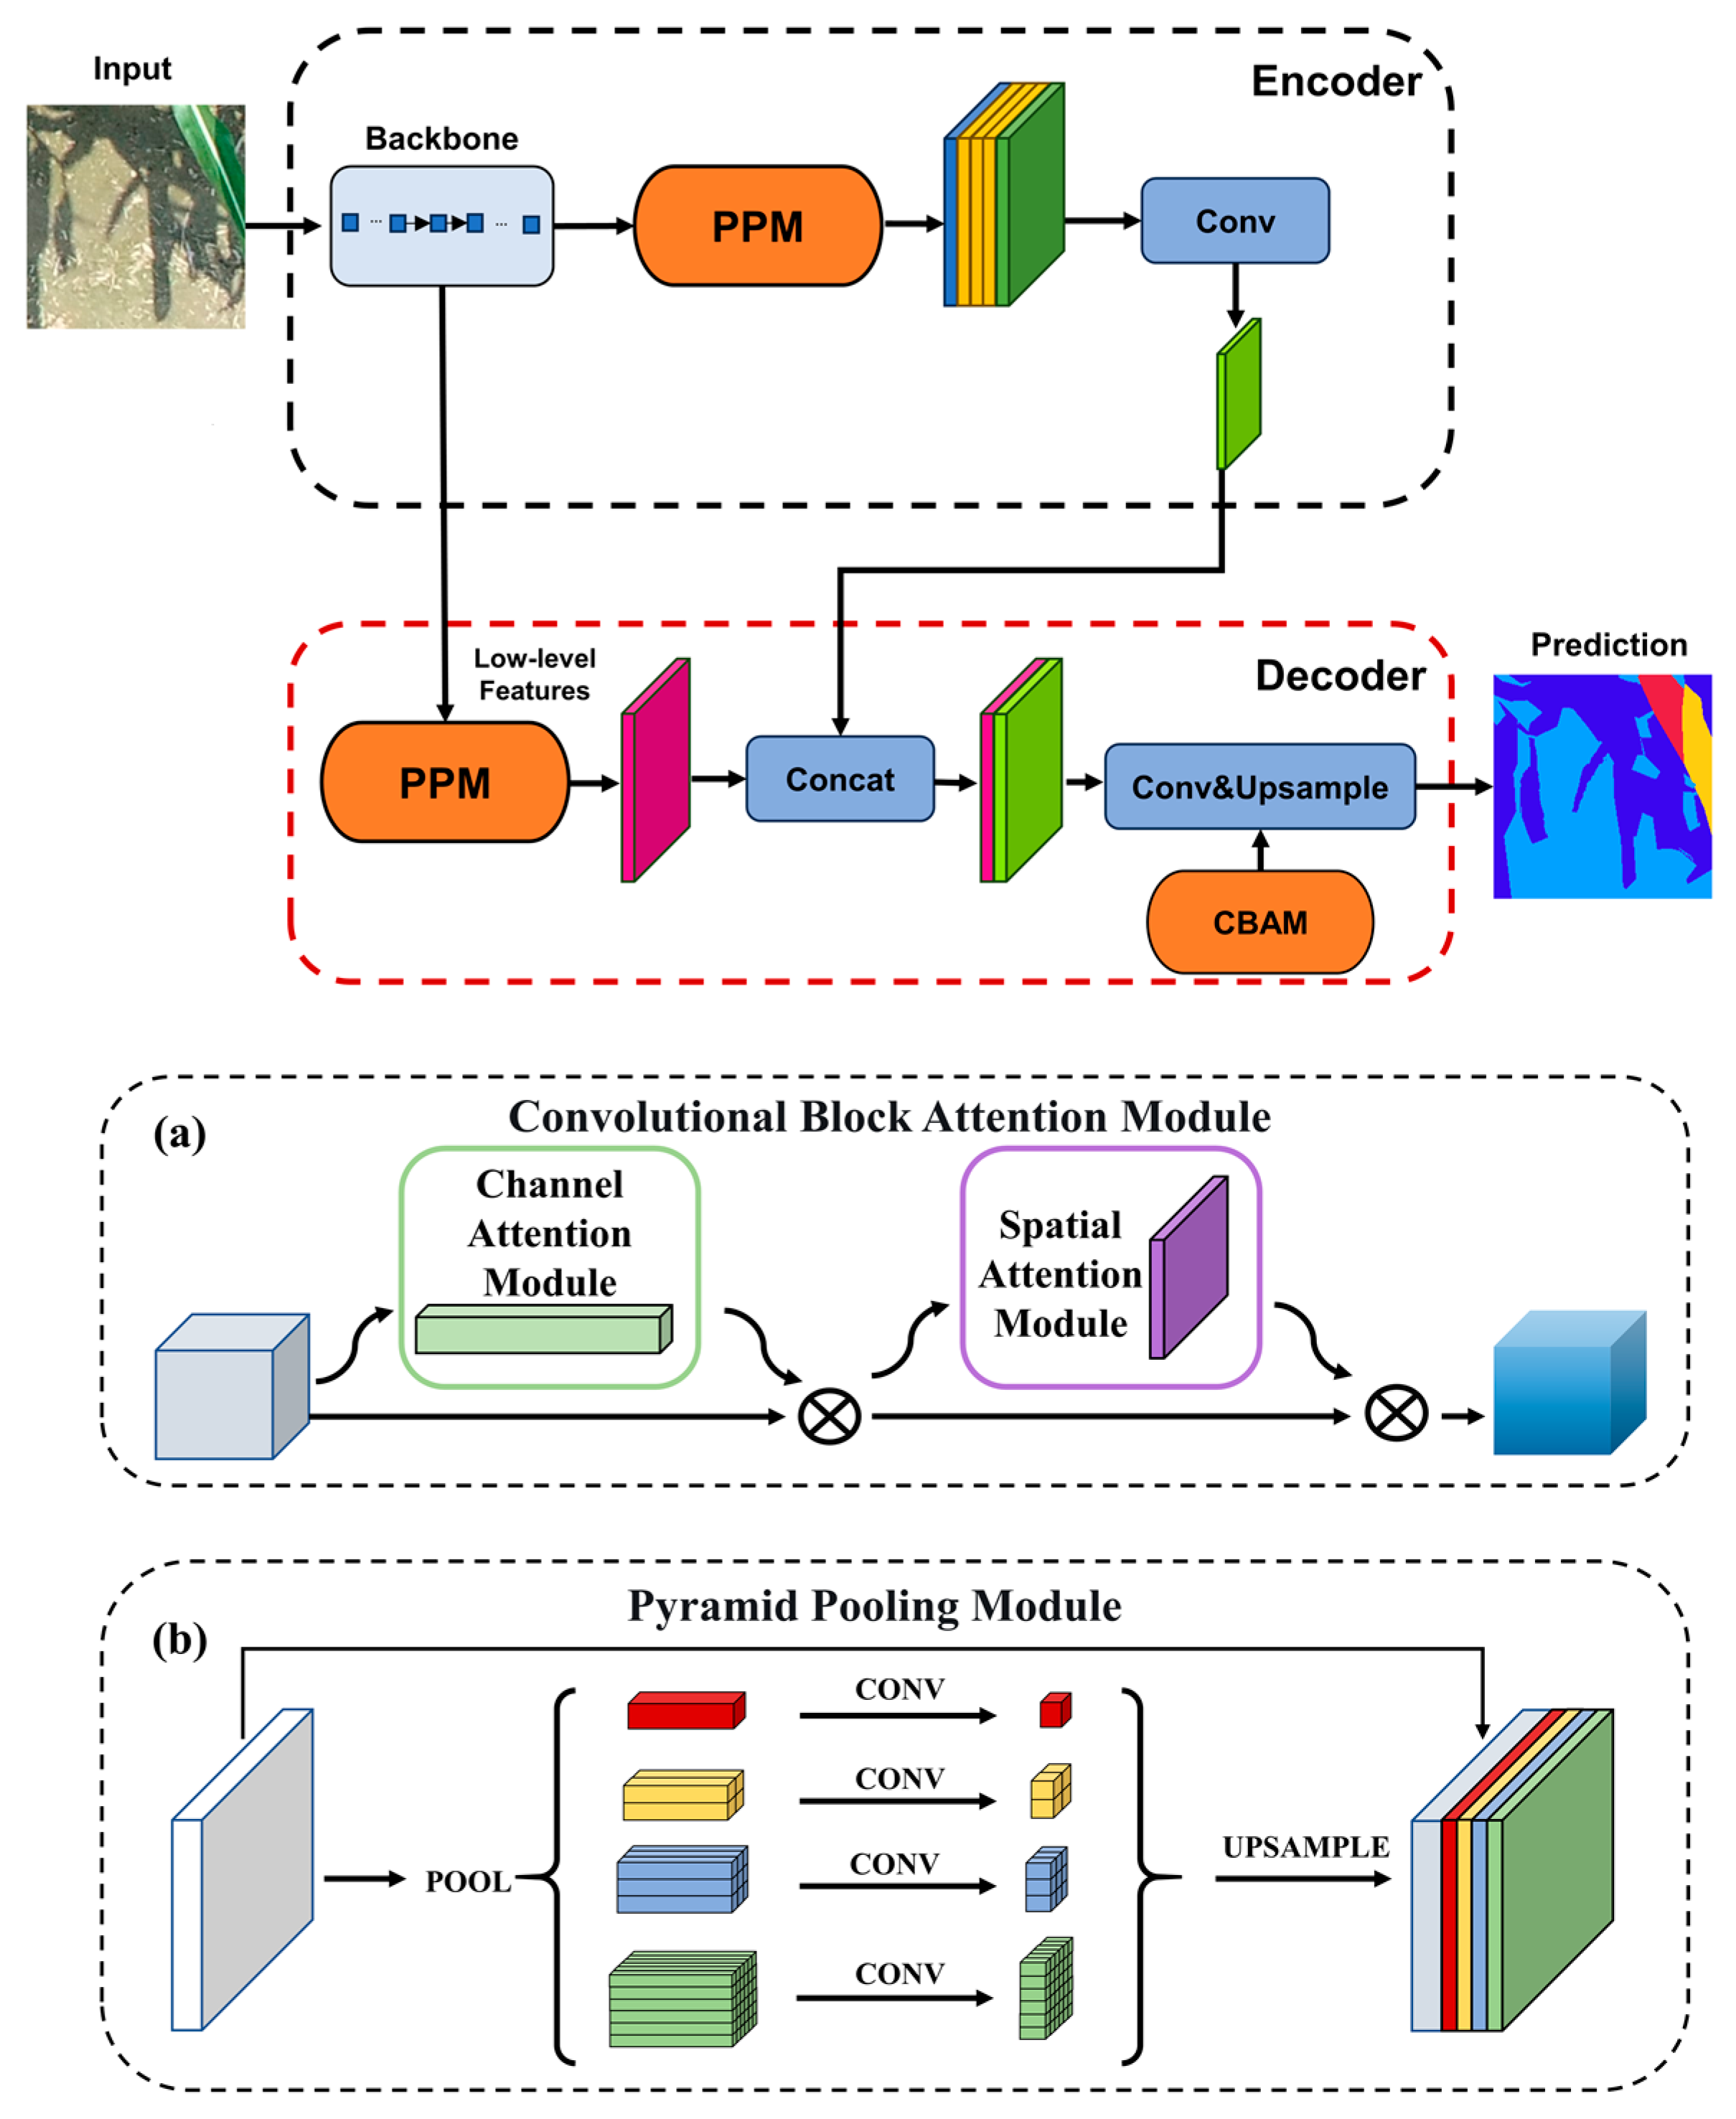
2.4. Proposed CCSNet Segmentation Model

Semantic segmentation, a fundamental task in computer vision, assigns pixel-level categorical labels to produce spatially coherent segmentation maps that maintain the original image resolution. Enabled by significant advancements in hardware, convolutional neural networks (CNNs) have achieved remarkable progress in computer vision. CNN-based semantic segmentation has undergone rapid advancements, leading to the development of novel architectures, such as the DeepLab family, PSPNet, and U-Net variants.
In deep learning, the backbone network constitutes the central component of a semantic segmentation architecture. Its primary function is to extract discriminative features from input data, thereby providing a foundation for subsequent processing and analysis. Such networks comprise multiple convolutional layers, pooling layers, and additional components that transform raw data into representative feature maps. The overall performance of the model largely depends on the design and selection of the backbone network.
Semantic segmentation models typically require large-scale training datasets to achieve optimal performance. However, the dataset employed in this study is relatively limited in size. To mitigate this limitation, the networks were pretrained on large-scale datasets such as ImageNet, thereby endowing them with robust feature extraction capabilities. For example, ResNet50 overcomes the vanishing gradient problem in deep networks by utilizing residual connections, facilitating the construction of substantially deeper models. Accordingly, this study selected MobileNetV2 and ResNet50 as the backbone networks for the semantic segmentation model.
The proposed CCSNet architecture employs ResNet50 as its backbone and innovatively integrates channel–spatial attention mechanisms with pyramid pooling modules to improve the upsampling performance. Convolutional networks tend to emphasize deep-level features. CCSNet integrates both shallow and deep image features, effectively leveraging the deep features extracted by the backbone network to comprehensively capture diverse feature information. This approach enables CCSNet to harness rich image information more efficiently, thereby enhancing both the capacity and generalization ability for corn canopy segmentation and fractional coverage estimation. The learning rate (LR) followed a cosine annealing schedule:
L R e p o c h = L R m i n + 1 2 L R m a x L R m i n 1 + cos T c u r T π
where L R m i n and L R m a x represent the minimum and maximum learning rates, respectively, controlling the range of learning rate changes. T c u r denotes the current epoch number, and T denotes the total number of epochs. While conventional cross-entropy loss struggles with class imbalance, our implementation utilized Focal Loss within a conservative learning rate window (10−6 to 10−4) to simultaneously ensure stable optimization and effective minority-class learning.
L o s s = L o s s f o c a l + L o s s d i c e
The detailed network architecture is presented in Figure 3.
(1) Input: The dimensions of the input images are specified as 256 × 256 × 3.
(2) Backbone: The employed backbone networks are responsible for extracting informative features from the input images. In this study, CCSNet employed MobileNetV2 and ResNet50 as its backbone networks for feature extraction.
(3) PPM: The pyramid pooling module (PPM) consists of multiple pooling layers, each employing windows of varying sizes (1 × 1, 2 × 2, 3 × 3, and 6 × 6 in this study) to capture contextual information at different spatial scales within the image. Subsequently, the pooled features were upsampled to a uniform size and concatenated.
(4) Attention Module: Incorporating both channel and spatial attention mechanisms, the designed module achieves efficient attention with minimal computational overhead.

2.5. Benchmark Models: U-Net, PSPNet, and UNetFormer

For performance evaluation, this study employed U-Net, PSPNet and UNetFormer as reference models to assess CCSNet’s segmentation accuracy for soil coverage, shaded vegetation, and sunlit vegetation in corn canopy imagery.
(1) U-Net: Adopting an encoder–decoder structure, the model first extracts deep features via the encoder, then recovers spatial resolution through the decoder to produce dense per-pixel segmentation masks.
(2) PSPNet: Distinct from conventional approaches, PSPNet introduces the PPM to explicitly combine contextual features at multiple receptive fields, enabling a comprehensive understanding of the scene. PPM captures deep features at different scales using various pooling sizes, processes these features through convolution layers, and combines them.
(3) UNetFormer: UNetFormer combines convolutional encoders with Transformer-based decoders, capturing both local details and global context. Its hybrid architecture enables accurate semantic segmentation in high-resolution and complex scenes, making it well-suited for agricultural imagery where fine structure and long-range dependencies are essential.
Each model was evaluated using two distinct backbone networks: a relatively lightweight architecture (e.g., MobileNetV2) and a deeper architecture (e.g., ResNet50) to investigate the influence of backbone depth on the semantic segmentation models’ performance.

2.6. Model Parameter Settings and Accuracy Evaluation

This study utilized a computing platform equipped with an Intel i5-12600KF processor, 32 GB of RAM, and an NVIDIA RTX 4060 Ti GPU for model training. During training, the pre-trained backbone network parameters (MobileNetV2 and ResNet50) were frozen for the initial five epochs. The training protocol comprised 100 epochs per run, with each model configuration assessed across three independent training–validation cycles. The best performance achieved across all trials was selected for final evaluation.
The training process utilized different batch sizes: 64 during the frozen-parameter phase and 8 during fine-tuning when the parameters were unfrozen, thereby optimizing memory usage at each stage. The optimizer was set to Adam.
The confusion matrix is a fundamental tool for evaluating the model’s performance and can be extended to multi-class classification tasks. In semantic segmentation, four key evaluation metrics are commonly derived from it: Recall, mean Intersection over Union (mIoU), Pixel Accuracy (PA), and Intersection over Union (IoU).
(1) IoU: The ratio of the intersection to the union between predicted results and ground truth indicates the model’s prediction accuracy for each class. It is computed as follows:
I o U = T P T P + F P + F N
(2) mIoU: The mean IoU across all classes offers a comprehensive measure of the model’s segmentation accuracy and serves as a primary metric for evaluating performance. It is computed as follows:
m I o U = 1 N i = 1 N I o U i
(3) PA: The proportion of correctly predicted pixels relative to the total pixel count reflects the model’s overall prediction accuracy, without distinguishing performance across individual classes. It is computed as follows:
P A = T P + T N T P + F P + F N + T N
(4) Recall: The proportion of correctly identified positive instances relative to all actual positives reflects the model’s ability to detect true positives. It is computed as follows:
R e c a l l = T P T P + F N
To evaluate the model’s performance, the aforementioned metrics were employed. In general, higher values of mIoU, IoU, Recall, and PA reflect a superior model performance.
Root mean squared error (RMSE) and the coefficient of determination (R2) were also utilized to assess the accuracy of fractional coverage extraction for the “soil,” “shaded vegetation,” and “illuminated vegetation” categories. The specific calculation formulas are presented below:
R M S E = 1 m i = 1 m y i y ^ i 2
R 2 = 1 i y ^ i y i 2 i y ¯ i y i 2
where y i is the actual value, y ¯ i is the mean value of the samples, y i ^ is the predicted value, and m is the number of samples. For identical sample data, elevated R2 values and reduced RMSE typically signify superior model precision.

3. Results

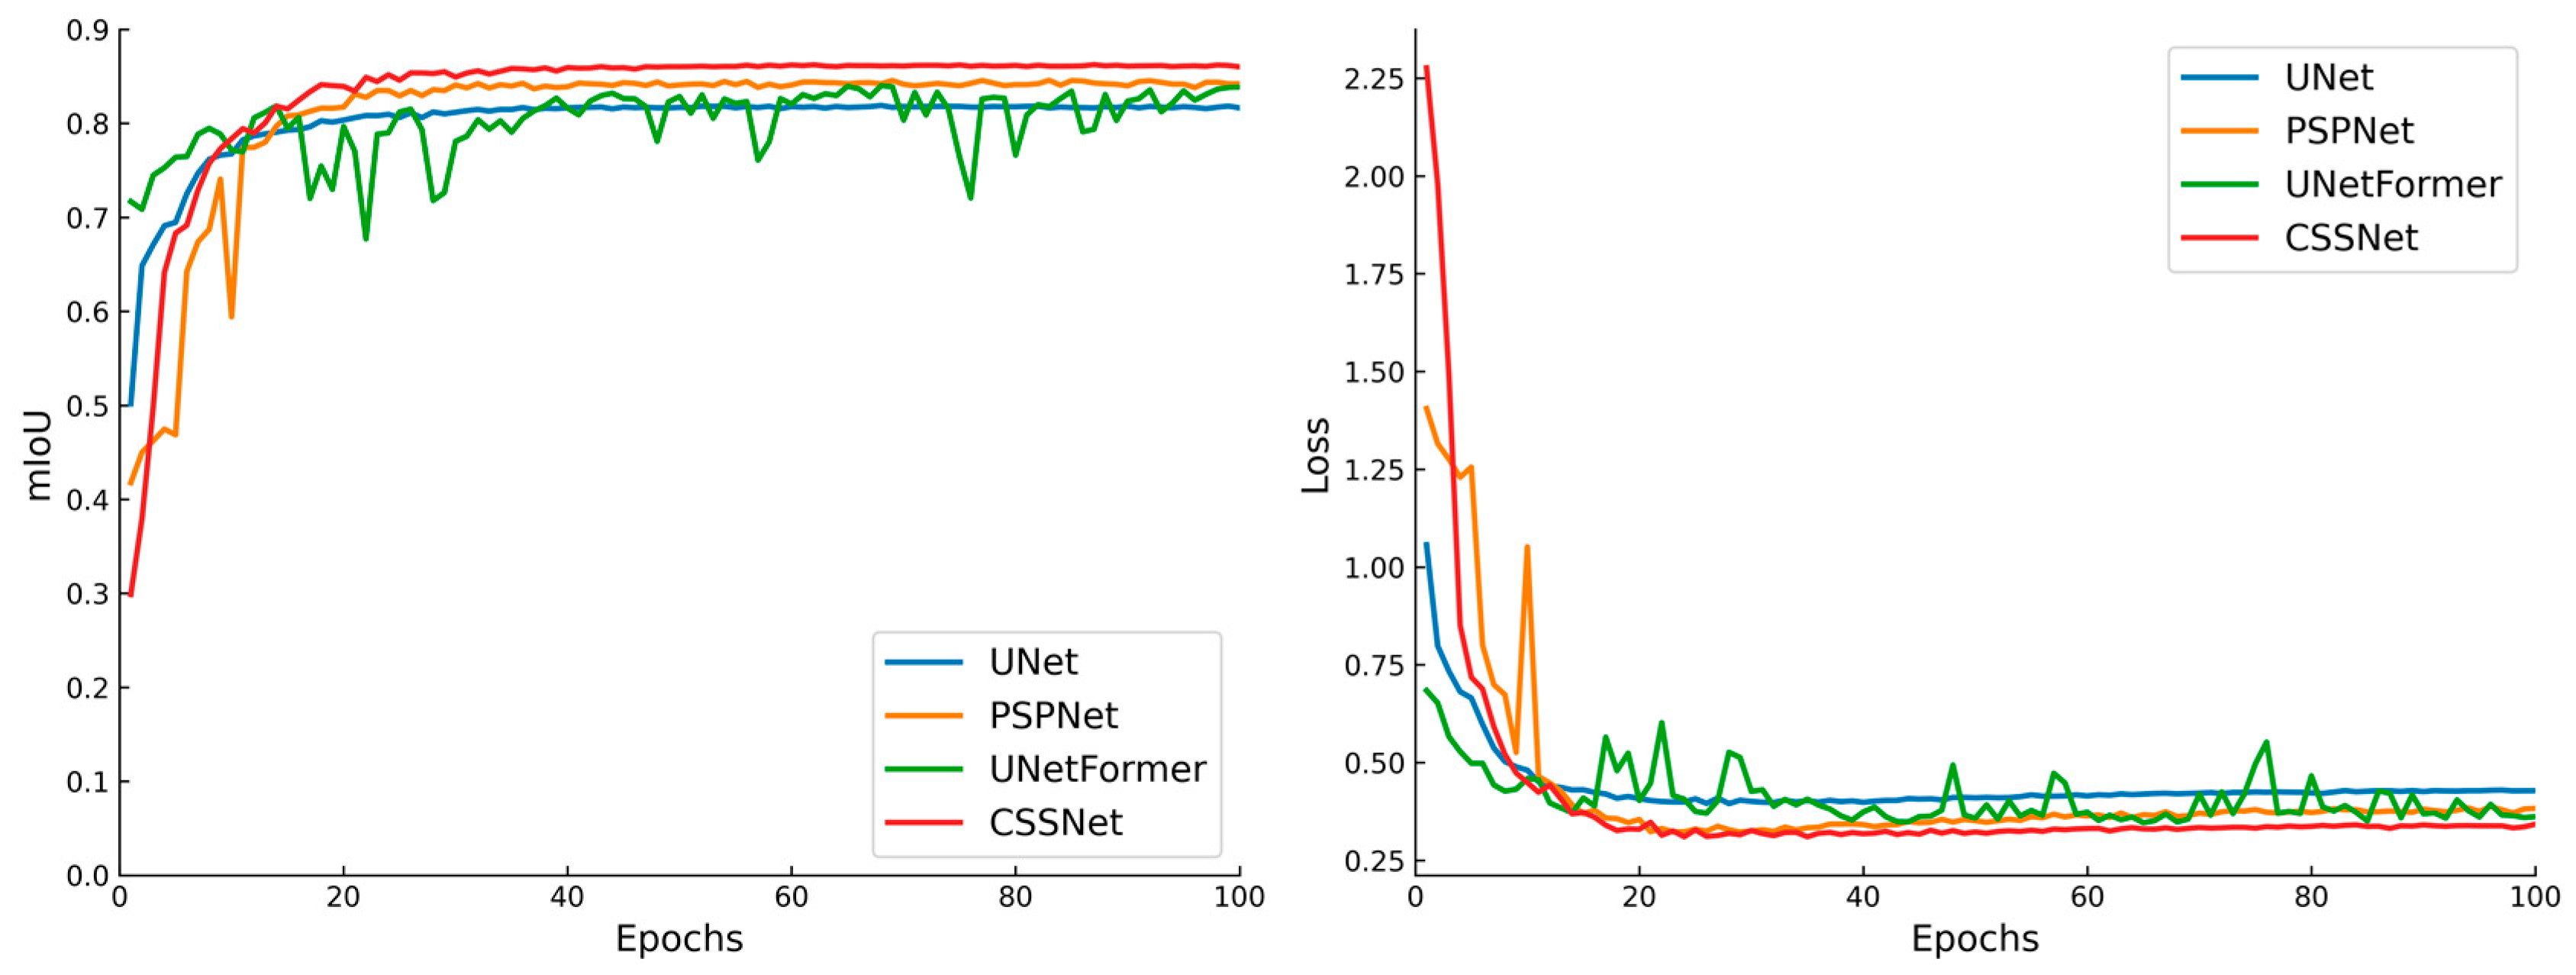
3.1. Model Training and Testing

This study trained and validated conventional U-Net, PSPNet, and UNetFormer models using the TVD-cali and TVD-vali, respectively. The training process involved four semantic segmentation networks, with performance trends visualized using mIoU and loss curves based on deep backbone networks, as shown in Figure 4. The accuracy results of the U-Net, PSPNet, and UNetFormer models on the TVD-vali are summarized in Table 2. The results indicate that the UNetFormer model, which adopts ResNet50 as its pre-trained backbone, achieved the highest accuracy, with an mIoU of 84.32%. In contrast, the PSPNet model with MobileNetV2 as its backbone demonstrated the lowest accuracy, recording an mIoU of 77.23%. Moreover, the use of deep backbone networks generally enhances the performance of a given semantic segmentation model compared to configurations with lightweight backbones. For example, the PSPNet model attained mIoUs of 77.23% and 84.27% when utilizing lightweight and deep backbone networks, respectively. The trained CCSNet architecture was comprehensively evaluated on the TVD-vali, with the quantitative accuracy metrics provided in Table 2. The results show that CCSNet, equipped with a ResNet50 backbone, achieved the best performance (mIoU: 86.42%, PA: 93.58%), marking a 2.1% improvement in mIoU over the UNetFormer architecture.
Table 2 presents the comparative segmentation accuracy of different models evaluated on the TVD-vali. Each experiment was repeated five times, and average values along with standard deviations are reported. Furthermore, paired t-tests were applied to validate the statistical significance (p < 0.05) between CCSNet and competing models. The results demonstrate that the CCSNet model, equipped with a ResNet50 backbone, performed robustly on both the TVD-vali and IVD. Specifically, on the IVD, CCSNet with a ResNet50 backbone achieved the best performance (mIoU = 70.45%, PA = 85.97%), outperforming all comparative models. As shown in Table 3, CCSNet effectively extracted features for segmentation targets despite being trained on a limited number of samples.
The experimental results (Table 3) show that all segmentation models utilizing deep backbone networks achieve higher accuracy than those employing lightweight backbones. For instance, using U-Net with a deep backbone leads to a 9.34% increase in mIoU and a 4.69% improvement in PA. Similarly, PSPNet achieves a 7.19% improvement in mIoU and a 4.36% increase in PA when a deep backbone is used. In addition, the results in Table 3 reveal that all models show a comparatively worse performance in segmenting illuminated soil and tassel classes. However, in real-world corn canopy scenarios, tassels occupy only a small portion of the total canopy area. Therefore, segmentation errors related to tassels have minimal impact on the estimation of fractional coverages for “soil”, “shaded vegetation”, and “illuminated vegetation”.

3.2. Ablation Experiments of CCSNet Based on the TVD-Vali and IVD

This study designed a series of ablation experiments on the TVD-vali and IVD to systematically evaluate two core innovations in CCSNet: the integrated attention mechanism and the hierarchical feature fusion architecture. Three distinct model variants were analyzed to assess their individual and combined contributions.
(1) Exp. 1: CCSNet (Figure 3);
(2) Exp. 2: CCSNet without a deep–shallow feature structure (Appendix A, Figure A1a);
(3) Exp. 3: CCSNet without the attention module is illustrated in the Appendix A, Figure A1b. Table 4 presents the class-wise segmentation accuracy and mIoU metrics for both the TVD-vali and IVD. Quantitative analysis indicates that Experiments 2 and 3 underperformed compared to Experiment 1 in corn canopy segmentation. Notably, Experiment 3, which incorporated shallow features, achieved a 2.91% improvement in mIoU over Experiment 2 (which did not utilize shallow features) on the IVD, highlighting the effectiveness of integrating shallow features in enhancing segmentation performance.

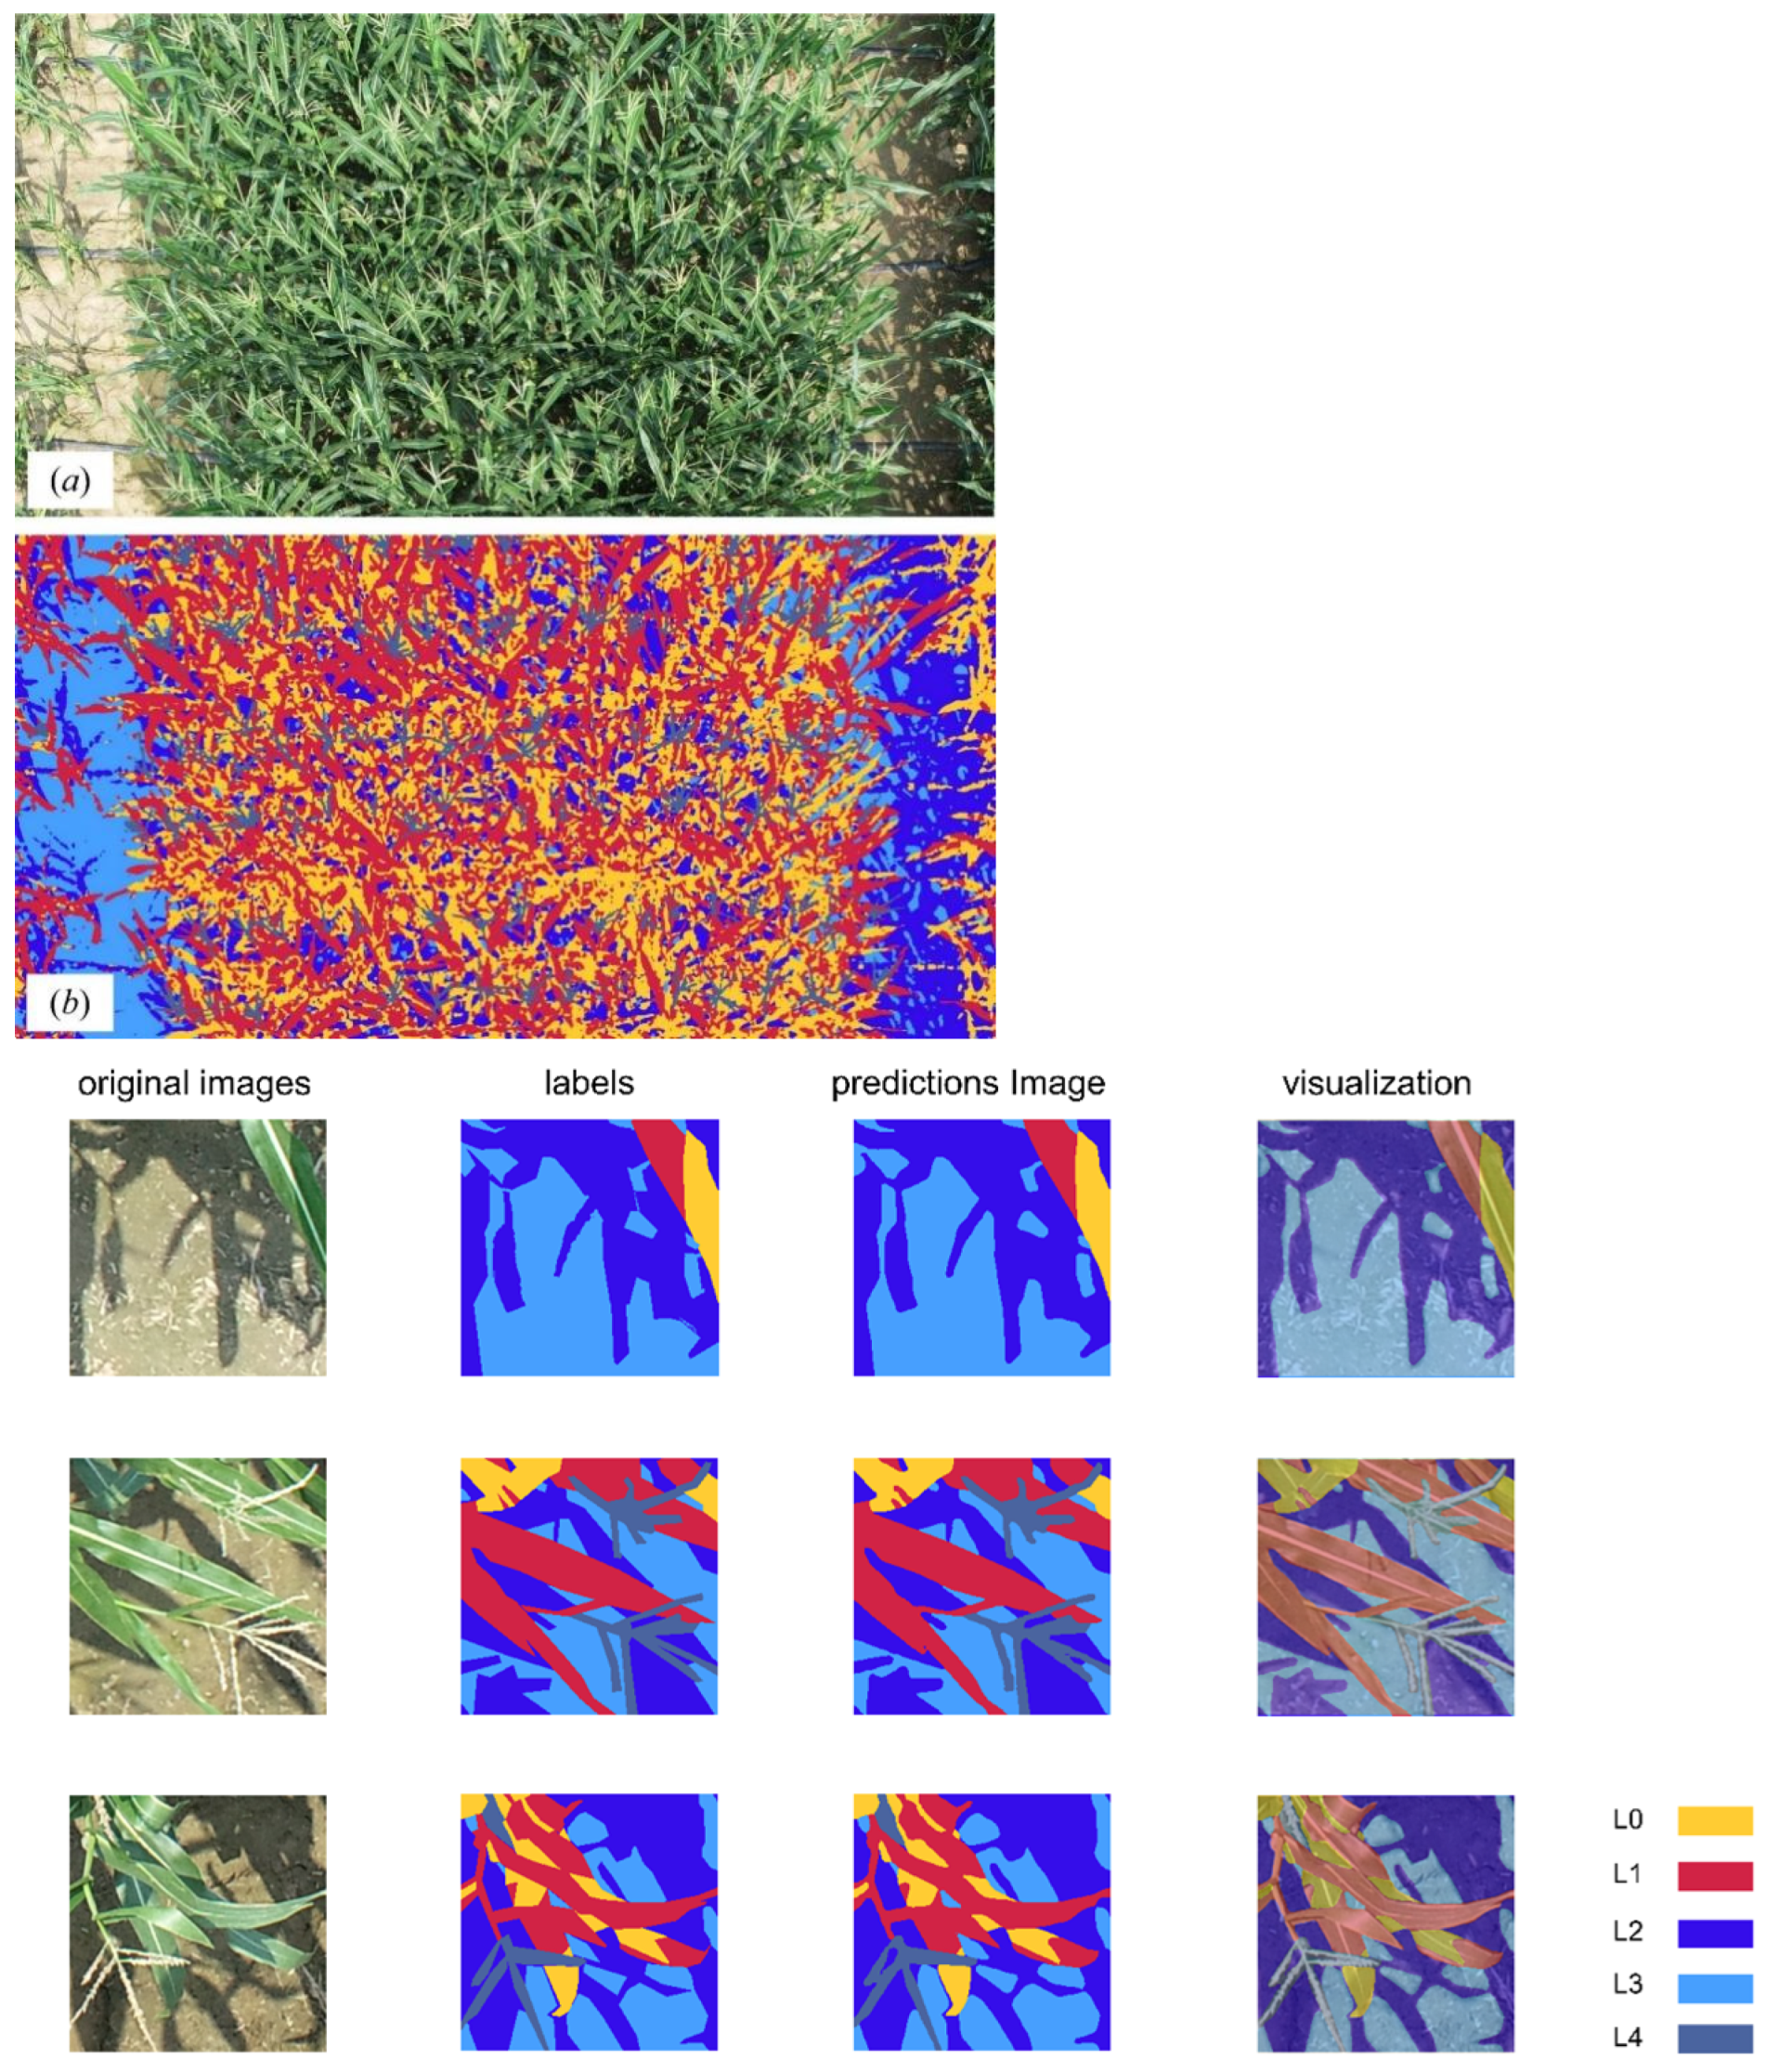
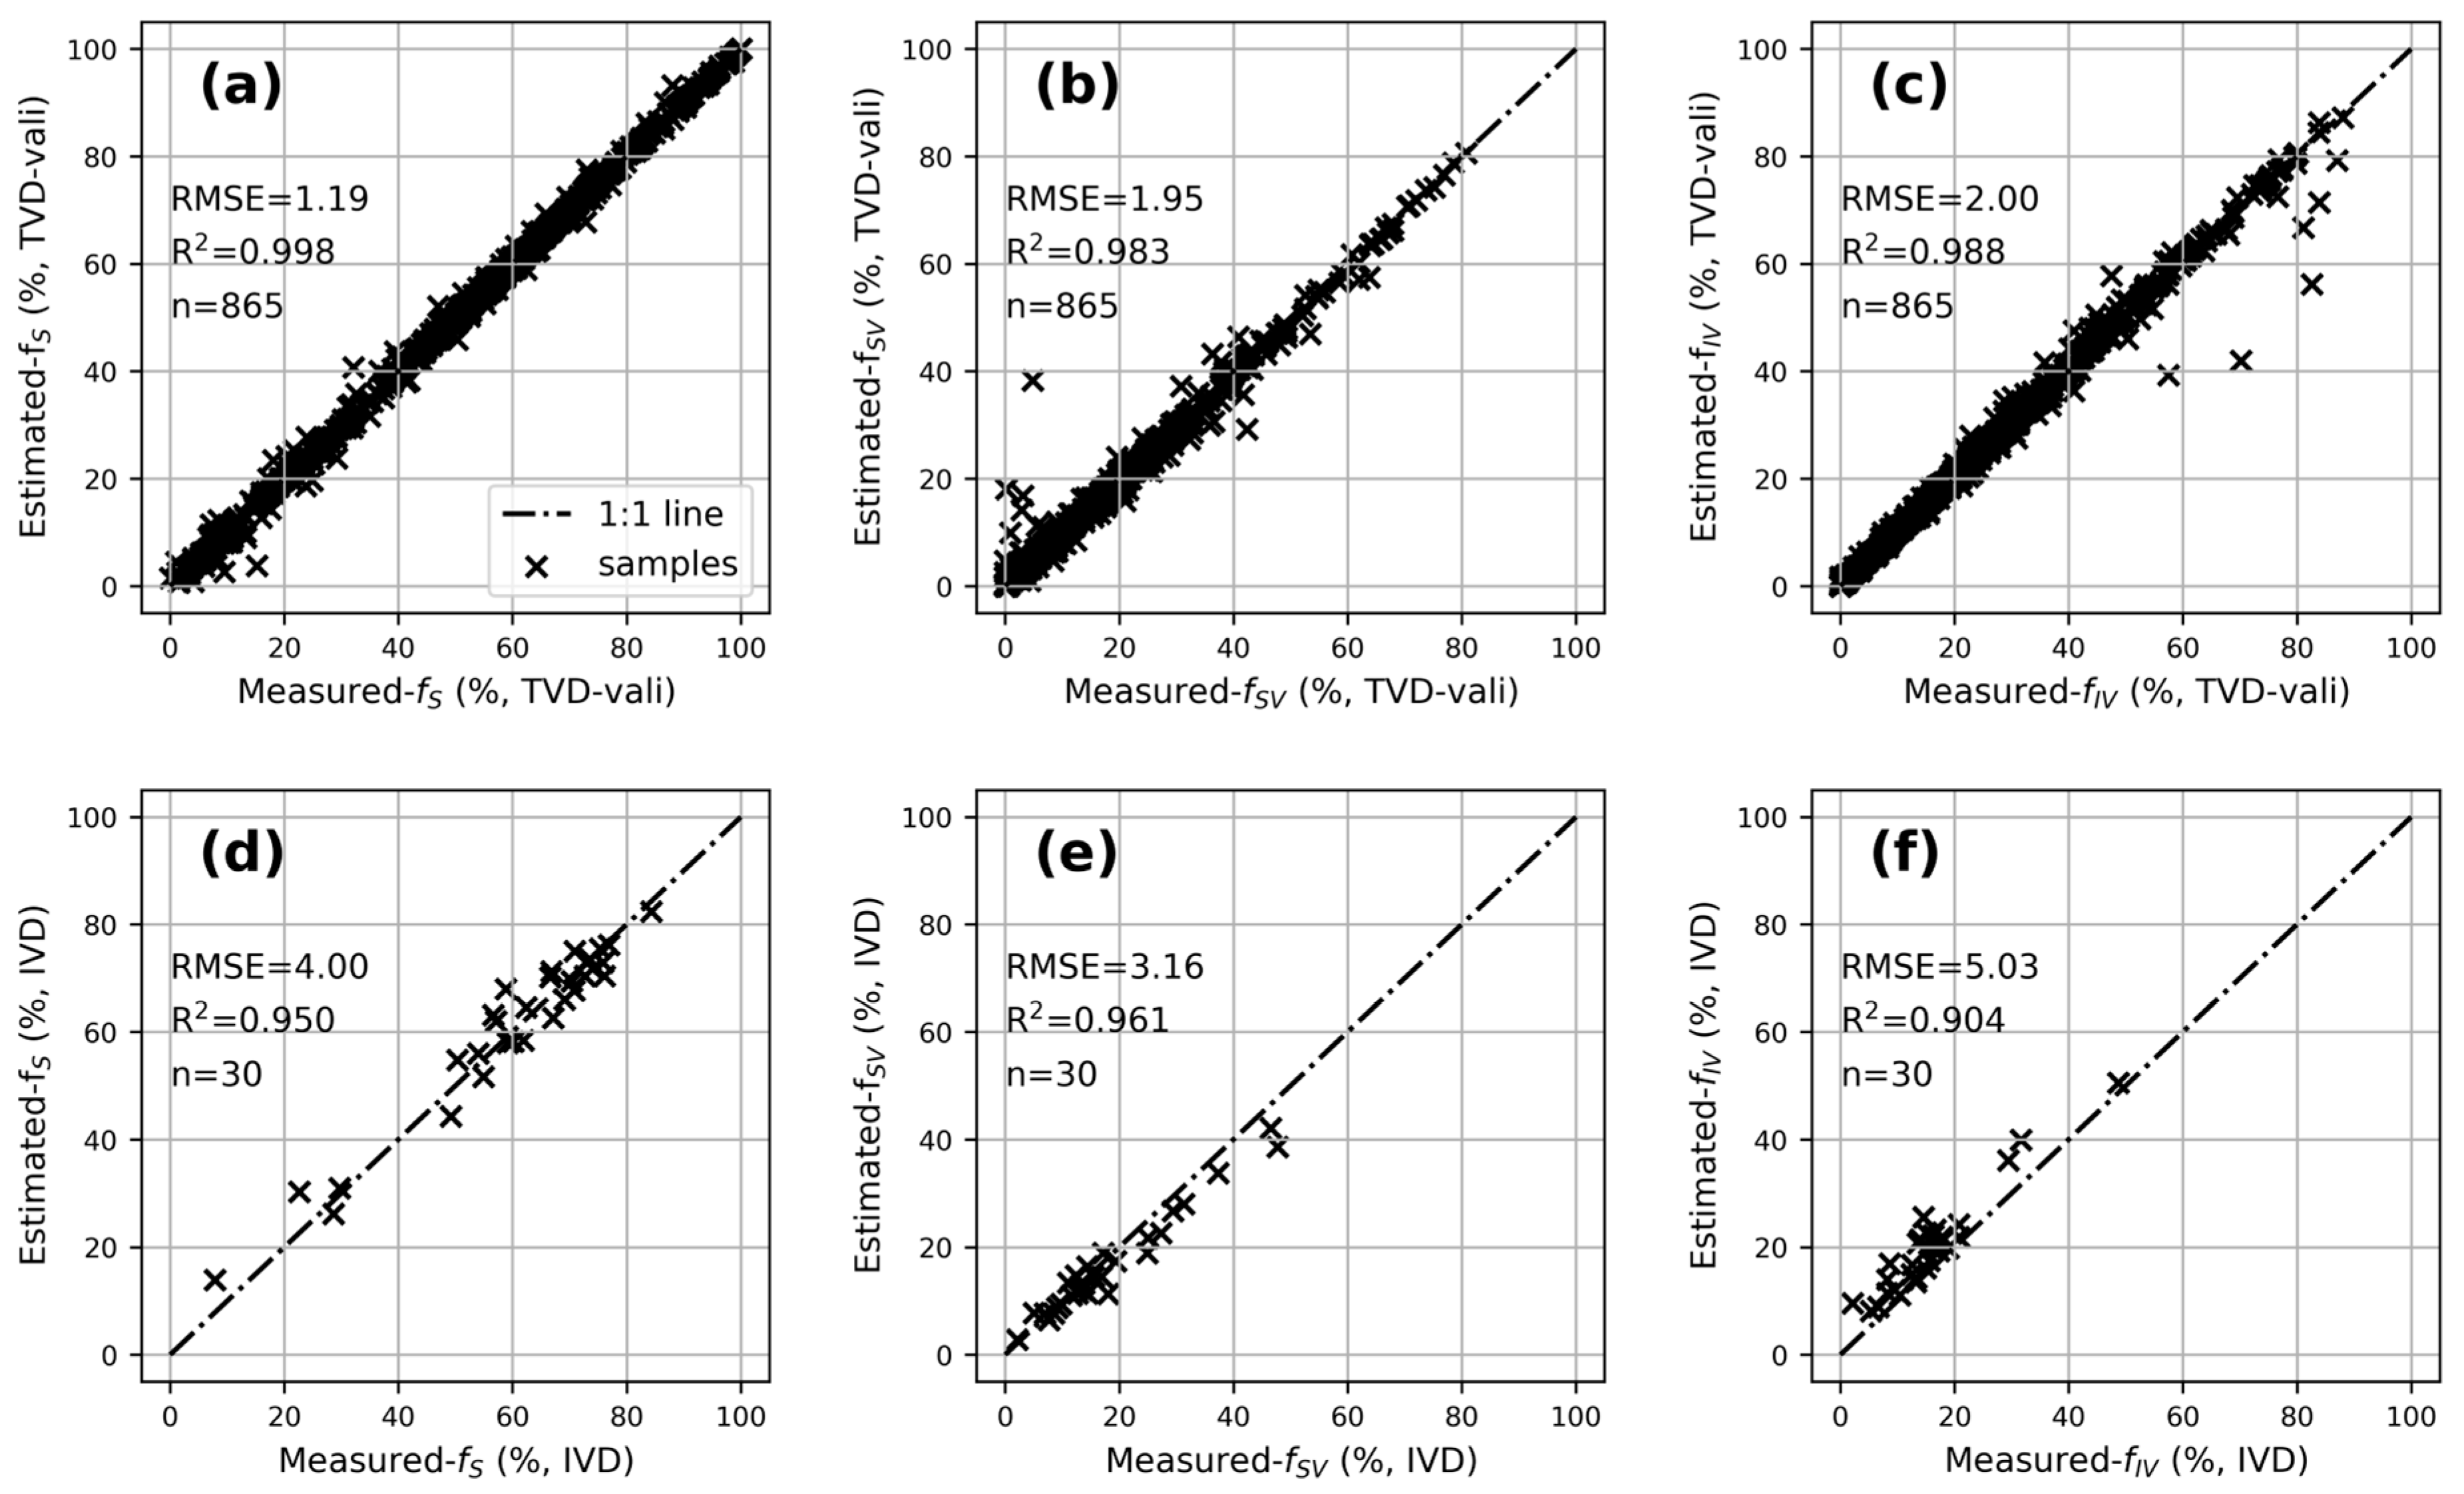
3.3. Segmentation Results and Fractional Coverage Estimation Accuracy Based on CCSNet

This study selected CCSNet for corn canopy image segmentation and fractional coverage estimation of soil, illuminated vegetation, and shaded vegetation. We conducted the soil, illuminated, and shaded vegetation segmentation in corn planting plots using CCSNet and UAV remote sensing (Figure 5). Figure 5 also demonstrates the fractional coverage estimation results of shaded soil, illuminated soil, illuminated vegetation, and shaded vegetation.
Figure 5 illustrates three randomly selected corn canopy images along with their corresponding annotations, predicted segmentation results, and visualizations. The results demonstrate that the CCSNet model, employing ResNet50 as its backbone, effectively segments soil, illuminated vegetation, and shaded vegetation in corn canopy images. To evaluate the precision of fractional coverage estimation, the TVD-vali was used. Figure 6a–c depict the predicted versus observed fractional coverages across all target classes, revealing near-perfect linear correlations (R2 = 0.99 for all categories), indicating an excellent agreement between model outputs and ground truth data. Among the categories, soil fractional coverage exhibited the highest accuracy (RMSE = 1.19%), while shaded and illuminated vegetation showed a comparable performance (RMSE = 1.95% and 2.00%, respectively). Figure 6d–f present scatter plots of predicted versus actual fractional coverages on the independent validation dataset (IVD), where shaded vegetation achieved the best estimation accuracy (RMSE = 3.16%), followed by soil (RMSE = 4.00%), with illuminated vegetation having the lowest accuracy (RMSE = 5.03%). These findings confirm that the CCSNet model provides high-precision fractional coverage estimates for soil, illuminated vegetation, and shaded vegetation, facilitating a detailed analysis of canopy light conditions across different corn planting plots (Figure 6).

4. Discussion

4.1. Advantages of Deep Learning Models in Segmenting and Fractional Coverage Extraction

Traditional remote sensing methods for extracting shadow regions often require the design of complex shadow indices and recognition algorithms [43]. A primary challenge for these methods lies in balancing generalizability and accuracy; for instance, variations in lighting intensity can significantly impact model robustness. In contrast, deep learning models trained on large-scale datasets exhibit superior feature extraction capabilities, leading to improved segmentation accuracy and a stable performance under diverse illumination conditions and complex scene compositions. Unlike conventional segmentation techniques—such as thresholding, clustering, and region growing—that depend on manual feature engineering [15,16,17,18], deep learning architectures (e.g., U-Net, PSPNet, UNetFormer, and CCSNet) automatically learn hierarchical feature representations via data-driven optimization, thereby obviating the need for handcrafted feature design [28].
The proposed CCSNet architecture demonstrates a superior performance compared to both U-Net and PSPNet baselines. By integrating shallow feature extraction with pyramid pooling modules, CCSNet effectively captures robust multi-scale feature representations, enhancing adaptability across diverse corn cultivars and varying field conditions. As shown in Table 3, when implemented with a ResNet50 backbone, CCSNet achieves a high segmentation accuracy and fractional coverage estimation performance, effectively quantifying soil, illuminated vegetation, and shaded vegetation components within corn canopy imagery. Its mean IoU reaches 86.42% on the TVD-vali test set and 70.45% on the independent IVD, marking it as the most accurate model tested. Additionally, CCSNet attains an RMSE range of 3.16% to 5.02% in extracting fractional coverages of soil, illuminated vegetation, and shaded vegetation, indicating its ability to provide highly precise information on canopy light conditions. These capabilities are promising for aiding agricultural experts in selecting high-yield, high-quality corn varieties, as well as for monitoring and analyzing canopy structure dynamics throughout growth, ultimately facilitating optimized light interception and improvements in corn yield and quality.

4.2. Disadvantages of the Proposed Method

The training of deep learning models necessitates extensive manually labeled data to achieve effective segmentation outcomes [44,45,46,47]. Creating a comprehensive dataset requires considerable human effort and time to collect and annotate an adequate number of corn field images, a process that is often labor-intensive and time-consuming. In practical applications, acquiring large-scale, high-quality annotated data faces challenges such as seasonal limitations, climatic variability, and the high costs associated with data acquisition equipment. Moreover, training deep learning models is computationally demanding, necessitating substantial computational resources, which in turn places stringent performance requirements on deployment hardware [48]. Training deep learning models, particularly deep neural networks, demands substantial computational resources, such as high-performance GPUs or TPUs. This requirement can impose significant challenges for research institutions and farmers who lack access to powerful hardware. The training process is often computationally intensive, especially when handling large-scale datasets and complex network architectures, resulting in training times that may range from several hours to multiple days. Moreover, the inference phase, which involves generating predictions during practical use, also requires considerable computational power, potentially limiting the feasibility of deploying such models on cost-effective devices or in field environments. Despite the overall improvements in segmentation performance, the proposed CCSNet model still exhibits relatively low accuracy for certain classes, particularly L0 (shaded soil) and L4 (corn tassel) in the IVD, with accuracies of 75.54% and 68.26%, respectively. The reduced performance for L0 may be attributed to ambiguous boundaries between shaded soil and shaded vegetation, especially under complex lighting conditions. Similarly, the sparse and fine-grained structure of tassels in L4 presents challenges for accurate segmentation. These two categories are agronomically important: L0 is closely related to leaf area index estimation, while L4 plays a key role in early-stage growth monitoring and yield prediction. To address this limitation, future research could explore class-aware attention mechanisms, weighted loss functions, or multi-stage refinement strategies to enhance the discrimination of minority or structurally subtle categories.
Deep learning models are frequently regarded as “black box” systems, characterized by their lack of transparency in decision-making and limited interpretability [47,48,49]. In agricultural applications, users typically aim to understand the reasoning behind model decisions in order to improve the quality of their management practices [50]. The lack of interpretability limits the application of models in these fields. Moreover, the models’ generalization ability depends on the training dataset’s comprehensiveness. The majority of misclassifications occurred between shaded soil and shaded vegetation due to ambiguous textures under low-light conditions. Variations in solar illumination across acquisition days also affected canopy boundary clarity, highlighting the importance of capturing invariant features. To ensure robust performance across diverse geographic regions, cultivation conditions, and corn varieties, comprehensive testing involving additional locations, crops, and growth stages is imperative. Moreover, improving the model’s generalizability requires continuous optimization and iterative refinement based on the insights gained from such extensive evaluations.

5. Conclusions

This study developed a network model called CCSNet to improve the segmentation and fractional coverage estimation of soil, illuminated vegetation, and shaded vegetation in corn fields, using high-definition digital images captured by UAVs. The segmentation outputs can support water stress mapping, leaf area estimation, and tassel phenotyping for cultivar selection, enabling precise fertilization or irrigation strategies in smart agriculture. CCSNet hierarchically integrates low- and high-level visual features, employing pyramid pooling to aggregate multi-scale contextual information. This study compares the performance of established deep learning semantic segmentation methods—namely U-Net, PSPNet, and UNetFormer—with the proposed CCSNet model in the context of corn canopy image segmentation and fractional coverage estimation. The following conclusions are drawn from this investigation:
(1) Deep backbone networks contribute to improved model generalization. For semantic segmentation tasks, models with lighter backbone networks (e.g., MobileNetV2) exhibit poorer feature extraction capabilities compared to those with deeper structures (such as ResNet50).
(2) CCSNet’s combined utilization of low-level features and multi-scale context modeling enables accurate canopy component quantification. In the TVD-vali test, CCSNet achieves an mIoU of 86.42% and PA of 93.58%. The model also achieves a fractional coverage estimation accuracy for soil, shaded vegetation, and illuminated vegetation with an RMSE of 3.16% to 5.02%, outperforming the compared models U-Net and PSPNet.
All experiments were conducted using the specially constructed TVD and IVD. A limitation of this study is that the canopy imagery was collected at a single phenological stage. Future studies will incorporate multiple growth stages to support dynamic monitoring and longitudinal analysis. Additional evaluation across diverse regions and crop types is essential to validate the model’s robustness under varying environmental conditions, growth stages, and corn cultivars. Future research should systematically assess this approach across multiple geographic locations and crop species to confirm its generalizability for canopy component segmentation and fractional coverage estimation.

Author Contributions

Conceptualization, M.S. and X.W.; methodology, M.S.; software, S.Z. and J.Y.; validation, H.F.; formal analysis, S.Z. and Y.L.; investigation, S.Z.; resources, M.S.; data curation, S.Z., J.Y., H.F. and Y.L.; writing—original draft preparation, S.Z. and J.Y.; writing—review and editing, M.S. and X.W.; supervision, X.W.; project administration M.S.; funding acquisition, M.S. All authors have read and agreed to the published version of the manuscript.

Funding

This research was supported by the National Funded Postdoctoral Researcher Program (GZC202307), Key Scientific Research Projects of Universities in Henan Province (25A520027), the National Natural Science Foundation of China (42401438, 42101362, 42371373), the Henan Province Science and Technology Research Project (242102110357), and the National Key Research and Development Program of China (2021YFD2000102, 2022YFD2001104, 2023YFD2000102).

Institutional Review Board Statement

This study involved only observational data and did not involve any handling of animals; therefore, ethical approval was not required.

Data Availability Statement

The datasets generated during and/or analyzed during the current study are available from the corresponding authors on reasonable request.

Acknowledgments

The authors would like to acknowledge Henan Agricultural University; Beijing Forestry University; China Centre for Resources Satellite Data and Application; Beijing Academy of Agriculture and Forestry Sciences; and China Agricultural University and Nanjing Agricultural University for their continuous support of our research, as well as the editors and reviewers for their careful review and valuable suggestions for this article.

Conflicts of Interest

The authors declare no conflicts interests.

Appendix A

To further verify the effectiveness of (1) the deep and shallow feature structure module and (2) the attention module in the proposed CCSNet, we conducted ablation experiments based on the TVD and IVD datasets. The ablation experiments (Exp. 2 and Exp. 3) and corresponding architectures are shown in Figure A1.
Figure A1. Ablation experiment architectures. (a) Exp. 2: CCSNet without a deep–shallow feature structure, (b) Exp. 3: CCSNet without the attention module.
Agriculture 15 01309 g0a1

References

  1. Foley, D.J.; Thenkabail, P.S.; Aneece, I.P.; Teluguntla, P.G.; Oliphant, A.J. A Meta-Analysis of Global Crop Water Productivity of Three Leading World Crops (Wheat, Corn, and Rice) in the Irrigated Areas over Three Decades. Int. J. Digit. Earth 2020, 13, 939–975. [Google Scholar] [CrossRef]
  2. Poole, N.; Donovan, J.; Erenstein, O. Viewpoint: Agri-Nutrition Research: Revisiting the Contribution of Maize and Wheat to Human Nutrition and Health. Food Policy 2021, 100, 101976. [Google Scholar] [CrossRef]
  3. Haque, M.A.; Marwaha, S.; Deb, C.K.; Nigam, S.; Arora, A.; Hooda, K.S.; Soujanya, P.L.; Aggarwal, S.K.; Lall, B.; Kumar, M.; et al. Deep Learning-Based Approach for Identification of Diseases of Maize Crop. Sci. Rep. 2022, 12, 6334. [Google Scholar] [CrossRef] [PubMed]
  4. Liu, Y.; Li, M.; Liu, J.; Deng, S.; Zhang, Y.; Xia, Y.; Liu, B.; Xu, M. Multi-Omics Analysis Reveals the Pivotal Role of Phytohormone Homeostasis in Regulating Maize Grain Water Content. Crop J. 2024, 12, 1081–1092. [Google Scholar] [CrossRef]
  5. Dechant, B.; Ryu, Y.; Badgley, G.; Zeng, Y.; Berry, J.A.; Zhang, Y.; Goulas, Y.; Li, Z.; Zhang, Q.; Kang, M.; et al. Canopy Structure Explains the Relationship between Photosynthesis and Sun-Induced Chlorophyll Fluorescence in Crops. Remote Sens. Environ. 2020, 241, 111733. [Google Scholar] [CrossRef]
  6. Tucker, S.L.; Dohleman, F.G.; Grapov, D.; Flagel, L.; Yang, S.; Wegener, K.M.; Kosola, K.; Swarup, S.; Rapp, R.A.; Bedair, M.; et al. Evaluating Maize Phenotypic Variance, Heritability, and Yield Relationships at Multiple Biological Scales across Agronomically Relevant Environments. Plant Cell Environ. 2020, 43, 880–902. [Google Scholar] [CrossRef]
  7. Marais-Sicre, C.; Queguiner, S.; Bustillo, V.; Lesage, L.; Barcet, H.; Pelle, N.; Breil, N.; Coudert, B. Sun/Shade Separation in Optical and Thermal UAV Images for Assessing the Impact of Agricultural Practices. Remote Sens. 2024, 16, 1436. [Google Scholar] [CrossRef]
  8. Castro-Valdecantos, P.; Apolo-Apolo, O.E.; Pérez-Ruiz, M.; Egea, G. Leaf Area Index Estimations by Deep Learning Models Using RGB Images and Data Fusion in Maize. Precis. Agric. 2022, 23, 1949–1966. [Google Scholar] [CrossRef]
  9. Danilevicz, M.F.; Bayer, P.E.; Boussaid, F.; Bennamoun, M.; Edwards, D. Maize Yield Prediction at an Early Developmental Stage Using Multispectral Images and Genotype Data for Preliminary Hybrid Selection. Remote Sens. 2021, 13, 3976. [Google Scholar] [CrossRef]
  10. Herrmann, I.; Bdolach, E.; Montekyo, Y.; Rachmilevitch, S.; Townsend, P.A.; Karnieli, A. Assessment of Maize Yield and Phenology by Drone-Mounted Superspectral Camera. Precis. Agric. 2020, 21, 51–76. [Google Scholar] [CrossRef]
  11. He, H.; Hu, Q.; Li, R.; Pan, X.; Huang, B.; He, Q. Regional Gap in Maize Production, Climate and Resource Utilization in China. Field Crops Res. 2020, 254, 107830. [Google Scholar] [CrossRef]
  12. Erenstein, O.; Jaleta, M.; Sonder, K.; Mottaleb, K.; Prasanna, B.M. Global Maize Production, Consumption and Trade: Trends and R&D Implications. Food Secur. 2022, 14, 1295–1319. [Google Scholar] [CrossRef]
  13. Song, Y.; Ma, P.; Gao, J.; Dong, C.; Wang, Z.; Luan, Y.; Chen, J.; Sun, D.; Jing, P.; Zhang, X.; et al. Natural Variation in Maize Gene ZmSBR1 Confers Seedling Resistance to Fusarium Verticillioides. Crop J. 2024, 12, 836–844. [Google Scholar] [CrossRef]
  14. Yu, F.; Bai, J.; Fang, J.; Guo, S.; Zhu, S.; Xu, T. Integration of a Parameter Combination Discriminator Improves the Accuracy of Chlorophyll Inversion from Spectral Imaging of Rice. Agric. Commun. 2024, 2, 100055. [Google Scholar] [CrossRef]
  15. Rasti, S.; Bleakley, C.J.; Holden, N.M.; Whetton, R.; Langton, D.; O’Hare, G. A Survey of High Resolution Image Processing Techniques for Cereal Crop Growth Monitoring. Inf. Process. Agric. 2022, 9, 300–315. [Google Scholar] [CrossRef]
  16. Yu, H.; Liu, J.; Chen, C.; Heidari, A.A.; Zhang, Q.; Chen, H.; Mafarja, M.; Turabieh, H. Corn Leaf Diseases Diagnosis Based on K-Means Clustering and Deep Learning. IEEE Access 2021, 9, 143824–143835. [Google Scholar] [CrossRef]
  17. Jin, S.; Su, Y.; Gao, S.; Wu, F.; Hu, T.; Liu, J.; Li, W.; Wang, D.; Chen, S.; Jiang, Y.; et al. Deep Learning: Individual Maize Segmentation from Terrestrial Lidar Data Using Faster R-CNN and Regional Growth Algorithms. Front. Plant Sci. 2018, 9, 866. [Google Scholar] [CrossRef] [PubMed]
  18. Pang, Y.; Shi, Y.; Gao, S.; Jiang, F.; Veeranampalayam-Sivakumar, A.-N.; Thompson, L.; Luck, J.; Liu, C. Improved Crop Row Detection with Deep Neural Network for Early-Season Maize Stand Count in UAV Imagery. Comput. Electron. Agric. 2020, 178, 105766. [Google Scholar] [CrossRef]
  19. Liu, H.; Sun, H.; Li, M.; Iida, M. Application of Color Featuring and Deep Learning in Maize Plant Detection. Remote Sens. 2020, 12, 2229. [Google Scholar] [CrossRef]
  20. Sabri, N.; Shafekah Kassim, N.; Ibrahim, S.; Roslan, R.; Mangshor, N.N.A.; Ibrahim, Z. Nutrient Deficiency Detection in Maize (Zea mays L.) Leaves Using Image Processing. IAES Int. J. Artif. Intell. IJ-AI 2020, 9, 304. [Google Scholar] [CrossRef]
  21. Ao, Z.; Wu, F.; Hu, S.; Sun, Y.; Su, Y.; Guo, Q.; Xin, Q. Automatic Segmentation of Stem and Leaf Components and Individual Maize Plants in Field Terrestrial LiDAR Data Using Convolutional Neural Networks. Crop J. 2022, 10, 1239–1250. [Google Scholar] [CrossRef]
  22. Zhou, J.; Wu, Y.; Chen, J.; Cui, M.; Gao, Y.; Meng, K.; Wu, M.; Guo, X.; Wen, W. Maize Stem Contour Extraction and Diameter Measurement Based on Adaptive Threshold Segmentation in Field Conditions. Agriculture 2023, 13, 678. [Google Scholar] [CrossRef]
  23. Xu, X.; Xu, S.; Jin, L.; Song, E. Characteristic Analysis of Otsu Threshold and Its Applications. Pattern Recognit. Lett. 2011, 32, 956–961. [Google Scholar] [CrossRef]
  24. Miao, Y.; Li, S.; Wang, L.; Li, H.; Qiu, R.; Zhang, M. A Single Plant Segmentation Method of Maize Point Cloud Based on Euclidean Clustering and K-Means Clustering. Comput. Electron. Agric. 2023, 210, 107951. [Google Scholar] [CrossRef]
  25. Mouret, F.; Albughdadi, M.; Duthoit, S.; Kouamé, D.; Rieu, G.; Tourneret, J.-Y. Reconstruction of Sentinel-2 Derived Time Series Using Robust Gaussian Mixture Models—Application to the Detection of Anomalous Crop Development. Comput. Electron. Agric. 2022, 198, 106983. [Google Scholar] [CrossRef]
  26. Krizhevsky, A.; Sutskever, I.; Hinton, G.E. ImageNet Classification with Deep Convolutional Neural Networks. Commun. ACM 2017, 60, 84–90. [Google Scholar] [CrossRef]
  27. Long, J.; Shelhamer, E.; Darrell, T. Fully Convolutional Networks for Semantic Segmentation. IEEE Trans. Pattern Anal. Mach. Intell. 2015, 39, 3431–3440. [Google Scholar]
  28. Ronneberger, O.; Fischer, P.; Brox, T. U-Net: Convolutional Networks for Biomedical Image Segmentation. In Medical Image Computing and Computer-Assisted Intervention—MICCAI 2015, Proceedings of the 18th International Conference, Munich, Germany, 5–9 October 2015; Springer: Cham, Switzerland, 2015; pp. 234–241. [Google Scholar]
  29. Chen, L.-C.; Papandreou, G.; Kokkinos, I.; Murphy, K.; Yuille, A.L. DeepLab: Semantic Image Segmentation with Deep Convolutional Nets, Atrous Convolution, and Fully Connected CRFs. IEEE Trans. Pattern Anal. Mach. Intell. 2018, 40, 834–848. [Google Scholar] [CrossRef]
  30. Gao, G.; Zhang, S.; Shen, J.; Hu, K.; Tian, J.; Yao, Y.; Tian, Q.; Fu, Y.; Feng, H.; Liu, Y.; et al. Segmentation and Proportion Extraction of Crop, Crop Residues, and Soil Using Digital Images and Deep Learning. Agriculture 2024, 14, 2240. [Google Scholar] [CrossRef]
  31. He, K.; Zhang, X.; Ren, S.; Sun, J. Spatial Pyramid Pooling in Deep Convolutional Networks for Visual Recognition. IEEE Trans. Pattern Anal. Mach. Intell. 2014, 37, 1904–1916. [Google Scholar] [CrossRef]
  32. Mavridou, E.; Vrochidou, E.; Papakostas, G.A.; Pachidis, T.; Kaburlasos, V.G. Machine Vision Systems in Precision Agriculture for Crop Farming. J. Imaging 2019, 5, 89. [Google Scholar] [CrossRef] [PubMed]
  33. Zheng, Y.-Y.; Kong, J.-L.; Jin, X.-B.; Wang, X.-Y.; Su, T.-L.; Zuo, M. CropDeep: The Crop Vision Dataset for Deep-Learning-Based Classification and Detection in Precision Agriculture. Sensors 2019, 19, 1058. [Google Scholar] [CrossRef] [PubMed]
  34. Niu, Z.; Zhong, G.; Yu, H. A Review on the Attention Mechanism of Deep Learning. Neurocomputing 2021, 452, 48–62. [Google Scholar] [CrossRef]
  35. Qian, X.; Zhang, C.; Chen, L.; Li, K. Deep Learning-Based Identification of Maize Leaf Diseases Is Improved by an Attention Mechanism: Self-Attention. Front. Plant Sci. 2022, 13, 864486. [Google Scholar] [CrossRef]
  36. Wang, X.; Girshick, R.; Gupta, A.; He, K. Non-Local Neural Networks. In Proceedings of the 2018 IEEE/CVF Conference on Computer Vision and Pattern Recognition, Salt Lake City, UT, USA, 18–23 June 2018; pp. 7794–7803. [Google Scholar]
  37. Wang, L.; Li, R.; Zhang, C.; Fang, S.; Duan, C.; Meng, X.; Atkinson, P.M. UNetFormer: A UNet-like Transformer for Efficient Semantic Segmentation of Remote Sensing Urban Scene Imagery. ISPRS J. Photogramm. Remote Sens. 2022, 190, 196–214. [Google Scholar] [CrossRef]
  38. Jogin, M.; Mohana; Madhulika, M.S.; Divya, G.D.; Meghana, R.K.; Apoorva, S. Feature Extraction Using Convolution Neural Networks (CNN) and Deep Learning. In Proceedings of the 2018 3rd IEEE International Conference on Recent Trends in Electronics, Information & Communication Technology (RTEICT), Bangalore, India, 18–19 May 2018; pp. 2319–2323. [Google Scholar]
  39. Yue, J.; Yang, H.; Feng, H.; Han, S.; Zhou, C.; Fu, Y.; Guo, W.; Ma, X.; Qiao, H.; Yang, G. Hyperspectral-to-Image Transform and CNN Transfer Learning Enhancing Soybean LCC Estimation. Comput. Electron. Agric. 2023, 211, 108011. [Google Scholar] [CrossRef]
  40. Wei, J.; Wang, Q.; Li, Z.; Wang, S.; Zhou, S.K.; Cui, S. Shallow Feature Matters for Weakly Supervised Object Localization. In Proceedings of the 2021 IEEE/CVF Conference on Computer Vision and Pattern Recognition (CVPR), Nashville, TN, USA, 20–25 June 2021; pp. 5989–5997. [Google Scholar]
  41. Hu, J.; Feng, H.; Wang, Q.; Shen, J.; Wang, J.; Liu, Y.; Feng, H.; Yang, H.; Guo, W.; Qiao, H.; et al. Pretrained Deep Learning Networks and Multispectral Imagery Enhance Maize LCC, FVC, and Maturity Estimation. Remote Sens. 2024, 16, 784. [Google Scholar] [CrossRef]
  42. Shen, J.; Wang, Q.; Zhao, M.; Hu, J.; Wang, J.; Shu, M.; Liu, Y.; Guo, W.; Qiao, H.; Niu, Q.; et al. Mapping Maize Planting Densities Using Unmanned Aerial Vehicles, Multispectral Remote Sensing, and Deep Learning Technology. Drones 2024, 8, 140. [Google Scholar] [CrossRef]
  43. Zhai, H.; Zhang, H.; Zhang, L.; Li, P. Cloud/Shadow Detection Based on Spectral Indices for Multi/Hyperspectral Optical Remote Sensing Imagery. ISPRS J. Photogramm. Remote Sens. 2018, 144, 235–253. [Google Scholar] [CrossRef]
  44. You, D.; Wang, S.; Wang, F.; Zhou, Y.; Wang, Z.; Wang, J.; Xiong, Y. EfficientUNet+: A Building Extraction Method for Emergency Shelters Based on Deep Learning. Remote Sens. 2022, 14, 2207. [Google Scholar] [CrossRef]
  45. Ahmed, I.; Ahmad, M.; Khan, F.A.; Asif, M. Comparison of Deep-Learning-Based Segmentation Models: Using Top View Person Images. IEEE Access 2020, 8, 136361–136373. [Google Scholar] [CrossRef]
  46. Emam, Z.; Kondrich, A.; Harrison, S.; Lau, F.; Wang, Y.; Kim, A.; Branson, E. On The State of Data In Computer Vision: Human Annotations Remain Indispensable for Developing Deep Learning Models. arXiv 2021, arXiv:2108.00114. [Google Scholar]
  47. Yue, J.; Li, T.; Feng, H.; Fu, Y.; Liu, Y.; Tian, J.; Yang, H.; Yang, G. Enhancing Field Soil Moisture Content Monitoring Using Laboratory-Based Soil Spectral Measurements and Radiative Transfer Models. Agric. Commun. 2024, 2, 100060. [Google Scholar] [CrossRef]
  48. Chen, C.; Zhang, P.; Zhang, H.; Dai, J.; Yi, Y.; Zhang, H.; Zhang, Y. Deep Learning on Computational-Resource-Limited Platforms: A Survey. Mob. Inf. Syst. 2020, 2020, 8454327:1–8454327:19. [Google Scholar] [CrossRef]
  49. Guidotti, R.; Monreale, A.; Ruggieri, S.; Turini, F.; Giannotti, F.; Pedreschi, D. A Survey of Methods for Explaining Black Box Models. ACM Comput. Surv. 2019, 51, 93. [Google Scholar] [CrossRef]
  50. Yue, J.; Tian, J.; Xu, N.; Tian, Q. Vegetation-Shadow Indices Based on Differences in Effect of Atmospheric-Path Radiation between Optical Bands. Int. J. Appl. Earth Obs. Geoinf. 2021, 104, 102579. [Google Scholar] [CrossRef]
Figure 1. Original images and labels of corn canopies.
Agriculture 15 01309 g001
Figure 2. Methodology framework.
Agriculture 15 01309 g002
Figure 3. CCSNet model architecture: (a) convolutional block attention module; (b) pyramid pooling module.
Agriculture 15 01309 g003
Figure 4. The training results of three segmentation networks using deep backbone networks.
Agriculture 15 01309 g004
Figure 5. Segmentation results of soil, illuminated vegetation, and shaded vegetation in corn planting plot using CCSNet and UAV remote sensing. (a) Digital image. (b) Segmentation results. Note: shaded soil = 18.64%, illuminated soil = 11.30%, shaded vegetation = 27.75%, illuminated vegetation = 36.13%, and tassel = 6.61%.
Agriculture 15 01309 g005
Figure 6. Segmentation results and fractional coverages based on the TVD-vali test set and IVD. Subfigures (ac) correspond to the TVD-vali test set, while subfigures (df) correspond to the IVD dataset. Note: fS, fIV, and fSV = represent the fractional coverage estimation results of soil, illuminated vegetation, and shaded vegetation.
Agriculture 15 01309 g006
Table 1. Labeling criteria and predicting targets for corn canopy images.
LabelPredicting TargetsDescription
Segmentation and ImportanceFractional Coverage
L0Shaded vegetation (high)Shaded vegetation
Illuminated vegetation
Corn leaves not exposed to sunlight.
L1Illuminated vegetation (high)Corn leaves exposed to sunlight.
L2Shaded soil (low)SoilSoil not exposed to sunlight.
L3Illuminated soil (low)Soil exposed to sunlight.
L4Tassel (low)-Corn tassel.
Table 2. Accuracy evaluation results based on the TVD-vali.
ModelU-NetPSPNetUNetFormerCCSNet
BackboneMobilieNetV2ResNet50MobilieNetV2ResNet50MobilieNetV2ResNet50MobileNetV2ResNet50
RecallL084.64 ± 0.96%86.74 ± 0.78%85.32 ± 0.69%90.27 ± 0.94%85.12 ± 0.95%89.56 ± 0.90%89.14 ± 0.86%89.46 ± 0.72%
L188.15 ± 0.67%91.25 ± 0.68%89.04 ± 1.02%93.75 ± 0.78%89.25 ± 0.76%92.67 ± 0.80%91.78 ± 0.65%94.49 ± 0.79%
L290.41 ± 0.78%92.56 ± 0.83%91.67 ± 0.79%94.13 ± 0.83%90.36 ± 0.54%93.23 ± 0.54%91.46 ± 0.54%93.92 ± 0.54%
L393.62 ± 0.56%93.94 ± 0.92%93.21 ± 0.84%95.12 ± 0.75%93.73 ± 0.81%94.56 ± 0.73%92.94 ± 0.74%94.84 ± 0.86%
L478.43 ± 1.24%83.46 ± 0.75%78.70 ± 0.76%87.23 ± 0.68%72.62 ± 0.80%88.75 ± 0.65%84.75 ± 0.63%88.75 ± 0.65%
PA89.32 ± 0.43%91.03 ± 0.67%88.32 ± 0.57%92.75 ± 0.97%89.31 ± 0.79%92.23 ± 0.82%91.34 ± 0.75%93.58 ± 0.76% *
mIoU78.53 ± 0.43%81.42 ± 0.42%77.23 ± 0.83%84.27 ± 0.57%76.32 ± 0.75%84.32 ± 0.55%80.81 ± 0.89%86.42 ± 0.78% *
Note: * The highest mIoU and PA are marked.
Table 3. Performance evaluation based on IVDs.
ModelU-NetPSPNetUNetFormerCCSNet
BackboneMobilieNetV2ResNet50MobilieNetV2ResNet50MobilieNetV2ResNet50MobileNetV2ResNet50
RecallL075.43 ± 0.76%78.71 ± 0.45%71.26 ± 0.78%76.30 ± 0.76%73.48 ± 0.92%77.75 ± 0.86%75.21 ± 0.67%75.54 ± 0.67%
L182.53 ± 0.75%85.04 ± 0.97%82.73 ± 0.56%87.37 ± 0.57%86.46 ± 0.78%87.83 ± 0.79%86.70 ± 0.43%89.87 ± 0.82%
L286.50 ± 0.84%86.78 ± 0.42%86.63 ± 0.73%88.84 ± 0.98%87.36 ± 0.49%88.98 ± 0.65%85.72 ± 0.92%88.43 ± 0.83%
L369.13 ± 0.82%88.97 ± 0.65%85.84 ± 0.89%88.50 ± 0.75%56.79 ± 0.63%75.12 ± 0.89%87.66 ± 0.42%88.40 ± 0.56%
L445.90 ± 1.50%62.34 ± 0.31%48.16 ± 0.90%59.52 ± 1.45%34.58 ± 0.86%69.12 ± 0.96%47.87 ± 0.92%68.26 ± 1.76%
PA80.43 ± 0.97%85.12 ± 0.79%81.51 ± 0.76%85.87 ± 0.81%77.37 ± 0.65%82.57 ± 0.65%82.32 ± 0.74%85.97 ± 0.79% *
mIoU59.43 ± 0.87%68.77 ± 0.52%61.73 ± 0.72%68.92 ± 0.99%54.43 ± 0.78%65.49 ± 0.73%63.56 ± 0.80%70.45 ± 0.54% *
Note: * The highest mIoU and PA are marked.
Table 4. Ablation experiments based on TVD-vali and IVD.
TypeExp. 1Exp. 2Exp. 3
LabelTVD-valiIVDTVD-valiIVDTVD-valiIVD
RecallL089.46%75.54%87.59% 75.75%90.7%78.39%
L194.49%89.87%93.8%88.77%93.13%88.06%
L293.92%88.40%92.54%85.53%93.98%87.86%
L394.84%88.40%95.3%84.96%95.49%89.08%
L488.75%68.26%83.6450.23%88.03%49.95%
PA93.58% *85.97% **92.21%82.88%93.25%85.06%
mIoU86.42% *70.45% **83.83%64.6%84.51%67.51%
Note: * Highest mIoU and PA assessed based on the TVD-vali are labeled; ** highest mIoU and PA assessed based on the IVD are labeled.
Disclaimer/Publisher’s Note: The statements, opinions and data contained in all publications are solely those of the individual author(s) and contributor(s) and not of MDPI and/or the editor(s). MDPI and/or the editor(s) disclaim responsibility for any injury to people or property resulting from any ideas, methods, instructions or products referred to in the content.

