Article

Estimation of Canopy Chlorophyll Content of Apple Trees Based on UAV Multispectral Remote Sensing Images

1
College of Agricultural Engineering, Shanxi Agricultural University, Jinzhong 030801, China
2
Dryland Farm Machinery Key Technology and Equipment Key Laboratory of Shanxi Province, Jinzhong 030801, China
*
Author to whom correspondence should be addressed.
Agriculture 2025, 15(12), 1308; https://doi.org/10.3390/agriculture15121308
Submission received: 25 May 2025 / Revised: 10 June 2025 / Accepted: 13 June 2025 / Published: 18 June 2025
(This article belongs to the Section Digital Agriculture)

Abstract

:
The chlorophyll content is an important index reflecting the growth status and nutritional level of plants. The rapid, accurate and nondestructive monitoring of the SPAD content of apple trees can provide a basis for large-scale monitoring and scientific management of the growth status of apple trees. In this study, the canopy leaves of apple trees at different growth stages in the same year were taken as the research object, and remote sensing images of fruit trees in different growth stages (flower-falling stage, fruit-setting stage, fruit expansion stage, fruit-coloring stage and fruit-maturing stage) were acquired via a DJI MAVIC 3 multispectral unmanned aerial vehicle (UAV). Then, the spectral reflectance was extracted to calculate 15 common vegetation indexes as eigenvalues, the 5 vegetation indexes with the highest correlation were screened out through Pearson correlation analysis as the feature combination, and the measured SPAD values in the leaves of the fruit trees were gained using a handheld chlorophyll meter in the same stages. The estimation models for the SPAD values in different growth stages were, respectively, established through five machine learning algorithms: multiple linear regression (MLR), partial least squares regression (PLSR), support vector regression (SVR), random forest (RF) and extreme gradient boosting (XGBoost). Additionally, the model performance was assessed by selecting the coefficient of determination (R2), root mean square error (RMSE) and mean absolute error (MAE). The results show that the SPAD estimation results vary from stage to stage, where the best estimation model for the flower-falling stage, fruit-setting stage and fruit-maturing stage is RF and those for the fruit expansion stage and fruit-coloring stage are PLSR and MLR, respectively. Among the estimation models in the different growth stages, the model accuracy for the fruit expansion stage is the highest, with R2 = 0.787, RMSE = 0.87 and MAE = 0.644. The RF model, which outperforms the other models in terms of the prediction effect in multiple growth stages, can effectively predict the SPAD value in the leaves of apple trees and provide a reference for the growth status monitoring and precise management of orchards.

1. Introduction

The apple tree is a deciduous arbor plant of Malus in Rosaceae. As an important industrial crop, the apple tree has been widely planted all over the world [1] and the apple fruit is rich in vitamins, minerals and dietary fiber, with high nutritional value [2]. The growth of apple trees is directly related to the quality and yield of the fruits and affects the economic benefits of fruit farmers. Meanwhile, apple trees possess a long growth cycle and present unique physiological and biochemical characteristics in each growth stage, accompanied by great differences in the nutrient demand [3]. As one of the key biochemical molecules in plant leaves, the chlorophyll content serves as a significant index evaluating the health status of plants [4]. The chlorophyll content not only reflects photosynthetic efficiency but also affects such fruit quality characteristics as the color and sweetness and has a direct bearing the growth rate and final yield of plants [5]. Studies have shown that the accurate monitoring of the canopy chlorophyll content of apple trees is of great significance for the timely adjustment of fruit tree fertilization schemes and pest control [6].
The traditional determination of the chlorophyll content mainly depends on field crop sampling and chemical analysis in laboratories [7]; this method is cumbersome, time-consuming, laborious and destructive. Despite the ability to estimate the chlorophyll index of leaves, handheld chlorophyll meters have limited coverage, making it difficult to realize the large-scale and high-frequency monitoring of the growth status of apple trees [8]. With scientific and technological progress, UAV remote sensing platforms and multispectral sensor technology have developed toward the lightweight direction in recent years, contributing to more flexible operation and lower costs and thus having been increasingly widely applied in the agricultural field [9]. UAVs carrying multispectral cameras can remotely acquire high-resolution remote sensing images of crops [10,11,12,13] and extract their growth parameters, such as the leaf chlorophyll, leaf area and nitrogen content [14,15,16], overcoming the destructiveness and small coverage of traditional methods and providing a new means of monitoring the growth and nutritional status of crops.
At present, the multispectral technology of UAVs has been developed rapidly in crop monitoring in China and abroad. Huo Y Q et al. [17] extracted the change rate of adjacent channels and 23 vegetation indexes as eigenvalues via remote sensing images based on UAV multispectral technology, established eight machine learning algorithm models, and estimated the canopy SPAD value in a kiwi orchard, and the coefficient of determination (R2 value) of the best model reached 0.787. Samarakoon et al. [18] monitored the leaf nitrogen content in a coconut plantation with UAVs carrying multispectral cameras, extracted key vegetation indexes from multispectral images and performed a correlation analysis with the measured leaf nitrogen content on the ground, and they found that the normalized differential red edge (NDRE) index and chlorophyll index (CI) can be effective indexes for measuring the nitrogen concentration in coconut leaves. Zhou Q et al. [19] screened variables using UAV multispectral data, monitored the chlorophyll content of winter wheat in the whole growth stage via a BP neural network model, and discovered that the multidate CNN model can realize optimal yield prediction performance, with the R2 value reaching 0.73. Zhou et al. [20] studied the yield prediction model of multi-variety rice by combining multispectral remote sensing images of UAVs with deep learning algorithms. Yin et al. [21] improved the estimation accuracy of the SPAD value of wheat leaves in different growth stages by optimizing the UAV flight strategy and combining various feature selection and machine learning algorithms. Based on the characteristics of the complex apple canopy structure, long growth cycle and high spatial heterogeneity, combined with multispectral remote sensing images of UAVs used to monitor the growth of apple trees in different stages, it is possible to master the water and fertilizer status, nutritional status and plant diseases and insect pests of fruit trees in a real-time manner. Additionally, fruit trees can be scientifically managed and cultivated, elevating the yield of apples, improving the fruit quality, reducing the production cost and optimizing the refined management of orchards. However, the estimation of the canopy chlorophyll content of apple trees in different growth stages based on UAV multispectral remote sensing images has not been fully investigated in China and abroad.
In summary, much existing research mainly focuses on annual crops such as corn and wheat. This study targets apple trees, which, as perennial woody plants, have longer phenological periods and more complex physiological processes, making staged modeling more essential. Therefore, this study aims to explore the application of UAV multispectral imaging technology combined with machine learning models in the estimation of the canopy chlorophyll content of apple trees, evaluate the growth status of apple trees and provide a scientific basis and technical support for the refined management and efficient production of apple trees. Specifically, canopy spectral images of apple trees were acquired via a UAV carrying multispectral sensors, different vegetation indexes were extracted from the spectral reflectance data of the canopies in such images, and the combination applicable to the prediction of the SPAD value for apple trees was determined through a comparative analysis; combining the leaf SPAD values measured in the field, prediction models were, respectively, established in five different growth stages using five common modeling algorithms: multiple linear regression (MLR), partial least squares regression (PLSR), support vector regression (SVR), random forest (RF) and extreme gradient boosting (XGBoost). Then, the accuracy of each model was evaluated and analyzed via the coefficient of determination (R2), root mean square error (RMSE) and mean absolute error (MAE). The feature selection part of the research combines physiological indicators and uses specific combinations of vegetation indices. By comparing the performances of multiple algorithms at different stages, the optimal algorithm can be recommended for different growth stages, which is of great help for practical applications.

2. Materials and Methods

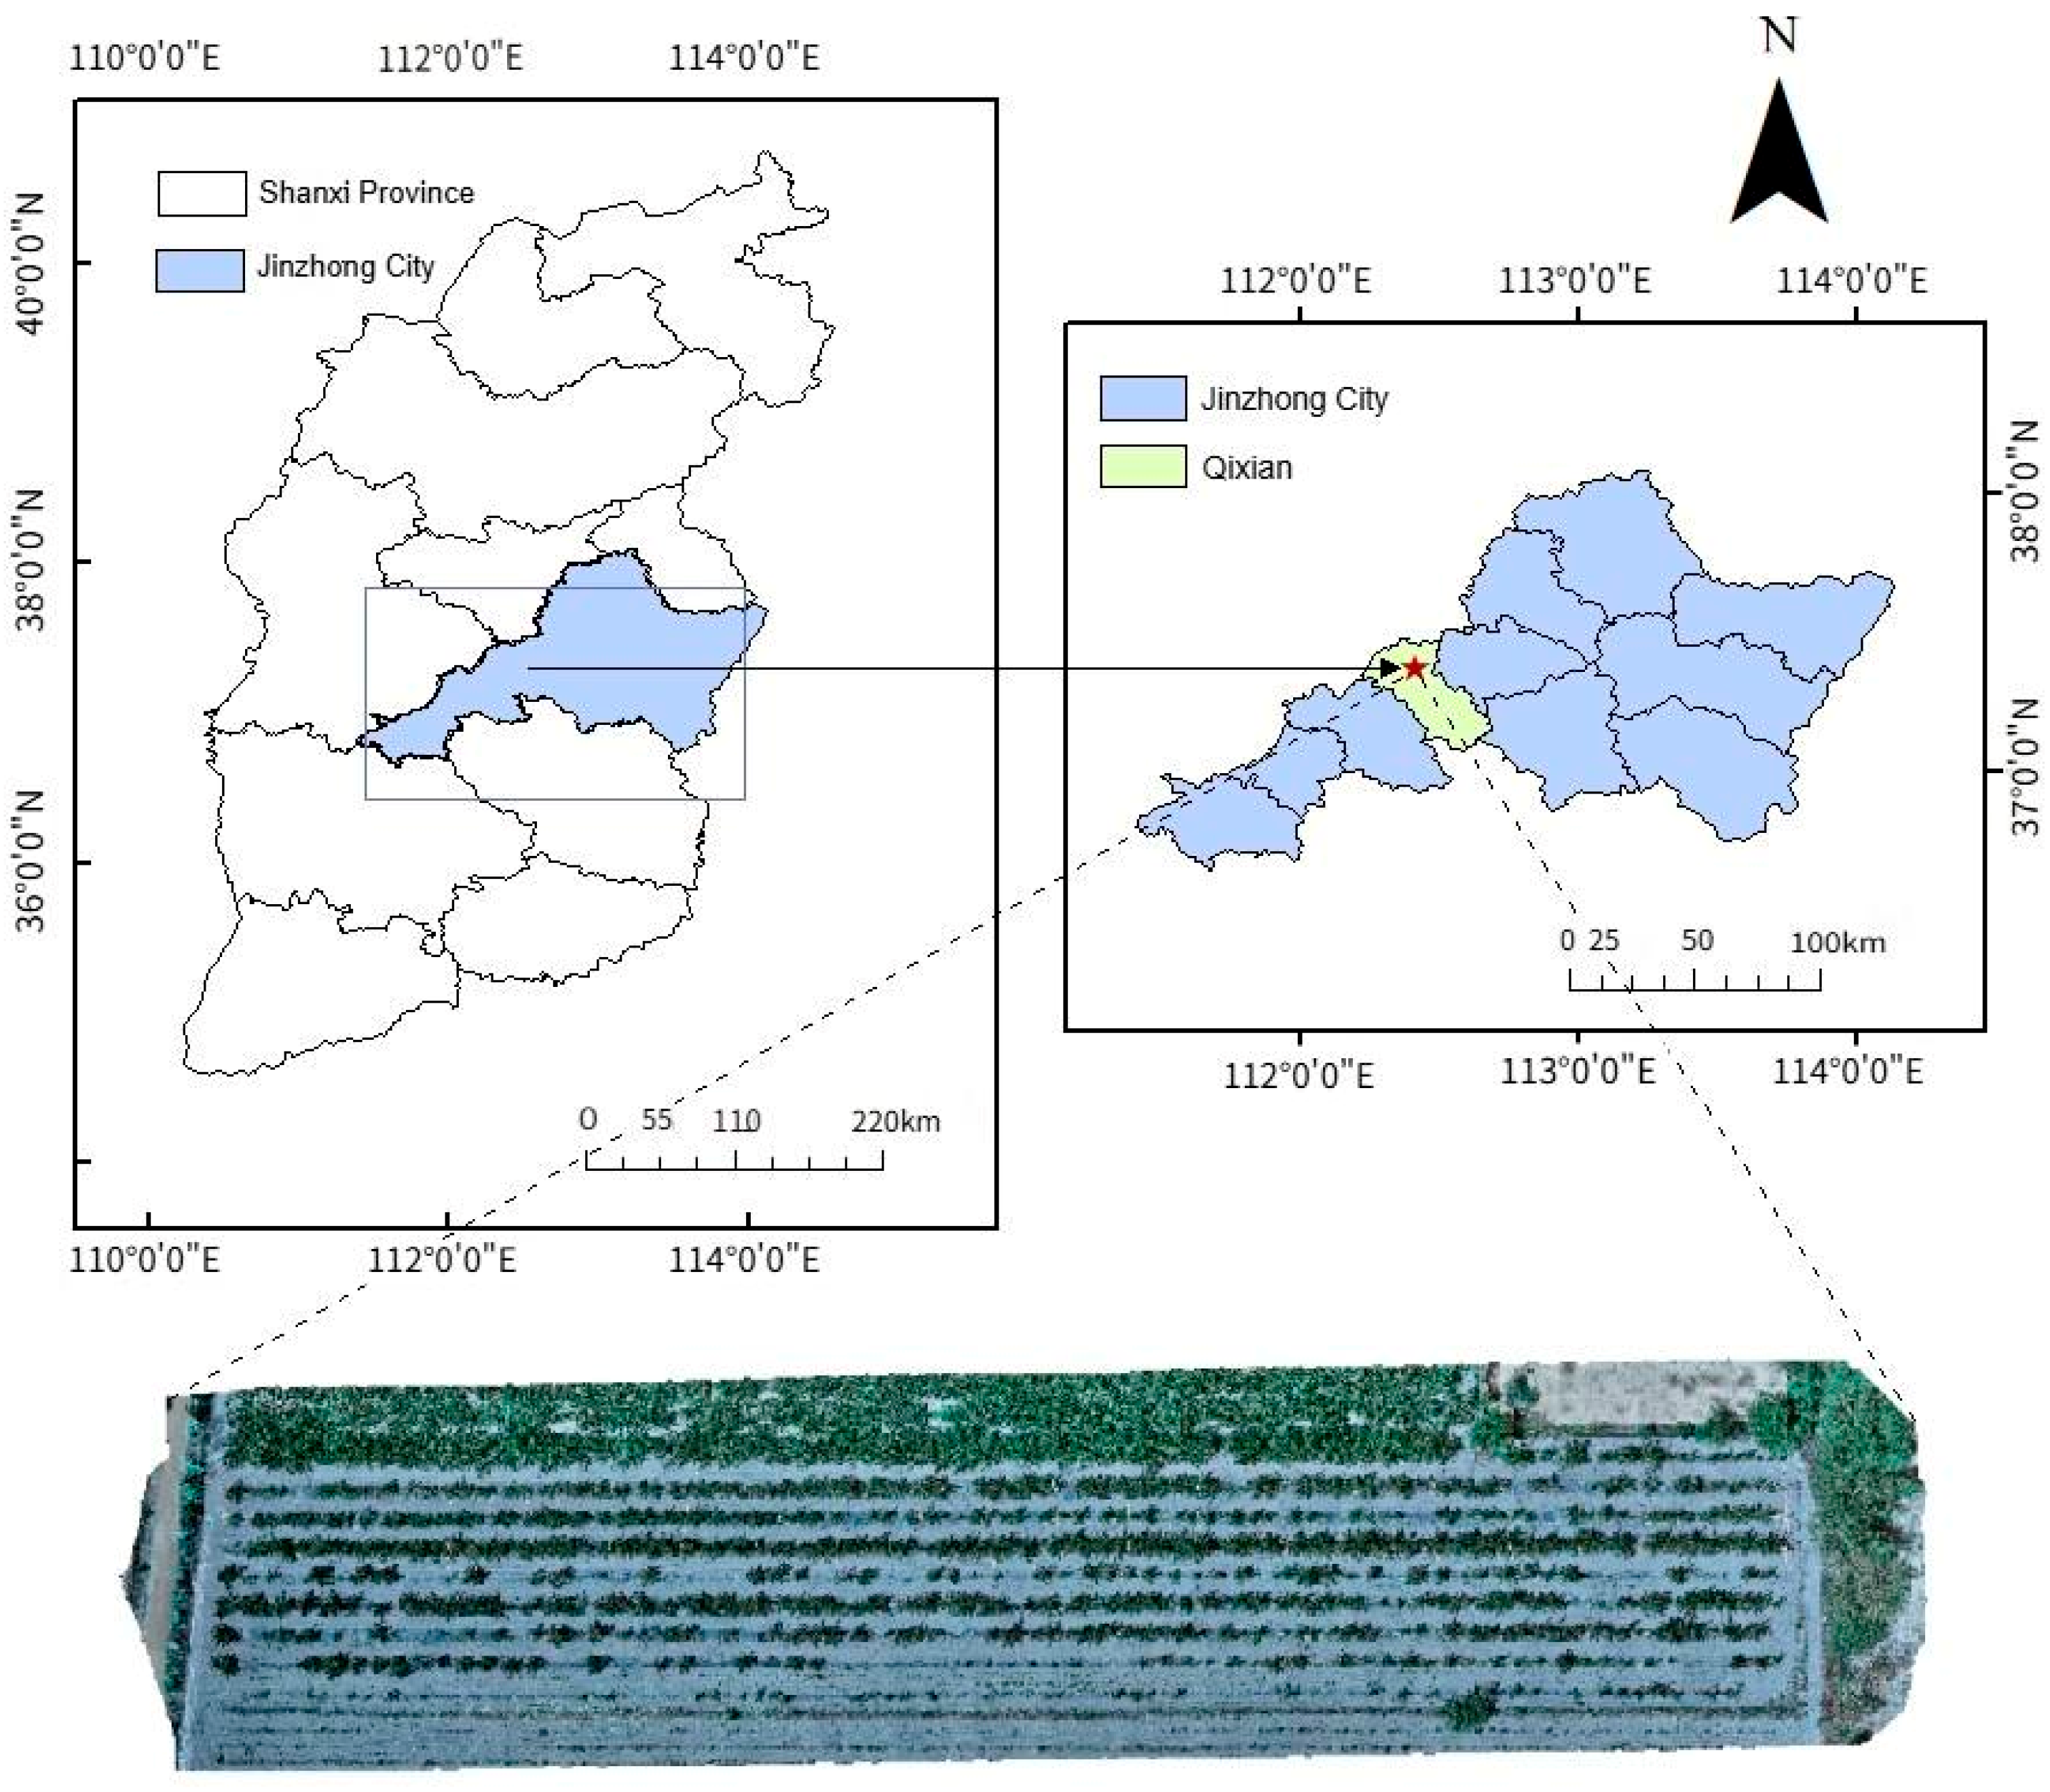
2.1. Study Area and Experimental Design

The experimental area is the Fruit Research Institute of Shanxi Agriculture University, and the planting area of apple trees is about 0.73 hectares (Figure 1). The experimental area is seated in hilly and mountainous areas, belonging to a temperate monsoon climate, with distinct changes in the four seasons, a mild climate, a great temperature difference between day and night, an uneven distribution of precipitation (annual precipitation of about 500–600 mm), a frost-free period of about 160–180 days, abundant sunshine (annual sunshine duration of 2500–2800 h), an annual average temperature of (11 ± 1) °C, and fertile soil and high organic matter content. All these conditions make it suitable for the growth of multi-variety crops. In addition, the forest coverage reaches 29.3%, where the fruit planting area is about 1933 hectares, with the main fruit varieties of yulu fragrant pear, apple and Chinese date.
During the experiment, the orchard was divided into several areas, in each of which a total of 55 representative apple tree samples were chosen according to the principle of a complete canopy and consistent management level, aiming to cover different tree trends, and the latitude and longitude of each sample fruit tree were recorded by GPS for tag hanging and marking. The chlorophyll content of the canopy leaves of sample fruit trees was collected by a handheld chlorophyll meter in the flower-falling stage on 10 May, fruit-setting stage on 30 June, fruit expansion stage on 2 August, fruit-coloring stage on 1 September, and fruit-maturing stage on 7 October 2024, and remote sensing images of the orchard were obtained by a UAV carrying multispectral cameras in the same stages.

2.2. Data Acquisition and Processing

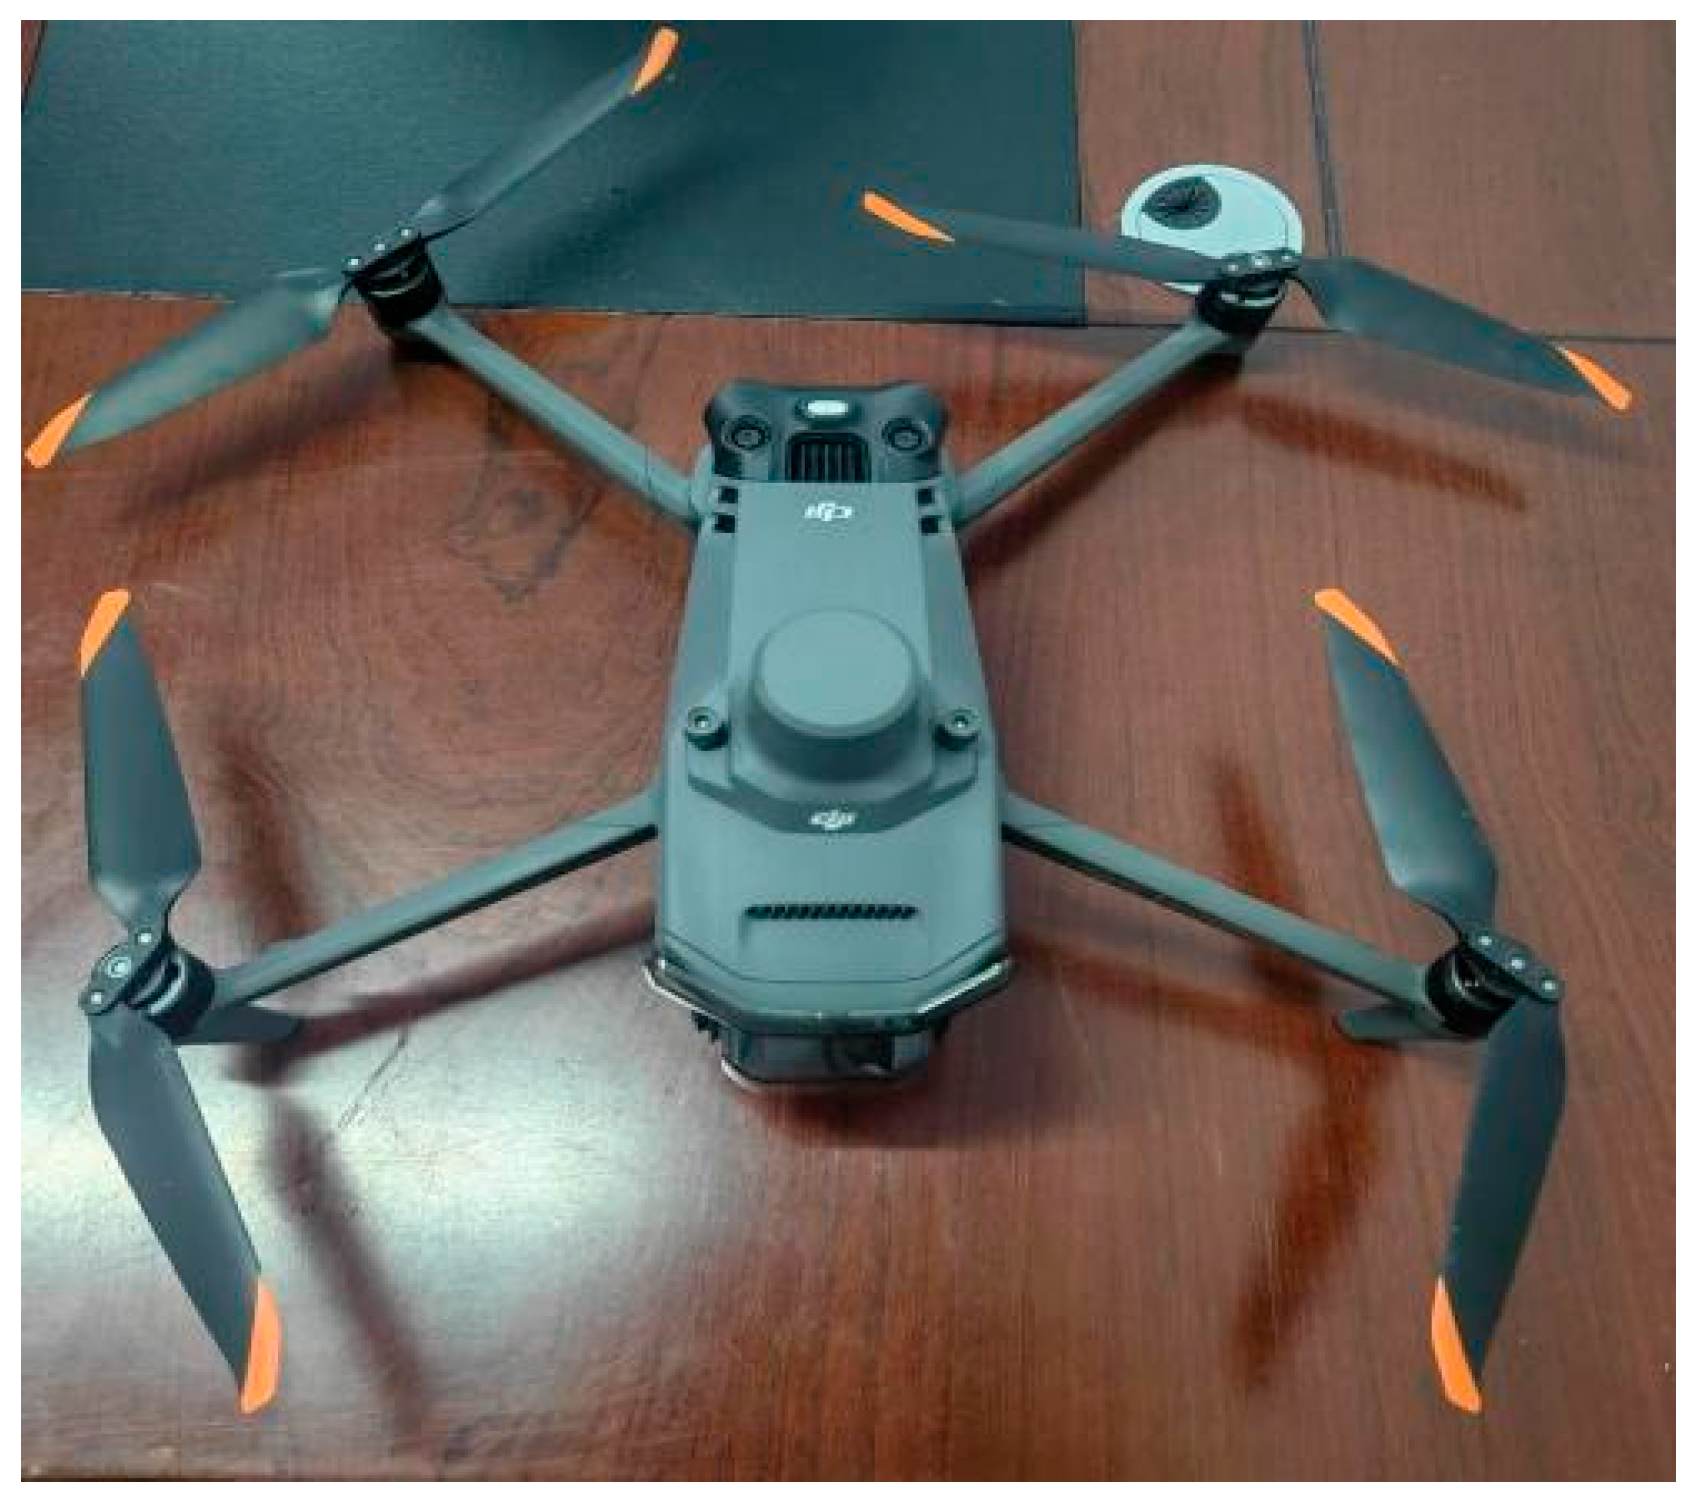
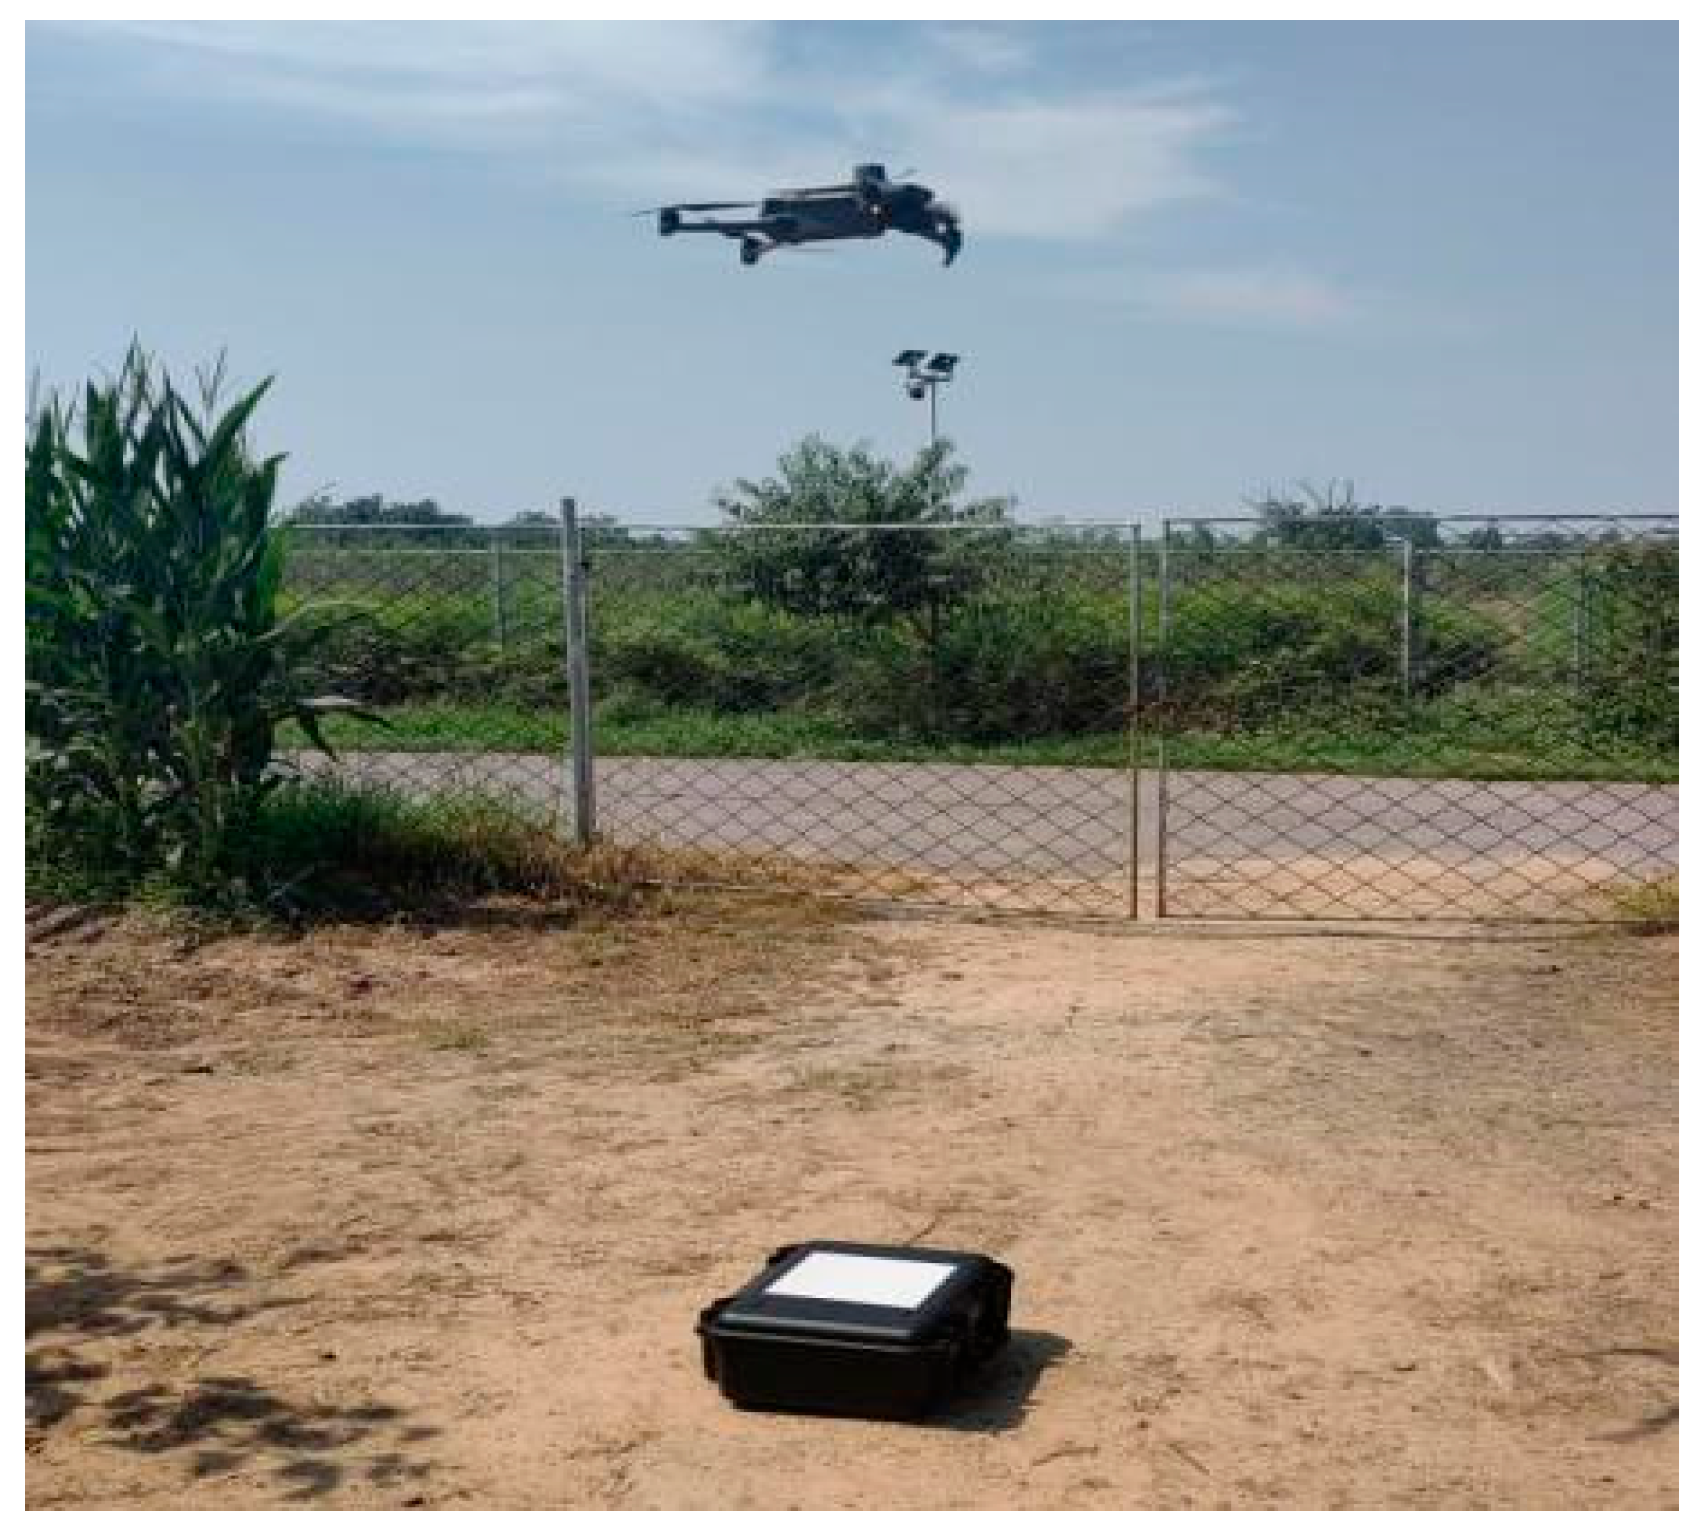
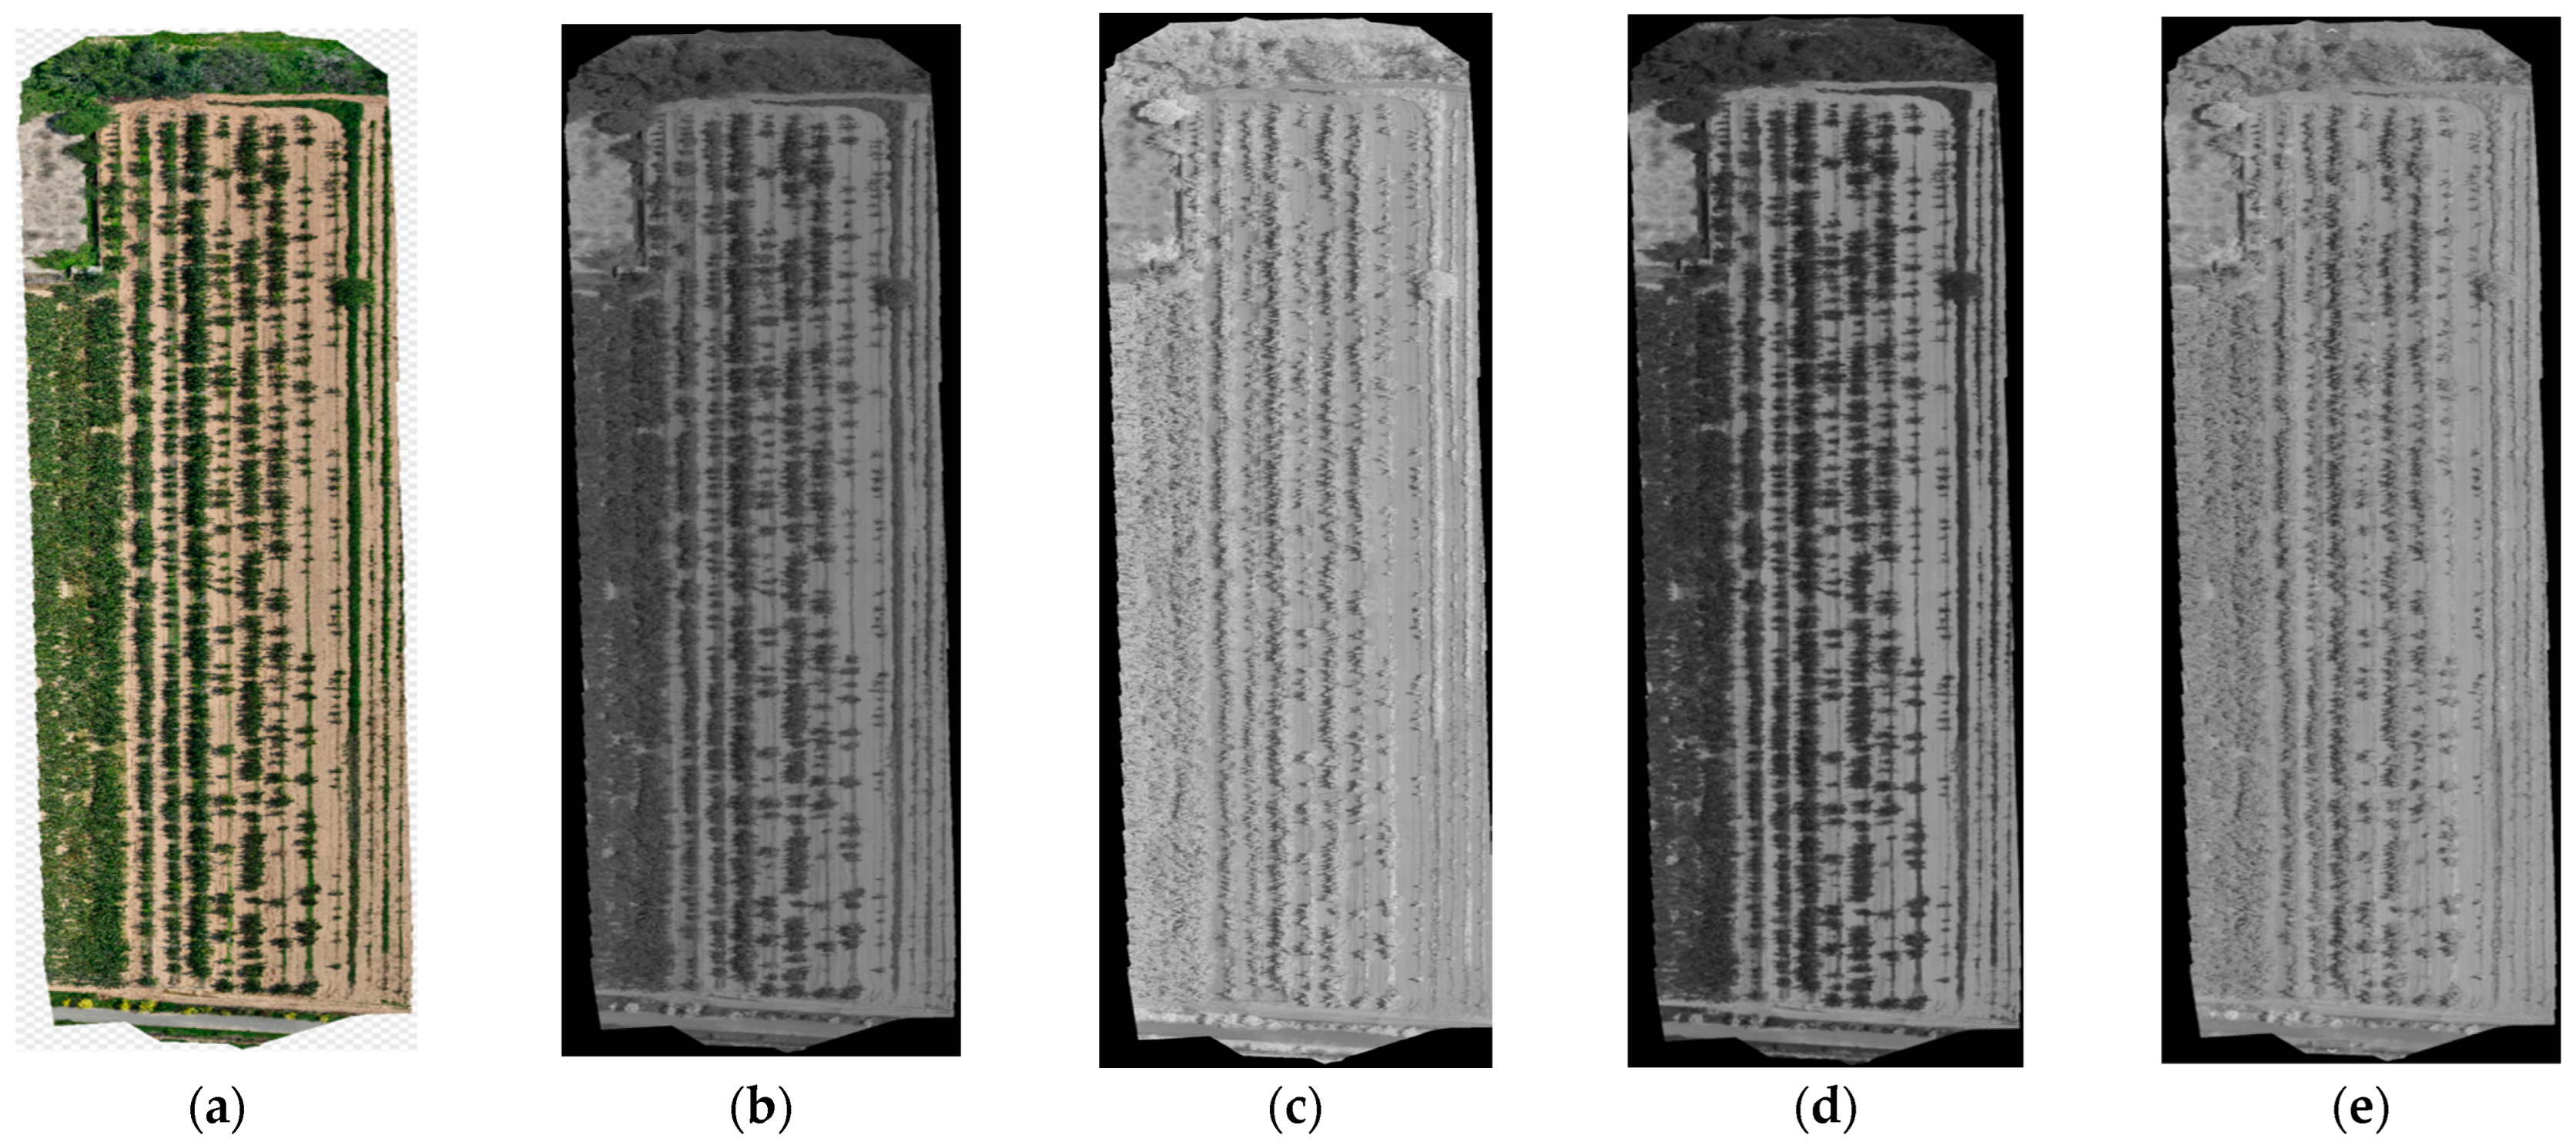
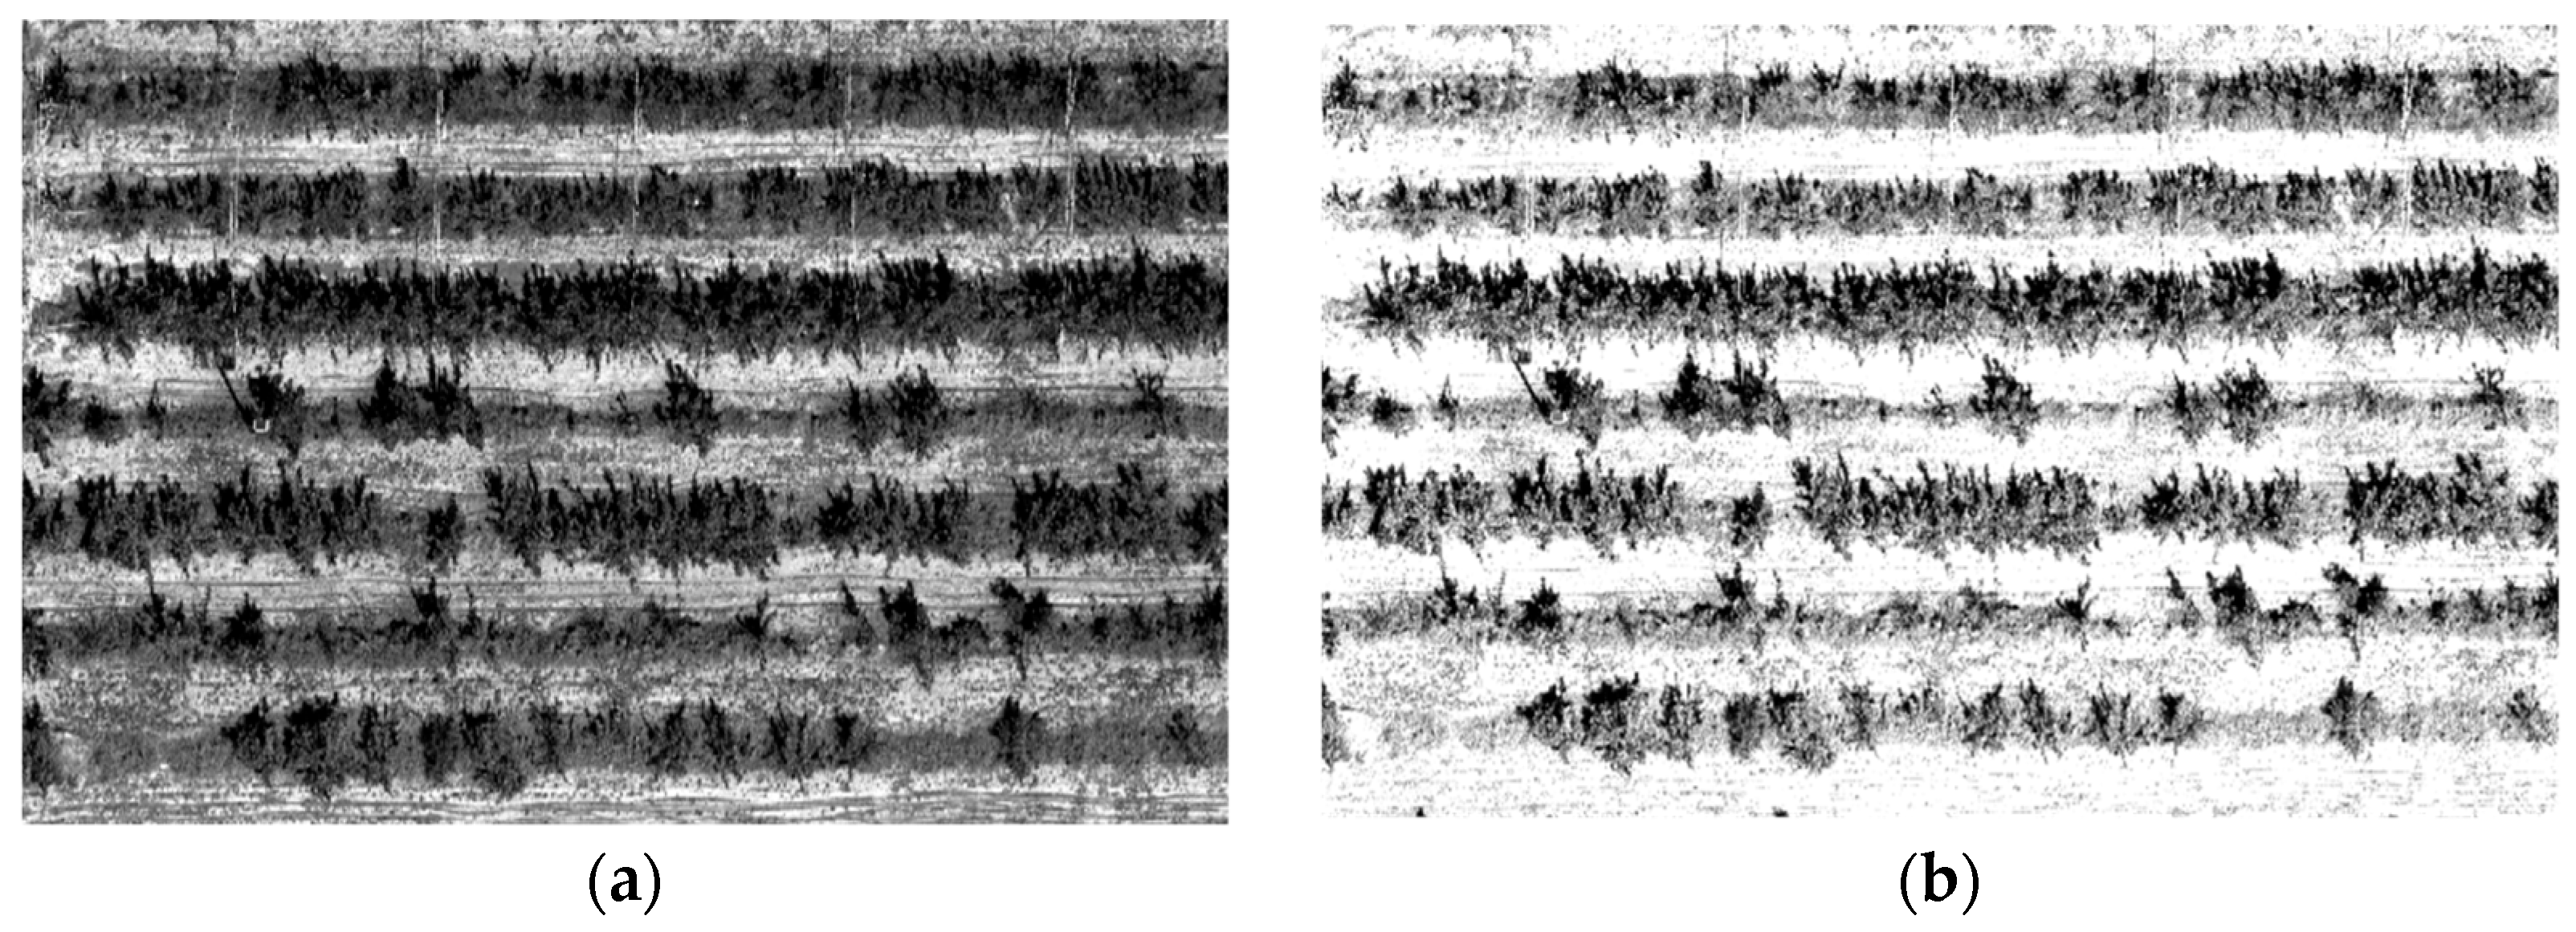
2.2.1. Multispectral Data Acquisition and Processing

In the experiment, images of the fruit tree canopies were shot using a DJI Mavic 3 multispectral UAV (DJI Innovation Technology Company, Shenzhen, China) as the remote sensing platform (Figure 2). It is small and portable, easy to fold and store, with a maximum ascending speed of 6 m/s, maximum horizontal flight speed of 15 m/s and maximum wind-resistant speed of 12 m/s; the machine is equipped with an RTK module, which can realize centimeter-level high-precision positioning, and the flight control, camera and RTK module are synchronized at the microsecond level, so as to accurately obtain the position information of each camera imaging center. The machine body is equipped with multiple wide-angle visual sensors, which can accurately detect obstacles in all directions and realize omni-directional obstacle avoidance. Meanwhile, the UAV has a 20-megapixel, 4/3-inch CMOS visible light image sensor and four 5-megapixel, 1/2.8-inch CMOS multispectral image sensors, and the four spectral channels and wavelength ranges of the multispectral image are as follows: green: 560 nm ± 16 nm; red: 650 nm ± 16 nm; red edge: 730 nm ± 16 nm and near infrared (NIR): 860 nm ± 26 nm. The image-supported format is JPEG (visible light camera) + TIFF (multispectral camera).
The images were shot by the UAV during 11:00–13:00 a.m. when it was clear, less cloudy and windless, ensuring the flight safety and stability of the UAV. The flying height was set to 30 m, the fore-and-aft overlap rate to 80%, and the lateral overlap rate to 70%, and the take-off point and landing point of the UAV when shooting each time were in an open and flat area. In the experimental area, multispectral images of apple trees in the five key growth stages were acquired, and the shooting time and image data are listed in Table 1. A piece of 0.2 m × 0.2 m gray board image with a reflectance of 50% was gained in the same stage for radiation calibration of the multispectral images. The reflectance of the gray board for the green light, red light, red edge and NIR central wavelengths is exhibited in Table 2. After the gray board was horizontally placed in the experiment, the UAV was operated to shoot the gray board image at a height of 2 m perpendicular to the gray board (Figure 3).
A single image obtained by the multispectral image acquisition system of the UAV failed to cover the whole experimental area, so several original orchard remote sensing images collected at one time were imported into the DJI Terra 3.9 software (DJI Terra, DJI Innovation Technology Company, Shenzhen, China). At the same time, the remote sensing images were easily influenced by external environmental factors, such as sunlight and atmospheric conditions. Therefore, the radiation correction module of the DJI Zhitu software was used to import the reflectance gray board images and input reflectance data of each band for radiation correction to eliminate the influence of the solar altitude angle, light conditions and sensor response differences on the remote sensing images. The two-dimensional reconstruction and radiation correction of the remote sensing images were realized by DJI Terra, and finally, a complete remote sensing image, including one RGB image and four multispectral bands, was obtained. The spliced image is shown in Figure 4.
The reflection spectrum of the plant canopy is affected by the soil background in the reconstructed spectral image (Figure 4). Given that the model estimation accuracy can be improved by eliminating the soil background [22], the soil background in the spliced multispectral image was eliminated using the threshold segmentation method of the ENVI5.6 software (Harris Geospatial Solutions, Boulder, CO, USA). The multispectral image before and after eliminating the soil background is displayed in Figure 5.

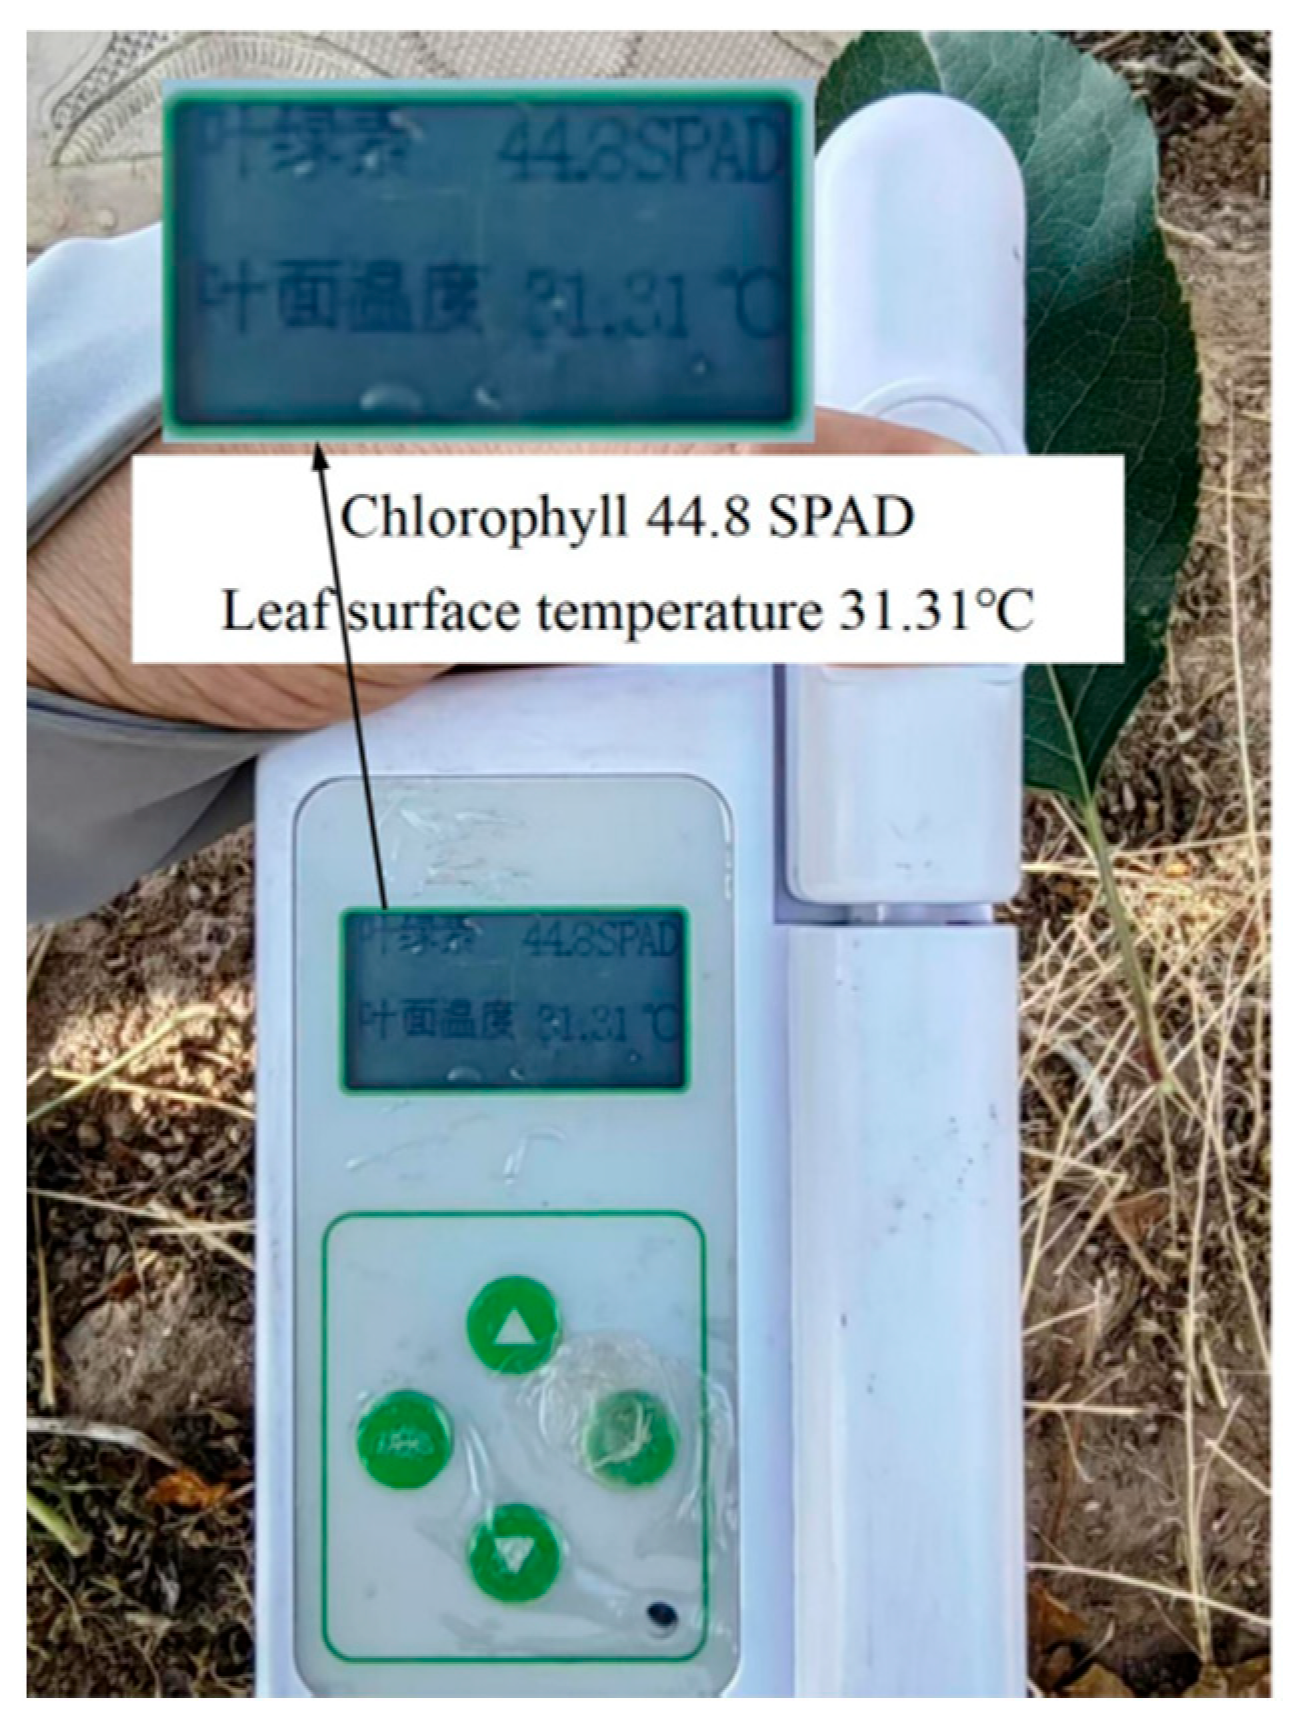
2.2.2. Determination of SPAD Value

It is well known that the chlorophyll content of fruit tree leaves is time-sensitive. Therefore, the chlorophyll content of leaves should be acquired in the experimental area synchronously with the acquisition of the multispectral image by the UAV. Xue X et al. [23] experimentally studied the chlorophyll content of wheat leaves and held that the SPAD value presents an extremely significant positive correlation with the chlorophyll content of plant leaves and the SPAD value in fruit tree leaves can be measured via a handheld chlorophyll meter (TYS-A, Beijing JKLD Electronic Technology Co., Ltd., Beijing, China). During the experiment, 3 healthy and disease- and insect-pest-free leaves were, respectively, sampled in 4 directions—east, west, south and north—of each fruit tree sample, each leaf was measured 3 times while avoiding the leaf vein (Figure 6), and finally 36 SPAD readings were averaged to represent the chlorophyll content of a single fruit tree, and a total of 55 such samples were collected.

2.3. Selection and Calculation of Vegetation Indexes

Based on the spectral response characteristics of chlorophyll’s strong absorption in the red light band, high reflection in the near-infrared band and sensitive displacement in the red-edge region, combined with the strong correlation of the SPAD value (chlorophyll relative content) with the leaf physiological structure and optical parameters, 15 vegetation indexes were screened and calculated to estimate the chlorophyll content of apple canopy leaves according to the reflectance data of apple canopies in four bands—green light, red light, red edge and near infrared band—obtained by the multispectral camera. The names and calculation formulas of these vegetation indexes are shown in Table 3.

2.4. Modeling

When estimating the chlorophyll content of apple trees in different growth stages, five regression algorithm models were adopted: MLR [33], PLSR [34], SVR [35], RF [36], and XGBoost [37]. Meanwhile, the hyperparameters were optimized using GridSearchCV and K-fold cross-validation during model training to acquire the best parameter combination and gain more robust model estimation results.
Multiple linear regression (MLR) is an extension of simple linear regression. It models the linear relationship between a single dependent variable and multiple independent variables and fits the regression curve through the multi-dimensional space of data points. In this paper, the vegetation index is the independent variable, and the measured SPAD values of apple trees represent the dependent variable.
Partial least squares regression (PLSR), compared with multiple linear regression, adds the characteristics of principal component analysis (PCA) and canonical correlation analysis (CCA), and it establishes a prediction model through dimensionality reduction and regression analysis. It can solve problems such as the non-normal distribution of data, too few samples, and uncertainty of the factor structure.
Support vector regression (SVR) is a regression model based on support vector machine (SVM). By adjusting the kernel function and parameters, different types of data distributions can be adapted. Through a grid search and 5-fold cross-validation, the hyperparameters of the SVR model were selected as kernel = “poly”, C = 0.1 and epsilon = 0.1.
Random forest (RF) is an ensemble learning algorithm based on decision trees. By combining multiple decision trees (weak learners), it utilizes bagging and feature randomization to enhance the generalization ability and robustness of the model. Through a grid search and 5-fold cross-validation, the hyperparameters of the RF model were selected as max_depth = 7, min_samples_leaf = 5, min_samples_split = 5 and n_estimators = 10.
Extreme gradient boosting (XGBoost) is based on the gradient boosting decision tree (GBDT) algorithm and makes predictions by integrating multiple decision trees. In the training process of the model, a new decision tree is added in each round of iteration to reduce the residuals between the predicted values and the true values of the previous round of the model, relying on the integration effect of multiple decision trees. Through a grid search and 5-fold cross-validation, the hyperparameters of the XGBoost model were selected as gamma = 0.3, learning_rate = 0.2, max_depth = 10, n_estimators = 30, and reg_lambda = 0.1.

2.5. Evaluation Indicators

A total of 55 tree samples collected in each stage were randomly divided into the training set and validation set according to the ratio of 7:3, and finally, 38 training samples and 19 validation samples were obtained. Hyperparameter optimization was performed via a grid search and cross-validation during model training to enhance the generalization performance of the models. The model accuracy was evaluated using the R2, RMSE, and MAE, where the R2 indicates the degree of fitting between the estimated value and measured value of each sample, with a value range of 0–1. The closer the value to 1, the better the degree of data fitting, and the higher the data estimation accuracy. The RMSE measures the actual deviation between the estimated value and measured value of data, the magnitude of the error is kept consistent with that of the original data to facilitate understanding, and the smaller the RMSE value, the better the model prediction performance. The MAE refers to the mean value of the absolute values of all the errors and provides the overall error value. The closer the values of the RMSE and MAE to 0, the better the model effect. The R2 is calculated as per the following formula:
R 2 = 1 i = 1 n y i y ^ i 2 i = 1 n y i y ¯ i 2
where i is the i-th sample; n is the sample size; y i represents the true value of the i-th sample; y ^ i is the value of the i-th sample estimated by the model; and y ¯ is the mean value of the true values of all the samples.
The RMSE is solved as follows:
R M S E = 1 n i = 1 n y i y ^ i 2
The MAE is calculated through the following formula:
M A E = 1 n i = 1 n y ^ i y i

2.6. Data Processing

The vegetation indexes and the SPAD values in the canopy leaves of apple trees were subject to correlation analysis using the Pearson correlation coefficient (PCC) in SPSS 26.0 (IBM, Armonk, NY, USA).

3. Results

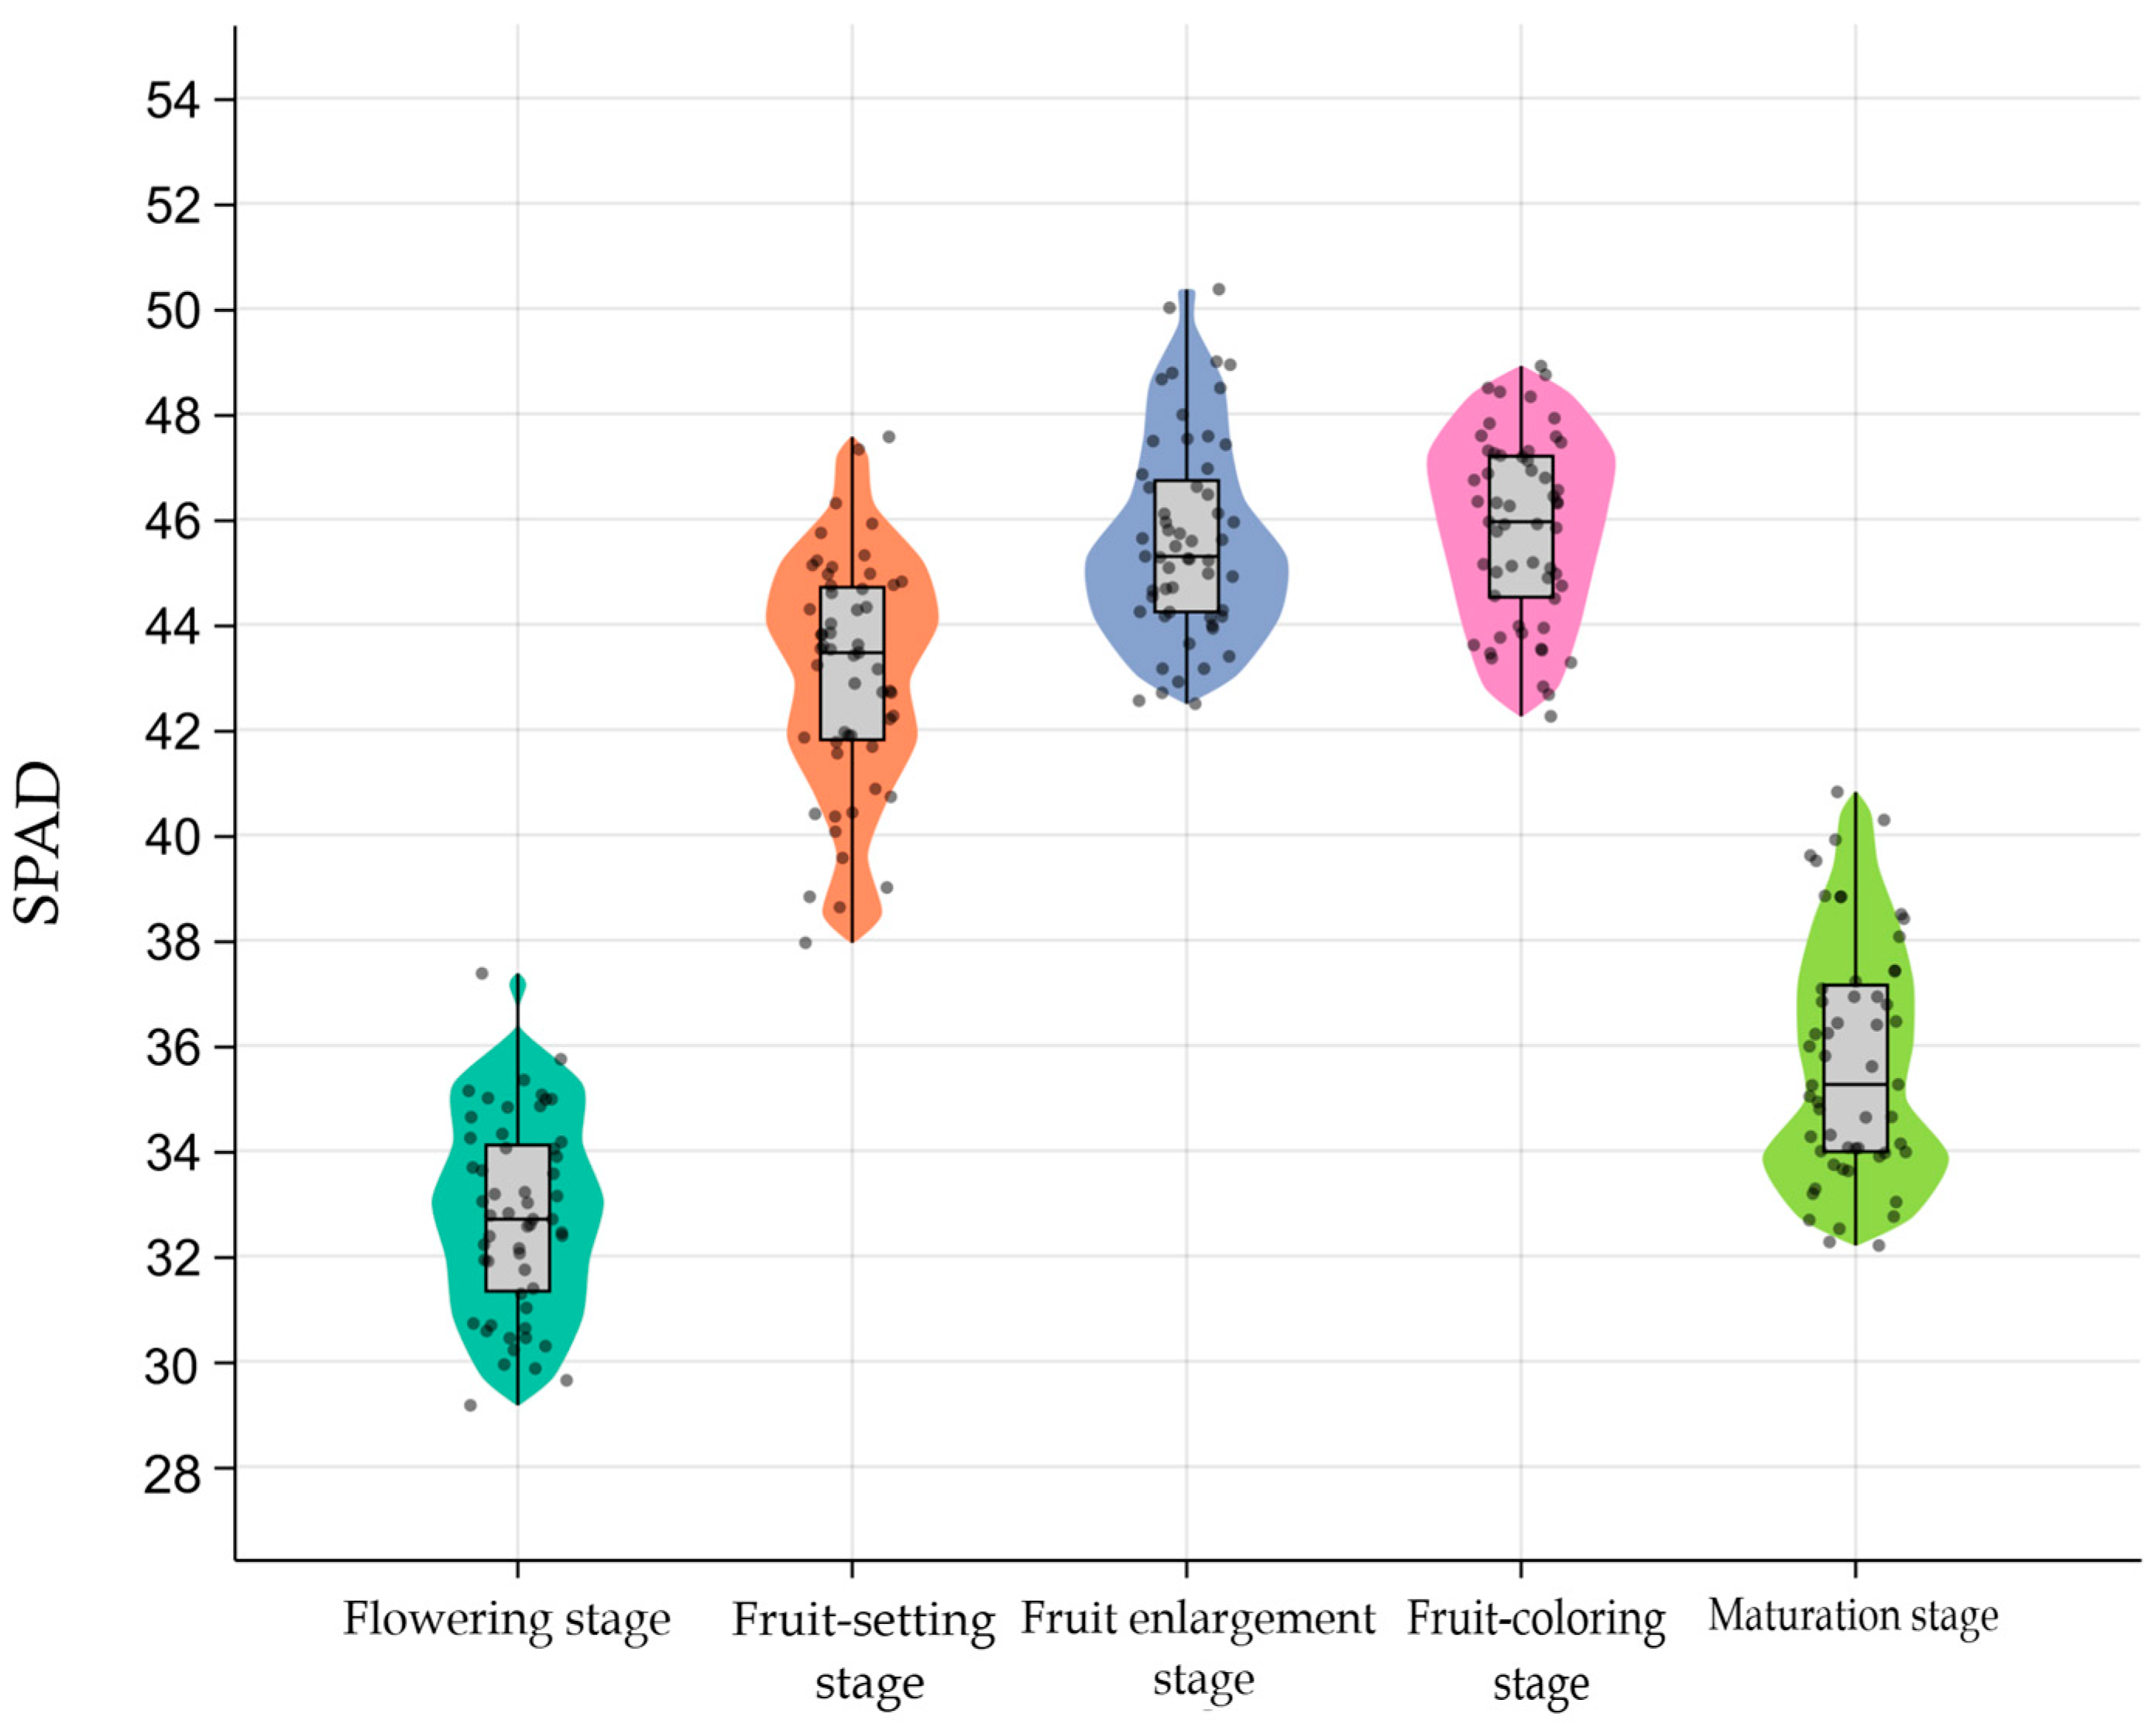
3.1. Measured SPAD Values in Canopy Leaves of Apple Trees

Table 4 displays the statistical data of the measured SPAD values of the canopy leaves of 55 sampled apple trees selected in the experiment in the flower-falling stage, fruit-setting stage, fruit expansion stage, fruit-coloring stage and fruit-maturing stage. Figure 7 is the statistical chart of the SPAD values of the sampled apple tree leaves. The leaf structure of the apple trees and the growth of the fruit trees will directly affect the SPAD value in the different growth stages. It can be observed from Figure 7 that the SPAD value of the leaves firstly rose gradually and then declined, peaking in the fruit expansion stage; in the flower-falling stage, the SPAD value of the leaves remained at a relatively low level. This is mainly because in this stage, the fruit trees are experiencing the adjustment after blossoming, with low photosynthetic efficiency. Entering the fruit-setting stage, the SPAD value of the leaves increased markedly, and this stage was an important stage for crops to form fruits, i.e., with the development of fruits, the leaf area grew and the chlorophyll content of the leaves increased to support the growth and development of plants. Meanwhile, it can be seen from Table 4 that the fruit expansion stage was one of the key stages of crop growth, during which the SPAD value of the leaves continuously increased in comparison with that in the fruit-setting stage, the maximum value was 50.367 and the coefficient of variation was 4.2%. This reveals that fruit trees grow vigorously in this stage, the photosynthetic efficiency is enhanced stably, and the chlorophyll content is high in the leaves. In the fruit-coloring stage, the mean SPAD value of the leaves was 45.796, while the maximum value declined compared with that in the fruit expansion stage, but its coefficient of variation decreased to 3.8%, meaning that crops show highly consistent growth status in this stage. In the meanwhile, the relatively low coefficient of variation also reflects that crops are influenced little by external factors and leaves can maintain a stable chlorophyll content level, which is crucial for ensuring fruit quality. Finally, the SPAD value of the leaves fell after rising in the fruit-maturing stage, the mean value declined to 35.734 and the coefficient of variation peaked at 6.3%. A possible reason is that after fruits become mature, plants are gradually aging and photosynthesis is weakened.

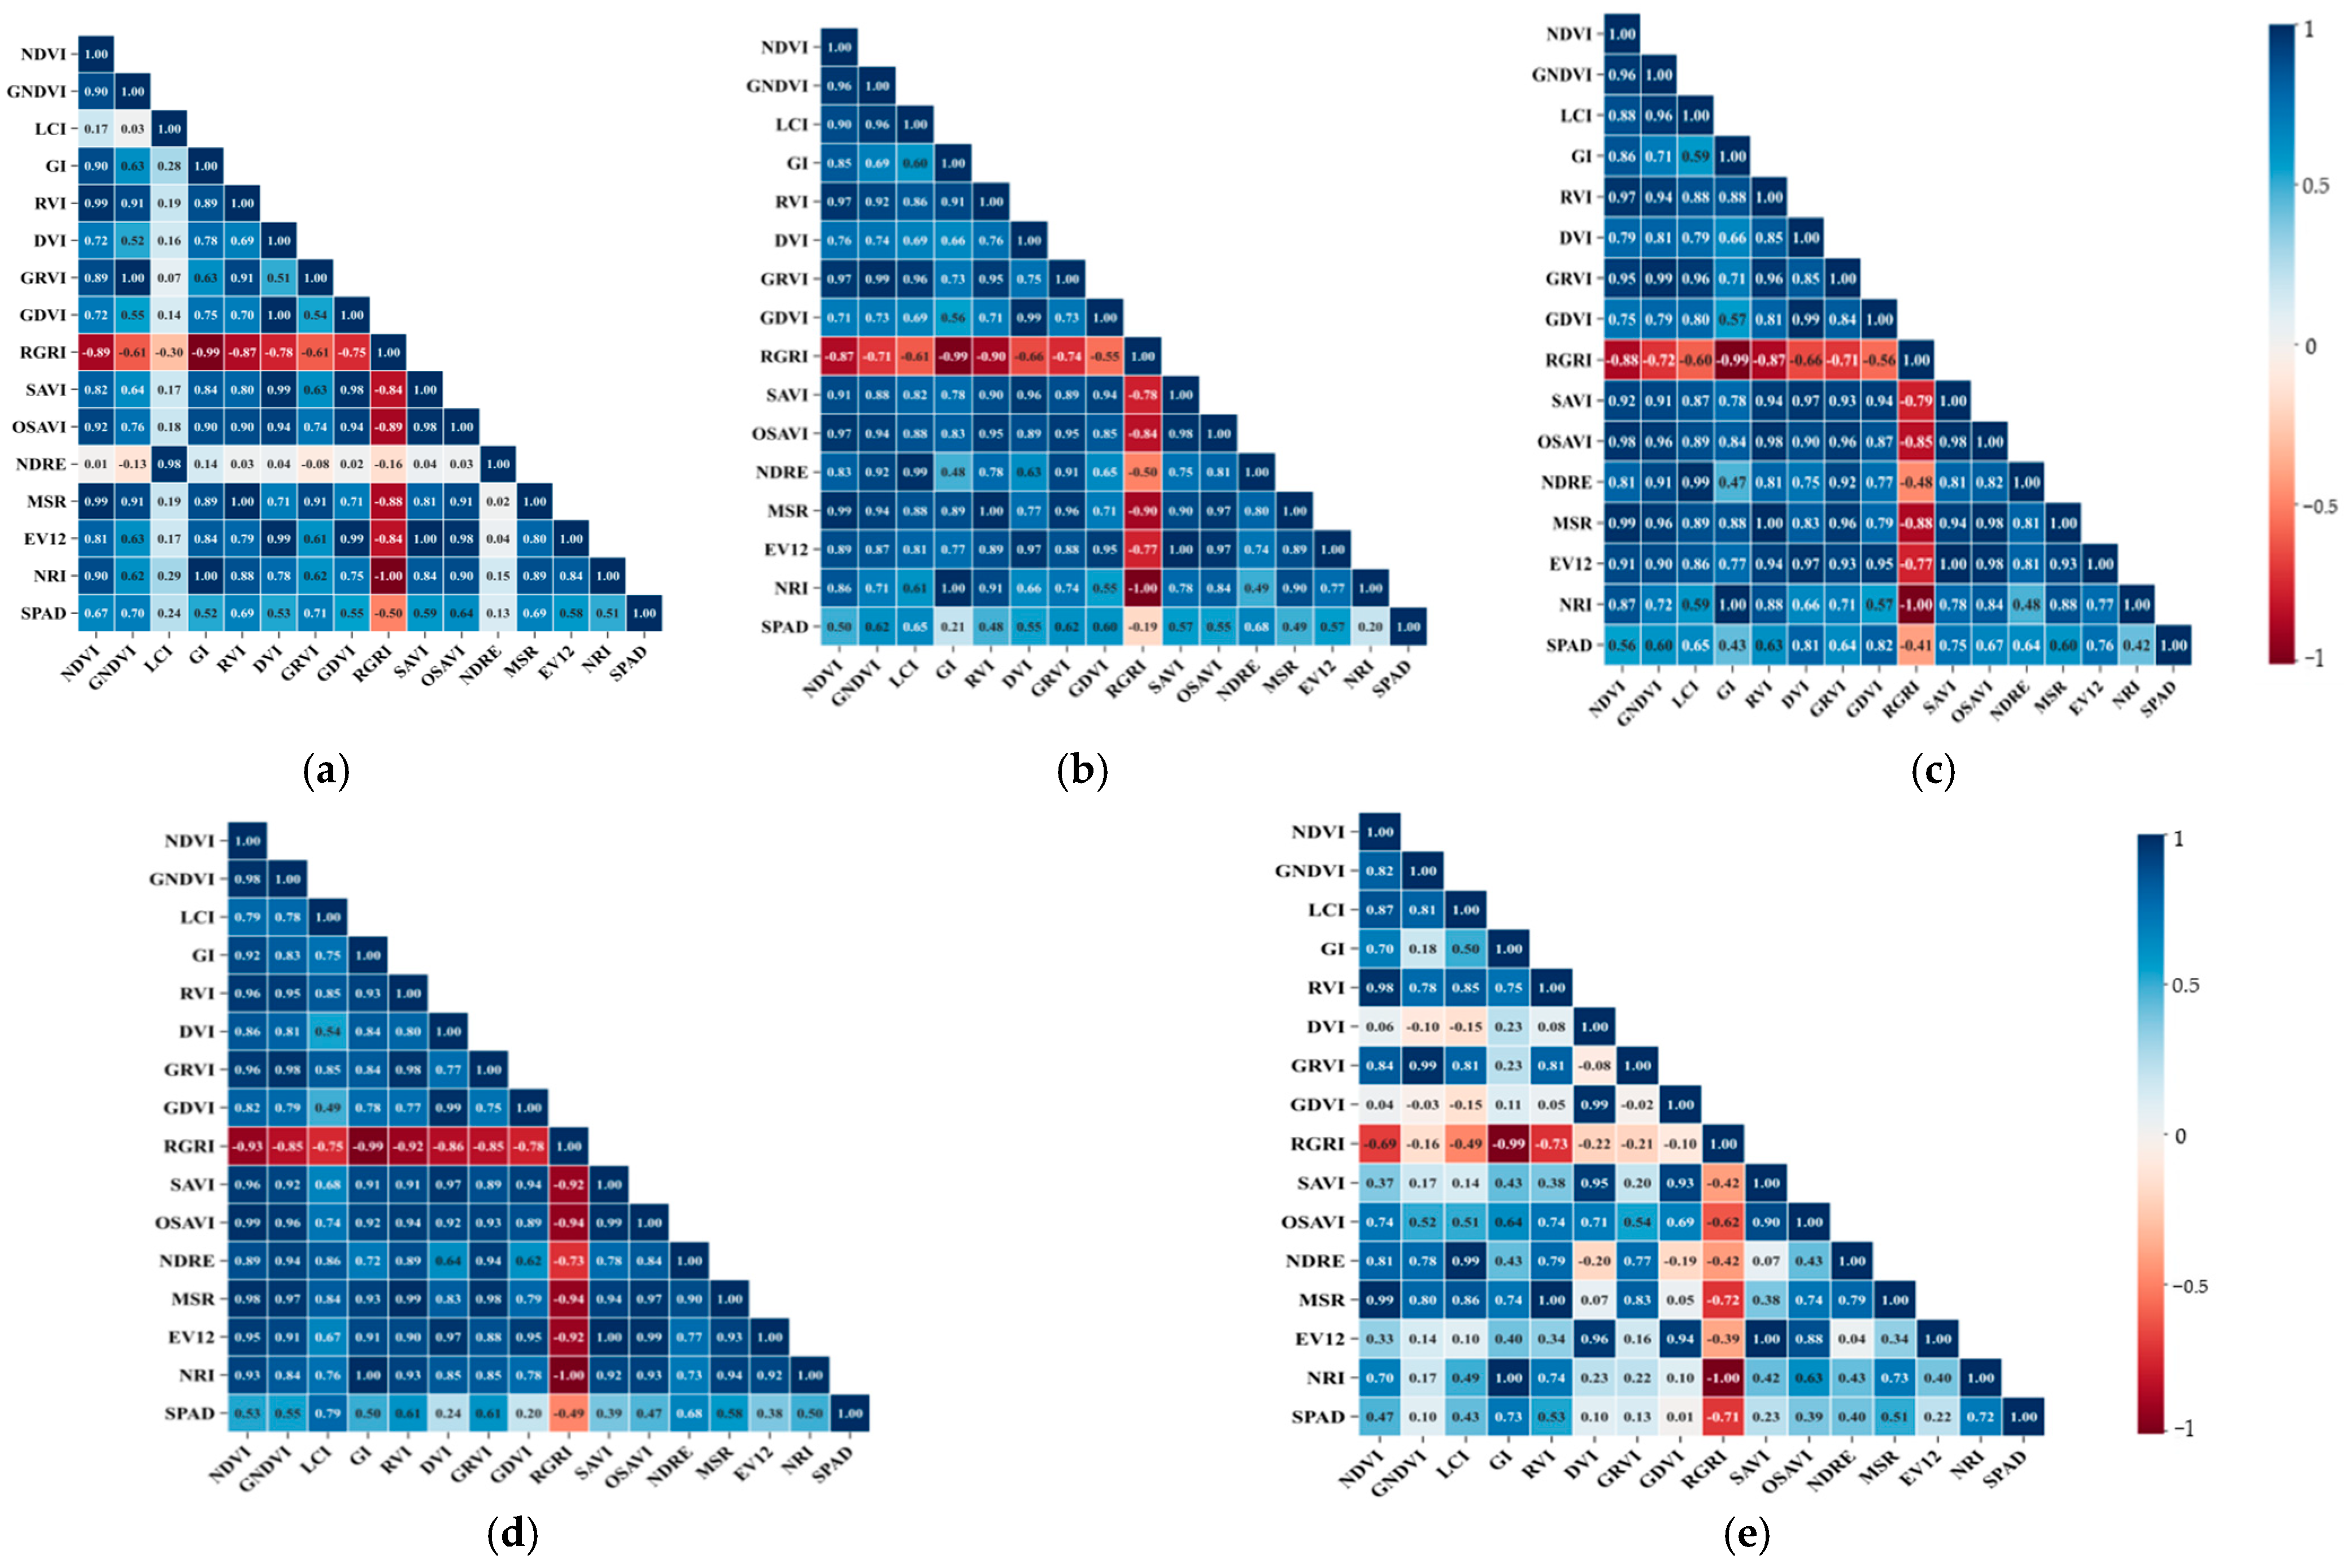
3.2. Correlation Analysis Between Vegetation Index and SPAD Value

The 15 vegetation indexes of all the sampled fruit trees in each growth stage and the measured SPAD values of the leaves in the same stages were subject to Pearson correlation analysis. The correlation coefficient matrix is displayed in Figure 8, where a blue color indicates positive correlation, a red color denotes negative correlation, and the deeper the color, the stronger the correlation. As shown in Figure 8, in all the growth stages, the vegetation indexes—NDVI, GNDVI, LCI, GI, RVI, DVI, GRVI, SAVI, OSAVI, NDRE, MSR, EVI2 and NRI—all showed positive correlations with the SPAD value of the leaves, while the RGRI was negatively correlated with the SPAD value. In the different growth stages, the SPAD value of the leaves was sensitive to the different vegetation indexes to different degrees, reflecting that these indexes can favorably reflect the change in the leaf chlorophyll content. In the flower-falling stage, except the LCI and NDRE, the other vegetation indexes—NDVI, GNDVI, GI, RVI, DVI, GRVI, GDVI, RGRI, SAVI, OSAVI, MSR, EVI2 and NRI—were highly correlated with the SPAD value, and the absolute values of their correlation coefficients were all greater than or equal to 0.50, respectively, being 0.67, 0.7, 0.52, 0.69, 0.53, 0.71, 0.55, −0.50, 0.59, 0.64, 0.69, 0.58 and 0.51, which were all significant at the level of 0.01. In the fruit-setting stage, the GI0 RGRI and NRI were weakly correlated with the SPAD value of the leaves, with correlation coefficients of 0.21, −0.19 and 0.20, respectively, while the other 12 indexes were positively correlated with the SPAD value, among which the NDRE had the highest correlation coefficient (0.68) with the SPAD value, showing extreme significance at the level of 0.01 (p = 0.001). In the fruit expansion stage, the RGRI was negatively correlated with the SPAD value with the lowest correlation coefficient (−0.41), while the DVI and GDVI were extremely highly correlated with the SPAD value, and both correlation coefficients were above 0.80, being 0.81 and 0.82, respectively. In the fruit-coloring stage, the DVI and GDVI were weakly correlated with the SPAD value of the leaves, with the correlation coefficients of 0.24 and 0.20, respectively, and the correlation coefficients of the other vegetation indexes—NDVI, GNDVI, LCI, GI, RVI, GRVI, RGRI, SAVI, OSAVI, MSR, EVI2 and NRI—with the SPAD value being 0.53, 0.55, 0.79, 0.50, 0.61, 0.61, −0.49, 0.39, 0.47, 0.68, 0.58, 0.38 and 0.50, respectively. Among them, the LCI showed the highest correlation coefficient (0.79) with the SPAD value. In the fruit-maturing stage, the GNDVI, DVI, GRVI, GDVI, SAVI and EVI2 were weakly correlated with the SPAD value, the correlation coefficients were 0.10, 0.10, 0.13, 0.01, 0.23 and 0.22, respectively, while the absolute values of the correlation coefficients of the GI, RGRI and NRI with the SPAD value of the leaves were all above 0.7, being 0.73, −0.71 and 0.72, respectively. To sum up, the vegetation indexes selected in the fruit expansion stage are highly correlated with the SPAD value of the leaves on the whole, while those in the fruit-setting stage are relatively weakly correlated with the SPAD value.
To ensure the simplicity and improve the model accuracy, the top five vegetation indexes with high correlation coefficients with the SPAD value of the leaves in each growth period were selected for modeling. The vegetation indexes selected in the flower-falling stage were the NDVI, GNDVI, RVI, GRVI and MSR; those in the fruit-setting stage included the GNDVI, LCI, GRVI, GDVI and NDRE; those in the fruit expansion stage were the DVI, SAVI, OSAVI, EVI2 and GDVI; those in the fruit-coloring stage were the LCI, RVI, GRVI, NDRE and MSR; and those in the fruit-maturing stage were the GI, RVI, RGRI, MSR and NRI.

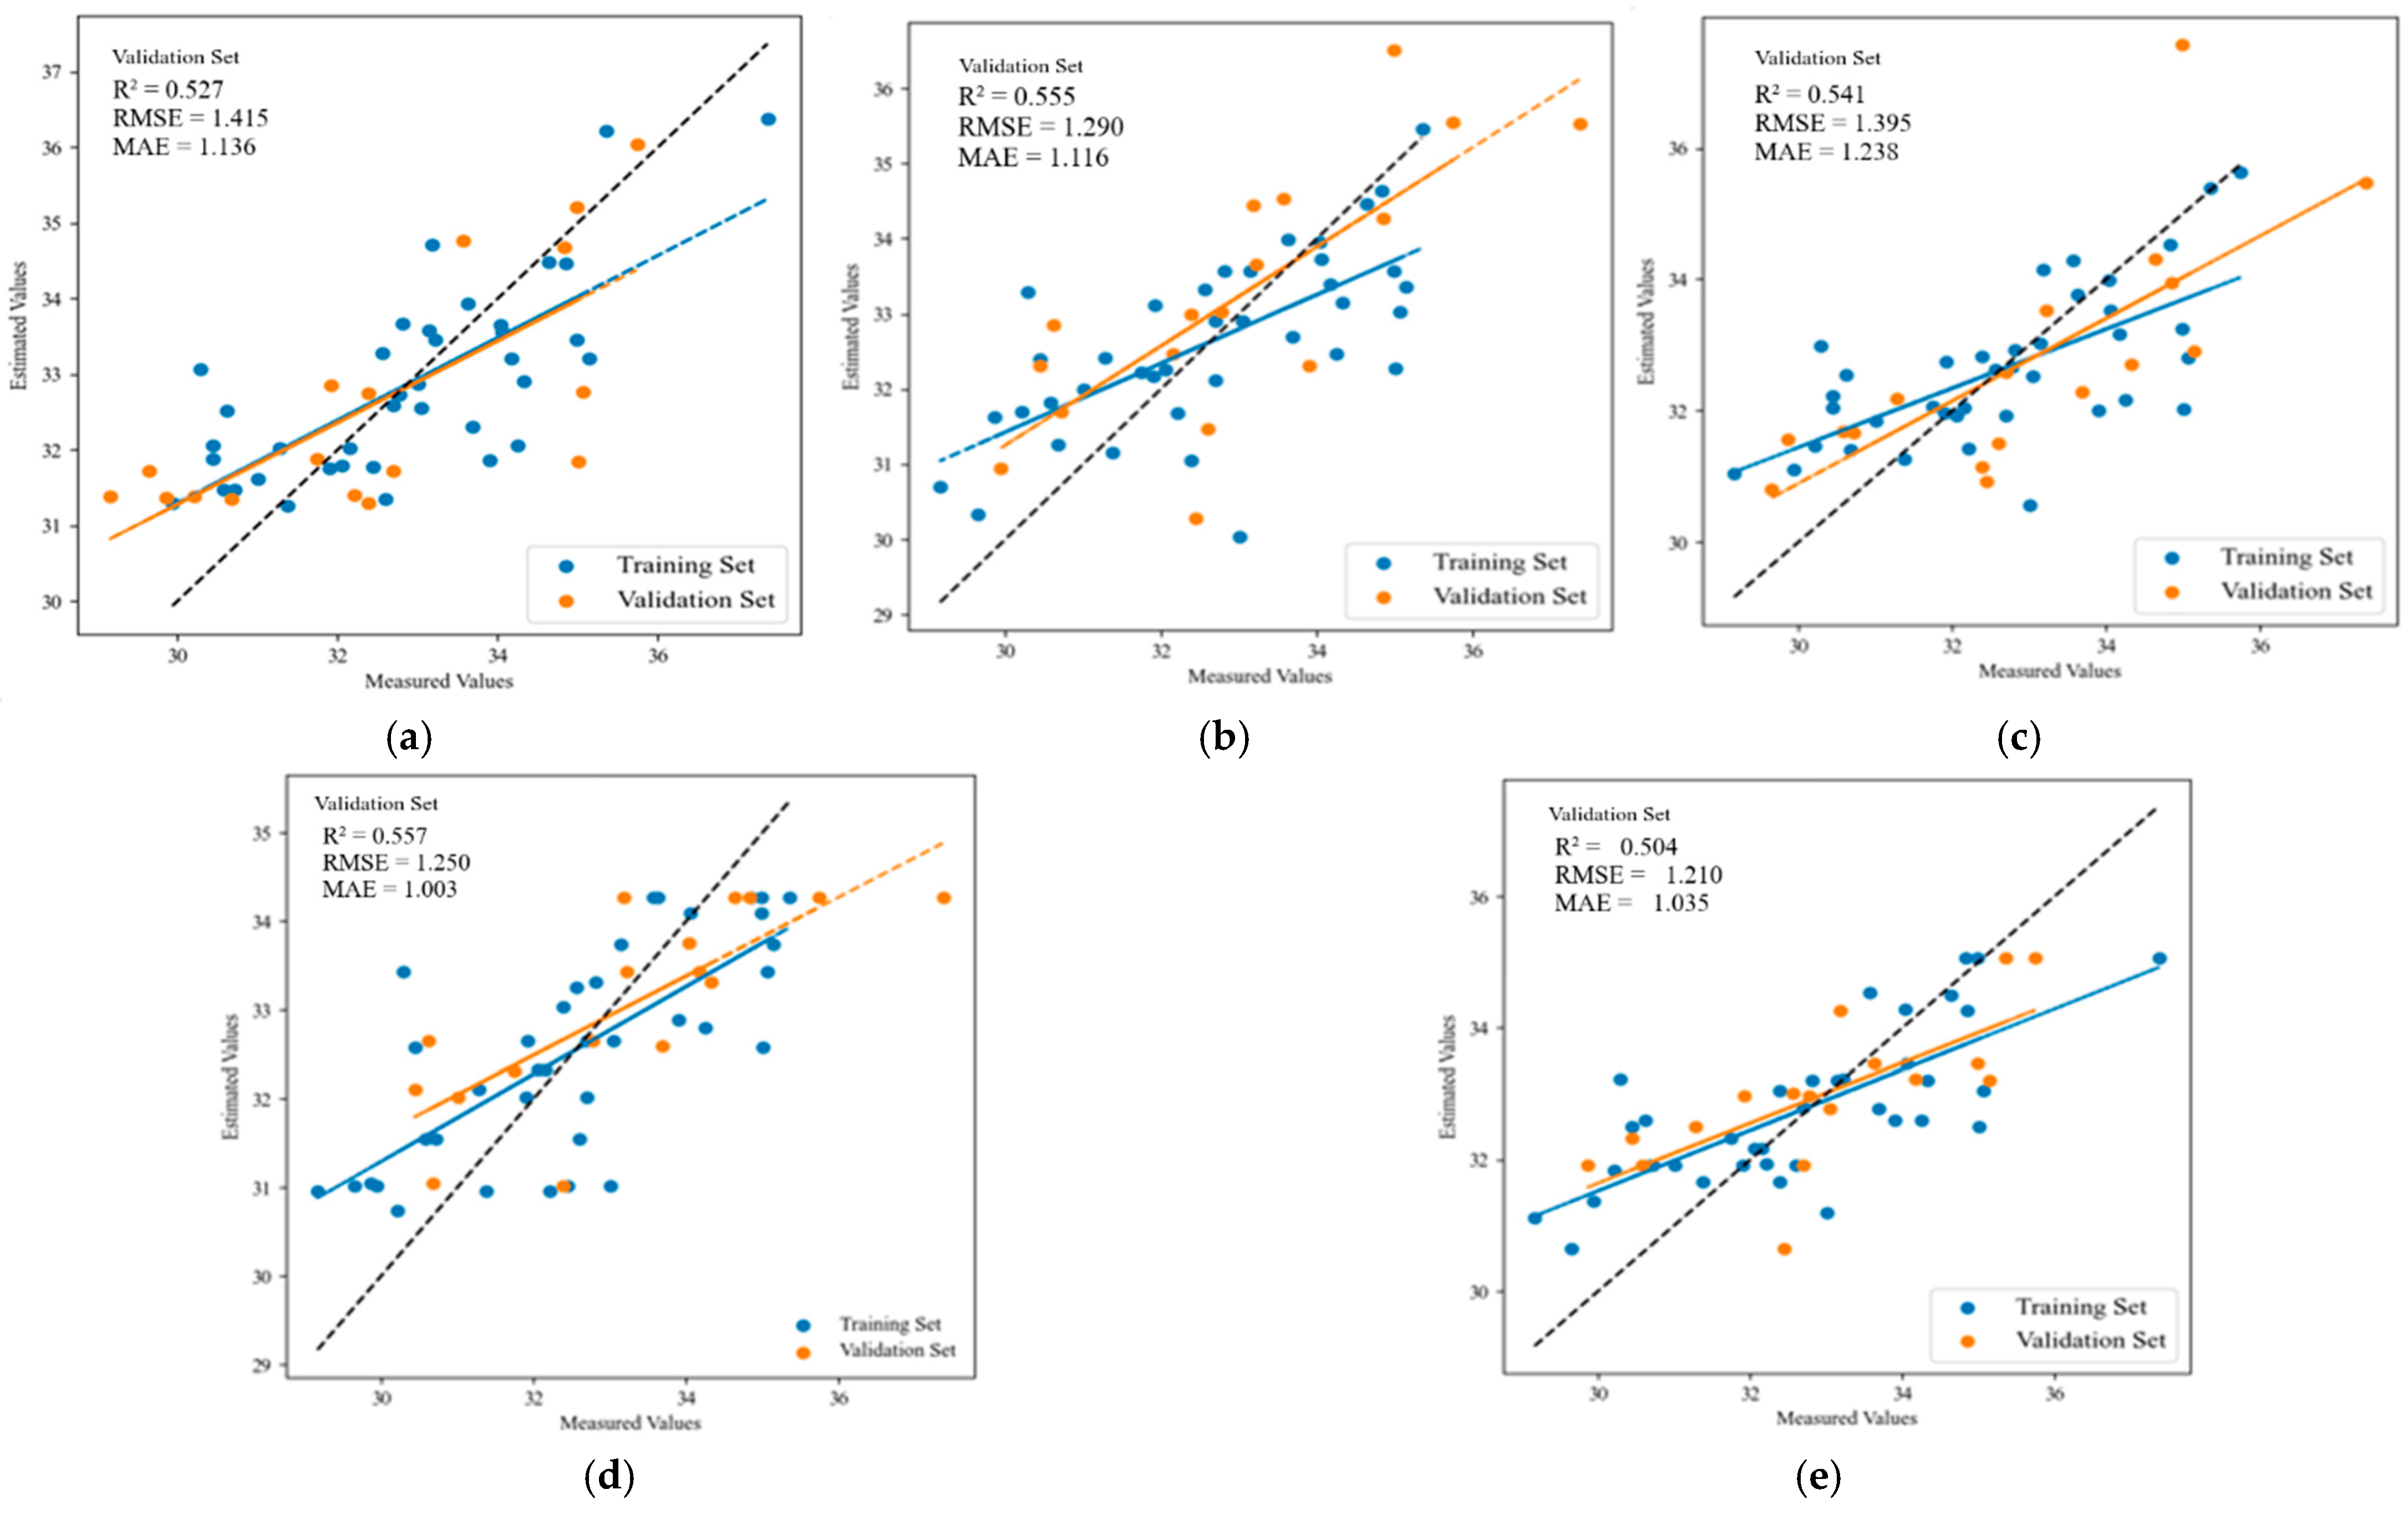
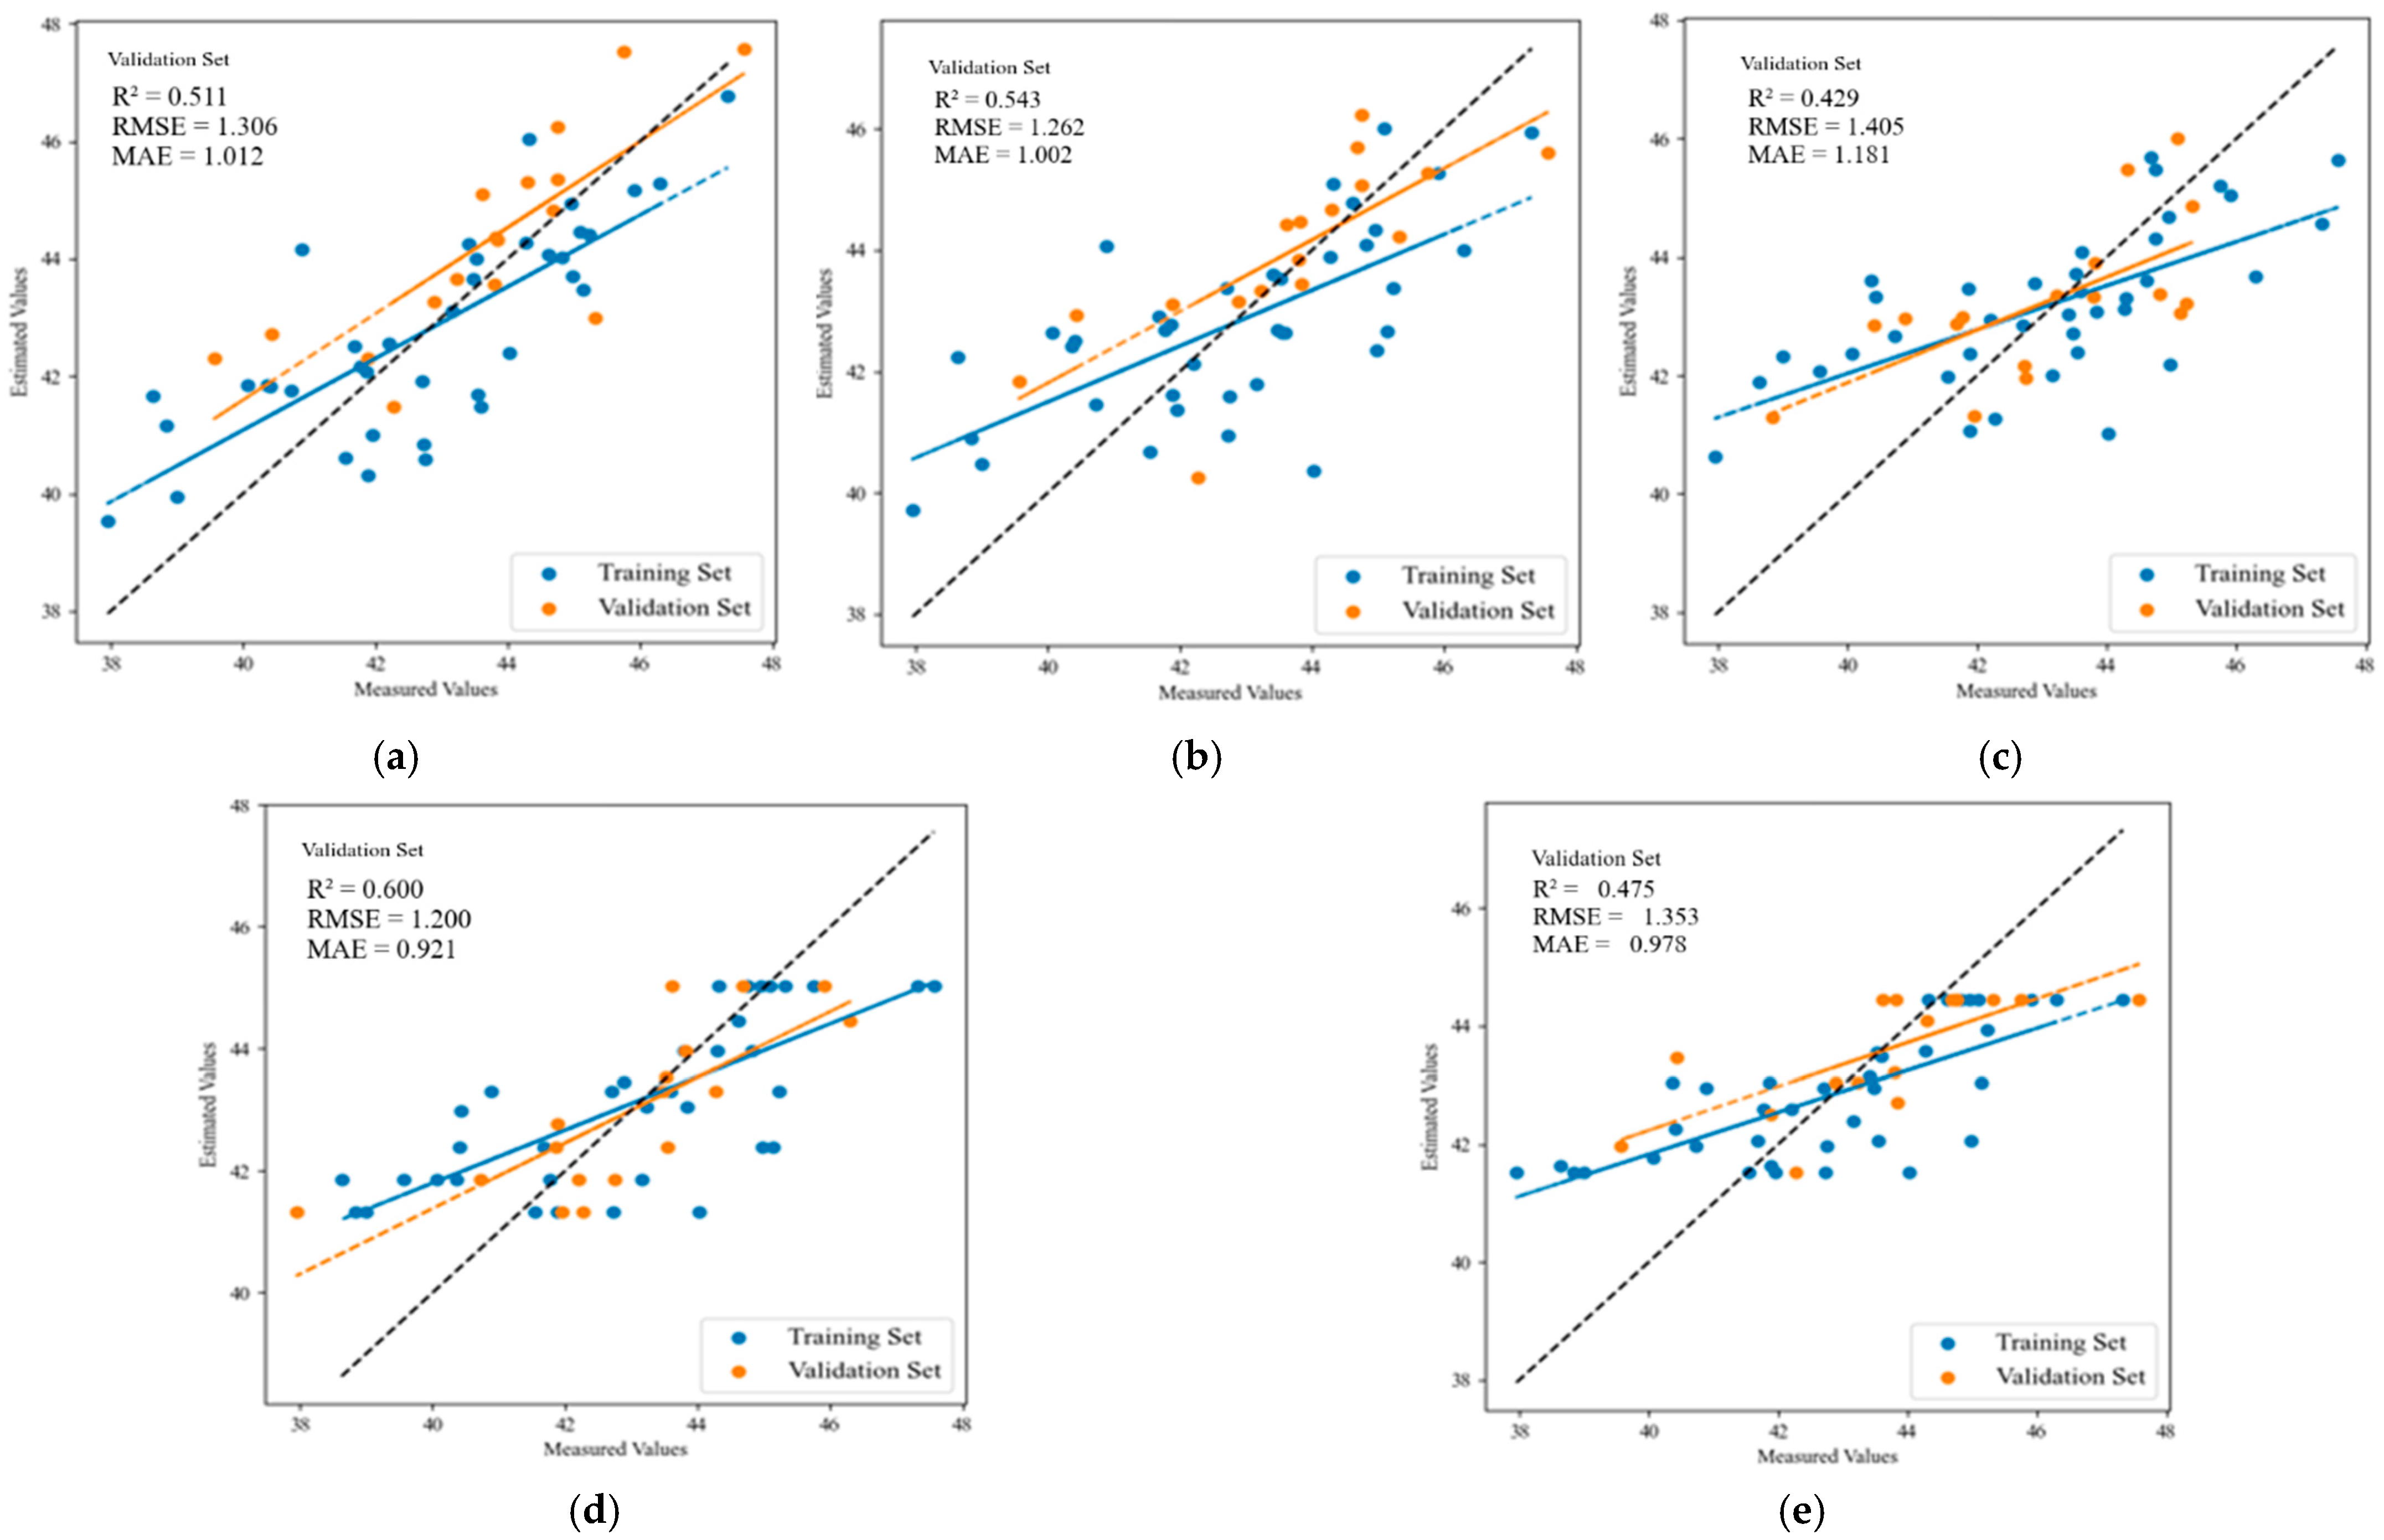
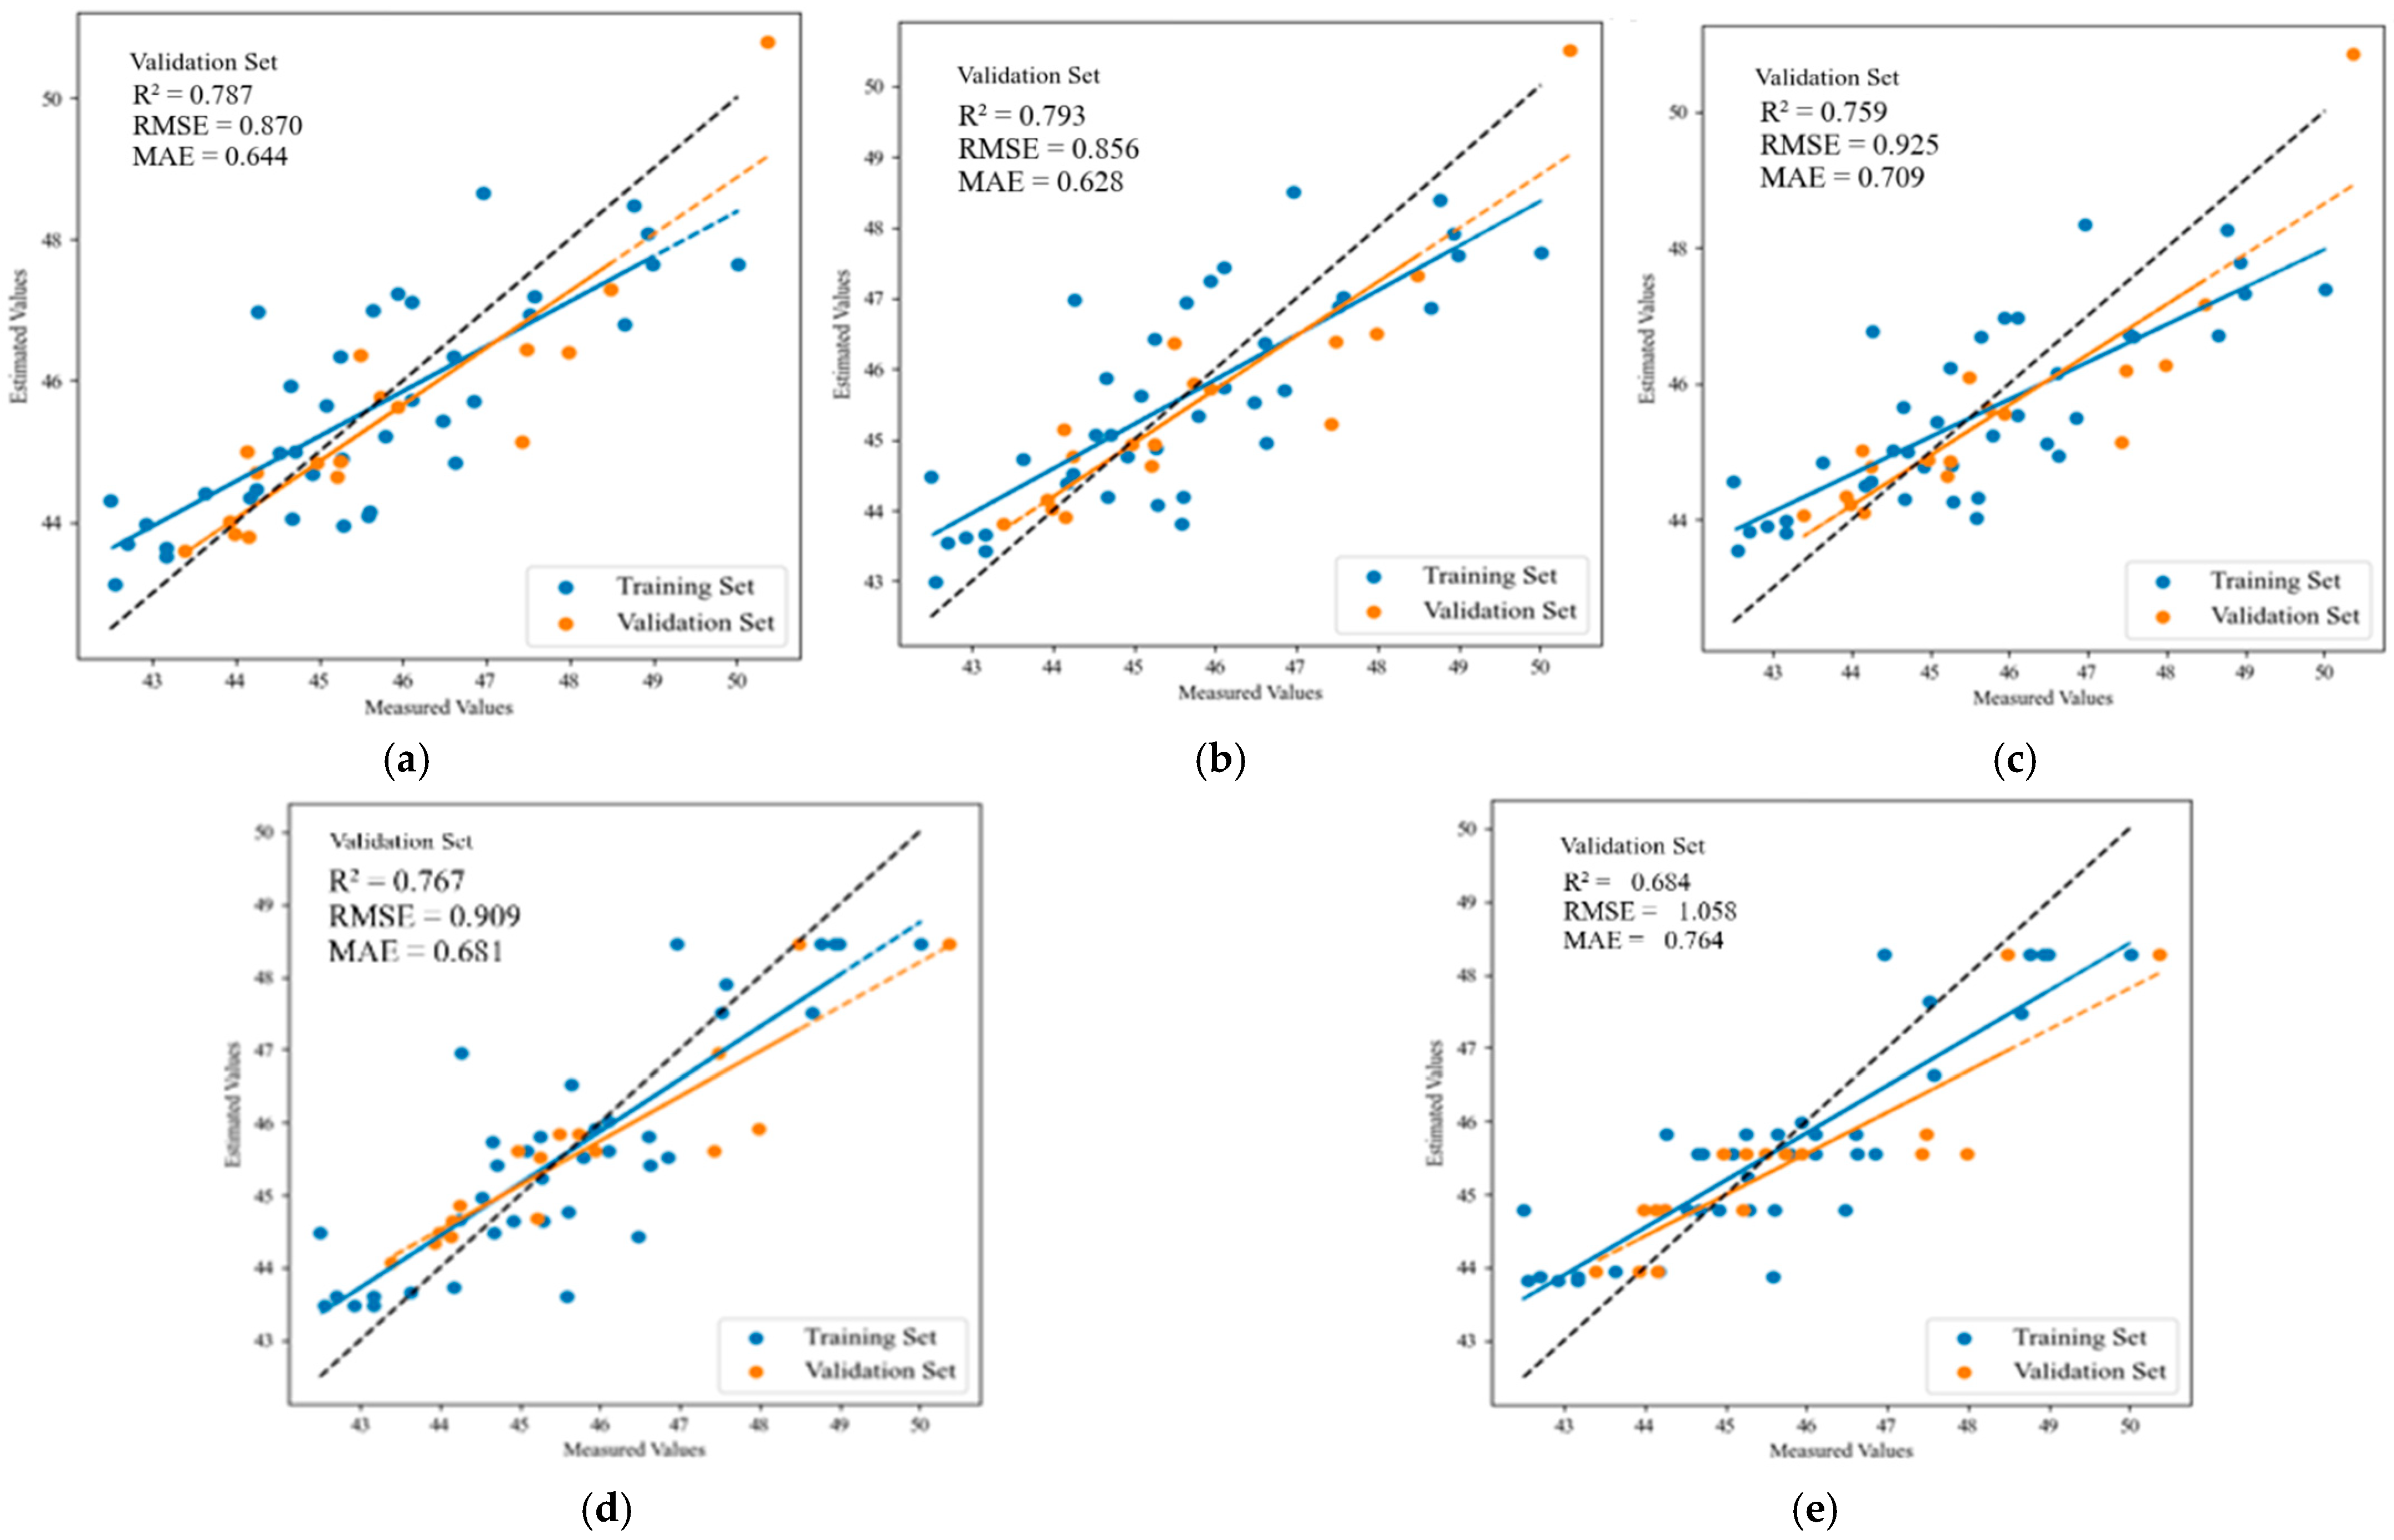
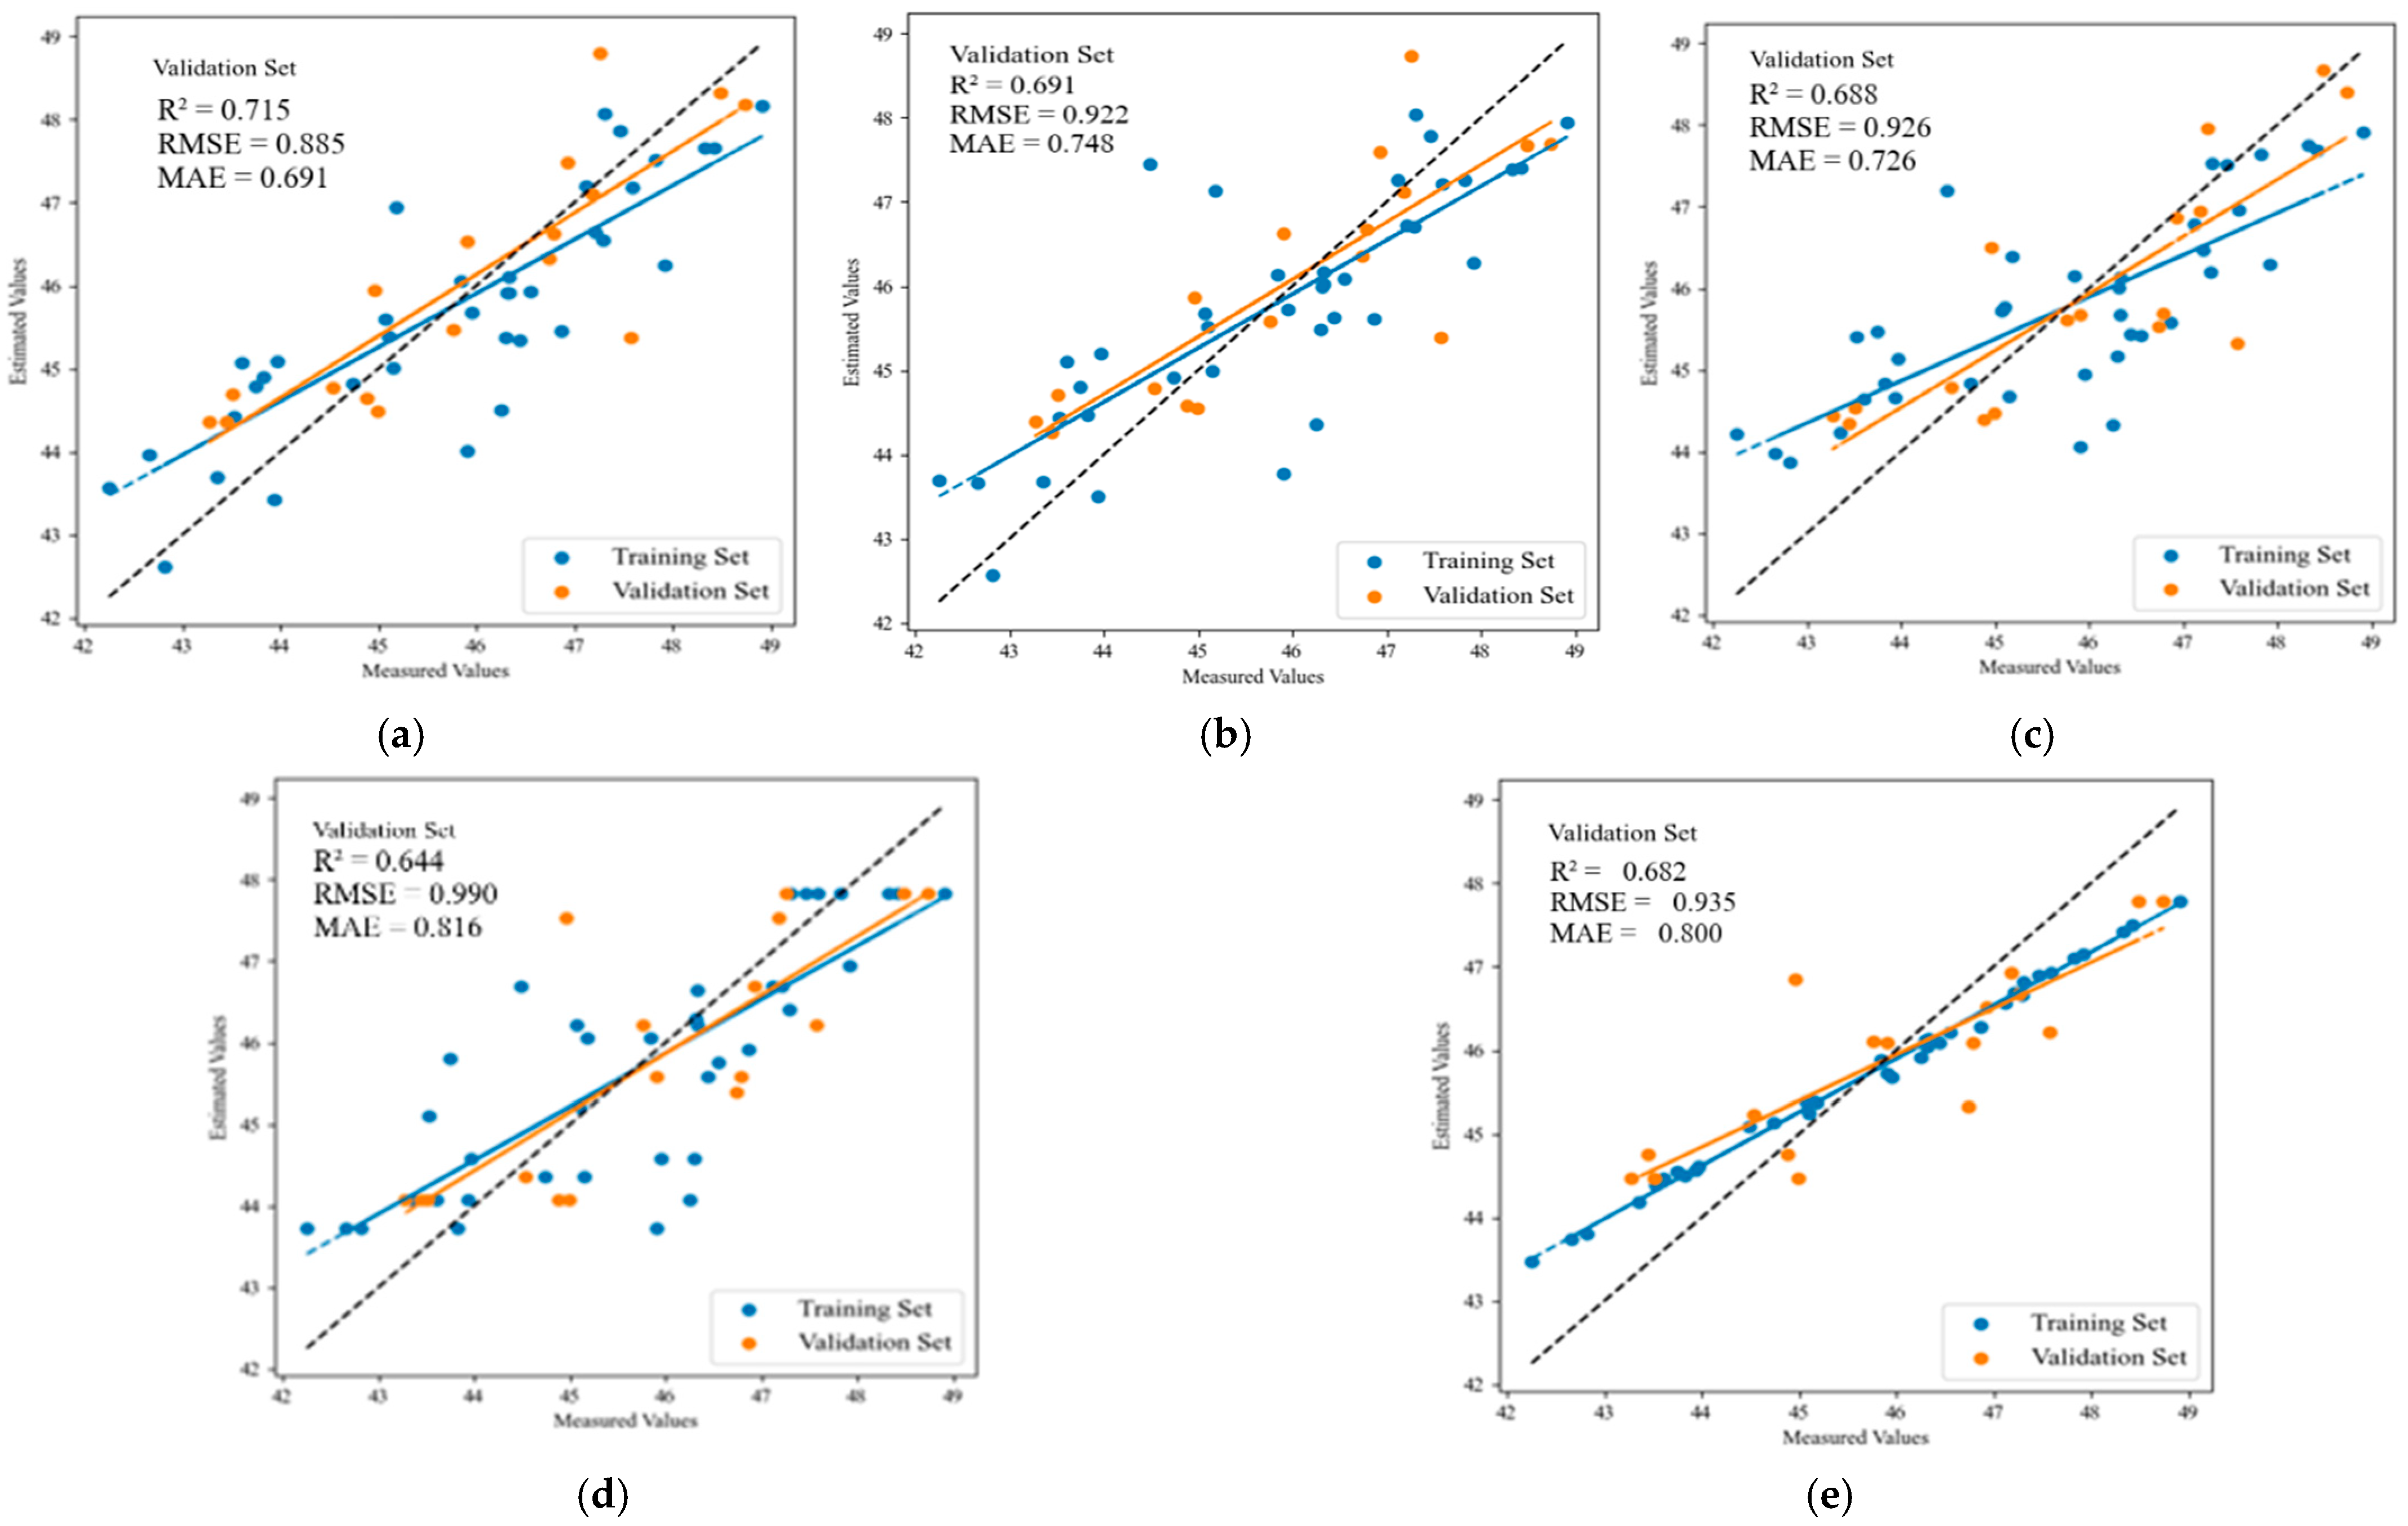
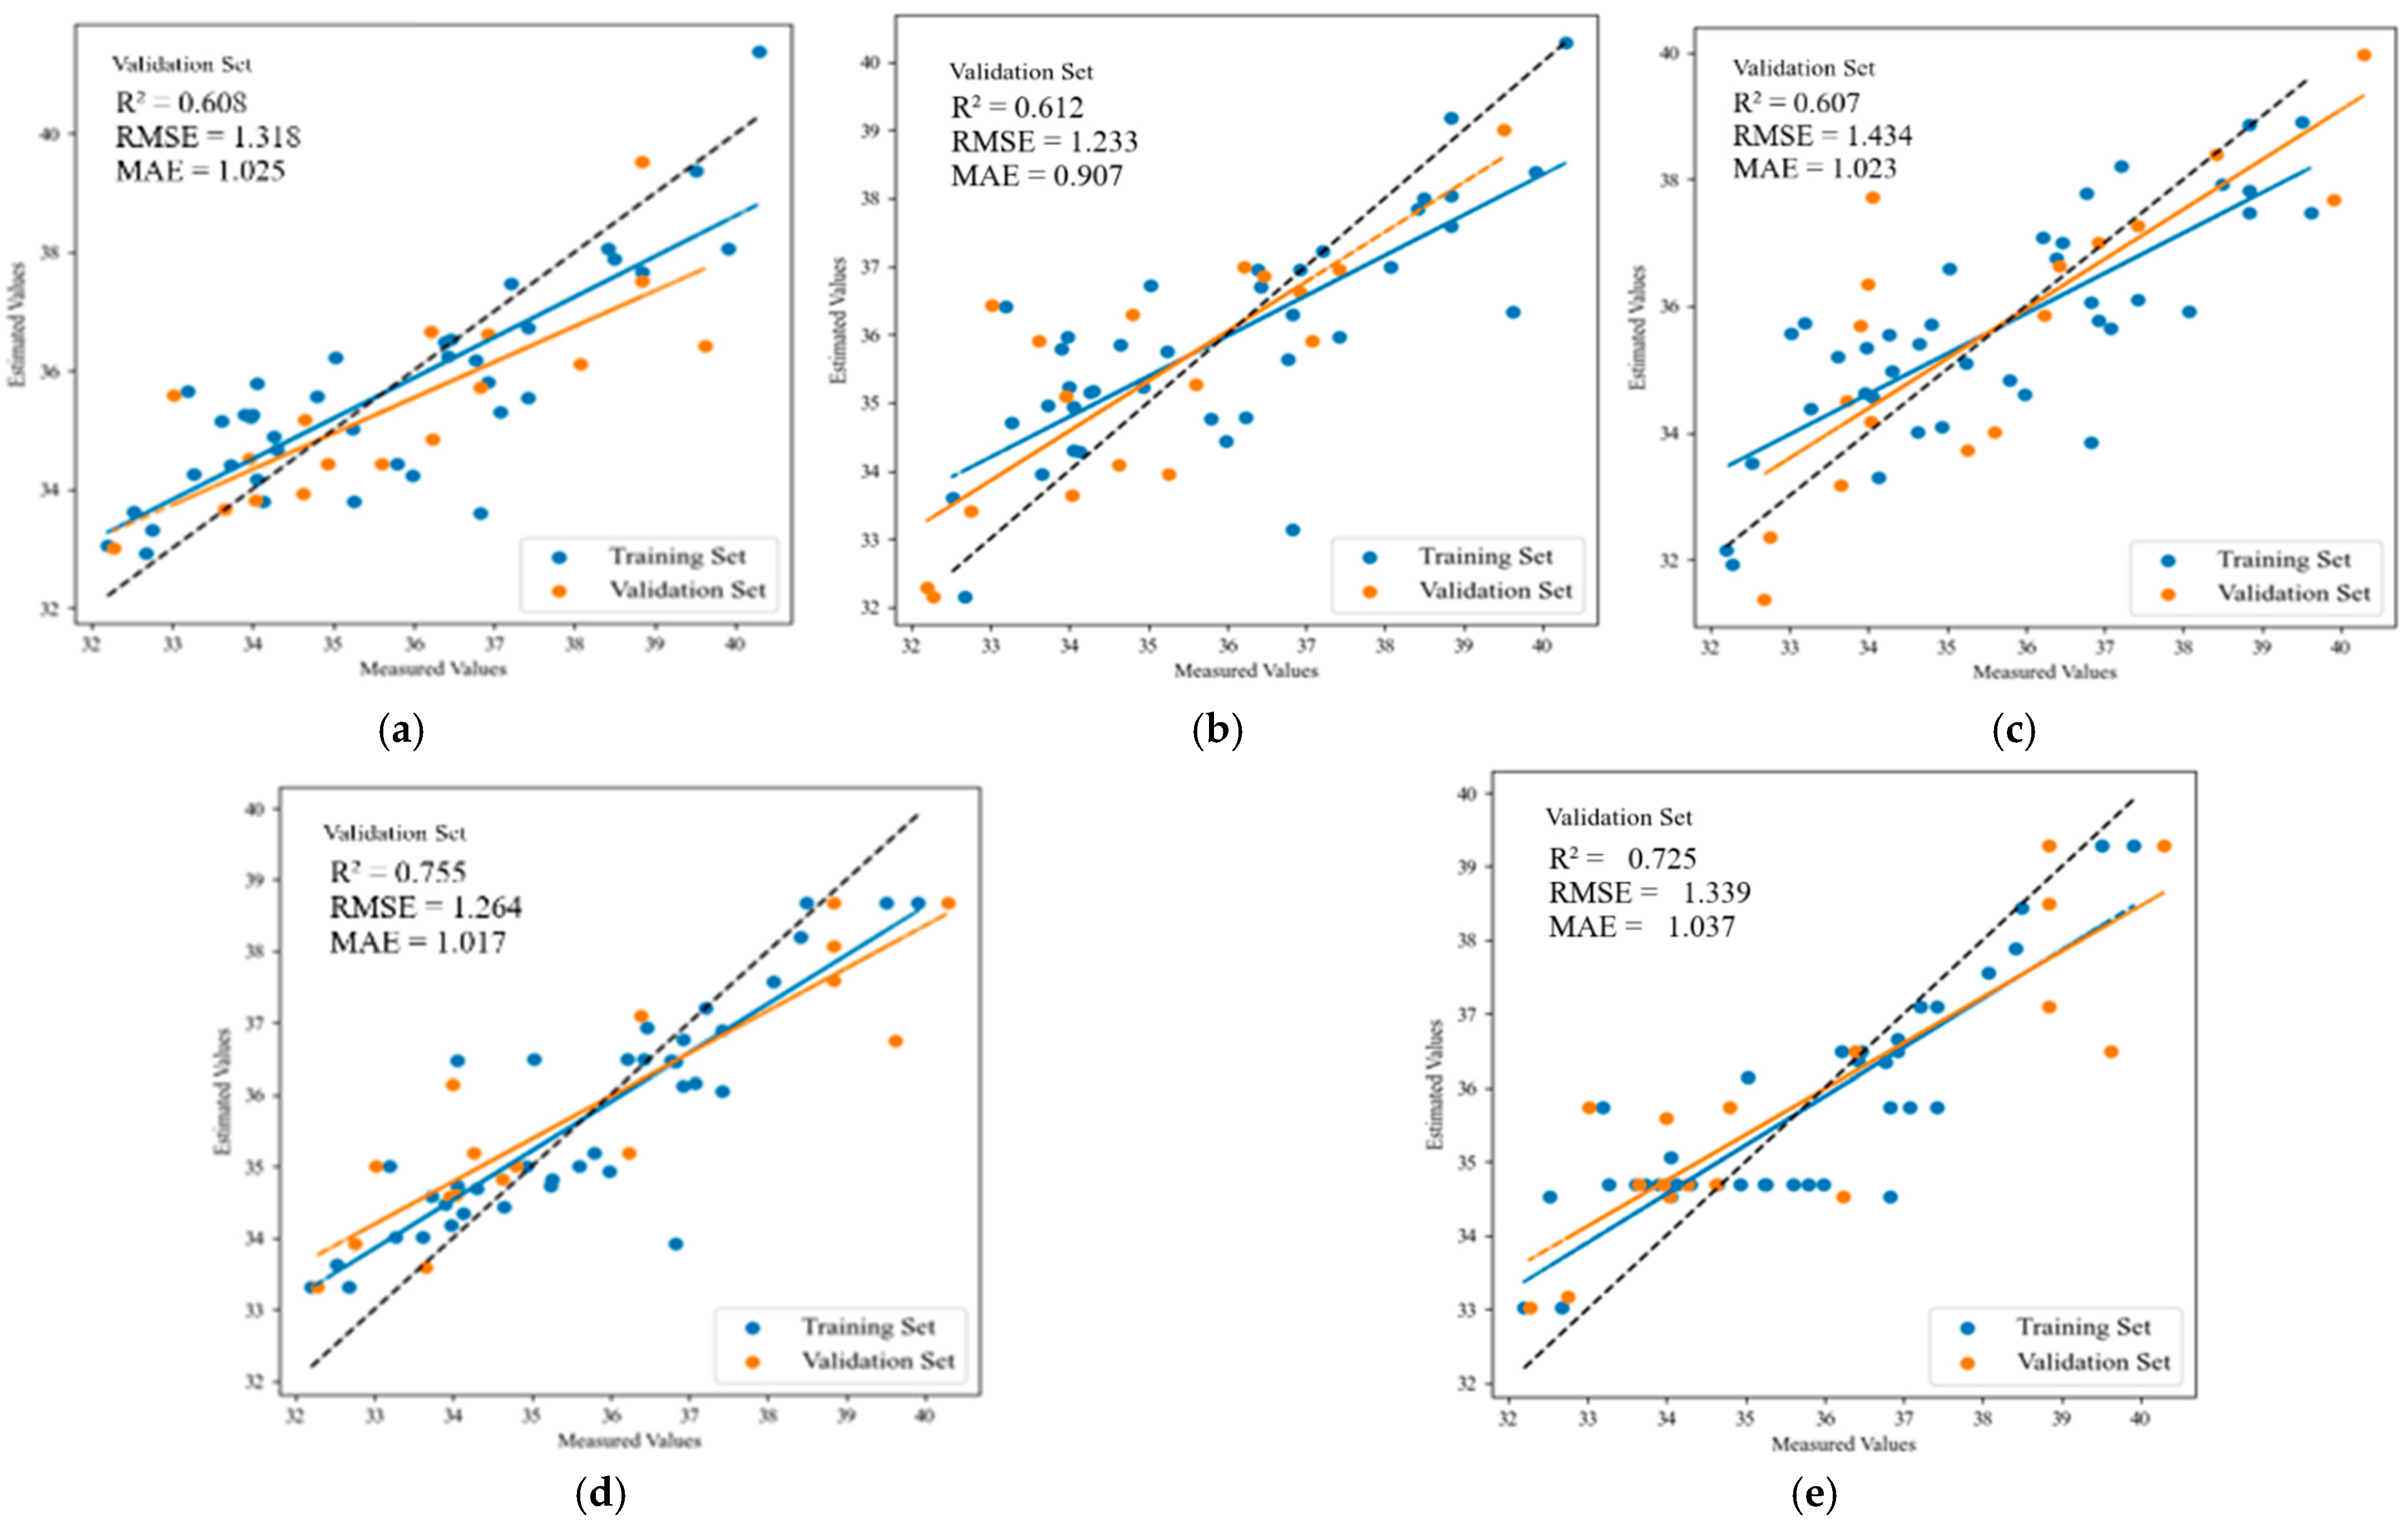
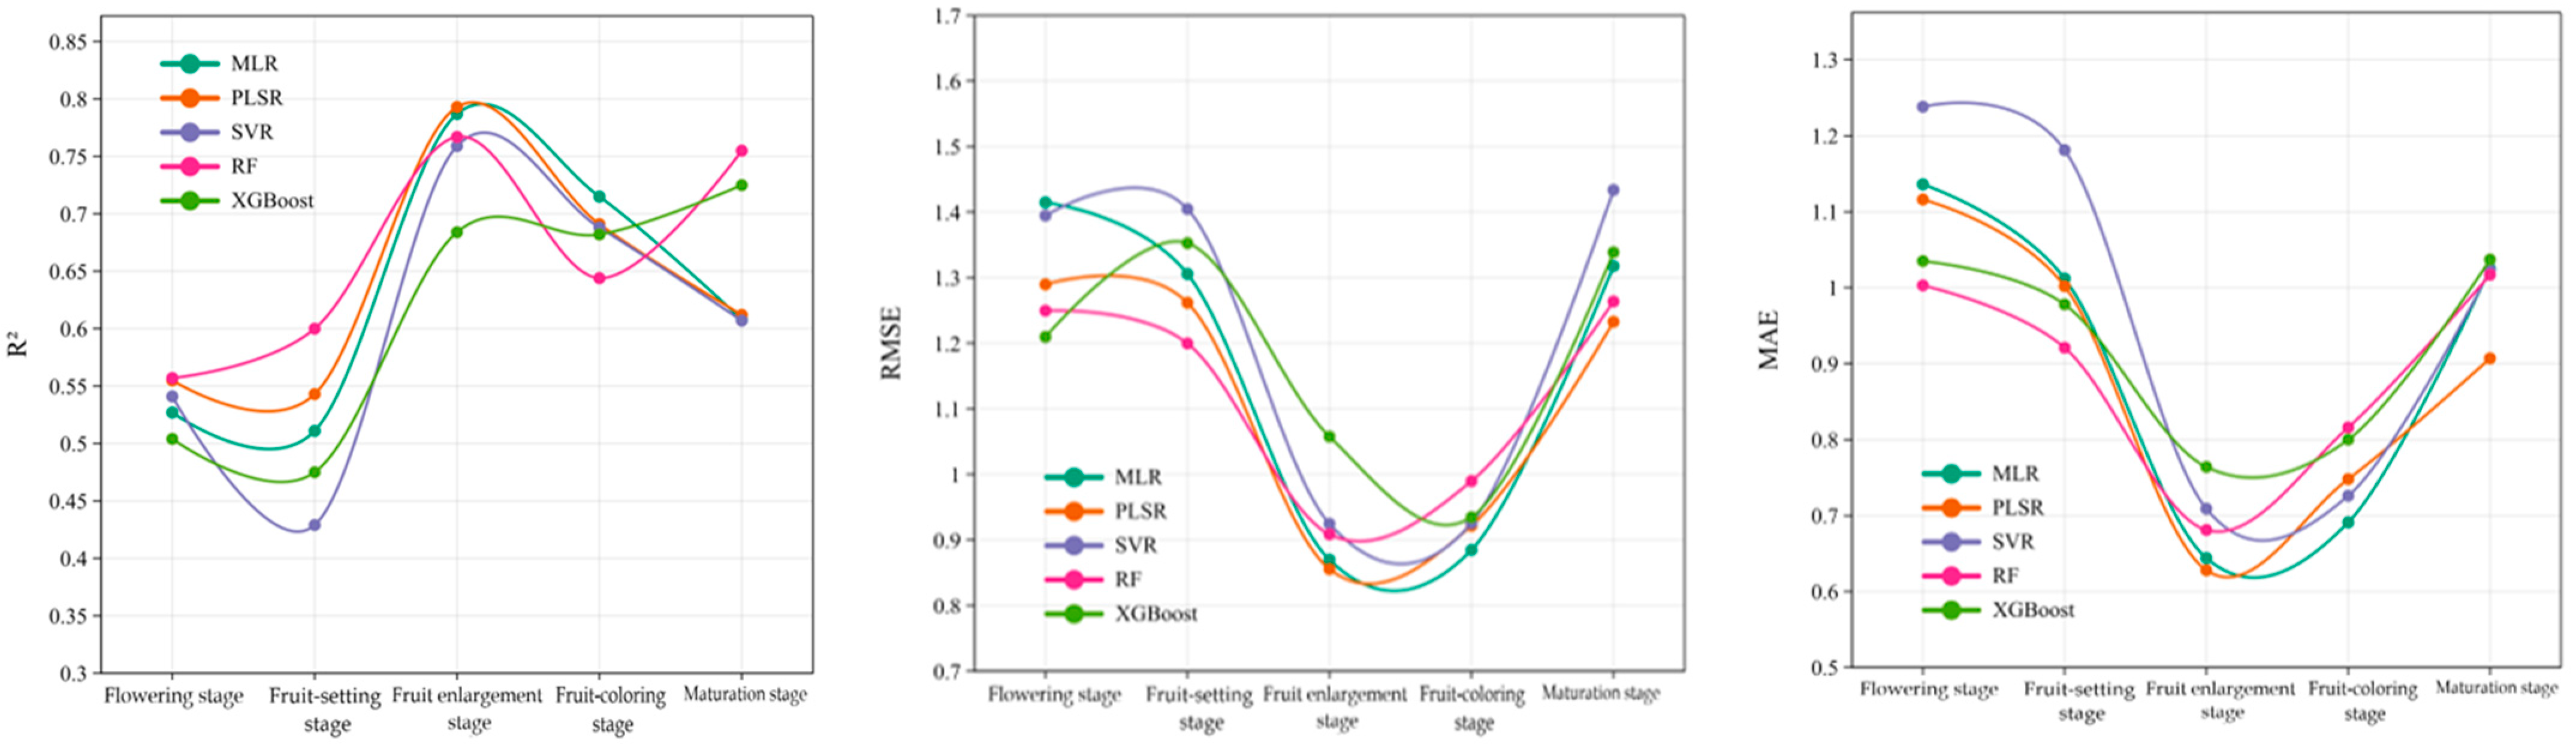
3.3. Establishment and Verification of Prediction Model for Leaf SPAD Value in Apple Trees

Taking the vegetation index selected based on the correlation analysis between the SPAD value of the fruit tree canopy leaves and the vegetation indexes in each growth stage as the independent variable, and the measured SPAD value of the apple canopy leaves as the dependent variable, five regression models, namely MLR, PLSR, SVR, RF and XGBoost, were used to construct estimation models for the SPAD value of fruit leaves in different growth stages, and the accuracy evaluation of the estimation models is shown in Table 5.
From Table 5, it can be seen that for the estimation models of the leaf SPAD values in the flower growth stage, the R2 value of the MLR, RF and XGBoost models on the training set was kept above 0.5, while that of PLSR and SVR was below 0.5. Among the five regression models, the R2 value of the RF model on the validation model was the best (0.557), and its RMSE and MAE were 1.250 and 1.003, respectively, which were also relatively small. PLSR performed well on the validation set, too, with its R2 value being slightly lower than that of RF model, being 0555. The MLR model performed stably on both datasets, but its comprehensive performance was slightly poorer than that of RF and PLSR. XGBoost performed favorably on the training set (R2 = 0.541), but its R2 value on the validation set was 0.504 and its generalization ability was not as good as that of RF and PLSR. This is because XGBoost is a powerful machine learning algorithm with very high model complexity, which is more applicable to greater datasets, while the datasets in this experiment were small, easily leading to over-fitting. The SVR model performed relatively weakly on both datasets in terms of the R2, and its fitting effect and generalization ability were poorer than those of the other two models. The above analysis indicates that in the flower-falling stage, the RF model exhibits relatively high prediction accuracy and generalization ability among the five regression models. Figure 9 shows the relationship between the predicted values and the measured values of the leaf SPAD of the five regression models in the flower-falling stage, in which the black dotted line is a 1:1 line, which represents the perfect fitting situation in the ideal situation (that is, the predicted value is equal to the measured value), and the blue solid line and the orange solid line represent the actual fitting lines of data in the training set and validation set, respectively. As can be seen from Figure 9, the data points in the MLR model’s validation set (orange dots) showed greater dispersion than those in the training set (blue dots); especially when the measured SPAD value was about 34, they deviated from the 1:1 line greatly. The data points in the validation set of the PLSR model were roughly distributed around the fitting line, and the deviation of the data points was slightly larger when the SPAD value was 32–34. The data points in the validation set of the SVR model were greatly dispersed in the high-SPAD area. Most data points of the RF model were concentrated near the fitting line, and the fitting line of the validation set was approximate to the 1:1 line. The fitting lines of the XGBoost model’s training set and validation set were relatively close, and the data points in the validation set deviated from the 1:1 line a lot under low SPAD values (30–33 or so). To sum up, the RF model was outstanding in the overall performance.
As for the estimation model for the leaf SPAD in the fruit-setting stage, Table 5 shows that the MLR model performed best on the training set, with an R2 value of 0.61, and it exhibited better fitting ability than the other models and had the minimum RMSE and MAE values (1.393 and 1.152, respectively), indicating its high prediction accuracy on the training set. However, the R2 value of the MLR model on the validation set was lower than those of the RF and PLSR models. Among the five regression models, the RF model performed best on the validation set, the R2 value was 0.6, and the RMSE and MAE were the minimum (1.2 and 0.921, respectively) in comparison with the other four regression models, reflecting its highest precision accuracy and generalization ability on the validation set, followed by the PLSR model (R2 = 0.543). The XGBoost model performed well on the training set, the R2 value was 0.48, the RMSE was 1.61, and the MAE was 1.254, but its generalization ability on the validation set was slightly inferior to that of the RF and PLSR models. The SVR model performed relatively weakly on the two datasets. Figure 10 displays the relationship between the predicted and measured SPAD values obtained by the five regression models in the fruit-setting stage. It can be observed from Figure 10 that the data points of the MLR and PLSR models on the training set and validation set were distributed around the regression line, the training set and validation set performed relatively consistently, and some data points deviated from the 1:1 line greatly. The data points in the validation set of the SVR model were relatively dispersed, some data points deviated from the regression line distantly, and the prediction accuracy was general. The data points in the training set and validation set of the RF model were closely distributed around the regression line, and the data points coincided highly with the regression line, indicating its relatively strong prediction ability within this range. The data points in the training set and validation set of the XGBoost model were distributed closely to the regression line, but they were relatively dispersed in low- and high-SPAD areas. Some data points in the training set and validation set deviated from the regression line distantly. The above analysis shows that among the five regression models in the fruit-setting stage, the RF model exhibits relatively high prediction accuracy and generalization ability.
As for the estimation model for the leaf SPAD values in the fruit expansion stage, Table 5 shows that the XGBoost model performed best on its training set, the R2 value was 0.752, the degree of fitting was relatively good, and the RMSE and MAE were the minimum (0.945 and 0.772) compared with those of the other models, indicating its relatively high prediction accuracy on the training set. However, its prediction accuracy for the R2 on the validation set declined to 0.684, which was lower than those of the other four models, which might be attributed to over-fitting. The PLSR model performed best on the validation set in comparison with the other four models, the R2 value was 0.793, the RMSE was 0.856 and the MAE was 0.628, indicating the relatively high prediction accuracy and generalization ability on the validation set. The R2 value of the RF model on the training set was 0.727 and that on the validation set was 0.767, maintaining good consistency on the two datasets and exhibiting robust generalization ability. The comprehensive performance of the MLR model on the training set and validation set was slightly inferior to that of the RF and PLSR models. The SVR model performed poorly in the R2 on the training set, but its R2 value on the validation set reached 0.759, and the accuracy of its predicted data was higher than that of the XGBoost model. Figure 11 displays the relationship between the predicted and measured leaf SPAD values obtained by the five regression models in the fruit expansion stage. It can be known from Figure 11 that the data estimation results of the MLR and PLSR models for the training set and validation set were approximate, individual data points of the validation set in the PLSR model were closer to the 1:1 line, and higher prediction accuracy than the MLR model was observed. The data points in the validation set of the SVR, RF and XGBoost models were distributed around the regression line, but the high SPAD values in the validation set were distributed dispersedly. The above analysis reveals that among the five regression models in the fruit expansion stage, the PLSR model shows relatively high prediction accuracy and generalization ability.
For the estimation models of the leaf SPAD values in the fruit-coloring stage, Table 5 shows that the XGBoost model performed most outstandingly on its training set among the five models, the R2 value reached 0.867, along with the minimum RMSE and MAE values (0.639 and 0.559, respectively) compared with the other four models, exhibiting its good data-fitting ability. Nevertheless, its R2 value on the validation set declined by 21.3% in comparison with that on the training set. Among all the models, the MRL model had the highest prediction accuracy on the validation set, and the R2 value was 0.715, which grew by 10.3% compared with that on the training set. The R2 value of the PLSR model on the training set was 0.640, but its prediction accuracy for the R2 on the validation set reached 0.691, second only to that of the MLR model. The RF model performed stably on the training set and validation set, and its comprehensive accuracy was slightly lower than that of the MLR and PLSR models. The SVR model performed weakly on the training set, but its R2 value on the validation set was 0.688, while its prediction ability was stronger than that of the RF and XGBoost models. Figure 12 displays the relationship between the predicted and measured leaf SPAD values of the five regression models in the fruit-coloring stage. It can be known from Figure 12 that the scatter points in the training set and validation set of the MLR and PLSR models were distributed approximately, but the regression line of the validation set in the MLR model was closer to the 1:1 line and the predicted value was more approximate to the measured value. Some data points in the validation set of the SVR and RF models deviated a lot from the 1:1 line in the high SPAD values, and the data points in the training set of the XGBoost model were all distributed near the regression line of the training set, but the data points in the validation set were relatively scattered and distant from the 1:1 line. The above analysis indicates that among the five regression models in the fruit-coloring stage, the MLR model possesses relatively high prediction accuracy and generalization ability.
As for the estimation model for the leaf SPAD values in the fruit-maturing stage, Table 5 shows that among the five models, the RF model performed best on its training set and validation set, with R2 values of 0.759 and 0.755, respectively, accompanied by relatively high prediction accuracy and generalization ability. The XGBoost model performed well on the training set with a R2 value of 0.742, but its generalization ability on the validation set was slightly inferior to that of the RF model with a R2 value of 0.725. The R2 values of the MLR model on the training set and validation set were 0.685 and 0.608, respectively, and its prediction ability was weaker than that of the RF and XGBoost model. Among the five regression models, the PLSR model reached the minimum R2 value (0.593) on the training set, the RMSE and MAE values were 1.376 and 1.071, respectively, and the predictive error was also high, but its R2 value on the validation set increased by 3.2% compared with that on the training set. The SVR model performed better than the PLSR model in the R2 on the training set, but it showed the poorest performance in the R2 on the validation set among the five regression models. Figure 13 shows the relationship between the predicted and measured leaf SPAD values of the five regression models in the fruit-maturing stage. It can be seen from Figure 13 that the regression fitting line of the MLR model on the validation set was distant from the 1:1 line, and the data points in the high SPAD values were dispersed, indicating the relatively low prediction accuracy. Most data points in the validation set of the PLSR and SVR models were distributed closely to the diagonal line, but they deviated a lot from the 1:1 line in the low-SPAD areas. Most data points in the validation set of the RF and XGBoost models were close to the diagonal line, but some data points of the XGBoost model were dispersed to a greater extent; hence, RF has the higher prediction accuracy. The above analysis reveals that among the five regression models in the fruit-maturing stage, the RF model exhibits relatively high prediction accuracy and generalization ability.
To sum up, the different models in the different growth stages differed in the prediction accuracy. To better compare the prediction performance of the different models in different growth stages, the variation trend chart of the evaluation indicators of the five models in different growth stages was plotted (Figure 14). It could be clearly seen from the variation trend of the R2 that each model in the flower-falling stage and fruit-setting stage showed relatively low prediction accuracy, the R2 values of the MLR, PLSR, SVR and XGBoost models in the fruit-setting stage declined by 3.03%, 2.16%, 20.70% and 5.75%, respectively, compared with those in the flower-falling stage, and the overall validation accuracy showed a declining trend. The estimation accuracy of the five regression models in the fruit expansion stage was significantly improved, the R2 values, respectively, reached 0.787, 0.793, 0.759, 0.767 and 0.772, and the prediction ability of the models was the strongest in this stage. In the fruit-coloring stage, the R2 value of each model started declining, and the R2 values of the MLR, PLSR, SVR, RF and XGBoost models were 0.715, 0.691, 0.688, 0.644 and 0.682, respectively, but still maintained a relatively high level. In the fruit-maturing stage, the prediction performance of each model declined to some extent, and the R2 values of the MLR, PLSR and SVR models decreased by 14.9%, 11.43% and 11.77% compared with those in the fruit-coloring stage. The performance of the same model in estimating the SPAD value in the different growth stages was also varied, where the RF model showed stronger stability and reliability in SPAD estimation in the flower-falling stage, fruit-setting stage and fruit-maturing stage. PLSR exhibited better generalization ability and prediction accuracy in the fruit expansion stage. MLR performed better in SPAD estimation in the fruit-coloring stage. Through the comprehensive analysis, the fruit expansion stage is the best stage for SPAD estimation, and the models in the fruit-setting stage and fruit-maturing stage perform relatively poorly.
Based on the optimal estimation model of the SPAD at each growth stage of apple trees and the multispectral images of unmanned aerial vehicles in the experimental area, the spatial distribution inversion of the SPAD values in the experimental area was carried out, and the inversion map of the SPAD in the canopy of the experimental area was obtained (Figure 15). The color of the SPAD value in the distribution map, from green to red, represents the change in the chlorophyll content from high to low, clearly showing the spatial heterogeneity of the relative chlorophyll content at each growth stage of the apple orchard. The spatial distribution of the SPAD is generally in a strip-shaped pattern, which is consistent with the row direction of fruit tree planting. Among them, the areas with lower SPAD values (red areas) are mainly concentrated in the gap between the soil interzone and the fruit tree canopy. The SPAD values in the apple tree planting area change continuously, and the relative chlorophyll content generally varies between 30 and 56. The color of the apple tree planting area during the flowering stage and fruit-setting stage is relatively light green, while the color of the apple tree area during the fruit expansion period and its later stage is darker. This is in line with the growth law of apple trees. Overall, the SPAD values of most apple trees in the study area were within the normal range, and the chlorophyll content was normal. Visualizing the spatial distribution map through the SPAD values can reflect the spatial distribution characteristics of the SPAD values more clearly and intuitively.

4. Discussion

The changes in the leaf SPAD value of apple trees in different growth stages are closely related to their physiological activities and environmental adaptability [38]. Generally, the leaf SPAD value in the flower-falling stage is relatively low, because trees mainly apply the delivered energy to flowering and initial fruit formation. Therefore, the monitoring of the SPAD values in leaves in this stage can help evaluate the quantity and quality of flowers in fruit trees, thus forming a basis for the follow-up prediction of the fruit setting rate. From the fruit-setting stage to the fruit-coloring stage, the leaf SPAD value starts rising with the rapid expansion of leaves and the enhancement of photosynthesis. The high leaf SPAD values indicate the good photosynthetic efficiency of apple trees, which can facilitate the development of apple fruits. The fruit-coloring stage is a critical stage before fruit maturation. A moderate leaf SPAD value can ensure sufficient carbohydrate supply, which will influence fruit coloring and flavor development. In the fruit-maturing stage, the measured SPAD value declines somehow due to the increasing nutrient requirements and the aging of some leaves in the maturation process of fruits. In the whole growth stage, the leaf SPAD value firstly increases and then decreases, which coincides with the research conclusion drawn by Huang [39].
The correlation between the vegetation indexes and the SPAD value can help understand which vegetation index has the strongest indication of the chlorophyll content of apple trees in different growth stages. The measured SPAD values of apple trees at various growth stages had strong correlations and linear sensitivity with most vegetation indexes; however, the predictive efficacy of individual vegetation indexes exhibited significant stage-dependent variability. The best combination of vegetation indexes in each growth stage should be based on the physiological characteristics and environmental conditions of that stage, giving priority to those indexes highly sensitive to the chlorophyll concentration, and a single vegetation index may fail to fully describe the complex biophysical process. In the study of winter wheat yield estimation, Guo K et al. [40] proposed that the accuracy of the winter wheat yield estimation can be further improved by using multiple vegetation indexes. In this study, therefore, five index combinations with the optimal correlation in each growth stage were chosen for modeling to improve the prediction accuracy. Different regression models are different to some extent in terms of the SPAD inversion accuracy of apple trees in different growth stages. It is necessary to effectively construct the relationship between the vegetation indexes and the SPAD by selecting an appropriate model, thus estimating the SPAD value more accurately [41]. In this study, the RF model has stronger stability and reliability in estimating the SPAD of leaves in the flower-falling stage, fruit-setting stage and fruit-maturing stage, has a good fitting effect and prediction accuracy and can handle nonlinear and complex interactions, maintaining relatively stable performance in most growth stages. This is consistent with the conclusion obtained by López-Calderón et al. [42], that is, the RF algorithm is efficient and robust when processing complex data; especially, its anti-noise ability is markedly superior to that of the other models in case of the aggravated nutrition competition in the fruit-setting stage. The MLR model exhibits specific prediction ability in the fruit-coloring stage, but it performs slightly poorer than the other models in the other growth stages, reflecting its limited fitting effect and prediction accuracy. This is possibly because MLR will assume a linear relation between variables in the training process, while this assumption will be too simple in complex biological processes, failing to capture nonlinear growth modes, which coincides with the conclusion of Qi H et al. [43] when estimating the leaf area index of wheat. The PLSR model shows good generalization ability on the validation set in the fruit expansion stage, which is consistent with the conclusion of Ma R F et al. [44]. The chlorophyll inversion accuracy can be effectively improved by the dimension reduction of high-dimensional spectral data based on the main components of the PLSR model. The XGBoost model has the most outstanding performance on the training set in the fruit-coloring stage, displaying extremely high fitting ability; however, the R2 value of the XGBoost model on the training set is significantly higher than that on the validation set in the fruit-coloring stage and fruit-maturing stage. This gap manifests the over-fitting problem of the model during data training. This is possibly because the noise in the training data is excessively captured, which, however, cannot be reproduced in the validation set. The leaf SPAD value can be inverted more accurately by selecting the most appropriate model in specific growth stages. The comprehensive analysis reveals that the fruit expansion stage is the best SPAD estimation stage, and the models in the fruit-setting stage and fruit-maturing stage perform relatively poorly.
Despite the promising results achieved in this study, there are several limitations that should be acknowledged. Firstly, this study was conducted in a specific region and focused on a single fruit tree species, apple trees. Due to variations in the environmental conditions, tree physiology, and management practices, further research is needed to validate the models across a broader range of species and regions. Secondly, this study focused on the canopy leaves of apple trees, and the SPAD content of other parts of the tree, such as the lower branches or the trunk, could also be an important indicator of the tree’s health and nutritional status. Future studies should consider a more comprehensive sampling strategy to capture the full spectrum of the tree’s physiological conditions. Lastly, this study did not account for the potential impact of external factors such as weather conditions, pests, and diseases on the SPAD content. These factors may influence the growth and health of apple trees. Incorporating additional data related to these factors could improve the robustness and reliability of the models.

5. Conclusions

In this study, based on the SPAD values of leaves in different growth stages of apple trees, remote sensing data on orchards were obtained by using a multispectral camera carried by a UAV. Fifteen selected vegetation indexes were combined with five modeling algorithms, namely MLR, PLSR, SVR, RF and XGBoost, to establish 25 prediction models in five growth stages of fruit. Moreover, grid search and cross-validation were adopted to seek the optimal hyperparameter combination and evaluate the model generalization, avoiding over-fitting for model optimization. The research findings show that the best estimation model for the SPAD in the canopy leaves of apple trees in the five growth stages is varied, where the best estimation model in the flower-falling stage and fruit-setting stage is RF; the accuracy of RF on the validation set in the flower-falling stage is expressed as R2 = 0.557, RMSE = 0.125 and MAE = 1.003; that of RF on the validation set in the fruit-setting stage as R2 = 0.6, RMSE = 1.2 and MAE = 0.921; the best estimation model in the fruit expansion stage is PLSR, R2 = 0.787, RMSE = 0.87 and MAE = 0.644; the best estimation model in the fruit-coloring stage is MLR, R2 = 0.715, RMSE = 0.885 and MAE = 0.691; and the best estimation model in the fruit-maturing stage is RF, R2 = 0.755, RMSE = 1.264 and MAE = 1.017.
This study provides important information for understanding the growth and changes of apple trees by continuously monitoring the SPAD values of apple leaves in different growth stages. High-resolution multispectral images were acquired through agricultural UAV remote sensing technology, realizing large-scale and high-frequency monitoring of orchards and providing efficient technical means for large-scale orchard management. The accurate prediction of the leaf SPAD can help planters to better master the growth status of fruit trees, make timely adjustments to management measures, further improve the fruit yield and quality and increase the economic benefits. The R2 value of the best model in each growth stage is 0.557–0.787, which can satisfy the general management demands of orchards. However, the accuracy of the SPAD prediction will be affected by various factors (e.g., errors in instrument acquisition, environmental dynamic change and plants physiological factors [45], et al.). In a future study, more comprehensive datasets should be established by combining more diversified sensor data (e.g., soil humidity sensor data and meteorological data), and the accuracy of prediction models should be improved through multi-source data fusion and mixed modeling. This will lay a more solid scientific foundation for the scientific and efficient management of orchards, so as to facilitate further optimization and meet the requirements of precision agriculture.

Author Contributions

Conceptualization, J.W.; methodology, J.W., Y.Z. and Q.C.; software, F.H., Z.S. and F.Z. (Fu Zhao); data curation, F.Z. (Fengzi Zhang), W.P. and Y.Z.; investigation, J.W., Y.Z. and Z.Z.; writing—original draft, J.W.; writing—review and editing, J.W.; funding acquisition, J.W., Q.C. and Z.Z. All authors have read and agreed to the published version of the manuscript.

Funding

This research was funded by the Key Research Project of Shanxi Province (202102020101012), the National Natural Science Foundation of China (11802167), and the Applied Basic Research Project of Shanxi Province (201801D221297).

Institutional Review Board Statement

Not applicable.

Data Availability Statement

The data reported in this study are contained within the article and are available upon request from the corresponding author. The data are not publicly available due to copyright implications.

Acknowledgments

The authors would like to thank the technical editor and anonymous reviewers for their constructive comments and suggestions on this study.

Conflicts of Interest

The authors declare no conflicts of interest.

References

  1. Argenta, C.L.; Amarante, D.T.V.C.; Betinelli, S.K.; Brancher, L.T.; Nesi, N.C.; Vieira, J.M. Comparison of fruit attributes of ‘Fuji’ apple strains at harvest and after storage. Sci. Hortic. 2020, 272, 109585. [Google Scholar] [CrossRef]
  2. Abasi, S.; Minaei, S.; Jamshidi, B.; Fathi, D. Development of an optical smart portable instrument for fruit quality detection. IEEE Trans. Instrum. Meas. 2021, 70, 7000109. [Google Scholar] [CrossRef]
  3. Wang, S.; He, P.; Wang, X.; Wang, H.; Chang, S.; Zheng, W.; Li, L.; He, X. Correlation analysis between soil acidity and fruit nutrient elements in apple orchards in Shandong Province. China Fruits 2024, 3, 21–25. [Google Scholar]
  4. Barman, U.; Choudhury, R.D. Smartphone image based digital chlorophyll meter to estimate the value of citrus leaves chlorophyll using linear regression, LMBP–ANN and SCGBP–ANN. J. King Saud Univ. Comput. Inf. Sci. 2022, 34, 2938–2950. [Google Scholar] [CrossRef]
  5. Liu, Y.; Hatou, K.; Aihara, T.; Kurose, S.; Akiyama, T.; Kohno, Y.; Lu, S.; Omasa, K. A robust vegetation index based on different UAV RGB images to estimate SPAD values of naked barley leaves. Remote Sens. 2021, 13, 686. [Google Scholar] [CrossRef]
  6. Liu, Y. Exploring the Application of UAV-Based Remote Sensing Technology in Agricultural Pest and Disease Monitoring. Hebei Agric. Mach. 2025, 4, 21–23. [Google Scholar]
  7. Deng, S.; Zhao, Y.; Bai, X.; Li, X.; Sun, Z.; Liang, J.; Li, Z.; Cheng, S. Inversion of chlorophyll and leaf area index for winter wheat based on UAV image segmentation. Trans. Chin. Soc. Agric. Eng. 2022, 38, 136–145. [Google Scholar]
  8. Liu, Y. Correlation between Detection of Chlorophyll Content in Hami Melon Canopy and Crop Phenotype Based on Digital Images. Master’s Thesis, Xinjiang Agricultural University, Ürümqi, China, 2023. [Google Scholar]
  9. Yin, H.; Li, F.; Yang, H.; Li, Y. Estimation of canopy chlorophyll in potato based on UAV hyperspectral images. J. Plant Nutr. Fertil. 2021, 27, 2184–2195. [Google Scholar]
  10. Liu, B.; Yuan, D.; Ding, L.; Li, Y.; Xu, Y.; Wang, W. Estimation of SPAD and nitrogen values of winter wheat based on unmanned aerial vehicle multispectral images. J. Chin. Agric. Mech. 2025, 46, 144–150. [Google Scholar] [CrossRef]
  11. Ma, W.; Han, W.; Zhang, H.; Cui, X.; Zhai, X.; Zhang, L.; Shao, G.; Niu, Y.; Huang, S. UAV multispectral remote sensing for the estimation of SPAD values at various growth stages of maize under different irrigation levels. Comput. Electron. Agric. 2024, 227, 109566. [Google Scholar] [CrossRef]
  12. Zhu, Q.; Zhu, Y.; Wang, A.; Zhang, L. Accurate Inversion of Rice Chlorophyll Content by Integrating MultIspectral and Textture Features Derived from UAV Multispectral Imagery. Trans. Chin. Soc. Agric. Mach. 2024, 55, 287–293. [Google Scholar]
  13. Gu, H.; Xue, C.; Wang, G.; Lan, Y.; Wang, H.; Song, C. UAV-Based Multispectral Inversion of Integrated Cotton Growth. Agronomy 2024, 14, 2903. [Google Scholar] [CrossRef]
  14. Ma, L.; Hu, N.; Li, W.; Qin, W.; Huang, S.; Wang, Z.; Li, F.; Yu, K. Using multispectral drone data to monitor maize’s response to various irrigation modes. J. Plant Nutr. Fertil. 2022, 28, 743–753. [Google Scholar]
  15. Li, Z.; Su, J.; Fei, C.; Li, Y.; Liu, N.; Fan, H.; Chen, B. Estimation of chlorophyll content in sugar beet under drip irrigation based on hyperspectral data. J. Agric. Resour. Environ. 2020, 37, 761–769. [Google Scholar]
  16. Zhou, M.; Shao, G.; Zhang, L.; Liu, Z.; Han, W. Multi-spectral Inversion of SPAD Value of Winter Wheat Based on Unmanned Aerial Vehicle Remote Sensing. Water Sav. Irrig. 2019, 9, 40–45. [Google Scholar]
  17. Huo, Y.; Zhao, S.; Zhao, G.; Sun, J.; Hu, S. Detection Method of Chlorophyll Content in Canopy of Kiwifruit Orchard Based on UAV. Trans. Chin. Soc. Agric. Mach. 2024, 55, 297–307. [Google Scholar]
  18. Samarakoon, S.; Rupasinghe, C.; Seneweera, S. Coconut leaf nitrogen measurement using different vegetative indices and multispectral images. Smart Agric. Technol. 2025, 10, 100672. [Google Scholar] [CrossRef]
  19. Zhou, Q.; Wang, J.; Huo, Z.; Liu, C.; Wang, W.; Ding, L. UAV Multi-Spectral Remote Sensing Estimation of Wheat Canopy SPAD Value in Different Growth Periods. Spectrosc. Spectr. Anal. 2023, 43, 1912–1920. [Google Scholar]
  20. Zhou, H.; Huang, F.; Lou, W.; Gu, Q.; Ye, Z.; Hu, H.; Zhang, X. Yield prediction through UAV-based multispectral imaging and deep learning in rice breeding trials. Agric. Syst. 2025, 223, 104214. [Google Scholar] [CrossRef]
  21. Yin, Q.; Zhang, Y.; Li, W.; Wang, J.; Wang, W.; Ahmad, I.; Huo, Z. Estimation of Winter Wheat SPAD Values Based on UAV Multispectral Remote Sensing. Remote Sens. 2023, 15, 3595. [Google Scholar] [CrossRef]
  22. Wu, S.; Deng, L.; Guo, L.; Wu, Y. Wheat leaf area index prediction using data fusion based on high-resolution unmanned aerial vehicle imagery. Plant Methods 2022, 18, 68. [Google Scholar] [CrossRef] [PubMed]
  23. Xue, X.; Wu, Y. Chlorophyll Content Determination and Its Relationship with SPAD Value in Wheat. Hubei Agric. Sci. 2010, 49, 2701–2702+2751. [Google Scholar]
  24. Boiarskii, B.; Hasegawa, H. Comparison of NDVI and NDRE indices to detect differences in vegetation and chlorophyll content. J. Mech. Contin. Math. Sci. 2019, 4, 20–29. [Google Scholar] [CrossRef]
  25. Lelong, C.C.D.; Burger, P.; Jubelin, G.; Roux, B.; Labbé, S.; Baret, F. Assessment of Unmanned Aerial Vehicles Imagery for Quantitative Monitoring of Wheat Crop in Small Plots. Sensors 2008, 8, 3557. [Google Scholar] [CrossRef]
  26. Zurita-Milla, R.; Kaiser, G.; Clevers, J.G.P.W.; Schneider, W.; Schaepman, M.E. Downscaling time series of MERIS full resolution data to monitor vegetation seasonal dynamics. Remote Sens. Environ. 2009, 113, 1874–1885. [Google Scholar] [CrossRef]
  27. Chen, S.; Chen, Y.; Chen, J.; Zhang, Z.; Fu, Q.; Bian, J.; Cui, T.; Ma, Y. Retrieval of cotton plant water content by UAV-based vegetation supply water index (VSWI). Int. J. Remote Sens. Environ. 2020, 41, 4389–4407. [Google Scholar] [CrossRef]
  28. Liu, H.; Bruning, B.; Garnett, T.; Berger, B. The Performances of Hyperspectral Sensors for Proximal Sensing of Nitrogen Levels in Wheat. Sensors 2020, 20, 4550. [Google Scholar] [CrossRef]
  29. Li, D.; Ruan, S.; Hu, Q.; Zhang, J.; Zhang, Y.; Dian, Y.; Hu, C.; Liu, Y.; Lei, H.; Zhou, J. Nitrogen estimation and spatial analysis of orchard canopy based on UAV remote sensing. J. Huazhong Agric. Univ. 2023, 42, 158–166. [Google Scholar]
  30. Ren, H.; Zhou, G.; Zhang, F. Using negative soil adjustment factor in soil-adjusted vegetation index (SAVI) for aboveground living biomass estimation in arid grasslands. Remote Sens. Environ. 2018, 209, 439–445. [Google Scholar] [CrossRef]
  31. Radočaj, D.; Šiljeg, A.; Marinović, R.; Jurišić, M. State of Major Vegetation Indices in Precision Agriculture Studies Indexed in Web of Science: A Review. Agriculture 2023, 13, 707. [Google Scholar] [CrossRef]
  32. Tanaka, S.; Kawamura, K.; Maki, M.; Muramoto, Y.; Yoshida, K.; Akiyama, T. Spectral Index for Quantifying Leaf Area Index of Winter Wheat by Field Hyperspectral Measurements: A Case Study in Gifu Prefecture, Central Japan. Remote Sens. 2015, 7, 5329–5346. [Google Scholar] [CrossRef]
  33. Zhou, X.; Qin, N.; Wang, K.; Sun, H.; Wang, D.; Qiao, J. Effect of Mechanical Compaction on Soybean Yield Based on Machine Learning. Trans. Chin. Soc. Agric. Mach. 2023, 54, 139–147. [Google Scholar]
  34. Zhang, C.; Xue, Y. Estimation of Biochemical Pigment Content in Poplar Leaves Using Proximal Multispectral Imaging and Regression Modeling Combined with Feature Selection. Sensors 2023, 24, 217. [Google Scholar] [CrossRef]
  35. Zhou, Y. Monitoring Wheat Growth and Yield Estimation Using UAV Image Data. Mater’s Thesis, Yangzhou University, Yangzhou, China, 2023. [Google Scholar]
  36. Sarkar, T.K.; Roy, D.K.; Kang, Y.S.; Jun, S.R.; Park, J.W.; Ryu, C.S. Ensemble of Machine Learning Algorithms for Rice Grain Yield Prediction Using UAV-Based Remote Sensing. J. Biosyst. Eng. 2023, 49, 1–19. [Google Scholar] [CrossRef]
  37. Xia, Z.; Liu, Z.; Hu, Q.; Bao, C.; Zhang, R. Construction and Verification of Pulmonary Nodules Invasion Prediction Model Based on XGBoost Machine Learning Algorithm: A Two-center Study. Chin. J. CT MRI 2024, 22, 166–169. [Google Scholar]
  38. Wang, W.; Cheng, Y.; Ren, Y.; Zhang, Z.; Geng, H. Prediction of Chlorophyll Content in Multi-Temporal Winter Wheat Based on Multispectral and Machine Learning. Front. Plant Sci. 2022, 13, 896408. [Google Scholar] [CrossRef]
  39. Huang, Y. Key Technology Research on Chlorophyll Content Monitoring of Fruit Trees. Ph.D. Thesis, Hebei Agricultural University, Baoding, China, 2022. [Google Scholar]
  40. Guo, K.; Ye, Y.; Yang, Z.; Fang, X. Adaptability Evaluation of Winter Wheat Yield Estimation Based on LSTM. Resour. Guide 2025, 2, 39–43. [Google Scholar]
  41. Peng, Y.; Fan, M.; Song, J.Y.; Cui, T.; Li, R. Assessment of plant species diversity based on hyperspectral indices at a fine scale. Sci. Rep. 2018, 8, 4776. [Google Scholar] [CrossRef]
  42. López-Calderón, M.J.; Estrada-Ávalos, J.; Rodríguez-Moreno, V.M.; Mauricio-Ruvalcaba, J.E.; Martínez-Sifuentes, A.R.; Delgado-Ramírez, G.; Miguel-Valle, E. Estimation of total nitrogen content in forage maize (Zea mays L.) using spectral indices: Analysis by random forest. Agriculture 2020, 10, 451. [Google Scholar] [CrossRef]
  43. Qi, H.; Sun, H.; Lü, L.; Li, S.; Min, J.; Hou, L. Wheat Leaf Area Index Estimation Based on Fusion of UAV Multispectral Information and Texture Features. Trans. Chin. Soc. Agric. Mach. 2025, 56, 334–344. [Google Scholar]
  44. Ma, R.; Chen, Y.; Hou, P.; Ren, X. Progress on Hyperspectral Remote Sensing Inversion Method for Vegetation Chlorophyll Content. For. Grassl. Resour. Res. 2024, 5, 166–178. [Google Scholar]
  45. Jiang, H.; Yang, H.; Chen, X.; Wang, S.; Li, X.; Liu, K.; Cen, Y. Research on Accuracy and Stability of Inversing Vegetation Chlorophyll Content by Spectral Index Method. Spectrosc. Spectr. Anal. 2015, 35, 975–981. [Google Scholar]
Figure 1. Overview of the experimental area.
Agriculture 15 01308 g001
Figure 2. DJI Mavic 3 multispectral UAV.
Agriculture 15 01308 g002
Figure 3. UAV-shot gray board image.
Agriculture 15 01308 g003
Figure 4. Reconstructed complete image of apple trees in the fruit-coloring stage: (a) RGB; (b) green; (c) NIR; (d) red; and (e) red edge.
Agriculture 15 01308 g004
Figure 5. Image before and after eliminating the soil background: (a) before removal; and (b) after removal.
Agriculture 15 01308 g005
Figure 6. SPAD measurement of apple tree leaves.
Agriculture 15 01308 g006
Figure 7. Statistical chart of the SPAD values of the sampled fruit trees.
Agriculture 15 01308 g007
Figure 8. Correlation between the vegetation indexes in different growth stages and the SPAD value: (a) flowering stage; (b) fruit-setting stage; (c) fruit enlargement stage; (d) fruit-coloring stage; and (e) maturation stage.
Agriculture 15 01308 g008
Figure 9. Relationship between the predicted and measured SPAD values of each model in the flower-falling stage: (a) MLR; (b) PLSR; (c) SVR; (d) RF; and (e) XGBoost.
Agriculture 15 01308 g009
Figure 10. Relationship between the predicted and measured SPAD values of the different models in the fruit-setting stage: (a) MLR; (b) PLSR; (c) SVR; (d) RF; and (e) XGBoost.
Agriculture 15 01308 g010
Figure 11. Relationship between the predicted and measured SPAD values of the different models in the fruit expansion stage: (a) MLR; (b) PLSR; (c) SVR; (d) RF; and (e) XGBoost.
Agriculture 15 01308 g011
Figure 12. Relationship between the predicted and measured SPAD values of the different models in the fruit–coloring stage: (a) MLR; (b) PLSR; (c) SVR; (d) RF; and (e) XGBoost.
Agriculture 15 01308 g012
Figure 13. Relationship between the predicted and measured SPAD values of the different models in the fruit-maturing stage: (a) MLR; (b) PLSR; (c) SVR; (d) RF; and (e) XGBoost.
Agriculture 15 01308 g013
Figure 14. Comparison of the estimation accuracy of the five models set at different growth stages.
Agriculture 15 01308 g014
Figure 15. Spatial distribution map of the SPAD values in the study area at each growth stage: (a) flowering stage; (b) fruit-setting stage; (c) fruit enlargement stage; (d) fruit-coloring stage; and (e) maturation stage.
Agriculture 15 01308 g015
Table 1. Date and quantity of the acquired multispectral images of fruit trees.
Image Acquisition TimeGrowth StageNumber of Images
11 May 2024Flowering stage865
28 June 2024Fruit-setting stage865
28 July 2024Fruit enlargement stage865
30 August 2024Fruit-coloring stage865
7 October 2024Maturation stage865
Table 2. Reflectance of the gray board at its central wavelength.
Band NumberBand NameCenter Wavelength (nm)Bandwidth (nm)Gray Panel Reflectance
1Green560320.5102
2Red650320.5071
3Red Edge730320.5086
4NIR840520.4945
Table 3. Vegetation indexes and their calculation formulas.
Vegetation IndexValueReferences
Normalized Difference Vegetation Index (NDVI)(RNIRRRED)/(RNIR + RRED)[24]
Green Normalized Difference Vegetation Index (GNDVI)(RNIRRGREEN)/(RNIR + RGREEN)[25]
Leaf Chlorophyll Index (LCI)(RNIRRREDEDGE)/(RNIR + RRED)[26]
Greenness Index (GI)RGREEN/RRED[27]
Ratio Vegetation Index (RVI)RNIR/RRED[28]
Difference vegetation index (DVI)RNIRRRED[28]
Green Ratio Vegetation Index (GRVI)RNIR/RGREEN[29]
Green Difference Vegetation Index (GDVI)RNIRRGREEN[29]
Red–Green Ratio Index (RGRI)RRED/RGREEN[29]
Soil-Adjusted Vegetation Index (SAVI)1.5 × (RNIRRRED)/(RNIR + RRED + 0.5)[30]
Optimized Soil-Adjusted Vegetation Index (OSAVI)1.16 × (RNIRRRED)/(RNIR + RRED + 0.16)[31]
Normalized Difference Red Edge Index (NDRE)(RNIRRRED)/(RNIR + RRED)[24]
Modified Simple Ratio (MSR)(RNIRRGREEN)/(RNIR + RGREEN)[32]
Enhanced Vegetation Index 2(EVI2)(RNIRRREDEDGE)/(RNIR + RRED)[32]
Normalized Difference Red Edge Index(NRI)RGREEN/RRED[32]
Note: RNIR denotes NIR reflectance; RRED stands for infrared reflectance; RGREEN is green light reflectance; RREDEDGE represents red edge reflectance.
Table 4. Statistical data of the SPAD values of fruit trees in different growth stages.
Growth StageSample SizeMinimumMaximumMean ± Standard DeviationCoefficient of Variation
Flowering stage5529.16337.36932.739 ± 1.8275.6%
Fruit-setting stage5537.95047.56243.051 ± 2.1855.1%
Fruit enlargement stage5542.49250.36745.645 ± 1.9134.2%
Fruit-coloring stage5542.25348.90845.796 ± 1.7373.8%
Maturation stage5532.20040.81735.734 ± 2.2676.3%
Table 5. Accuracy evaluation of the estimation models for the SPAD values in the leaves during different growth stages.
Growth StageModelTraining SetValidation Set
R2RMSEMAER2RMSEMAE
Flowering stageMLR0.5451.1300.9000.5271.4151.136
PLSR0.4571.2831.0100.5551.2901.116
SVR0.4341.2630.9350.5411.3951.238
RF0.5321.1880.9840.5571.2501.003
XGBoost0.5411.2490.9660.5041.2101.035
Fruit-setting stageMLR0.6101.3931.1520.5111.3061.012
PLSR0.4611.6391.3360.5431.2621.002
SVR0.4271.7331.3980.4291.4051.181
RF0.5221.5731.2130.6001.2000.921
XGBoost0.4801.6101.2540.4751.3530.978
Fruit enlargement stageMLR0.6351.1480.9640.7870.8700.644
PLSR0.6301.1550.9700.7930.8560.628
SVR0.6121.1821.0220.7590.9250.709
RF0.7270.9910.7650.7670.9090.681
XGBoost0.7520.9450.7720.6841.0580.764
Fruit-coloring stageMLR0.6481.0340.8260.7150.8850.691
PLSR0.6401.0450.8280.6910.9220.748
SVR0.5801.1310.9610.6880.9260.726
RF0.6471.0360.8270.6440.9900.816
XGBoost0.8670.6360.5590.6820.9350.800
Maturation stageMLR0.6851.2120.9830.6081.3181.025
PLSR0.5931.3761.0710.6121.2330.907
SVR0.6251.2721.0780.6071.4341.023
RF0.7590.9470.7160.7551.2641.017
XGBoost0.7420.9820.7700.7251.3391.037
Disclaimer/Publisher’s Note: The statements, opinions and data contained in all publications are solely those of the individual author(s) and contributor(s) and not of MDPI and/or the editor(s). MDPI and/or the editor(s) disclaim responsibility for any injury to people or property resulting from any ideas, methods, instructions or products referred to in the content.

