1. Introduction
The rapid progress of agricultural mechanization has made combine harvesters essential to modern farming operations. The performance and dependability of these systems play a crucial role in determining both the efficiency of harvest schedules and the financial sustainability of grain production operations. However, as agricultural machinery continues to increase in power and workload capacity, vibration and noise issues have emerged as critical bottlenecks hindering further performance improvement. Recent studies have shown that under typical operating conditions, the overall noise level of combine harvesters generally exceeds 90 dB. Among the various components, the conveyor trough—responsible for material transportation—has been generally estimated to be a major contributor to the machine’s noise output, accounting for approximately 30–40% of the total noise based on typical operating conditions and prior observations. Field measurements indicate that the sound pressure level of the conveyor trough can reach as high as 93–95 dB, making it the second-largest noise source after the engine [
1]. This high-intensity noise not only penetrates the sound insulation barrier of the cab—exposing operators to long-term noise levels exceeding 85 dB, which can lead to hearing loss, accumulated fatigue, and other occupational health concerns—but also interferes with the recognition of equipment condition monitoring signals, thereby increasing operational safety risks. As such, understanding the noise generation mechanisms of the conveyor trough and developing targeted noise reduction technologies have become urgent needs for enhancing the competitiveness of agricultural machinery and safeguarding the health of agricultural workers. Although studies have consistently identified the conveyor trough as one of the primary noise sources in combine harvesters—second only to the engine—current research has predominantly focused on identifying global noise sources and analyzing their transmission paths at the whole-machine level. In contrast, investigations into the specific noise-generation locations and mechanisms within key components such as the conveyor trough remain relatively limited [
2]. A deeper investigation into the generation and propagation mechanisms of conveyor trough noise is not only essential for optimizing noise control strategies and structural design but also plays a critical role in enhancing operator comfort during machine operation [
3,
4,
5].
The primary source of conveyor trough noise is the impact forces generated during the meshing of the chain system and sprockets, which are subsequently transmitted as vibrations to the housing structure. Therefore, accurately identifying and predicting the location and formation mechanisms of these noise sources holds significant engineering value [
6,
7,
8,
9]. Internationally, research on mechanical noise monitoring technology began relatively early, leading to the development of mature sensor deployment strategies [
10,
11,
12], data acquisition, and signal processing methods [
13,
14,
15,
16], with wide applications, particularly in the aerospace, automotive, and heavy machinery sectors [
17]. In the domain of vibration and noise damping design, foreign scholars have extensively investigated the vibration modes of mechanical structures [
18,
19] and noise propagation patterns through finite element analysis and experimental modal testing [
12,
20,
21]. Furthermore, various damping materials and optimized design schemes have been developed [
22,
23,
24]. In recent years, domestic attention to agricultural machinery noise issues has gradually increased, with some scholars conducting preliminary experimental analyses on certain noise sources of combine harvesters [
25,
26,
27]. However, considerable research opportunities remain in the field of conveyor trough noise control.
Although certain achievements have been made in noise measurement and the application of damping materials, systematic noise reduction design for specialized components such as the conveyor trough still faces challenges, including incomplete theoretical models and insufficient validation through simulations. Coupling effect analysis is lacking: most current studies focus on individual noise sources and do not comprehensively analyze the complex coupling mechanisms between vibration and noise [
28]. Moreover, on-site validation remains limited, as most research is conducted in laboratory settings, lacking long-term data monitoring and noise reduction performance evaluation under real operating conditions. To address these issues, this study employs a multi-coherence analysis method to systematically investigate the noise composition of the conveyor trough in combine harvesters. A multi-channel synchronous vibration-noise testing system is established to capture vibration and acoustic signals from critical locations such as the chain meshing area, side plates, and upper plates. By calculating frequency-domain coherence functions, the contribution characteristics of primary noise sources are separated and identified [
29,
30].
Although these studies have achieved certain progress in overall noise control, in-depth research on the precise locations and predictive validation of noise generation from the internal chain system and housing of the conveyor trough in combine harvesters remains limited. Noise monitoring accuracy is insufficient: existing monitoring equipment is prone to interference in high-vibration environments, making it difficult to accurately capture the true distribution and dynamic variation in conveyor trough noise [
17,
31]. Damping design poses significant challenges due to the complex structure of the conveyor trough; selecting appropriate damping materials and determining optimal installation locations while ensuring mechanical strength and normal operation is difficult. Modeling the coupling between vibration and noise propagation requires the development of mathematical models that consider multiple physical parameters and complex boundary conditions [
32]. Collecting representative noise data under multiple operating conditions is challenging, as combine harvesters experience significant variations in operational states. Furthermore, comprehensive evaluation of damping material performance—including durability during prolonged use, environmental adaptability, and cost-effectiveness—requires further investigation.
Structural fatigue induced by long-term vibration is a primary issue faced by the conveyor trough of combine harvesters. Periodic vibrations cause microcracks to develop and propagate within the metal structure, especially at stress concentration zones such as welded joints and bolted connections. This fatigue damage accumulates over time, resulting in a gradual reduction in structural stiffness, which may ultimately lead to deformation or even fracture of the housing, severely compromising the stability and safety of equipment operation [
33,
34]. Practical cases show that untreated conveyor trough housings experience a reduction of over 30% in fatigue life at critical locations after 800–1000 h of operation [
35].
Vibration and impact noise also significantly contribute to the wear of components. During conveyor chain operation, the meshing impact between the drive sprocket and chain accelerates wear on the tooth surfaces [
36], while frictional vibrations between scrapers and side plates increase the gap between contact surfaces. This wear exhibits a clear positive feedback characteristic: initial minor looseness amplifies subsequent vibration amplitudes, which in turn exacerbates wear severity [
37]. Statistical data indicate that under similar working conditions, conveyor troughs subjected to severe vibration have a chain service life approximately 40% shorter than those operating smoothly, with maintenance frequency increasing two to three times.
The health hazards posed by sustained high-noise environments to operators warrant special attention. When conveyor trough noise exceeds 85 dB, prolonged exposure can cause irreversible hearing loss [
38,
39,
40,
41]. Noise not only damages the auditory system but also induces physiological responses such as elevated blood pressure and increased heart rate [
1,
40]. Studies confirm that operators working 8 h in a non-noise-controlled cab exhibit significant auditory fatigue and tinnitus, which may lead to permanent shifts in hearing thresholds over time [
39,
40,
41,
42,
43].
Noise also affects operator comfort on multiple levels. Firstly, mid-to-high-frequency noise directly interferes with the operator’s ability to perceive equipment operating conditions, increasing the risk of operational errors [
1,
5,
40,
44]. Secondly, continuous noise exposure leads to mental stress and cumulative fatigue, reducing reaction speed by 15–20% [
45,
46]. Most critically, resonance noise at specific frequencies can cause symptoms such as dizziness and nausea, posing significant safety hazards. Field tests demonstrate that reducing cab noise by 10 dB can improve operator efficiency by over 25%.
As a key component generating significant noise during combine harvester operation, the conveyor trough’s unique cavity structure produces notable noise radiation. This study treats the conveyor trough as a typical cavity structure and employs a combination of theoretical analysis and experimental testing to investigate its noise characteristics. Acoustic modal analysis is used to reveal the inherent acoustic properties of the conveyor trough, while sound pressure distribution measurements identify primary noise sources. Results indicate that conveyor trough noise is mainly caused by structural vibrations, with low-frequency noise closely related to the cavity structure’s natural vibration modes. This research provides critical theoretical support for low-noise optimization of conveyor trough structures and offers guidance for improving the overall noise performance of combine harvesters.
2. Materials and Methods
2.1. Structural Characteristics of the Conveyor Trough
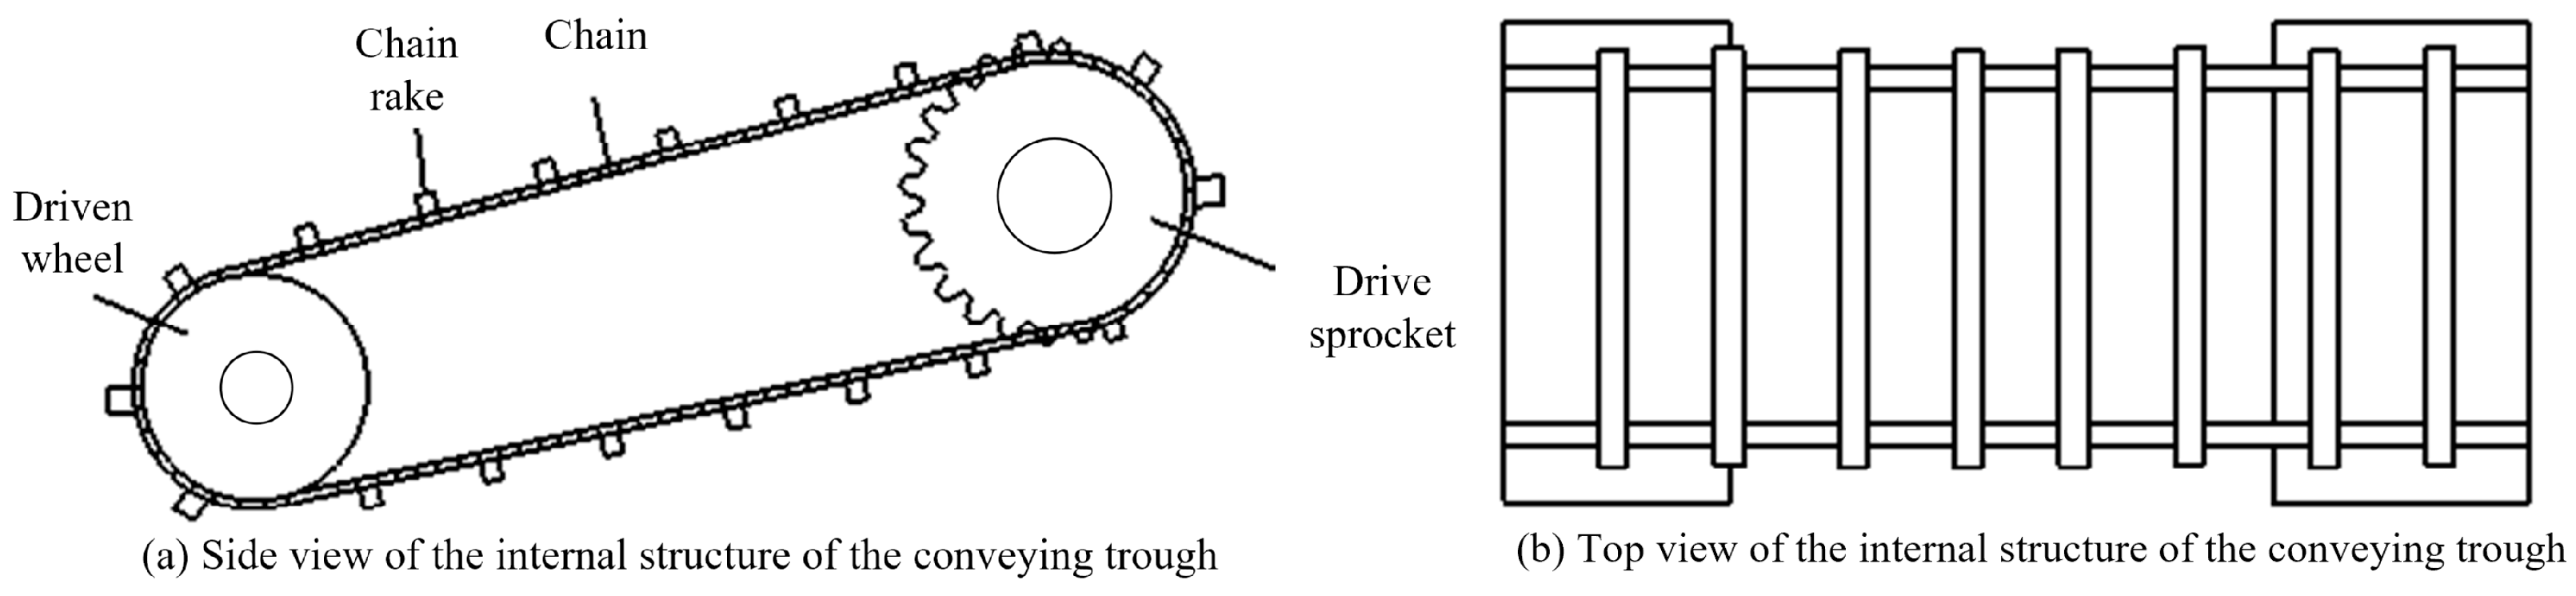
The internal power transmission mechanism of the combine harvester’s conveyor trough operates through the periodic meshing of the drive chain and sprockets, essentially involving the cyclic engagement between chain links and sprocket teeth.
Figure 1 illustrates the internal configuration of the conveyor trough. Due to the inherent elasticity of the drive chain, elastic deformation occurs under tension. According to vibration theory, when the natural frequency of the chain’s free vibration coincides with the frequency of external excitation, resonance will occur in the system.
The vibration and noise generated by the chain drive system during operation primarily originate from two types of dynamic excitation: meshing impact and the polygonal effect. These excitations make the resulting noise essentially impulsive in nature. The underlying mechanism involves abrupt acceleration changes at the moment of engagement between chain links and sprocket teeth. These sudden transitions generate velocity potentials in the surrounding air, which are then converted into sound pressure fluctuations, ultimately manifesting as audible noise. Under high-velocity conditions, this impact demonstrates substantial amplification, where the impact between the chain plates and sprocket teeth becomes more intense, resulting in more prominent acceleration noise.
In addition, the chain drive system within the conveyor trough cannot be excessively tensioned due to operational requirements. While this moderately slack condition ensures the proper functioning of the transmission system, it also makes the chain and scraper prone to jumping or oscillation. Such motion not only directly radiates strong mechanical noise but also induces multiple reflections within the enclosed trough structure, producing a reverberation effect that further amplifies the overall noise intensity. To mitigate this issue, the implementation of a chain guide track structure can be employed to suppress high-frequency vibration amplitudes, thereby effectively reducing the generation of impact noise.
2.2. Noise Analysis of Individual Components
2.2.1. Meshing Impact Between Chain and Sprocket
When the chain engages with the sprocket, the chain link that has already entered the tooth groove rotates synchronously with the driving sprocket, while the adjacent following link is about to begin engagement. At the instant of meshing, although the two adjacent links possess the same linear speed magnitude, their directions of motion differ significantly. When the subsequent link engages with the sprocket tooth, the velocity direction of the link undergoes a sudden change, resulting in an instantaneous velocity variation known as impact velocity . This impact arises from the sudden change in motion direction of the chain link during meshing, and its intensity is primarily governed by the normal component of the impact velocity. Through kinematic transformation, this meshing interaction can be equivalently modeled as the engaging chain link moving into contact with the sprocket at a specific angular velocity while the sprocket remains stationary. This approach yields a clearer mathematical expression for the impact velocity and more accurately captures the physical essence of meshing impact. Such a computational model of impact velocity provides a theoretical foundation for analyzing the dynamic behavior of chain transmission systems, particularly with regard to evaluating meshing-induced noise and vibration.
The impact energy exerted on the sprocket tooth and the chain hinge is given by
, where
is the effective mass involved in the impact,
is the angular velocity of the sprocket,
is the pitch of the chain, and
is the number of teeth on the sprocket. By substituting the impact velocity into the equation, Equation (1) can be expressed as follows:
As shown in Equation (1), the effective number of sprocket teeth has a significant influence on the impact energy—the greater the number of teeth, the lower the resulting impact energy. Since the impact of the rollers on the sprocket limits the normal operating capacity of the conveyor chain, and existing studies have confirmed that the primary source of noise in chain drives is the vibration of rollers and sprockets induced by meshing impacts [
47,
48], reducing the impact between rollers and the sprocket can effectively suppress vibration noise in the conveyor chain system.
The non-uniformity coefficient of chain speed variation at the driving sprocket, denoted as
Kl, can be expressed by Equation (2):
In the equation,
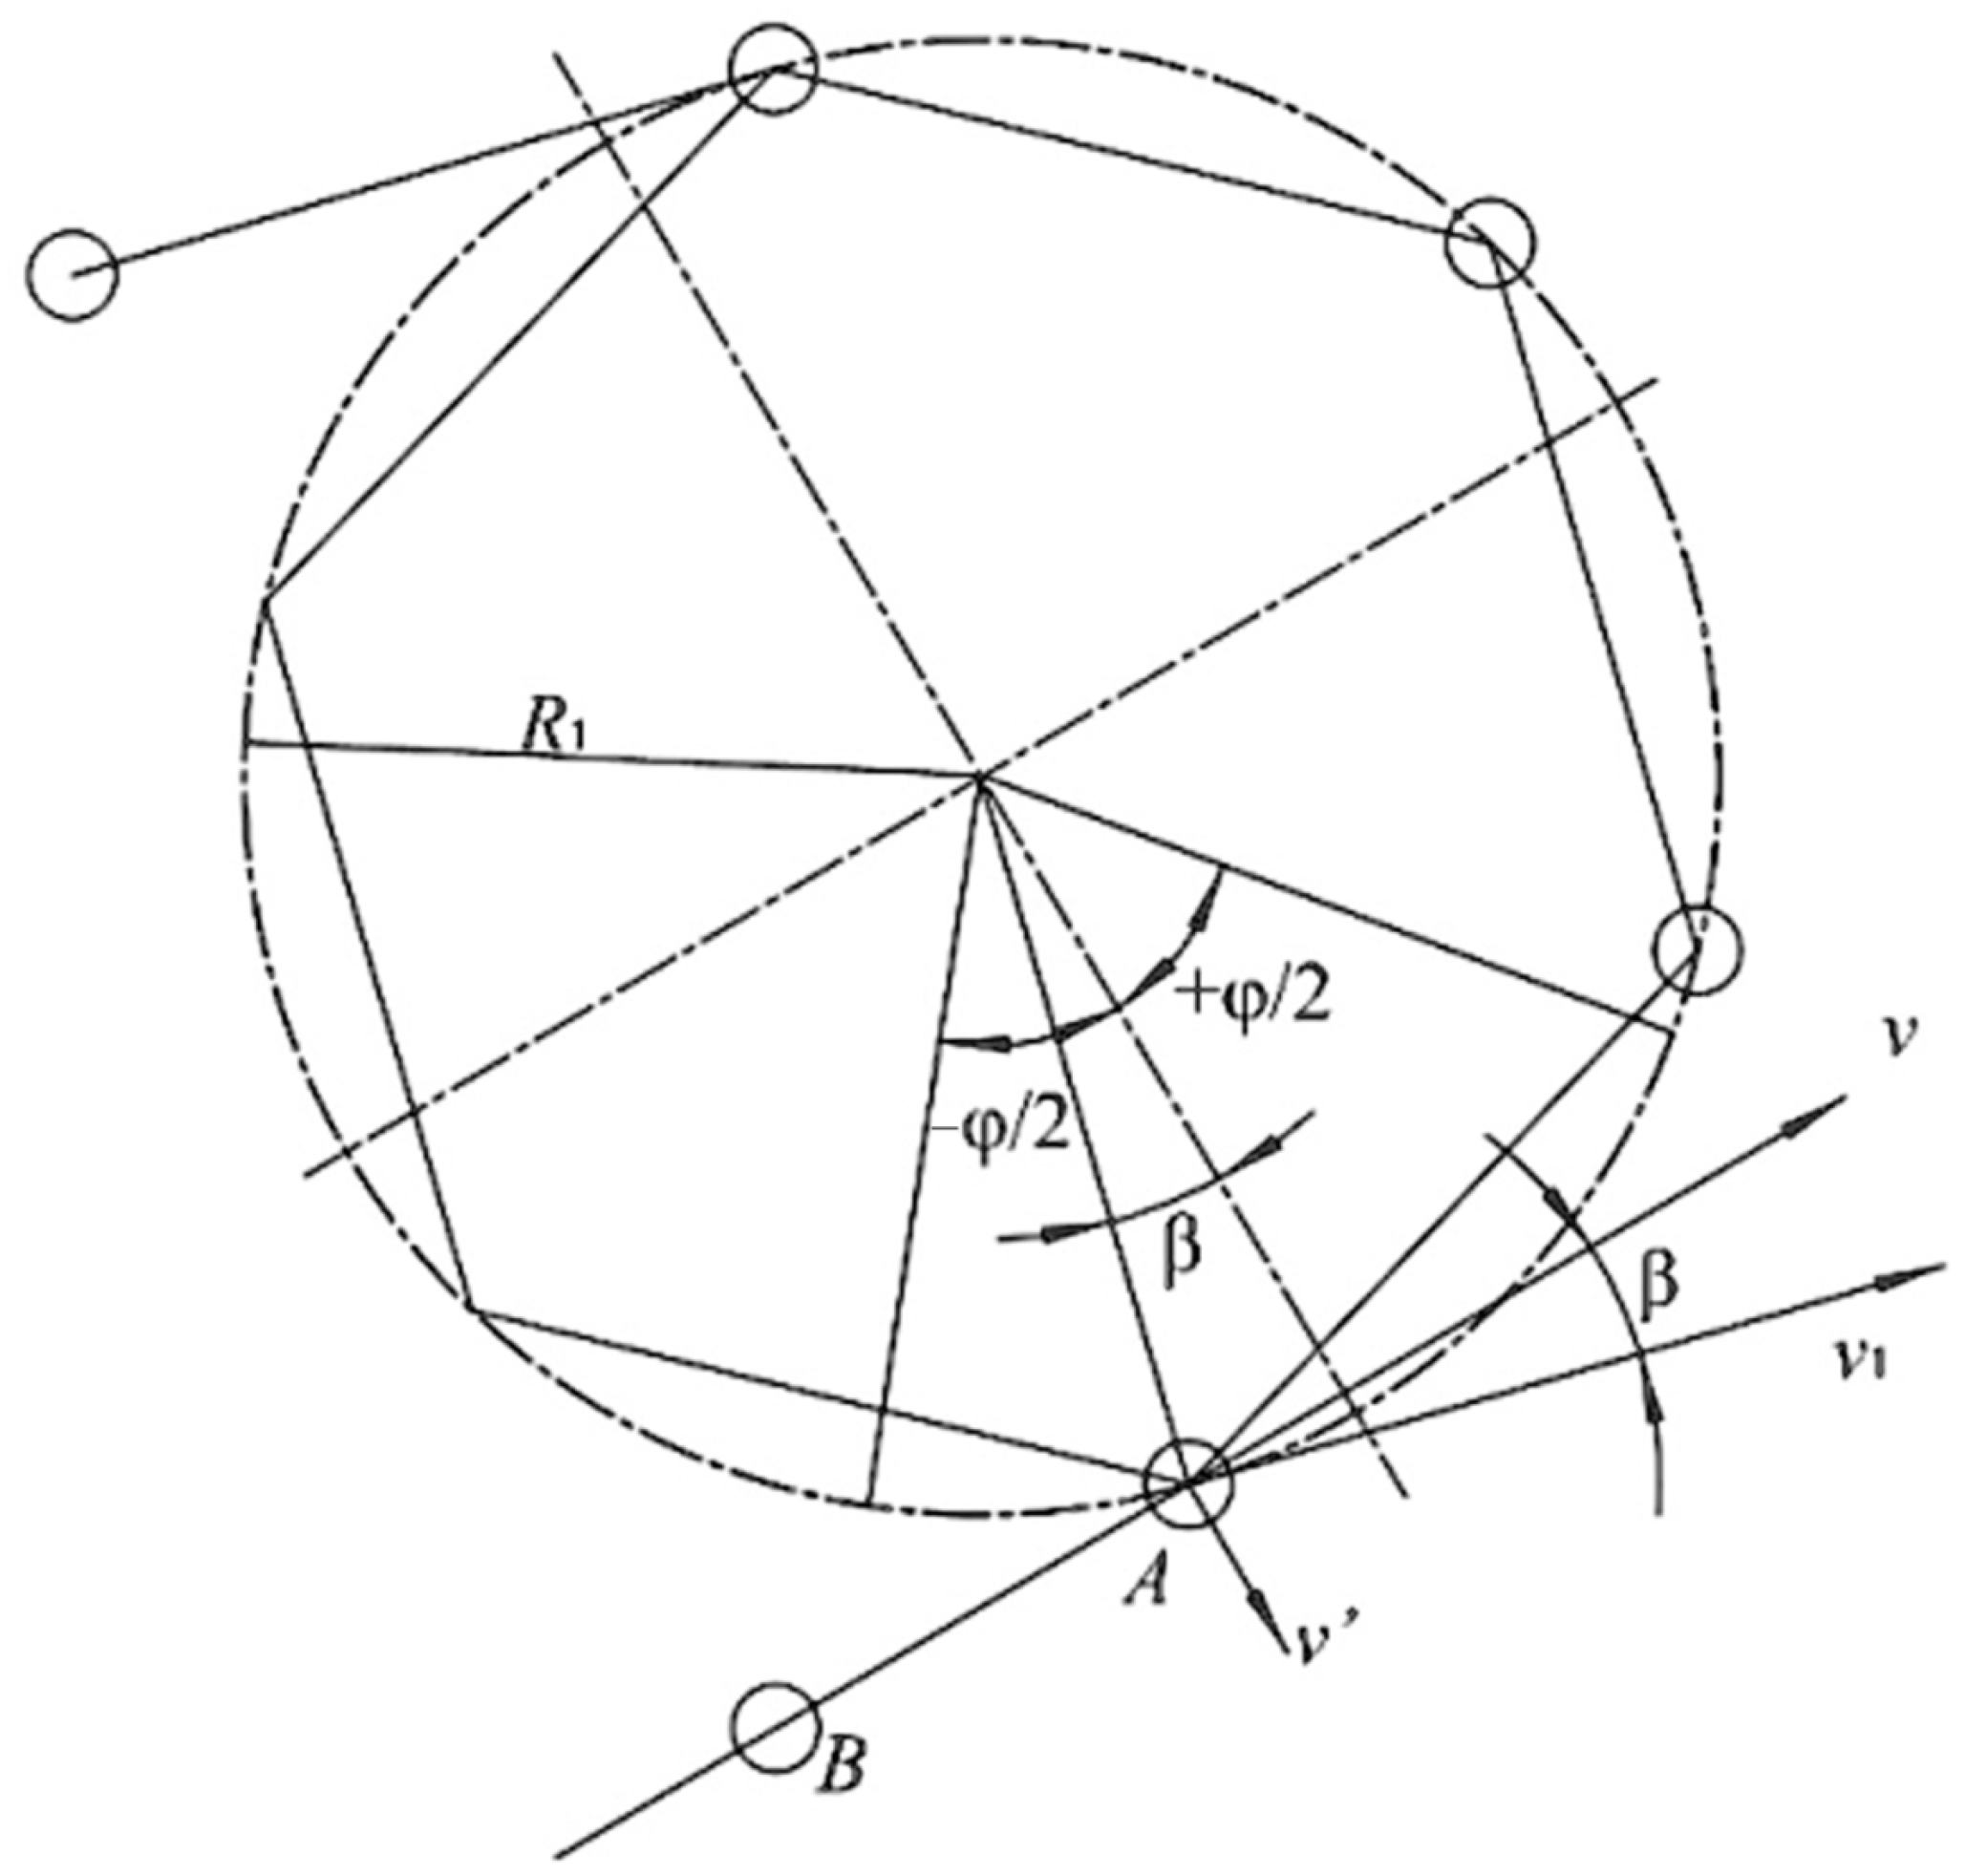
represents the average chain velocity. Furthermore, as illustrated in the conveyor chain motion diagram (
Figure 2), the velocity component perpendicular to the line connecting the centers of the passive roller and the driving sprocket can be expressed by Equation (3):
When
, the velocity in this direction reaches its minimum. When
, the velocity in this direction reaches its maximum. As illustrated in the conveyor chain motion diagram, the velocity in this direction decreases during
, and then increases during
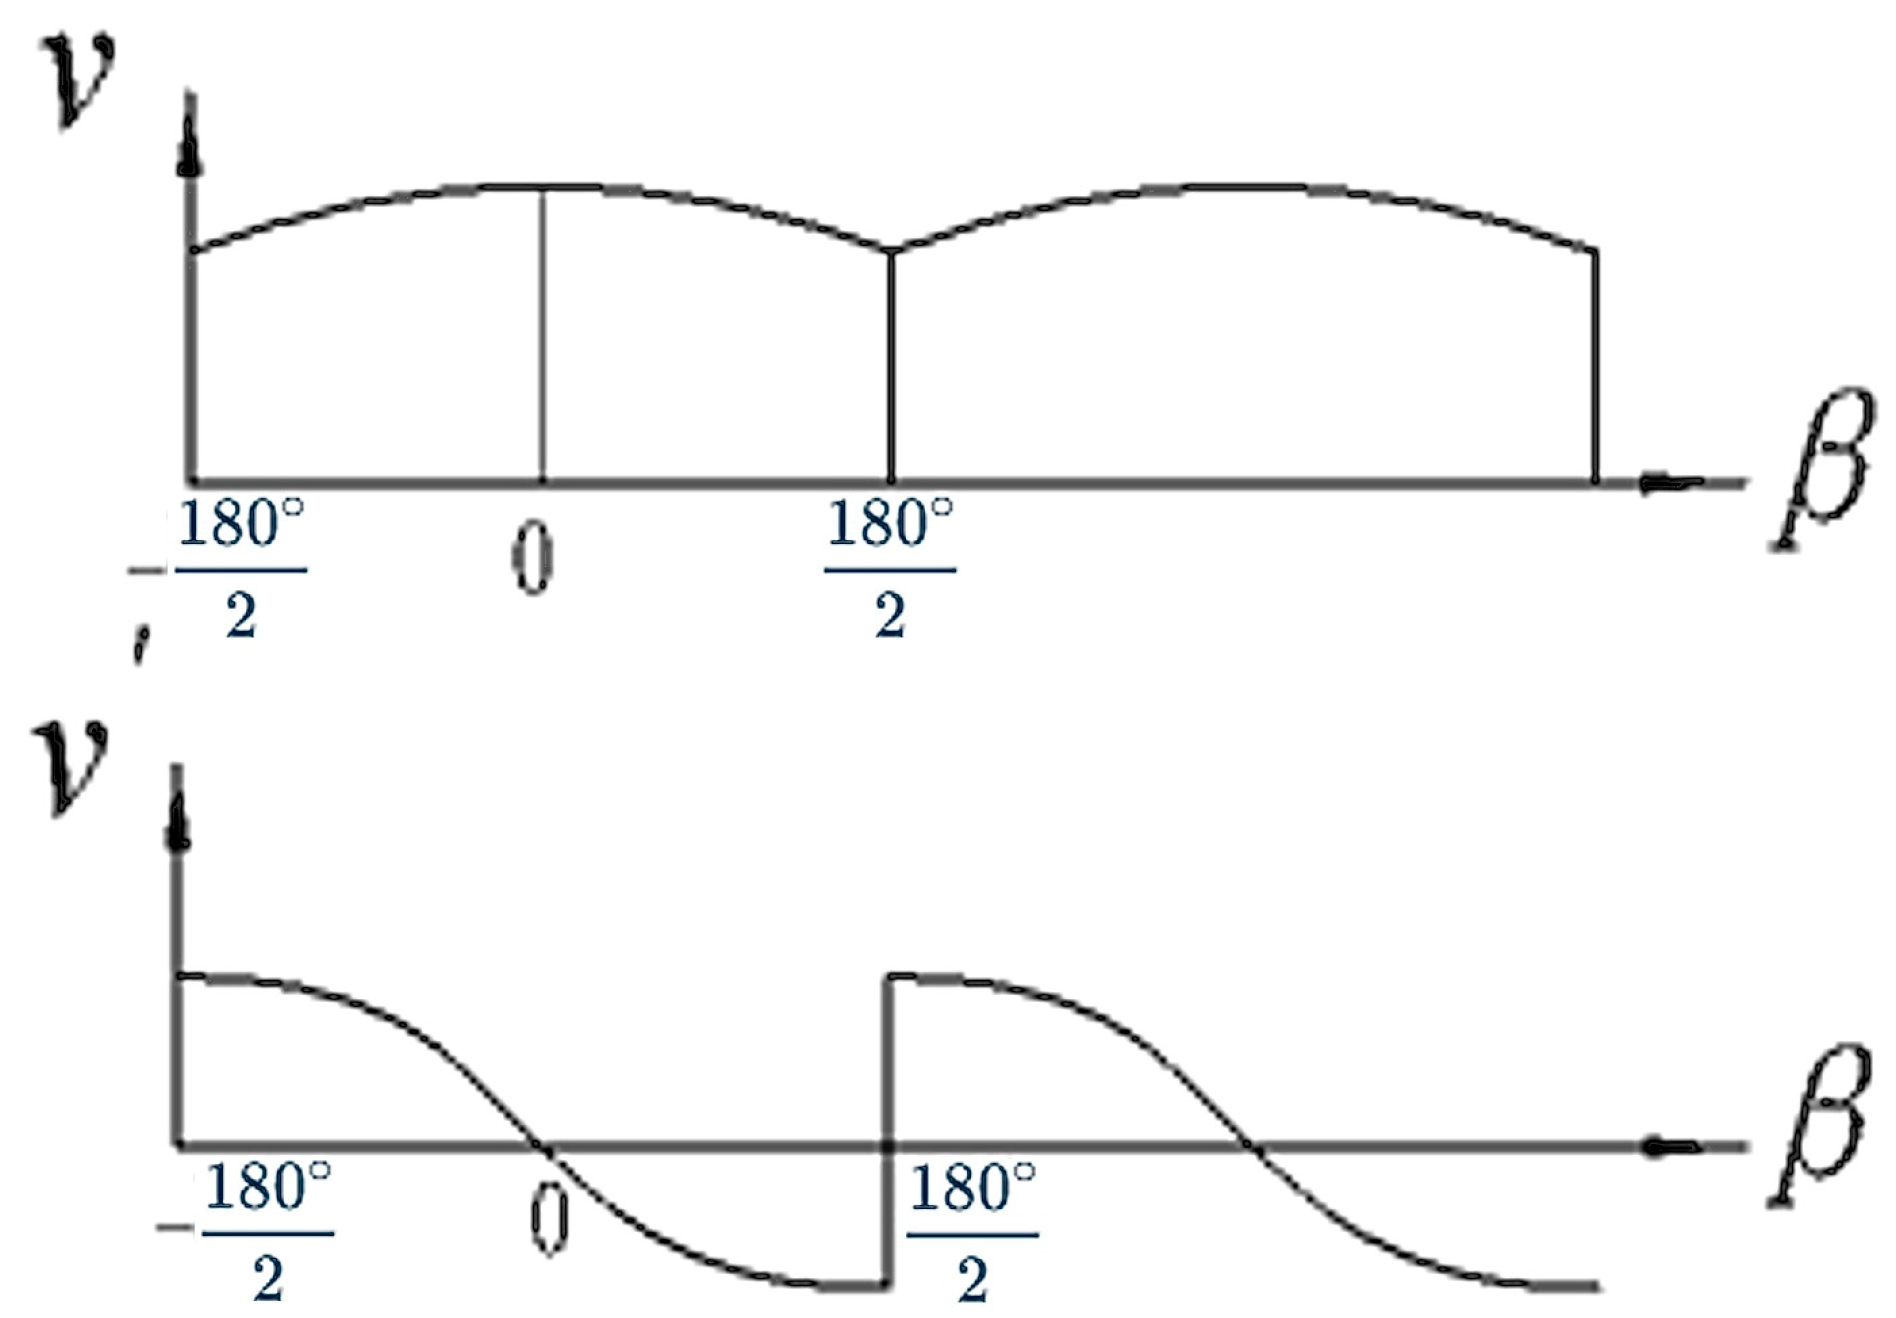
. As shown in
Figure 3, this velocity cyclically varies from high to zero and back to high, changing once with each chain link rotation. Such variation in chain speed causes vertical oscillations of the chain, leading to increased vibrations and accelerated wear. To ensure the normal operation of the conveyor trough, the conveyor chain is typically maintained in a slack state. Under this slack condition, the lower portion of the chain remains loose during motion, which further amplifies vibrations caused by velocity variations perpendicular to the centerline.
When the driving sprocket rotates at a constant angular velocity, the linear velocity of the chain exhibits a periodic variation with the sprocket’s rotational angle, as shown in
Figure 2, fluctuating from low to high and back to low. This variation causes collisions between the inner and outer chain links, alters the meshing positions between the chain links and the sprocket, and generates additional dynamic loads on the chain. Simultaneously, as the passive roller’s speed changes, so does its chain link engagement count.
2.2.2. Influence of Chain Sliding on Roller Noise
For the conveyor chain, excessive chain tension can cause damage to the bridge bearings due to excessive pressure, while overfeeding can lead to conveyor blockage. Therefore, it is necessary to reasonably adjust the tension of the conveyor chain system. When the chain tension is relatively low, axial sliding of the chain along the passive roller may occur. The offset phenomenon of the conveyor chain system caused by the use of passive rollers as the feeding end of the conveyor can be attributed to unbalanced excitations generated by other working components and the ground during operation of the tracked combine harvester, leading to axial sliding of the conveyor chain. Additionally, during startup, the chain experiences significant impact loads. Due to the inherent clearance between chain links characteristic of chain drives, the conveyor chain system may deviate slightly from its normal trajectory; however, this deviation is limited and has minimal impact on the overall noise level of the conveyor trough.
2.2.3. Analysis of Vibration Noise Sources in the Conveyor Trough
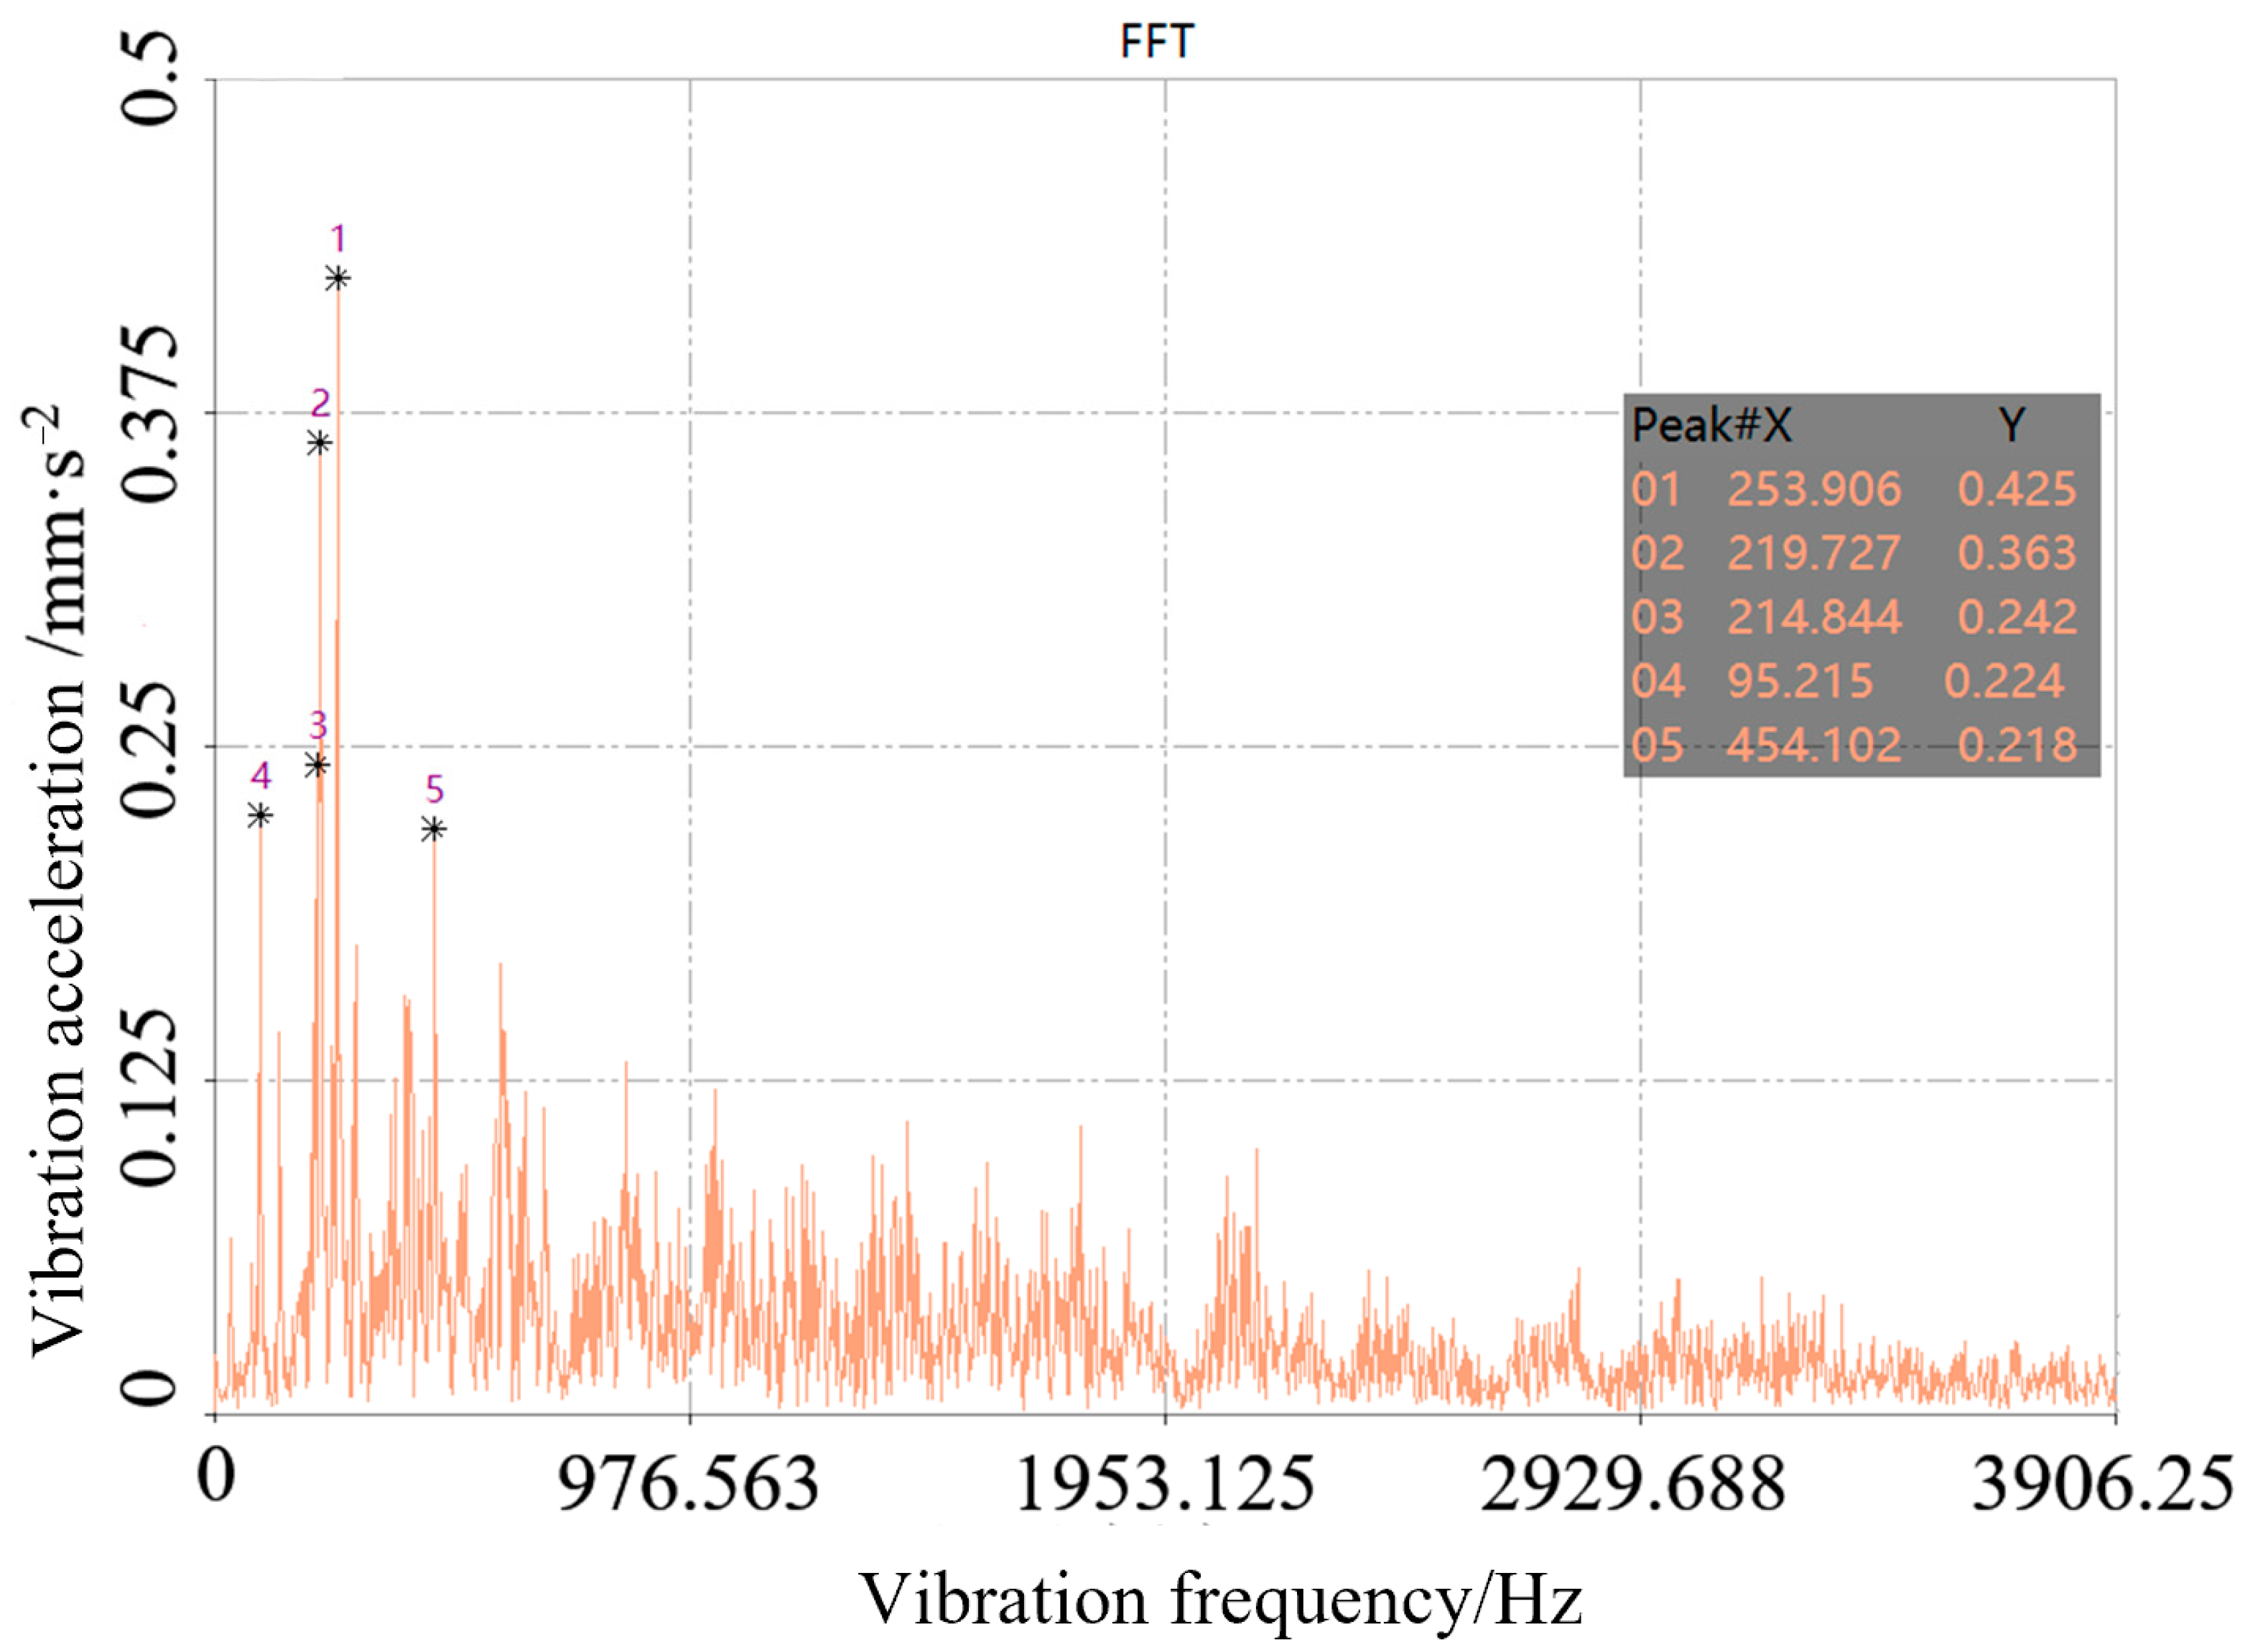
During the actual operation of a combine harvester, the vibration noise originating from the conveyor trough is influenced by several sources. In no-load conditions, it primarily consists of noise caused by the vibration of the conveyor chain, bearings, and the trough casing itself. Previous studies [
49,
50] analyzing the frequency spectrum of chain scraper conveyor trough noise have shown that although various factors contribute to the noise, the dominant frequencies typically align with the meshing frequency of the conveyor chain mechanism. Therefore, the meshing impacts within the chain drive are recognized as the primary source of vibration noise in the conveyor trough.
The conveyor system transmits motion via interaction between the drive sprocket and the chain. Throughout this transmission, both internal and external excitations generate vibrations and acoustic emissions. Internal excitation is primarily due to speed fluctuations of the chain links during engagement. External sources include input torque and rotational speed variations, ground-induced vibrations, and dynamic forces transmitted from other operational components of the harvester. When material is fed into the conveyor, additional external excitations arise from grain contact with the trough casing and structural modal variations triggered by the load.
2.3. Noise Identification Method
Sound intensity is a key vector parameter in acoustic measurements. It not only precisely characterizes the sound energy flow density (in units of W/m2) at any point within the sound field but also intuitively reflects the propagation direction of acoustic energy due to its vector nature. This physical quantity is defined as the product of sound pressure and particle vibration velocity (I = p·v), where sound pressure p is a scalar and particle velocity v is a vector. The vector composition of these two quantities enables sound intensity to simultaneously convey both magnitude and directional information. In engineering practice, this vector characteristic makes sound intensity an important tool for noise source identification. By measuring the magnitude of sound intensity, the radiation strength of noise sources can be quantified, and by analyzing the direction of sound intensity, the propagation path of acoustic energy can be accurately tracked. This allows for precise localization of noise sources and detailed analysis of propagation mechanisms even in complex acoustic environments. For example, in noise testing of combine harvesters, sound intensity measurements can reveal sound intensity levels of up to 105 dB near the engine compartment and indicate that the energy primarily radiates downward and backward at an angle of π/4 radians, providing critical information for targeted noise reduction strategies.
Sound intensity-based noise identification analyzes the acoustic energy flow during wave propagation to locate and quantify noise sources. It is widely used in industrial noise monitoring, source localization, and noise control optimization. Sound intensity, measured in watts per square meter (W/m2), reflects the directional energy transfer of sound waves and is closely related to sound pressure, frequency, and propagation medium characteristics.
Unlike traditional sound pressure level measurements, which provide noise magnitude at specific points without directional information, the sound intensity method can precisely determine the spatial location of noise sources by measuring both sound pressure and particle velocity simultaneously using paired miniature microphones. This directional sensitivity enables detailed mapping of noise intensity distribution, making it highly effective for identifying dominant noise radiation areas.
2.4. Noise Detection of the Conveyor Trough
For machinery dominated by structural noise, the surface sound pressure is proportional to the vibration velocity of the structural surface. Utilizing this proportional relationship, the connection between structural vibration and surface sound pressure can be expressed mathematically. Based on the vibration measured on the outer surface of the conveyor trough shell, the surface sound power can be estimated. The relationship between the radiated noise and the surface vibration is expressed as Equation (4):
In the formula,
represents the sound power (in watts);
denotes the characteristic acoustic impedance of air (
);
is the noise radiation surface area (
);
is the time-averaged normal vibration velocity of the noise-radiating surface over the structural vibration area (
); and
is the radiation efficiency coefficient. Among these parameters, the calculation of the radiation efficiency coefficient plays a critical role in determining the sound power. It represents the effectiveness of the vibrating surface in radiating acoustic energy outward and is a function related to the vibration frequency, the shape and size of the surface, and the vibration frequency. It is defined by the sound power level
and vibration velocity level
as follows:
,
. Further, transforming Equation (4) leads to Equation (5):
In the formula,
is the reference sound power,
;
is the reference area,
;
is the reference radiation efficiency,
is the reference acoustic impedance of air,
; and
represents the A-weighting network attenuation. From the above equation, it is clear that, given the structural radiation area and vibration velocity, the sound power radiated by the structural vibration can be calculated using this formula. Correspondingly, the A-weighted sound power level is expressed as Equation (6):
In the formula, represents the number of frequency bands, is the sound power level of the i-th frequency band, and represents the A-weighting correction value applied to the i-th frequency band to match human hearing sensitivity.
2.5. Sensor Arrangement and Determination of Radiation Coefficient
The surface vibration test was conducted at the rated engine speed, with the combine harvester running unloaded and stationary. The tested model is an imported tracked grain combine harvester.
- (1)
Sensor Arrangement
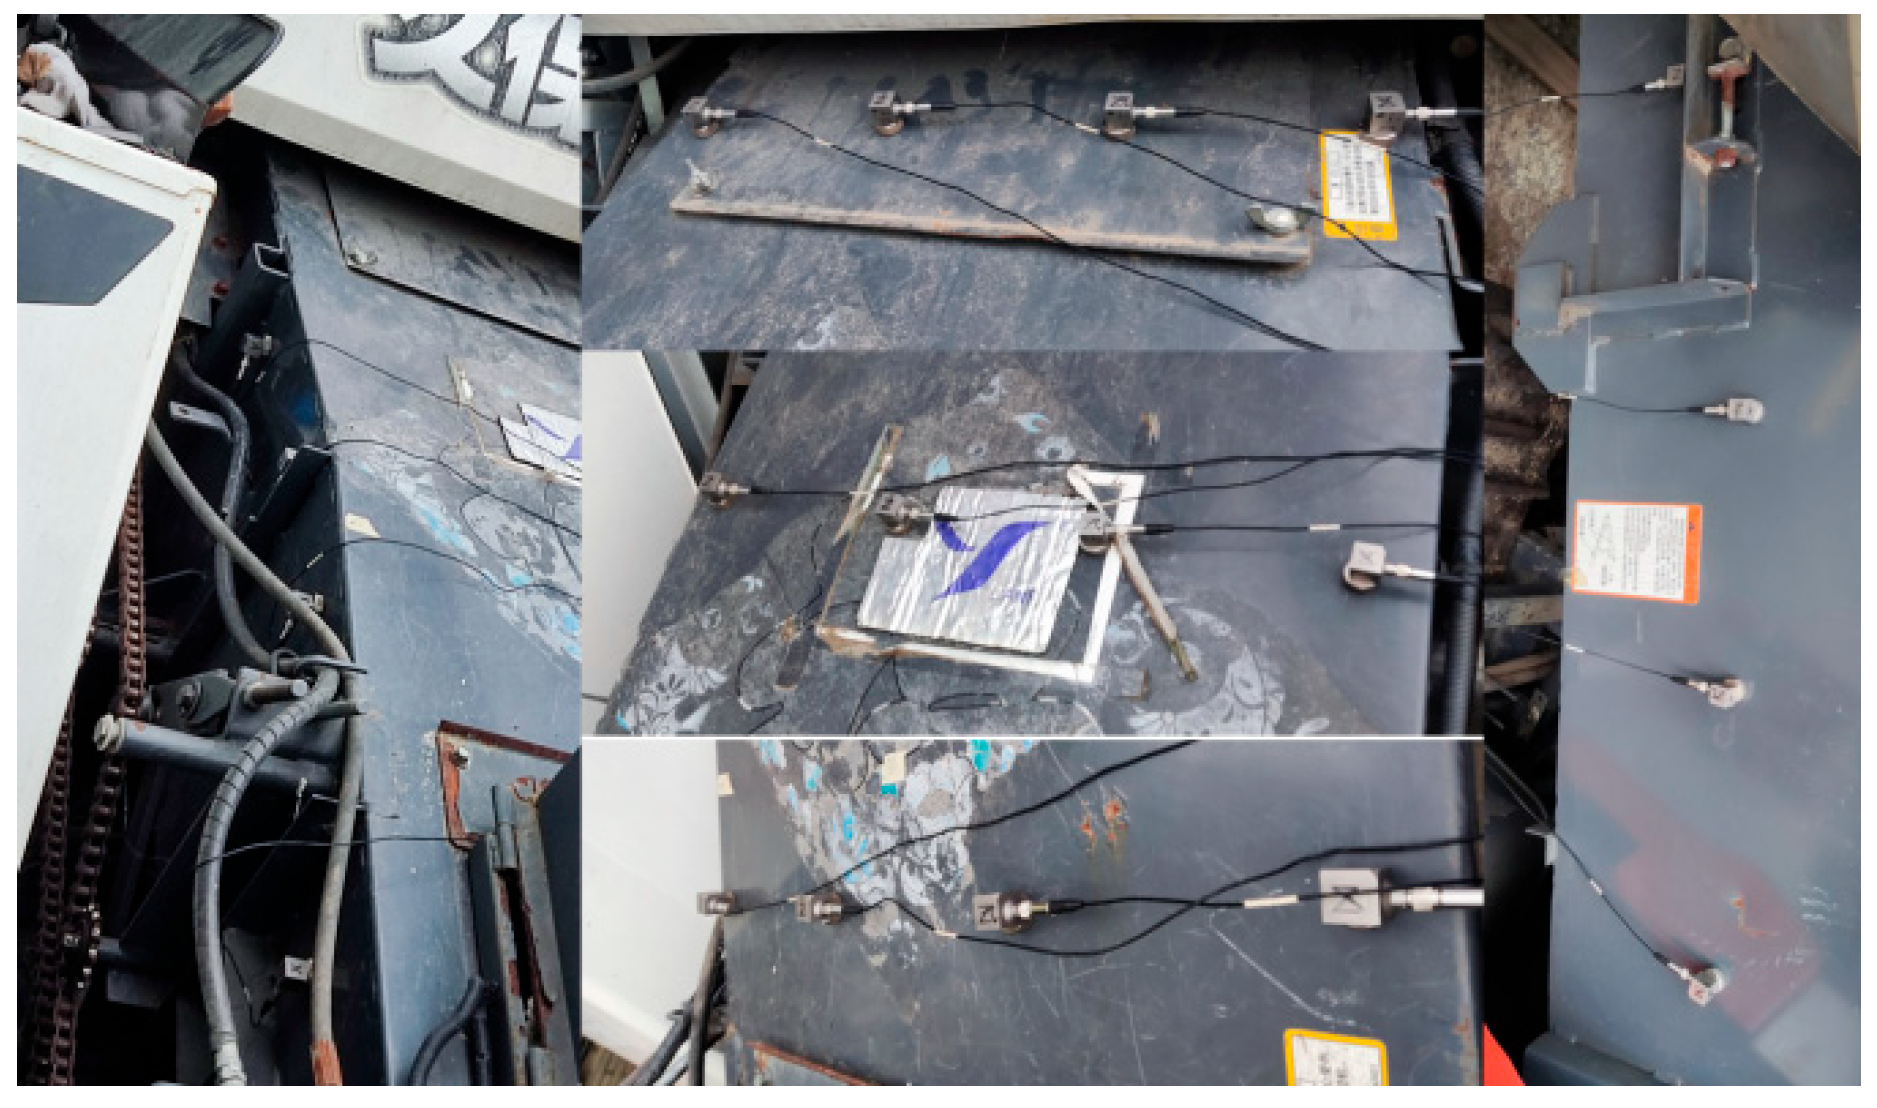
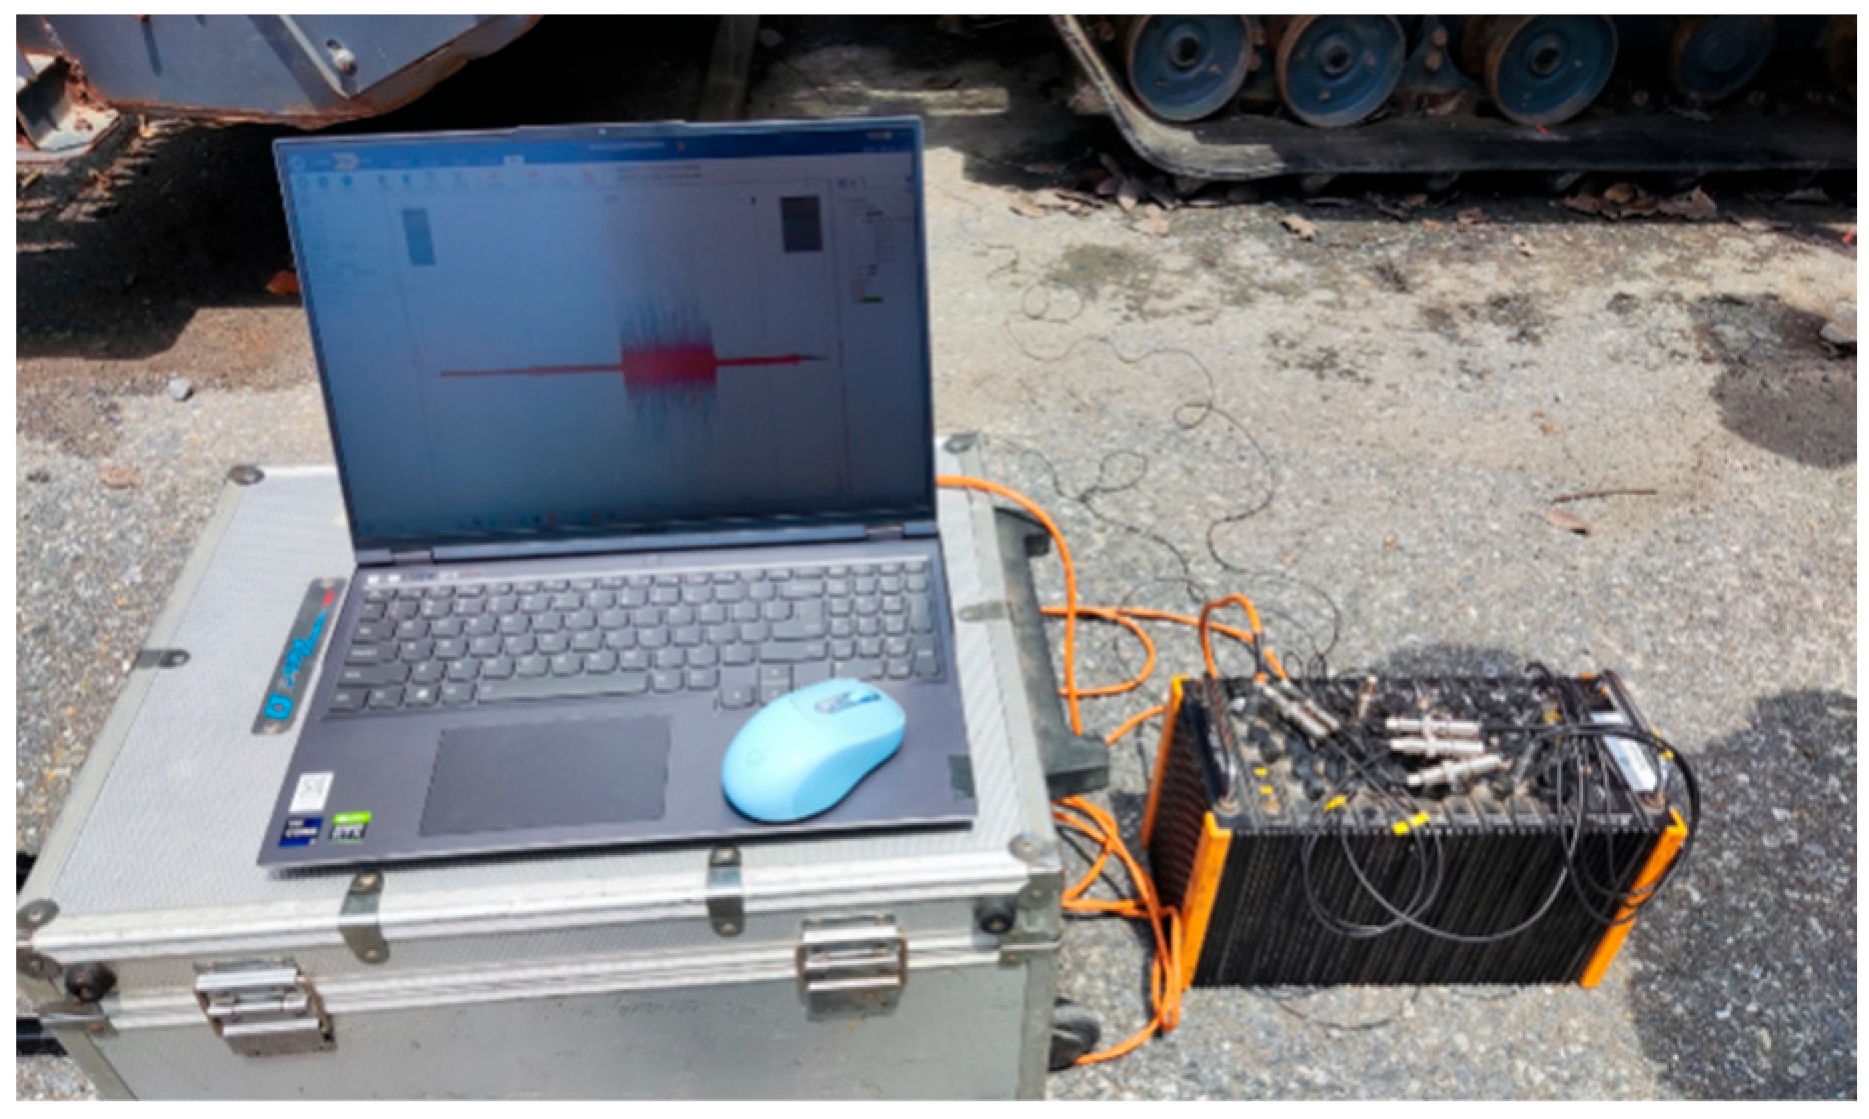
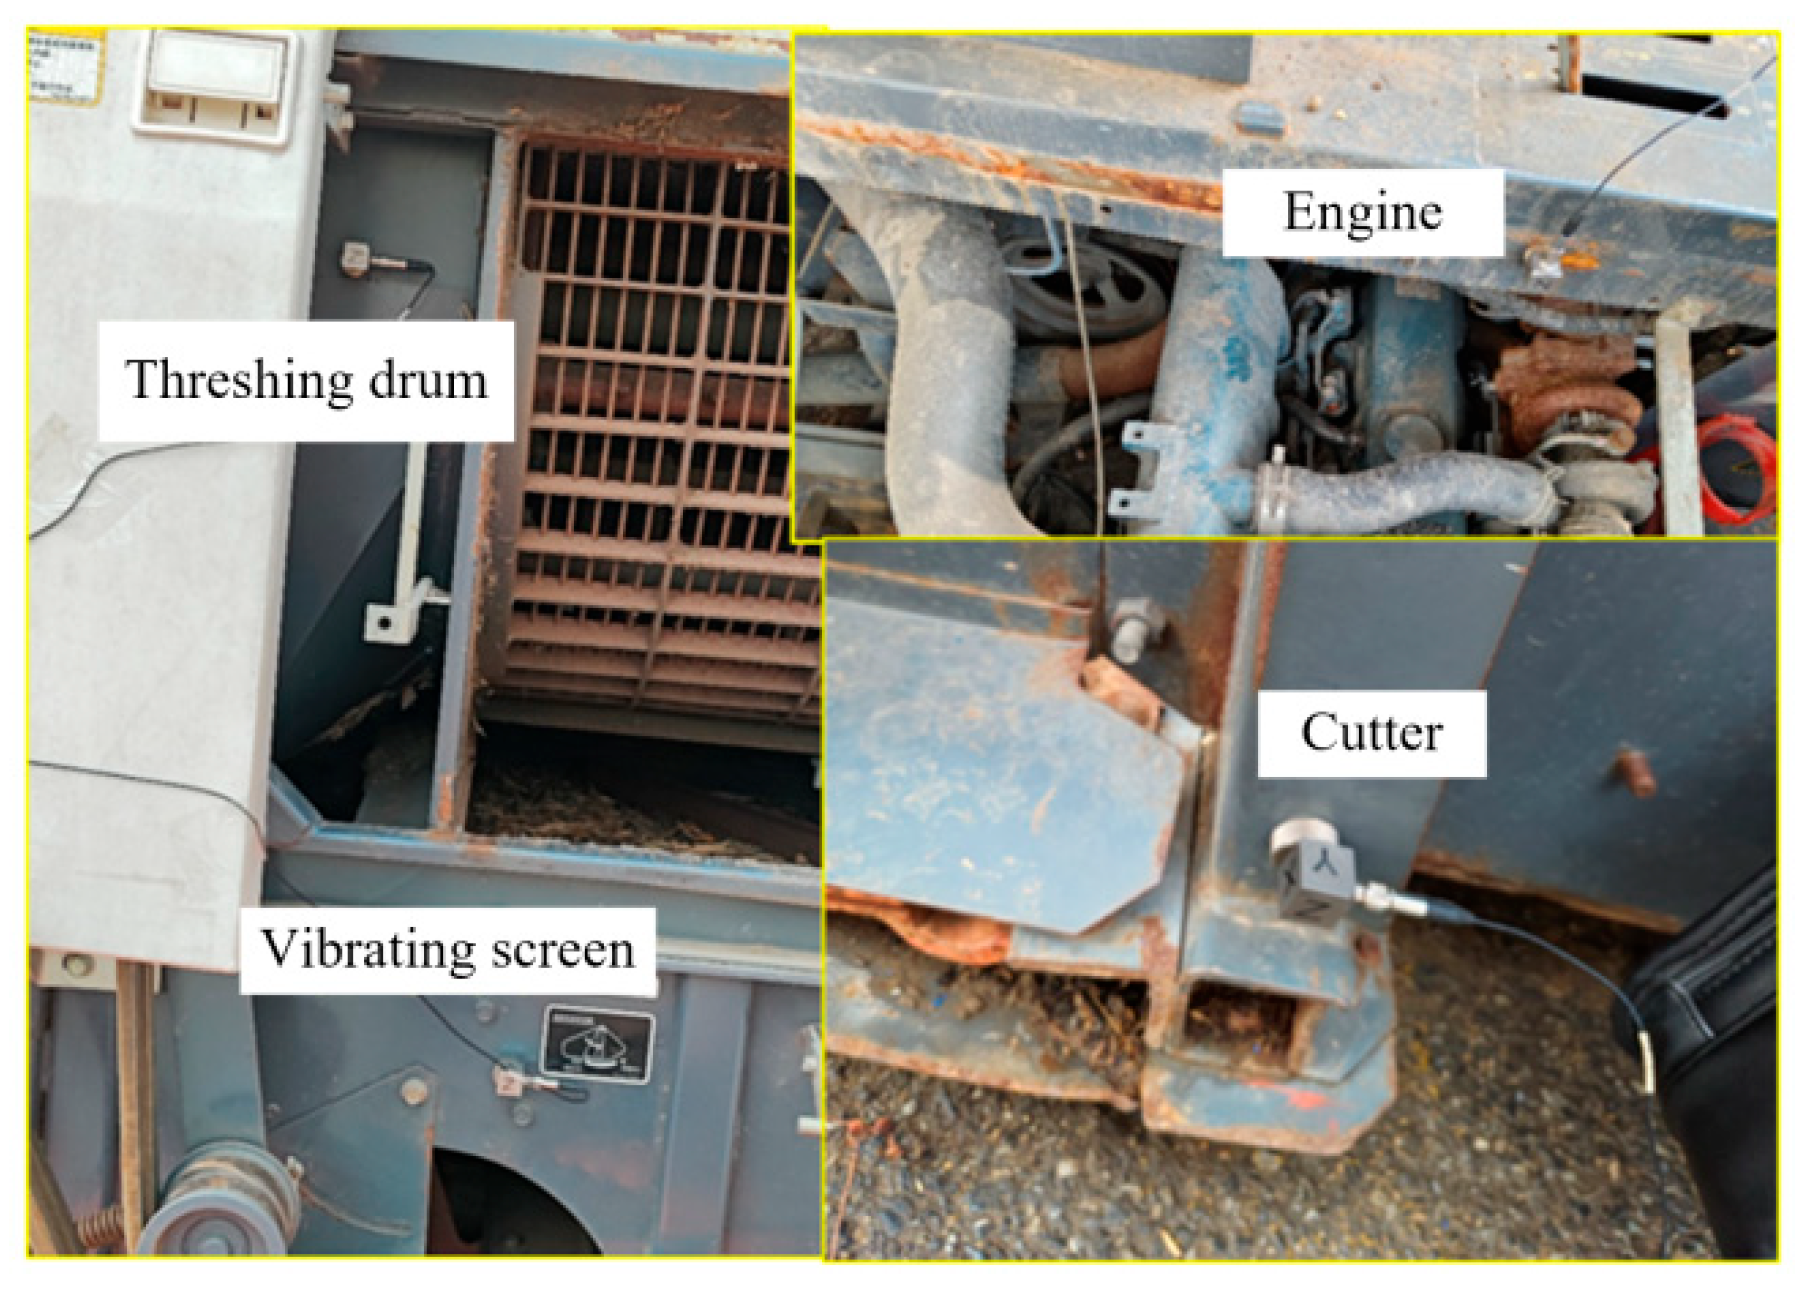
Acceleration signals were acquired using a Donghua DH5902 data acquisition system. The test equipment used is the DH5902 signal acquisition system of Donghua Test, which is produced by Jiangsu Donghua Test Technology Co., Ltd of China. Sensors were arranged on the surface of the conveyor trough shell, with measurement points and instruments shown in
Figure 4 and
Figure 5. Each sensor measured acceleration along the X, Y, and Z axes, where the Z-direction corresponds to the shell surface normal direction. The sensors were attached to the corresponding measurement points using magnetic bases. The acquired acceleration signals were processed by the DH5902 dynamic signal test and analysis system and then transmitted to a connected computer. After the sensors were arranged, the engine was started first. Once stable, the threshing drum and shaker were started, followed by the cutter head and conveyor trough, maintaining the engine speed at 2400 rpm (determined through frequency-domain analysis of the vibration data). The system operated with a 10 kHz sampling frequency, and the conveyor trough was kept running for more than 15 s during the startup phase.
- (2)
Determination of the Radiation Coefficient
The radiation coefficient represents the efficiency of noise radiation from the vibration of a component. Generally, above the critical frequency, the radiation coefficient σ ≈ 1; below the critical frequency σ ranges between 0 and 1. In calculations, the radiation coefficient is usually determined by experimental methods or empirical formulas.
The empirical formula for the noise radiation coefficient of a pulsating spherical sound source is given by Equation (7):
The empirical formula for the noise radiation coefficient of a flat plate sound source is shown in Equation (8):
The critical frequency is given by Equation (9), where is the speed of sound in air, typically taken as 340 m/s; is the equivalent radius (m), ; is the central frequency of the sound source (Hz); is the critical frequency of the plate (Hz); is the perimeter of the plate (m); is the area of the plate (m2); is the thickness of the plate (m); is the elastic modulus of the material (Pa); and is the density of the material (kg/m3).
The outer casing of the combine harvester’s conveying trough is mainly composed of plates. These plate-like structures are unconstrained in the normal (out-of-plane) direction, resulting in larger vibrations in this direction compared to the other two axes. During vibration, the sound radiation caused by flexural vibration in the plates is more significant than that caused by other types of vibration. Flexural vibrations can excite bending waves, leading to direct coupling between structural vibration and the acoustic field, converting vibrational energy into sound energy and radiating it outward as noise.
Under excitation forces, the sound waves generated by the flexural waves in plate structures are plane waves [
51]. Since the outer casing of the conveying trough is primarily composed of finite flat plates, for the sake of simplification and analysis, it is treated as a flat plate sound source when calculating the sound radiation coefficient.
2.6. Selection of Noise-Insulating Damping Material Application Locations
The interaction between the internal chain drive and the external housing is the main contributor to noise in the conveyor trough of the combine harvester. The conveyor trough adopts a slat chain structure, with the primary noise sources concentrated in the drive sprocket meshing area, the drive shaft rotation area, and the scraper operating area. Although the conveyor trough uses an open-box structure, allowing part of the chain system noise to radiate directly outward through the opening, a considerable portion of the noise is still transmitted outward via casing vibrations.
Due to the relatively fixed structure of the slat chain conveyor trough and its tendency to wear during operation as a non-precision mechanical component, structural modification of the chain system or the use of rubber chain links is difficult to implement in practice. Therefore, noise reduction measures targeting the conveyor trough casing become the most feasible solution.
Currently, two main noise reduction methods are used in engineering practice: active noise control, which cancels noise by generating counteracting sound waves through noise signal acquisition and analysis, and passive noise control, which blocks noise transmission through sound insulation or absorption treatment. Compared with the former, the passive noise reduction scheme based on damping technology offers advantages in cost and technical maturity, making it especially suitable for agricultural machinery.
For structural components like the conveyor trough casing, the most effective noise reduction approach is to reduce its surface acoustic radiation efficiency. This can be achieved in two ways: optimizing the geometric shape of the casing structure or adding damping materials with high loss factors. Among these, directly adhering damping structures is the most commonly used engineering measure, including free damping structures and constrained damping structures. By applying composite damping materials to the surface of structural parts, the damping characteristics of the structure can be significantly improved, effectively suppressing the transmission of vibration noise.
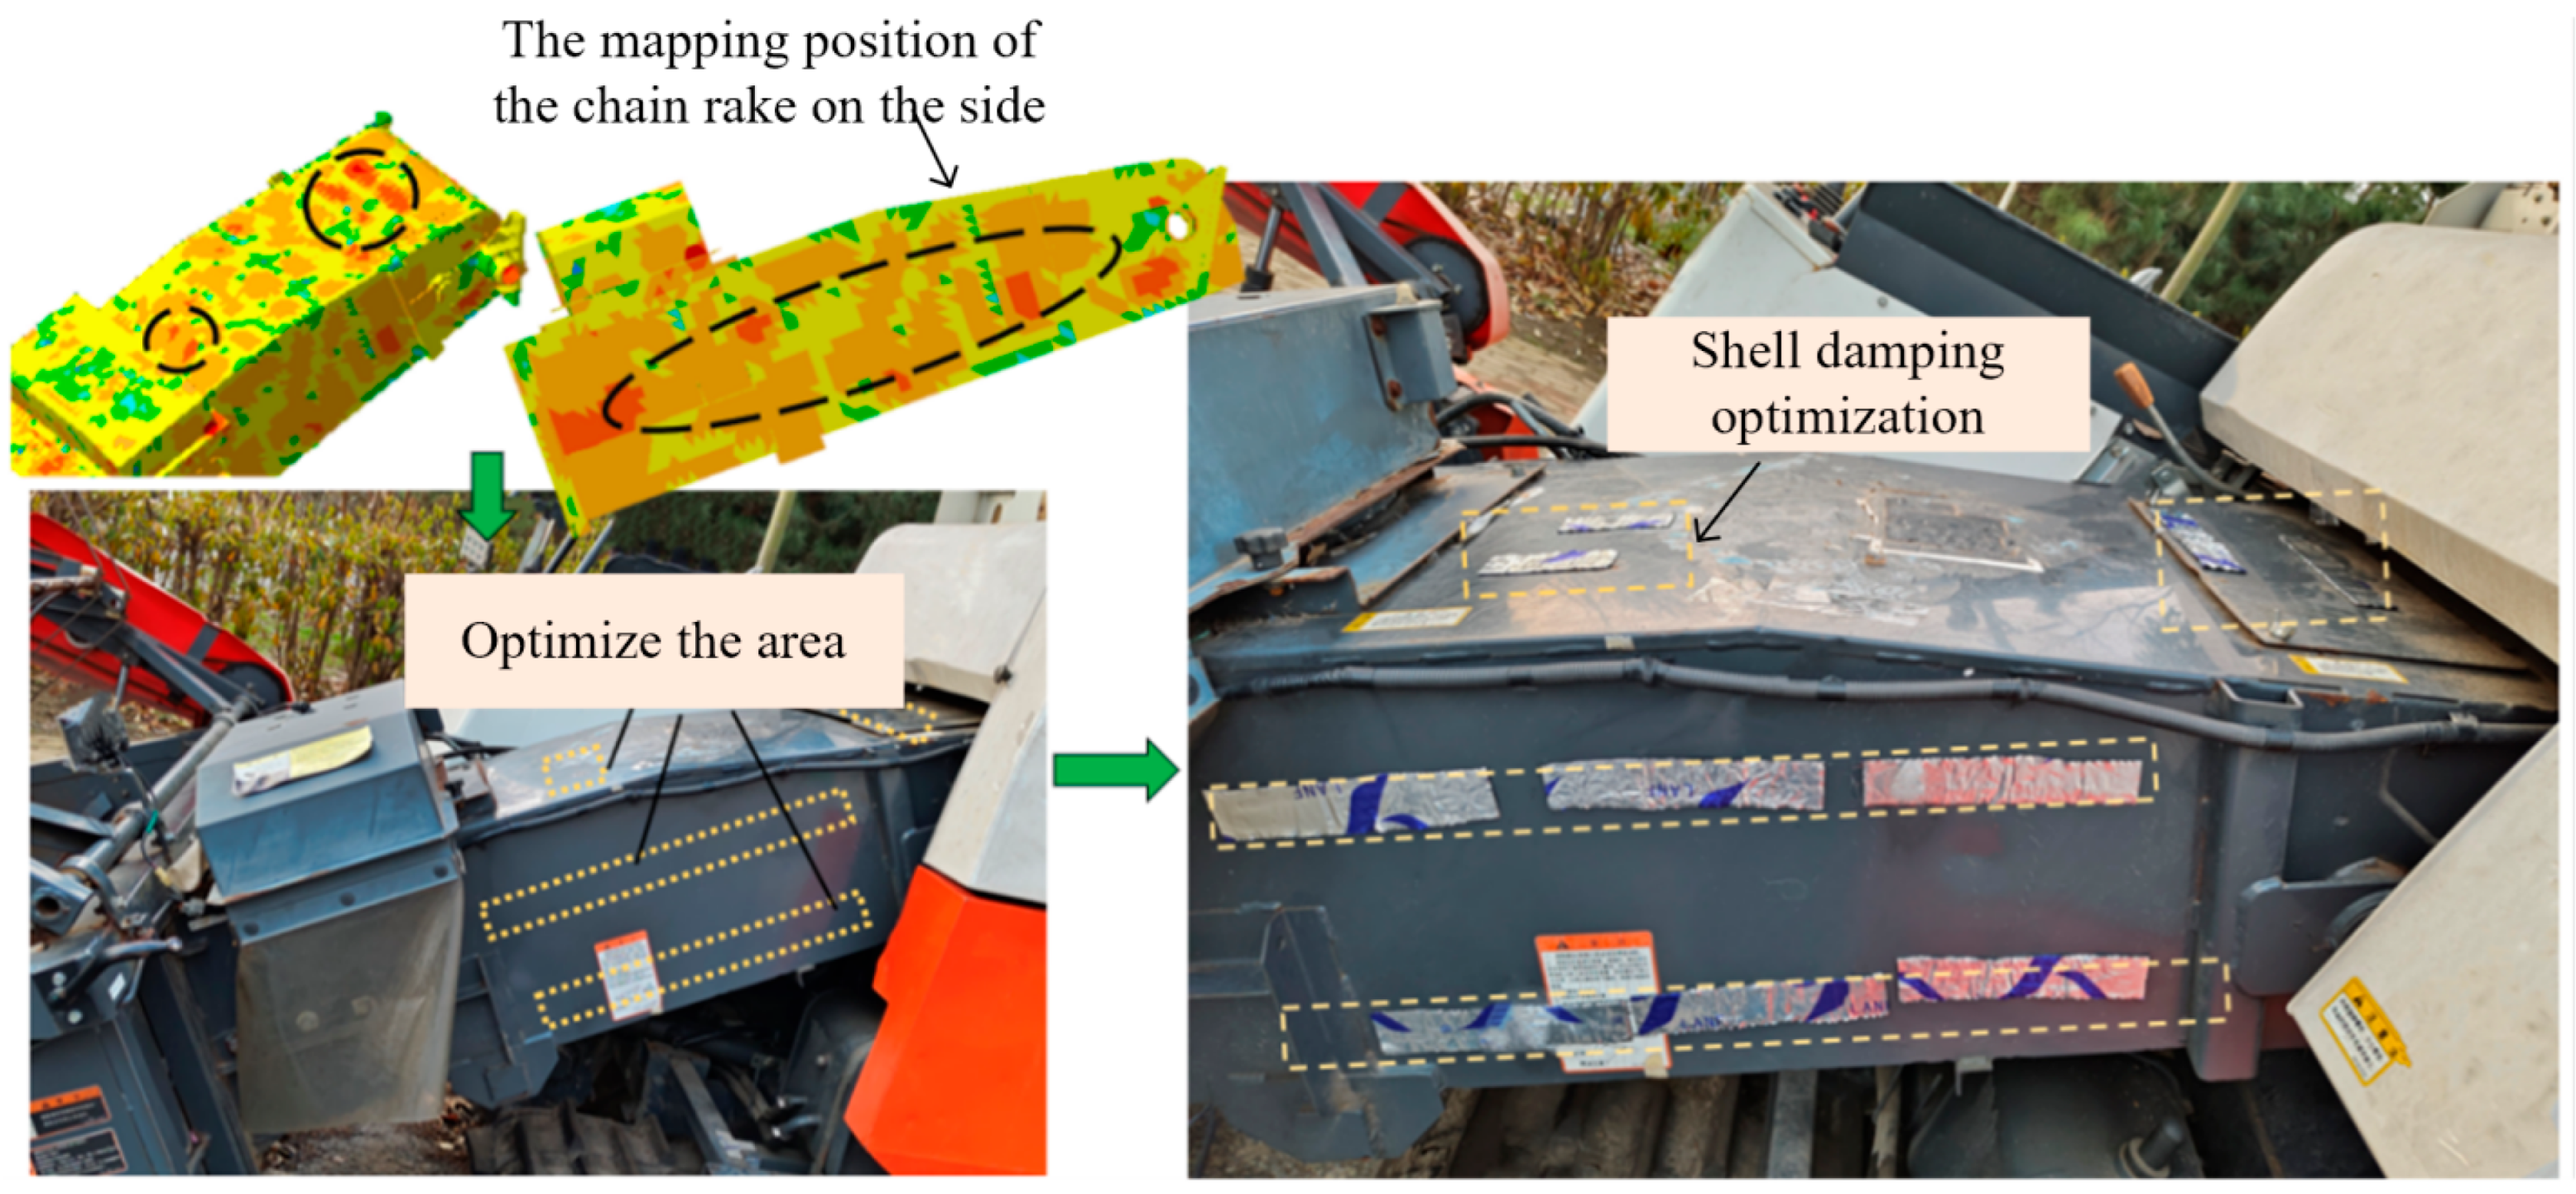
Through computer simulation analysis, we conducted an in-depth study on the impact of vibration noise generated by the internal conveyor chain system on the metal casing of the combine harvester conveyor trough. The simulation results revealed that certain specific areas of the conveyor trough casing exhibited significantly stronger vibration responses than others, radiating strong noise during chain operation. Based on these findings, we adopted a constrained damping structure approach, precisely attaching specially designed damping patches to the high-noise radiation areas identified by the simulation. This targeted noise reduction strategy offers clear advantages: it avoids the need for large-area damping material coverage over the entire casing, greatly reducing retrofit costs, while effectively suppressing the transmission of vibration energy from primary noise sources to achieve the desired noise reduction.
Further analysis of the simulation data showed that vibration energy from the conveyor chain system is primarily transmitted to the casing through two key paths: first, the contact points where the slat chain engages the left and right side plates of the casing, which experience the most intense metal plate vibrations and are the main noise transmission areas; second, the top plate area directly above the conveyor chain drive shaft, which also generates strong noise radiation due to bearing the shaft’s rotational vibration. The vibration responses in these two critical areas are significantly stronger than elsewhere, making them the focal points for damping material placement. By precisely applying damping patches in these key regions, optimal noise reduction is achieved with minimal material use.
Moreover, the shape and size of the damping patches were designed by comprehensively considering the spatial distribution of vibration energy and material properties to maximize energy dissipation while ensuring ease of installation. This design was guided by detailed modal shapes and vibration contour maps from the simulation, ensuring a close match between the damping patches’ placement and the vibration hotspots, thereby enhancing noise suppression effectiveness.
After determining the noise reduction locations on the conveyor trough casing, appropriate damping materials should be selected for noise mitigation. Rubber damping sheets, with their excellent elasticity and flexibility, can effectively absorb external vibrations and impact energy, converting vibration energy into heat rather than sound energy, thereby reducing noise levels. Compared with other types of damping sheets, rubber damping sheets are more cost-effective. Therefore, rubber-based damping sheets are chosen for noise reduction treatment of the conveyor trough casing. The results of damping noise reduction are shown in
Figure 6.
3. Results
3.1. Modal Analysis of the Conveyor Trough
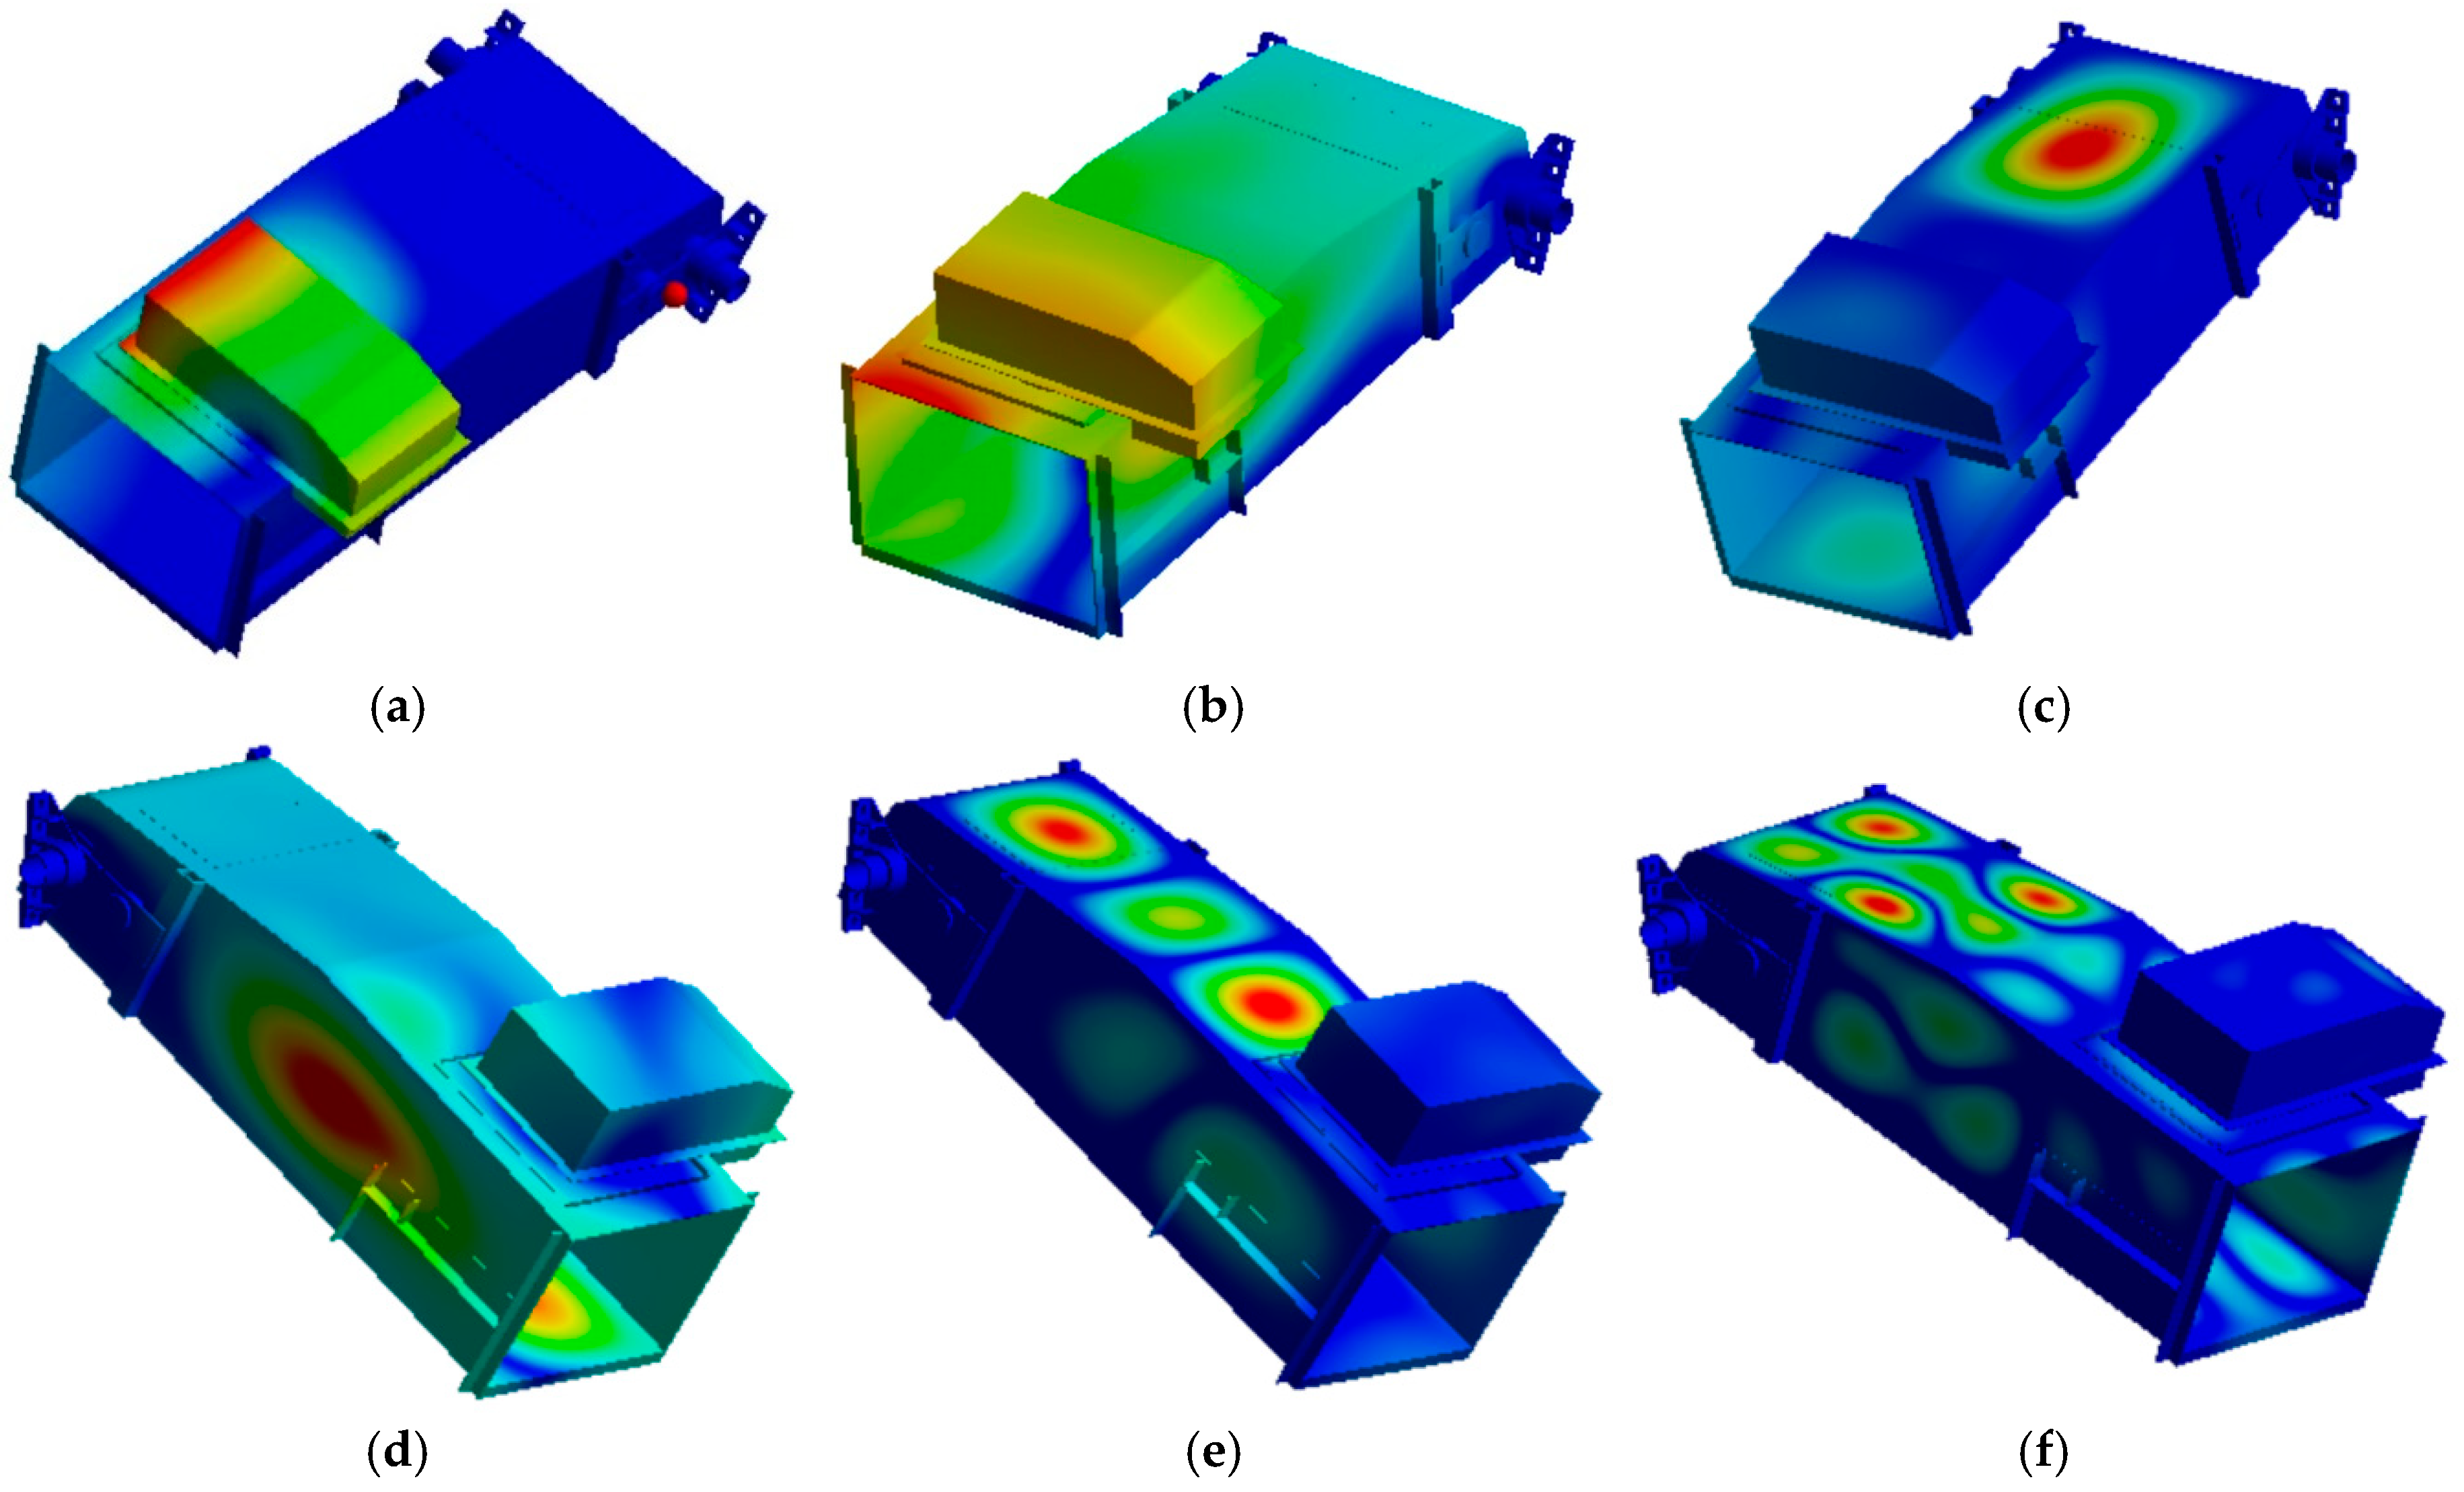
Through the analysis of the modal vibration patterns of the conveyor trough casing, as shown in
Figure 7, it is observed that the vibration displacement at the constrained fixed connection points is significantly suppressed, exhibiting near-zero vibration response characteristics. This validates the rationality of the applied boundary conditions. In contrast, in the unconstrained free regions of the casing, the vibration displacement shows a complex spatial distribution. Multiple casing surfaces display varying degrees of vibration response, reflecting the overall vibration behavior of the casing structure under dynamic loading.
These modal characteristics clearly illustrate the vibration behavior patterns of the conveyor trough casing, providing critical insight into its noise radiation mechanisms. Accurately identifying these modal properties under actual operating conditions holds significant engineering value. By strategically optimizing the structure based on modal analysis, resonance phenomena can be effectively suppressed, significantly reducing vibration noise during operation. This design approach not only enhances the structural reliability of the conveyor trough but also improves the overall acoustic performance of the machine, offering a practical and feasible solution for low-noise agricultural machinery design. A thorough understanding of the relationship between modal shapes and noise radiation is therefore of great theoretical significance and engineering value, guiding the optimization of dynamic characteristics and noise reduction in the conveyor trough structure.
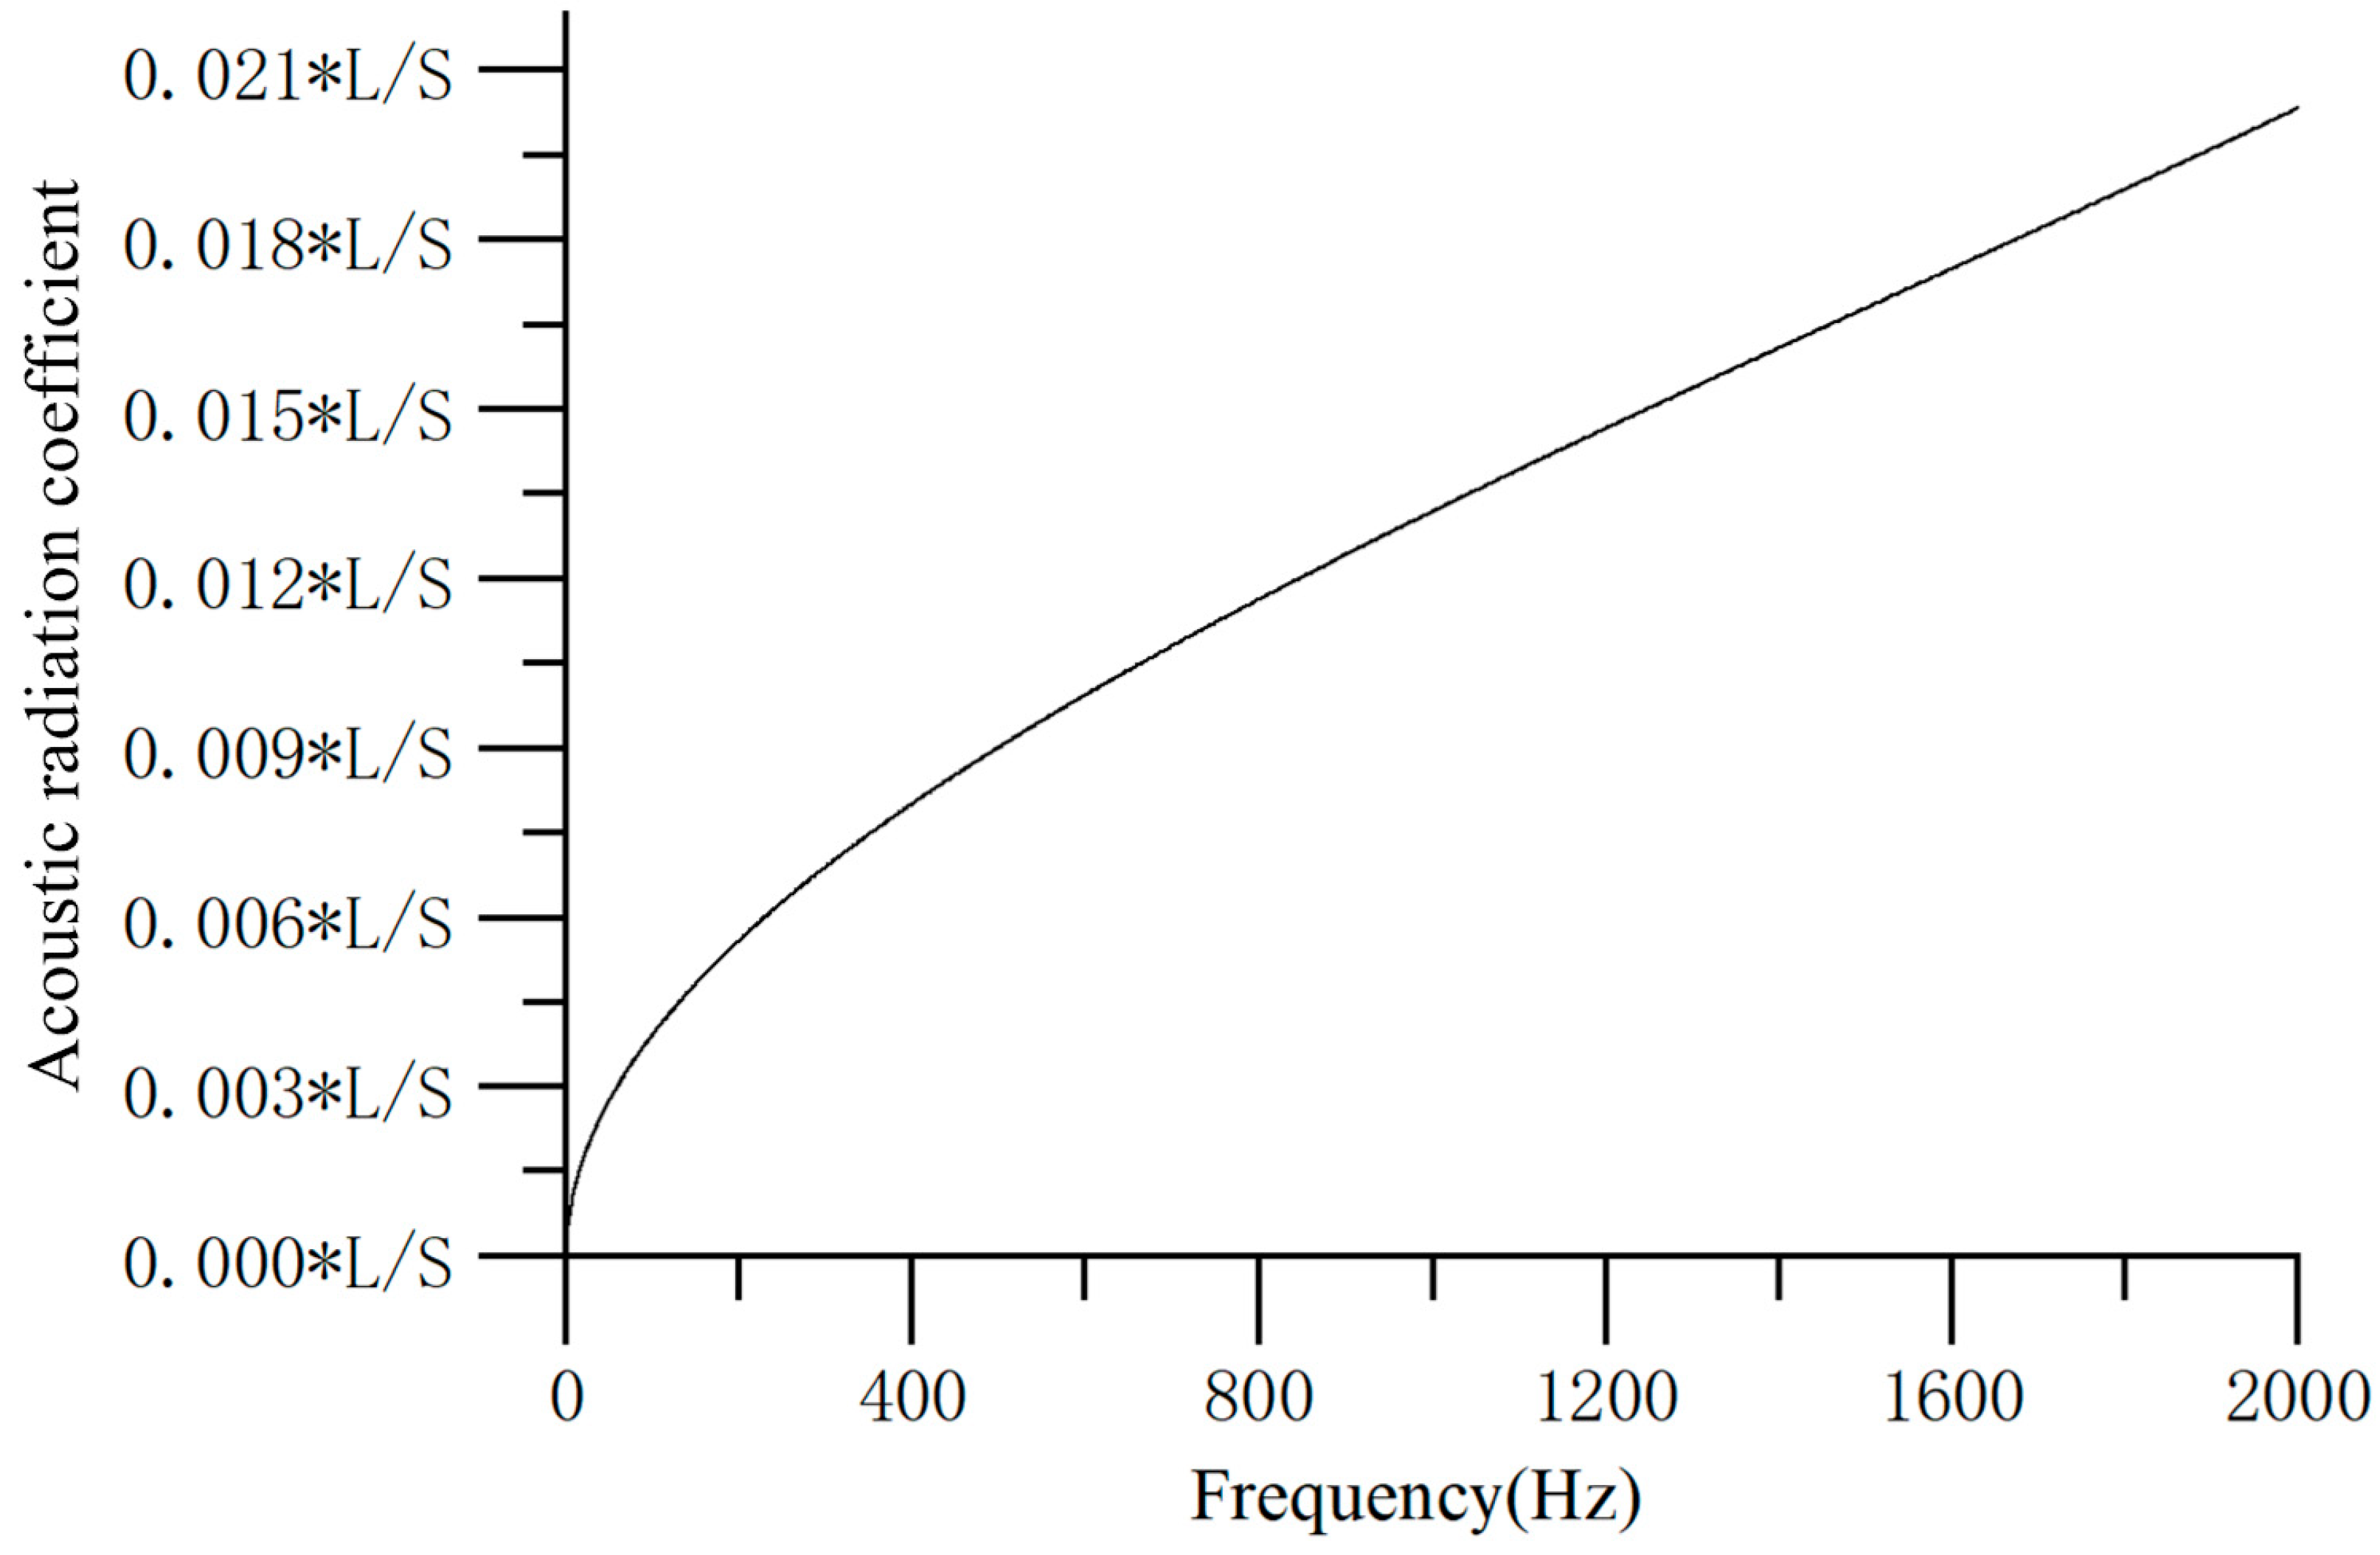
In the experiment, the conveyor trough casing of the tested combine harvester was made of structural steel, with an elastic modulus E = 2.06 × 10
11 Pa and a material density of
kg/m
3. The calculated critical frequency is
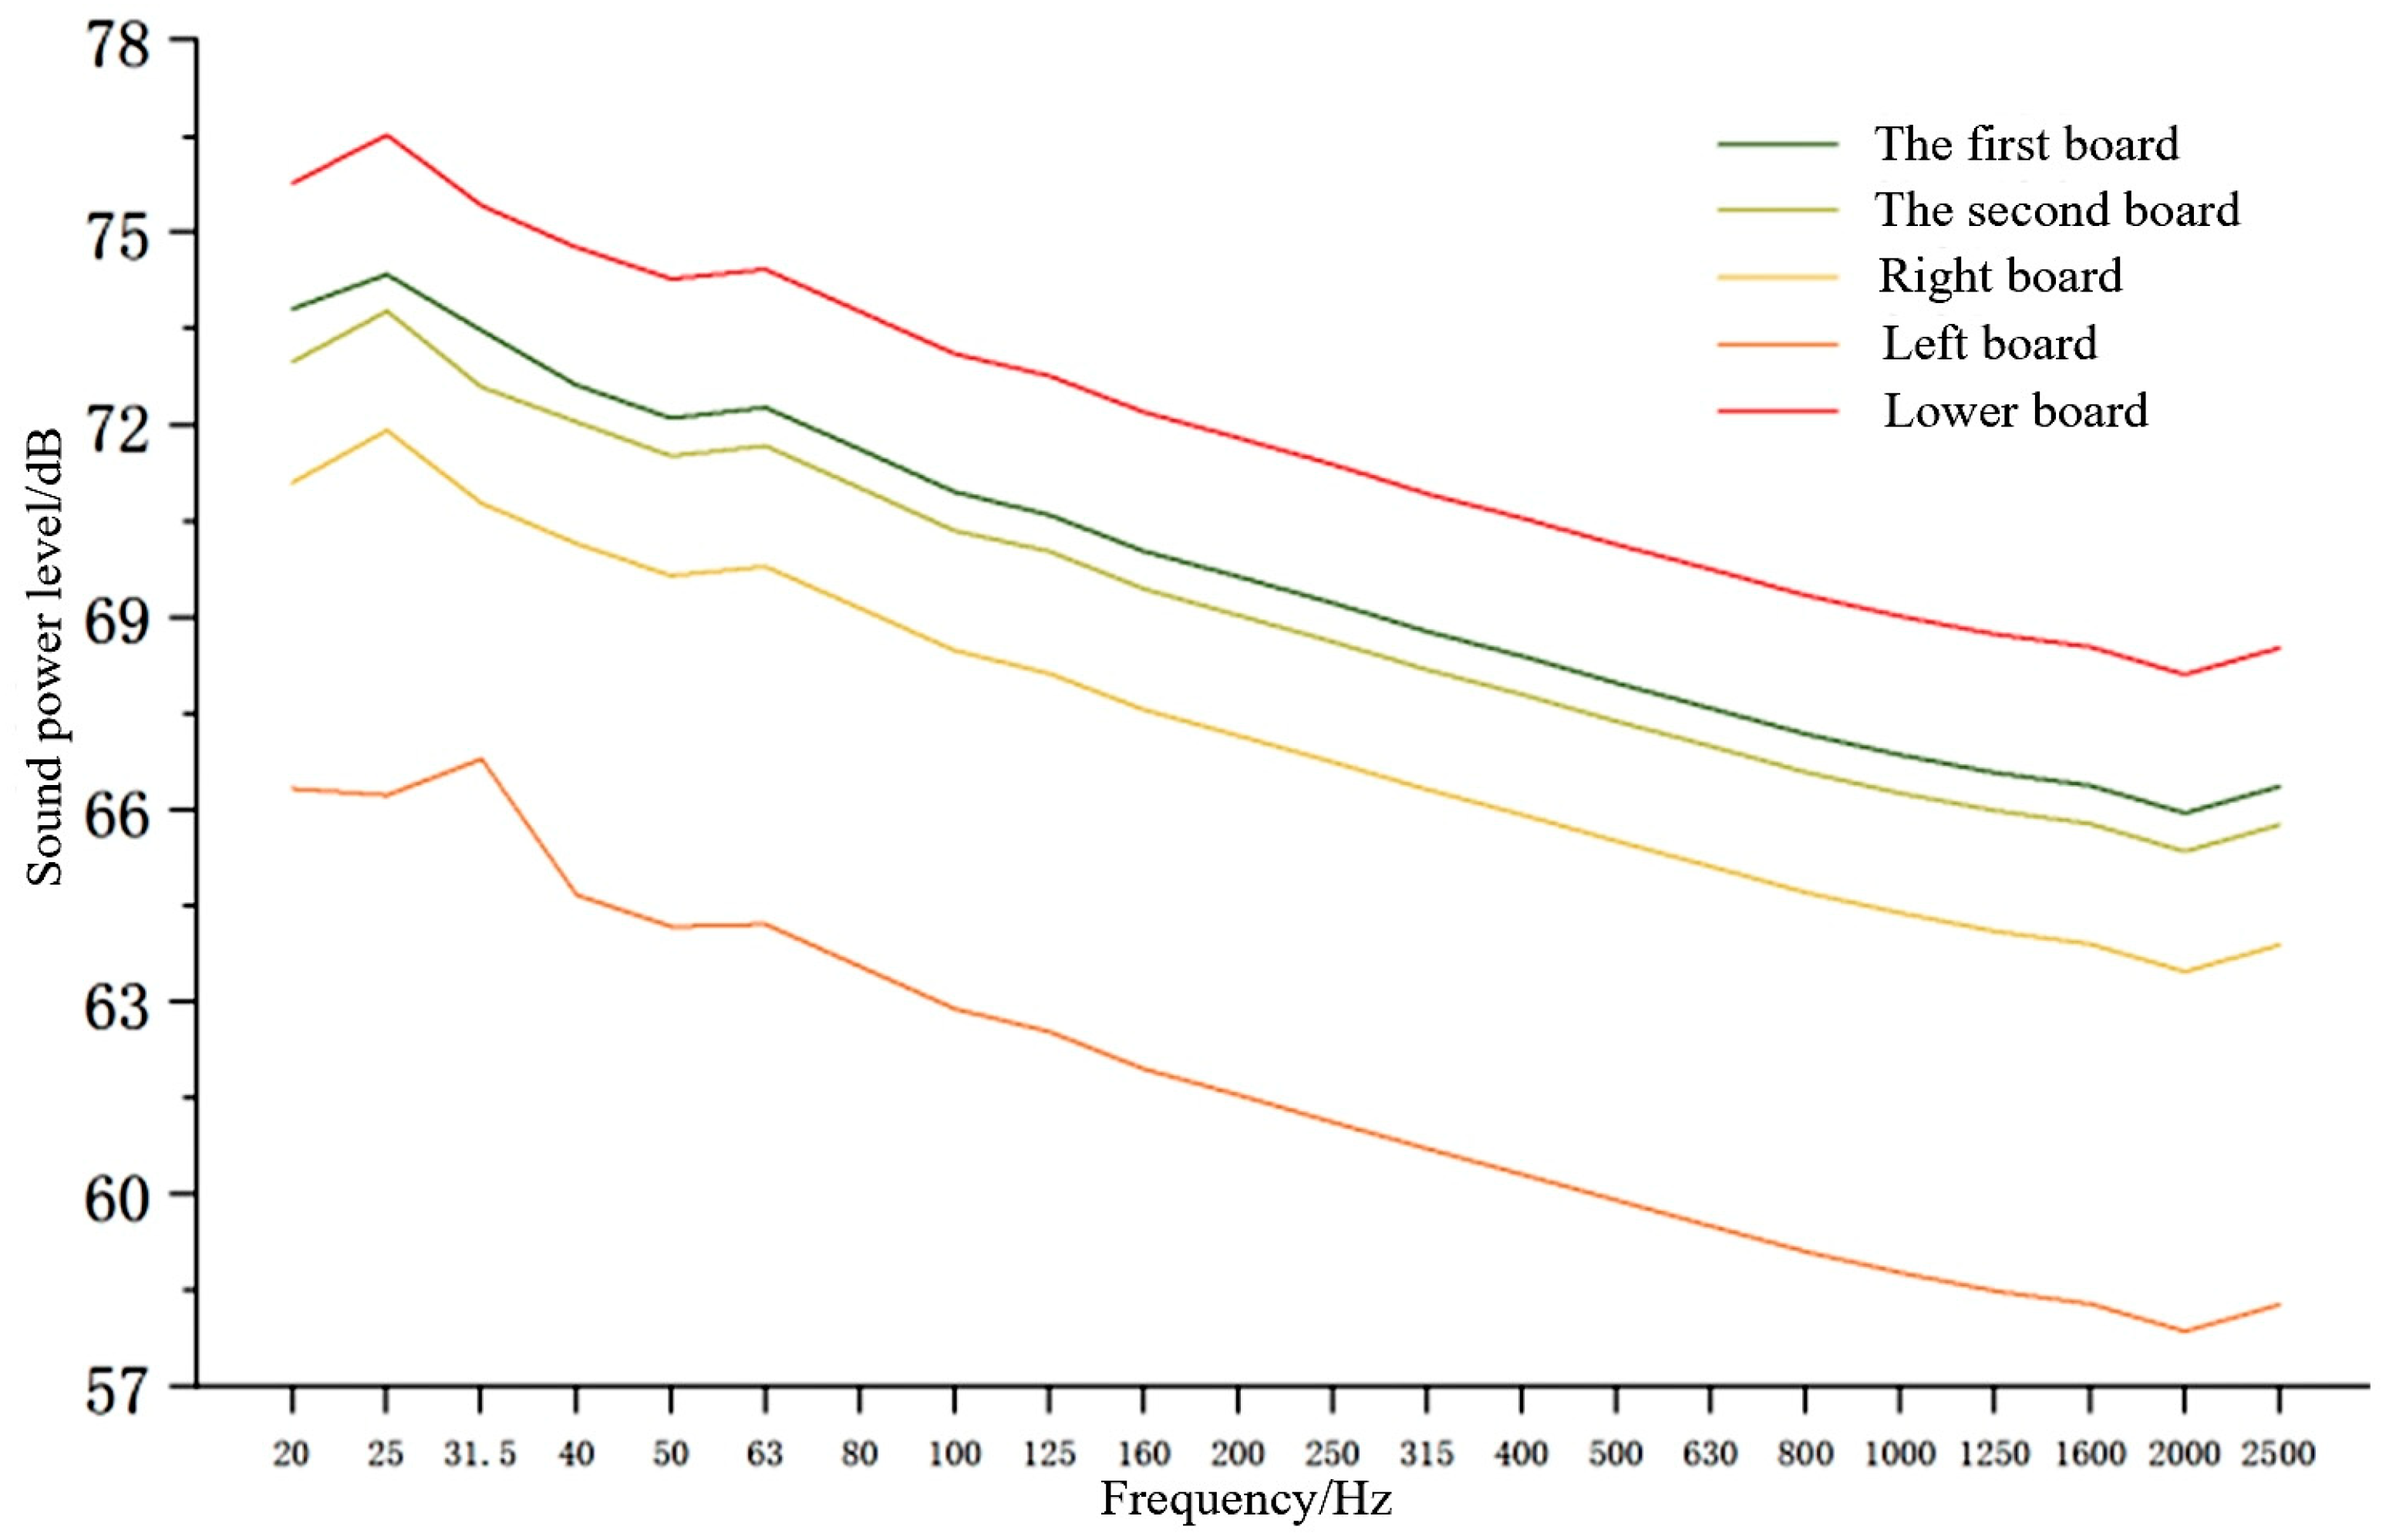
. Based on the overall machine noise measurements, the noise frequency range of the combine harvester was determined to be between 0 and 2000 Hz. Therefore, only the sound radiation coefficient of the flat plate source within the 0–2000 Hz frequency range was considered. The outer panel of the conveyor trough was partitioned into various sections, each with different surface areas and perimeters. Hence, only the part of the radiation coefficient formula that does not involve perimeter and area was calculated, and the results are shown in
Figure 8.
3.2. Frequency Response Analysis of the Conveyor Trough Chain System
Modal analysis provided detailed insights into the conveyor chain system’s resonant frequencies and vibration modes, which lays a solid foundation for the subsequent harmonic response analysis. Based on these modal analysis results, the dynamic response characteristics of the conveyor chain system under periodically varying loads can be further studied. During actual operation, the impulsive load arising from the coupling of the sprocket and chain links is transmitted through multiple paths via key transmission components such as the sprocket body, chain plate assembly, and drive shaft, thereby inducing complex vibration phenomena in the entire chain system structure.
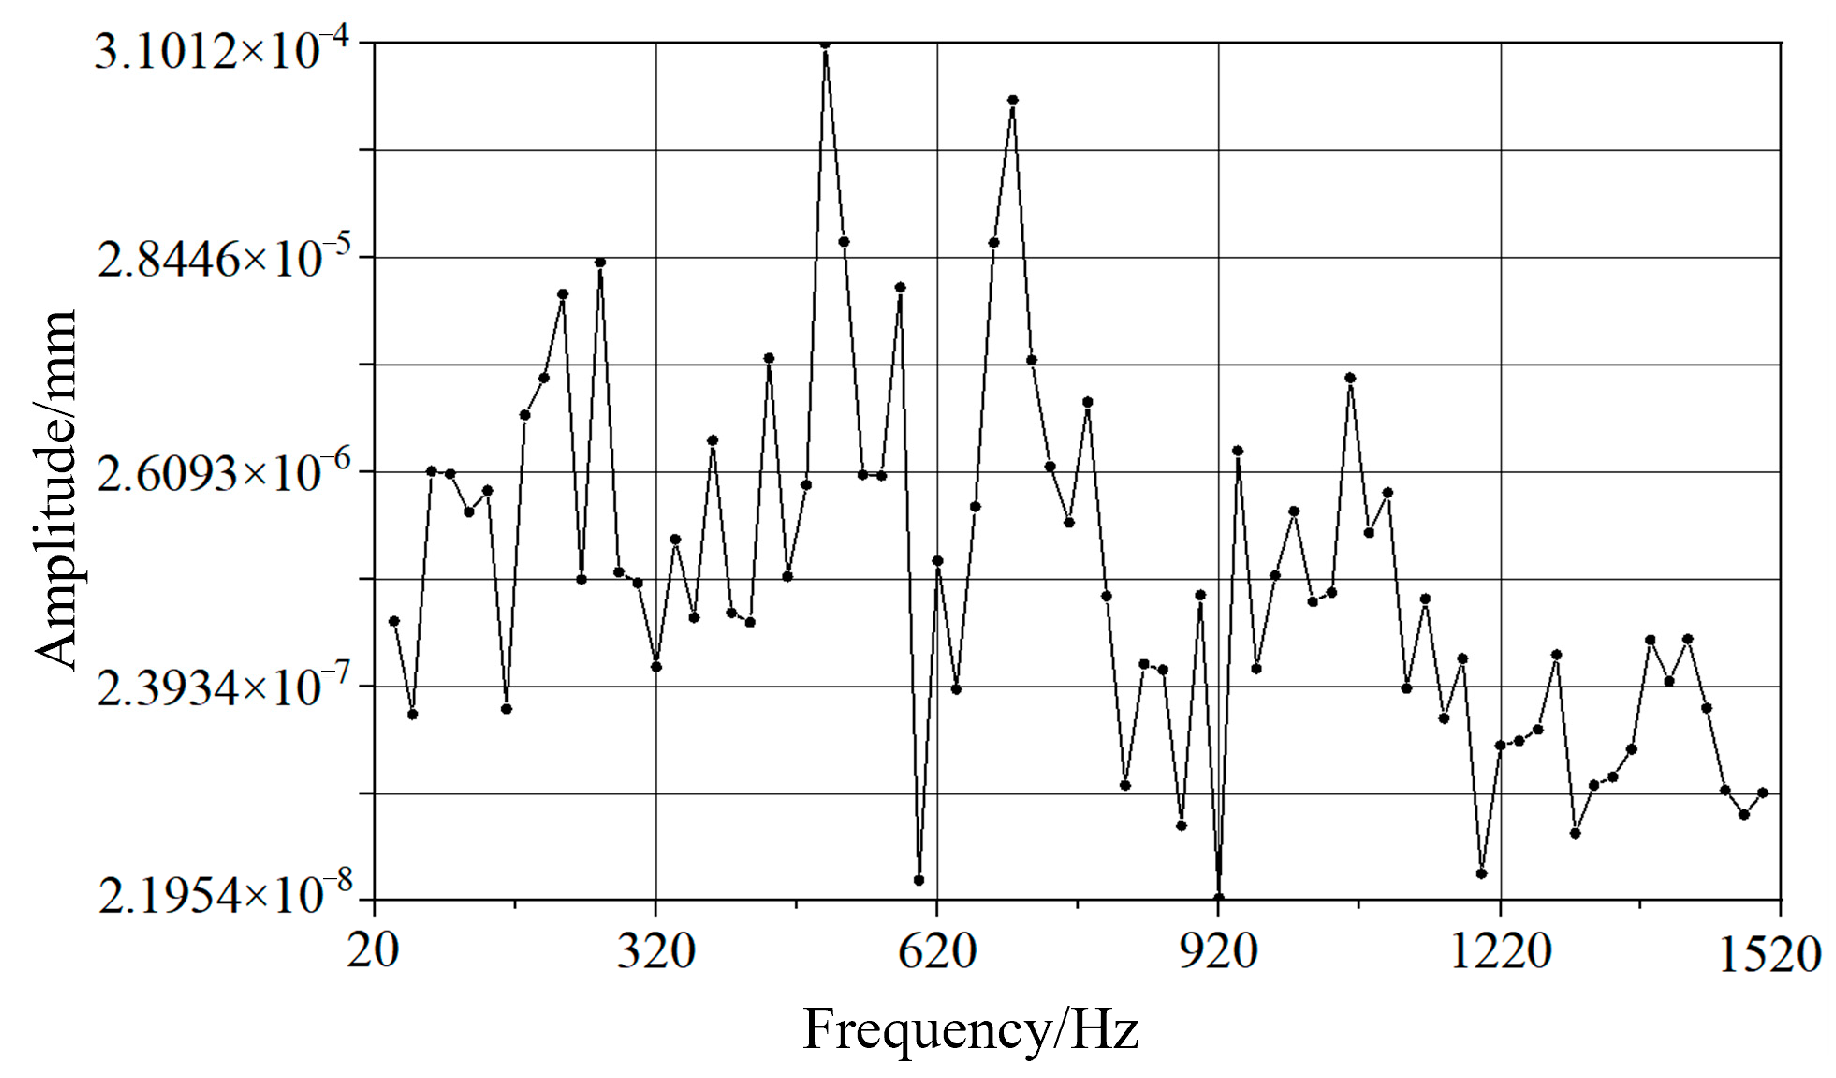
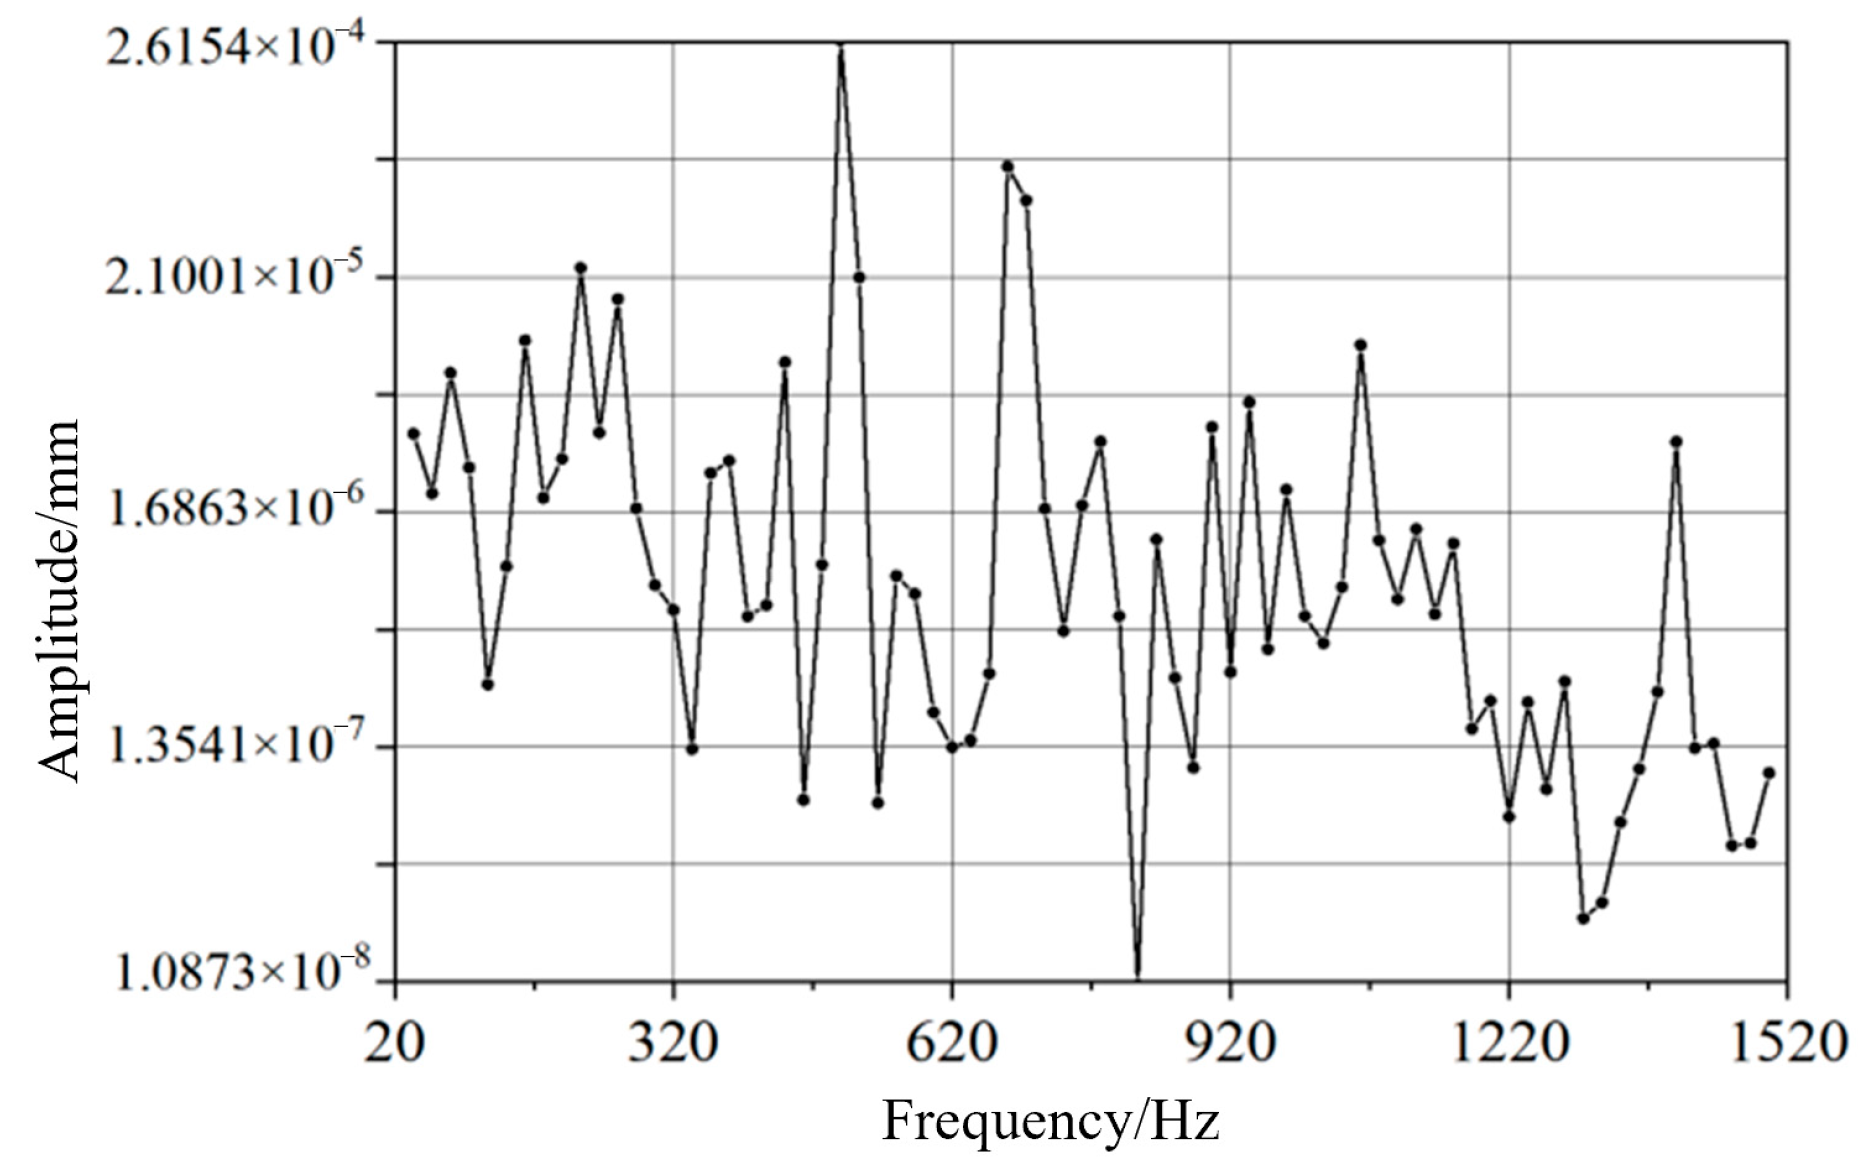
In this study, the harmonic response analysis utilizes a previously developed multi-body dynamics model, where the contact force between the sprocket and chain links—dynamically computed—is applied as the boundary load. This time-domain force is subsequently converted into a frequency-domain excitation using a Fourier Transform. The frequency analysis range is set from 20 Hz to 1500 Hz, with 74 solution points set at equal intervals, resulting in a frequency resolution of 20 Hz. This setup comprehensively captures the vibration response characteristics of the chain system across different frequency bands.
As shown in
Figure 9 and
Figure 10, two significant amplitude peaks appear at 500 Hz and 700 Hz in the vibration response spectrum in the X-direction, while two main resonance peaks at 500 Hz and 680 Hz are observed in the Y-direction vibration spectrum. These characteristic frequencies are highly consistent with the 45th-, 55th-, and 64th-order modal frequencies obtained from the previous modal analysis, fully verifying the accuracy of the modal analysis results. At the same time, it reveals the weak links in the chain system structure that are prone to resonance at these characteristic frequencies, providing clear direction and a reliable theoretical basis for subsequent structural optimization design.
Through this systematic analysis process, not only can the dynamic characteristics of the conveyor chain system be deeply understood, but also effective solutions can be provided for vibration and noise control in actual engineering applications.
3.3. Noise Reduction Design of the Surface Panel of the Cavity Structure and Its Application in Conveyor Trough Noise Reduction
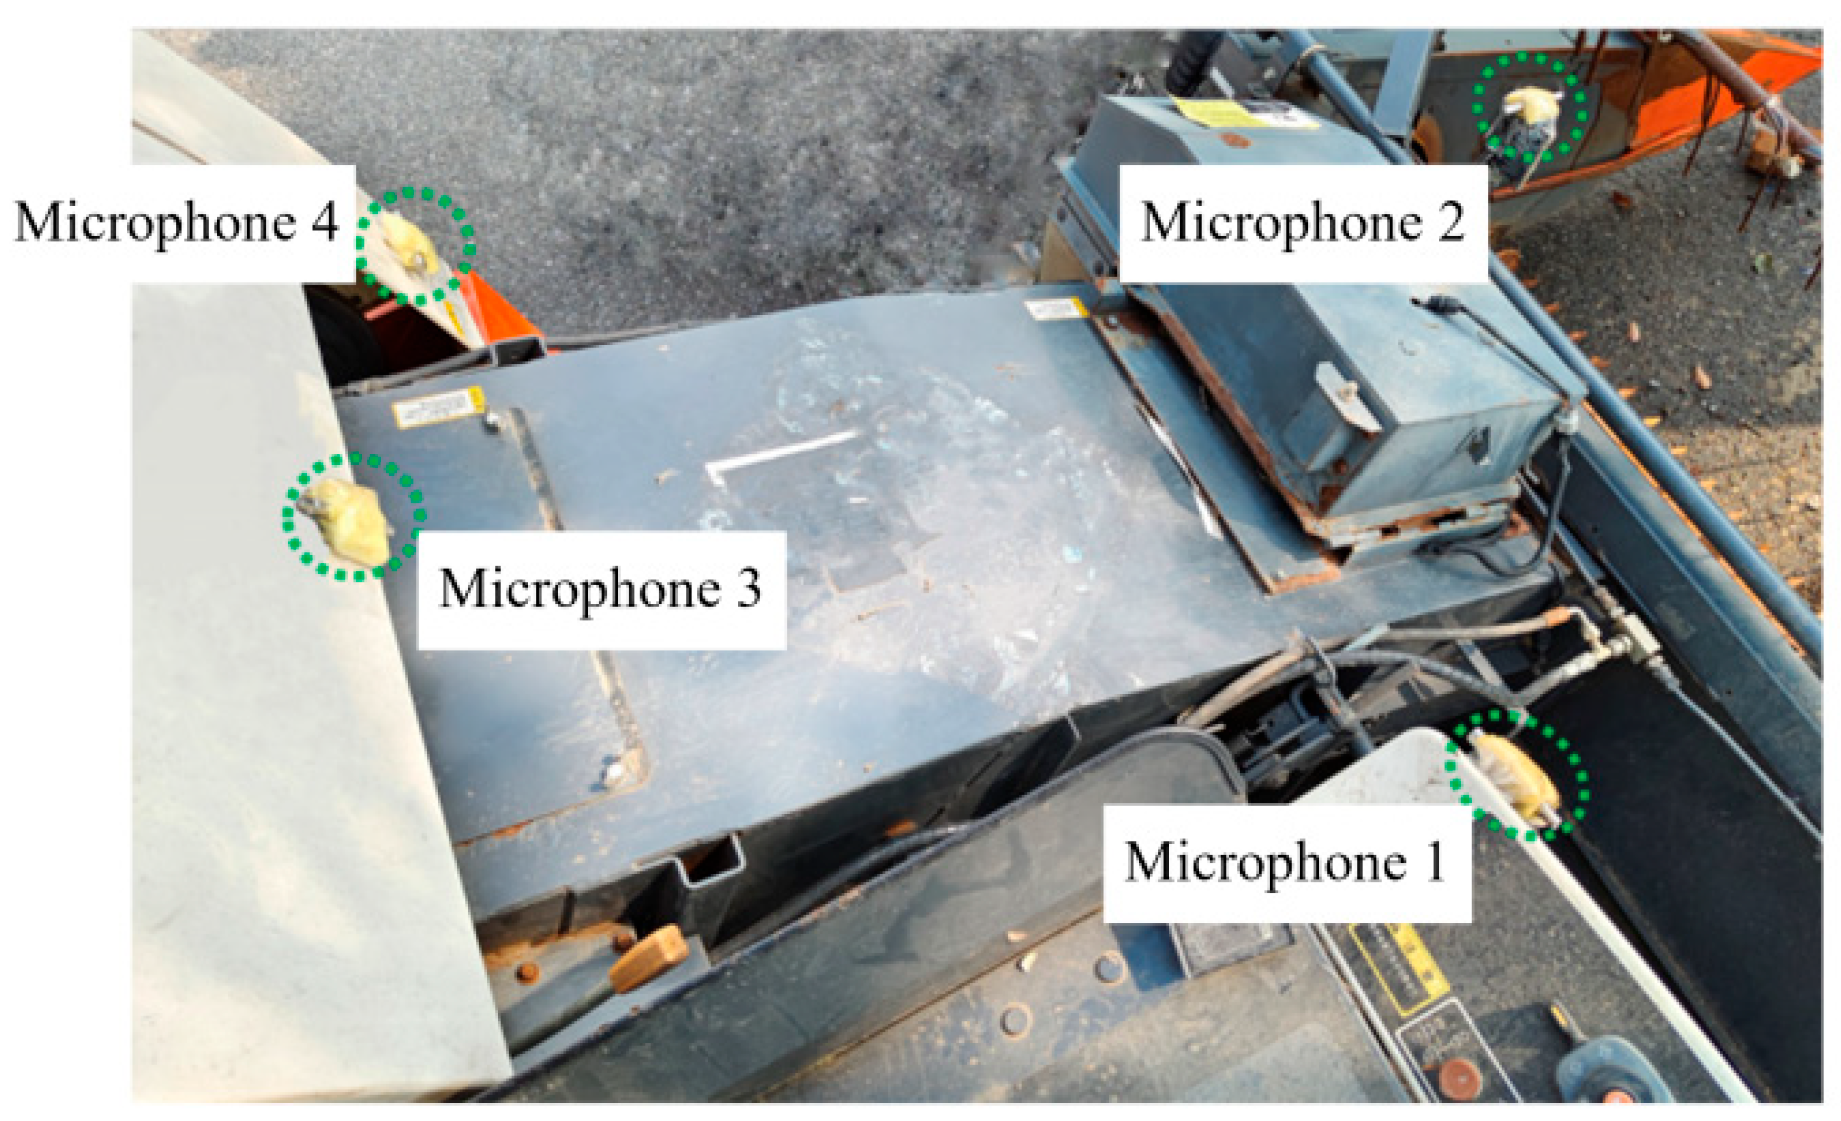
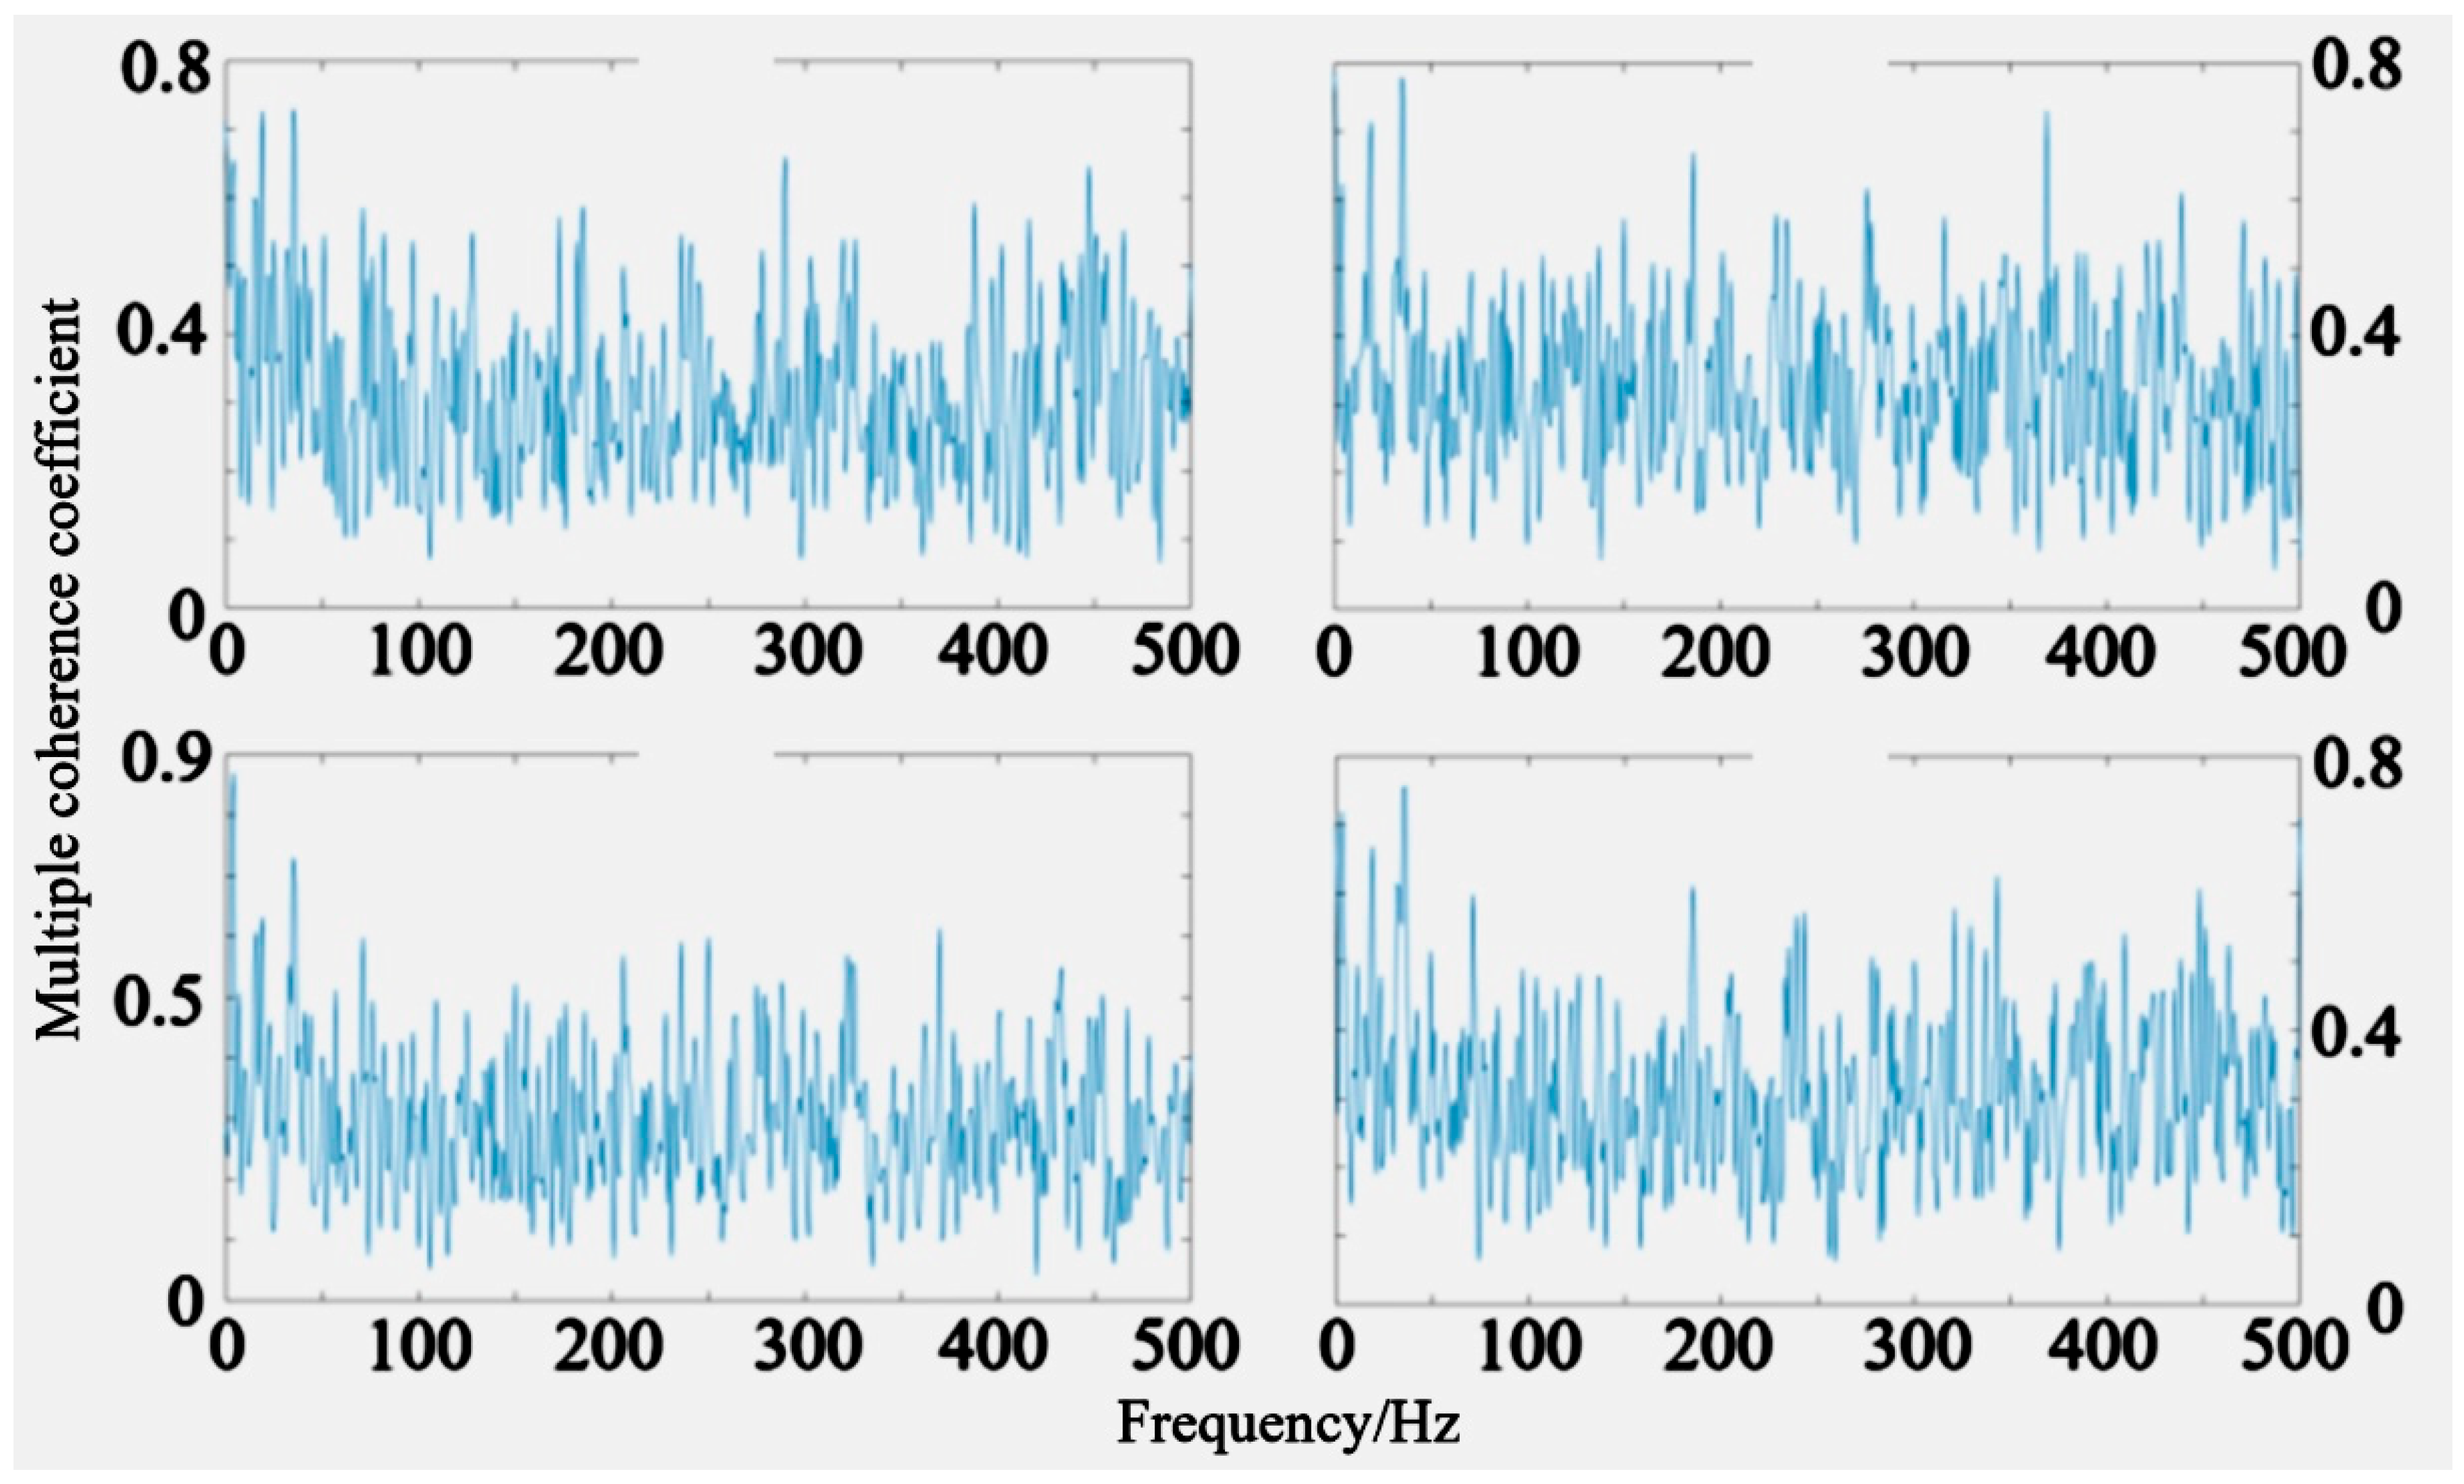
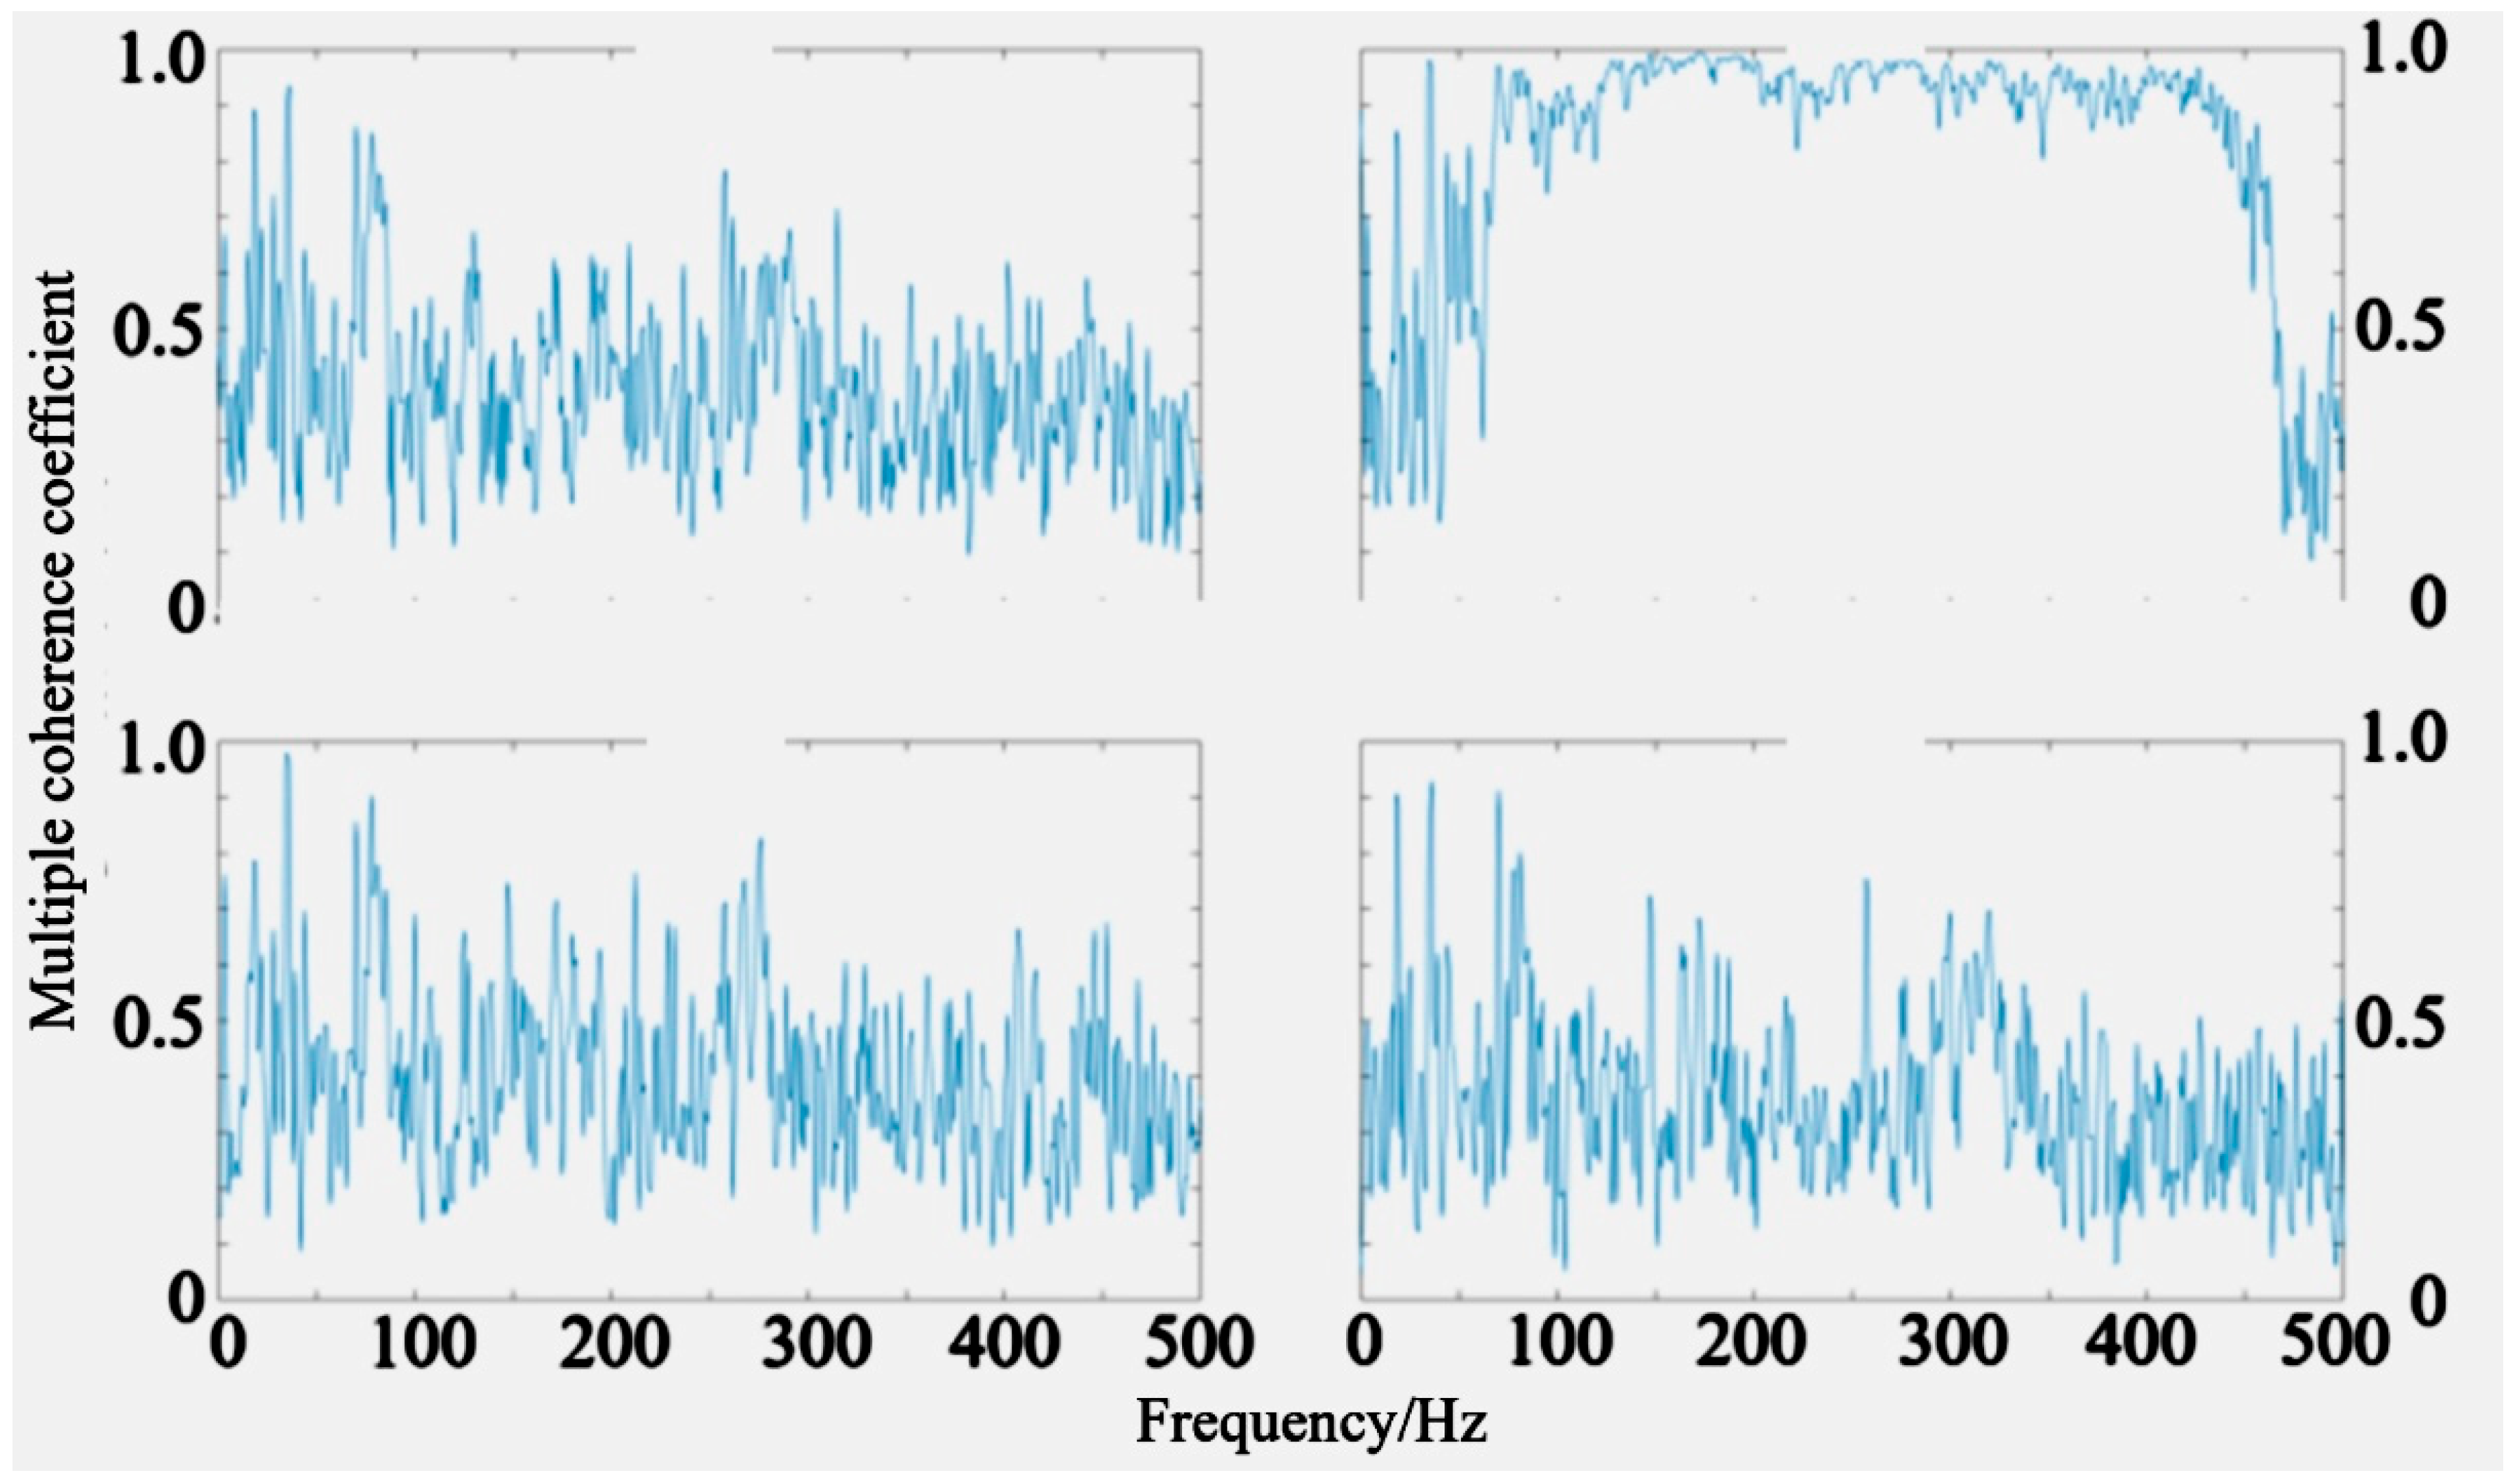
After implementing noise reduction measures on the conveyor trough housing, in order to compare the noise levels before and after the treatment and to verify whether there was any change in the noise emitted by the conveyor trough of the combine harvester, four noise measurement points were arranged near the conveyor trough. The locations of the measurement points are shown in
Figure 11. The microphones used are consistent with those employed in
Section 2 noise testing and are free-field microphones. During noise measurements, the microphones were positioned as perpendicular as possible to the expected noise source of the conveyor trough.
Microphone 1 was fixed outside the driver’s seat area, near the left side of the conveyor trough; Microphone 2 was mounted above the feeding end of the conveyor trough; Microphone 3 was positioned above the top panel of the conveyor trough, perpendicular to the plane of the upper panel; and Microphone 4 was mounted on the casing used to cover the belt pulley, oriented perpendicular to the side surface of the conveyor trough’s right panel.
Since the data measured by the microphones before and after noise reduction were not obtained simultaneously, selecting an appropriate evaluation criterion is very important. The equivalent continuous sound level is a key indicator for assessing noise pollution. It processes the A-weighted sound pressure levels in the time domain by energy averaging to measure the noise level over a period of time. Its calculation formula is given as Equation (10):
In the formula,
is the equivalent continuous A-weighted sound level within the time period T, dB(A);
is the instantaneous A-weighted sound level at time t, dB(A); T is the continuous sampling time, min; N is the total number of measured sound levels; and
is the
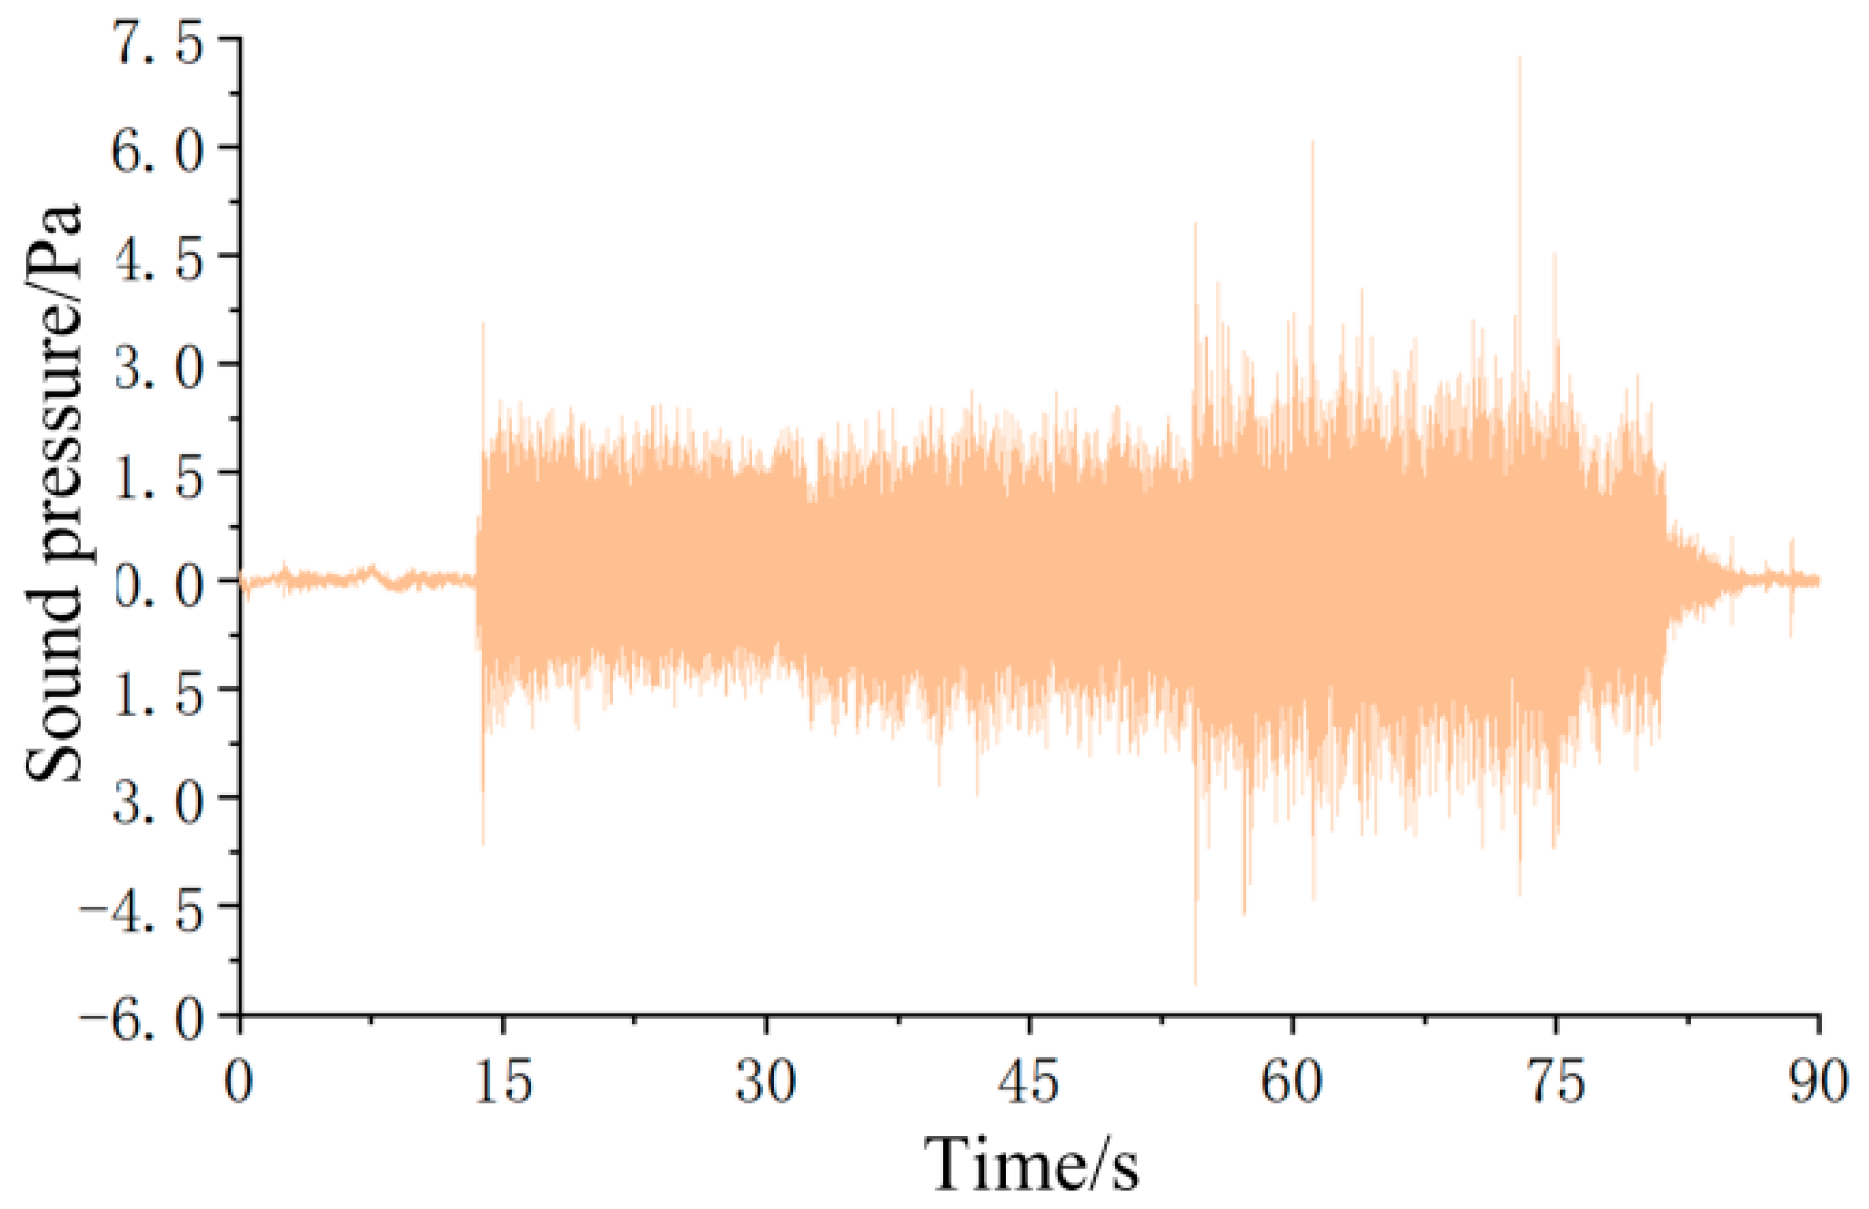
i-th collected A-weighted sound level. Noise tests were conducted three times, respectively, before and after noise reduction. The sound pressure data obtained from channel 1 in the first test group are shown in
Figure 12. The sound pressure data obtained from each measuring point during the machine startup phase were processed to obtain the corresponding equivalent continuous sound level results shown in
Table 1.
As shown in
Table 1, the minimum equivalent continuous sound levels (Leq) before noise reduction at measurement points 1, 2, 3, and 4 were 93.2709 dB (Group 3), 94.3186 dB (Group 2), 95.0358 dB (Group 2), and 94.0138 dB (Group 2), respectively. After noise reduction treatment, some measurements still exhibited Leq values exceeding these pre-treatment minima. Specifically, the recorded values at measurement point 1 for Groups 4, 5, and 6 were 93.5545 dB, 93.2880 dB, and 93.2993 dB, respectively, while the value at measurement point 2 for Group 6 was 94.3508 dB. By comparing the averages of each measuring point before and after noise reduction, it can be found that except for measuring point 1, the equivalent sound levels of the other three measuring points have decreased to some extent. However, since measurement point 1 is located closer to the cutter bar transmission chain, the noise reduction effect there is not significant. The calculated reductions in equivalent continuous sound pressure levels at points 1, 2, 3, and 4 are 0.01797 dB(A), 0.17393 dB(A), 0.28926 dB(A), and 0.4071 dB(A), respectively. Since the data measured by the microphones are not only noise generated by the conveyor trough, this test proves that the noise of the conveyor trough has been reduced after applying damping patches.


 ,
, 
