
Key Influencing Factors in the Variation in Livestock Carbon Emissions in the Grassland Region of Gannan Prefecture, China (2009–2024)

 ,
, 
Abstract
1. Introduction
2. Materials and Methods
2.1. Study Area
2.2. Data and Methods
2.2.1. Carbon Emission Calculation
2.2.2. Animal Husbandry Carbon Sequestration
2.2.3. Calculation of Other Carbon Indicators
2.2.4. Carbon Emissions from Different Land-Use Types
3. Results
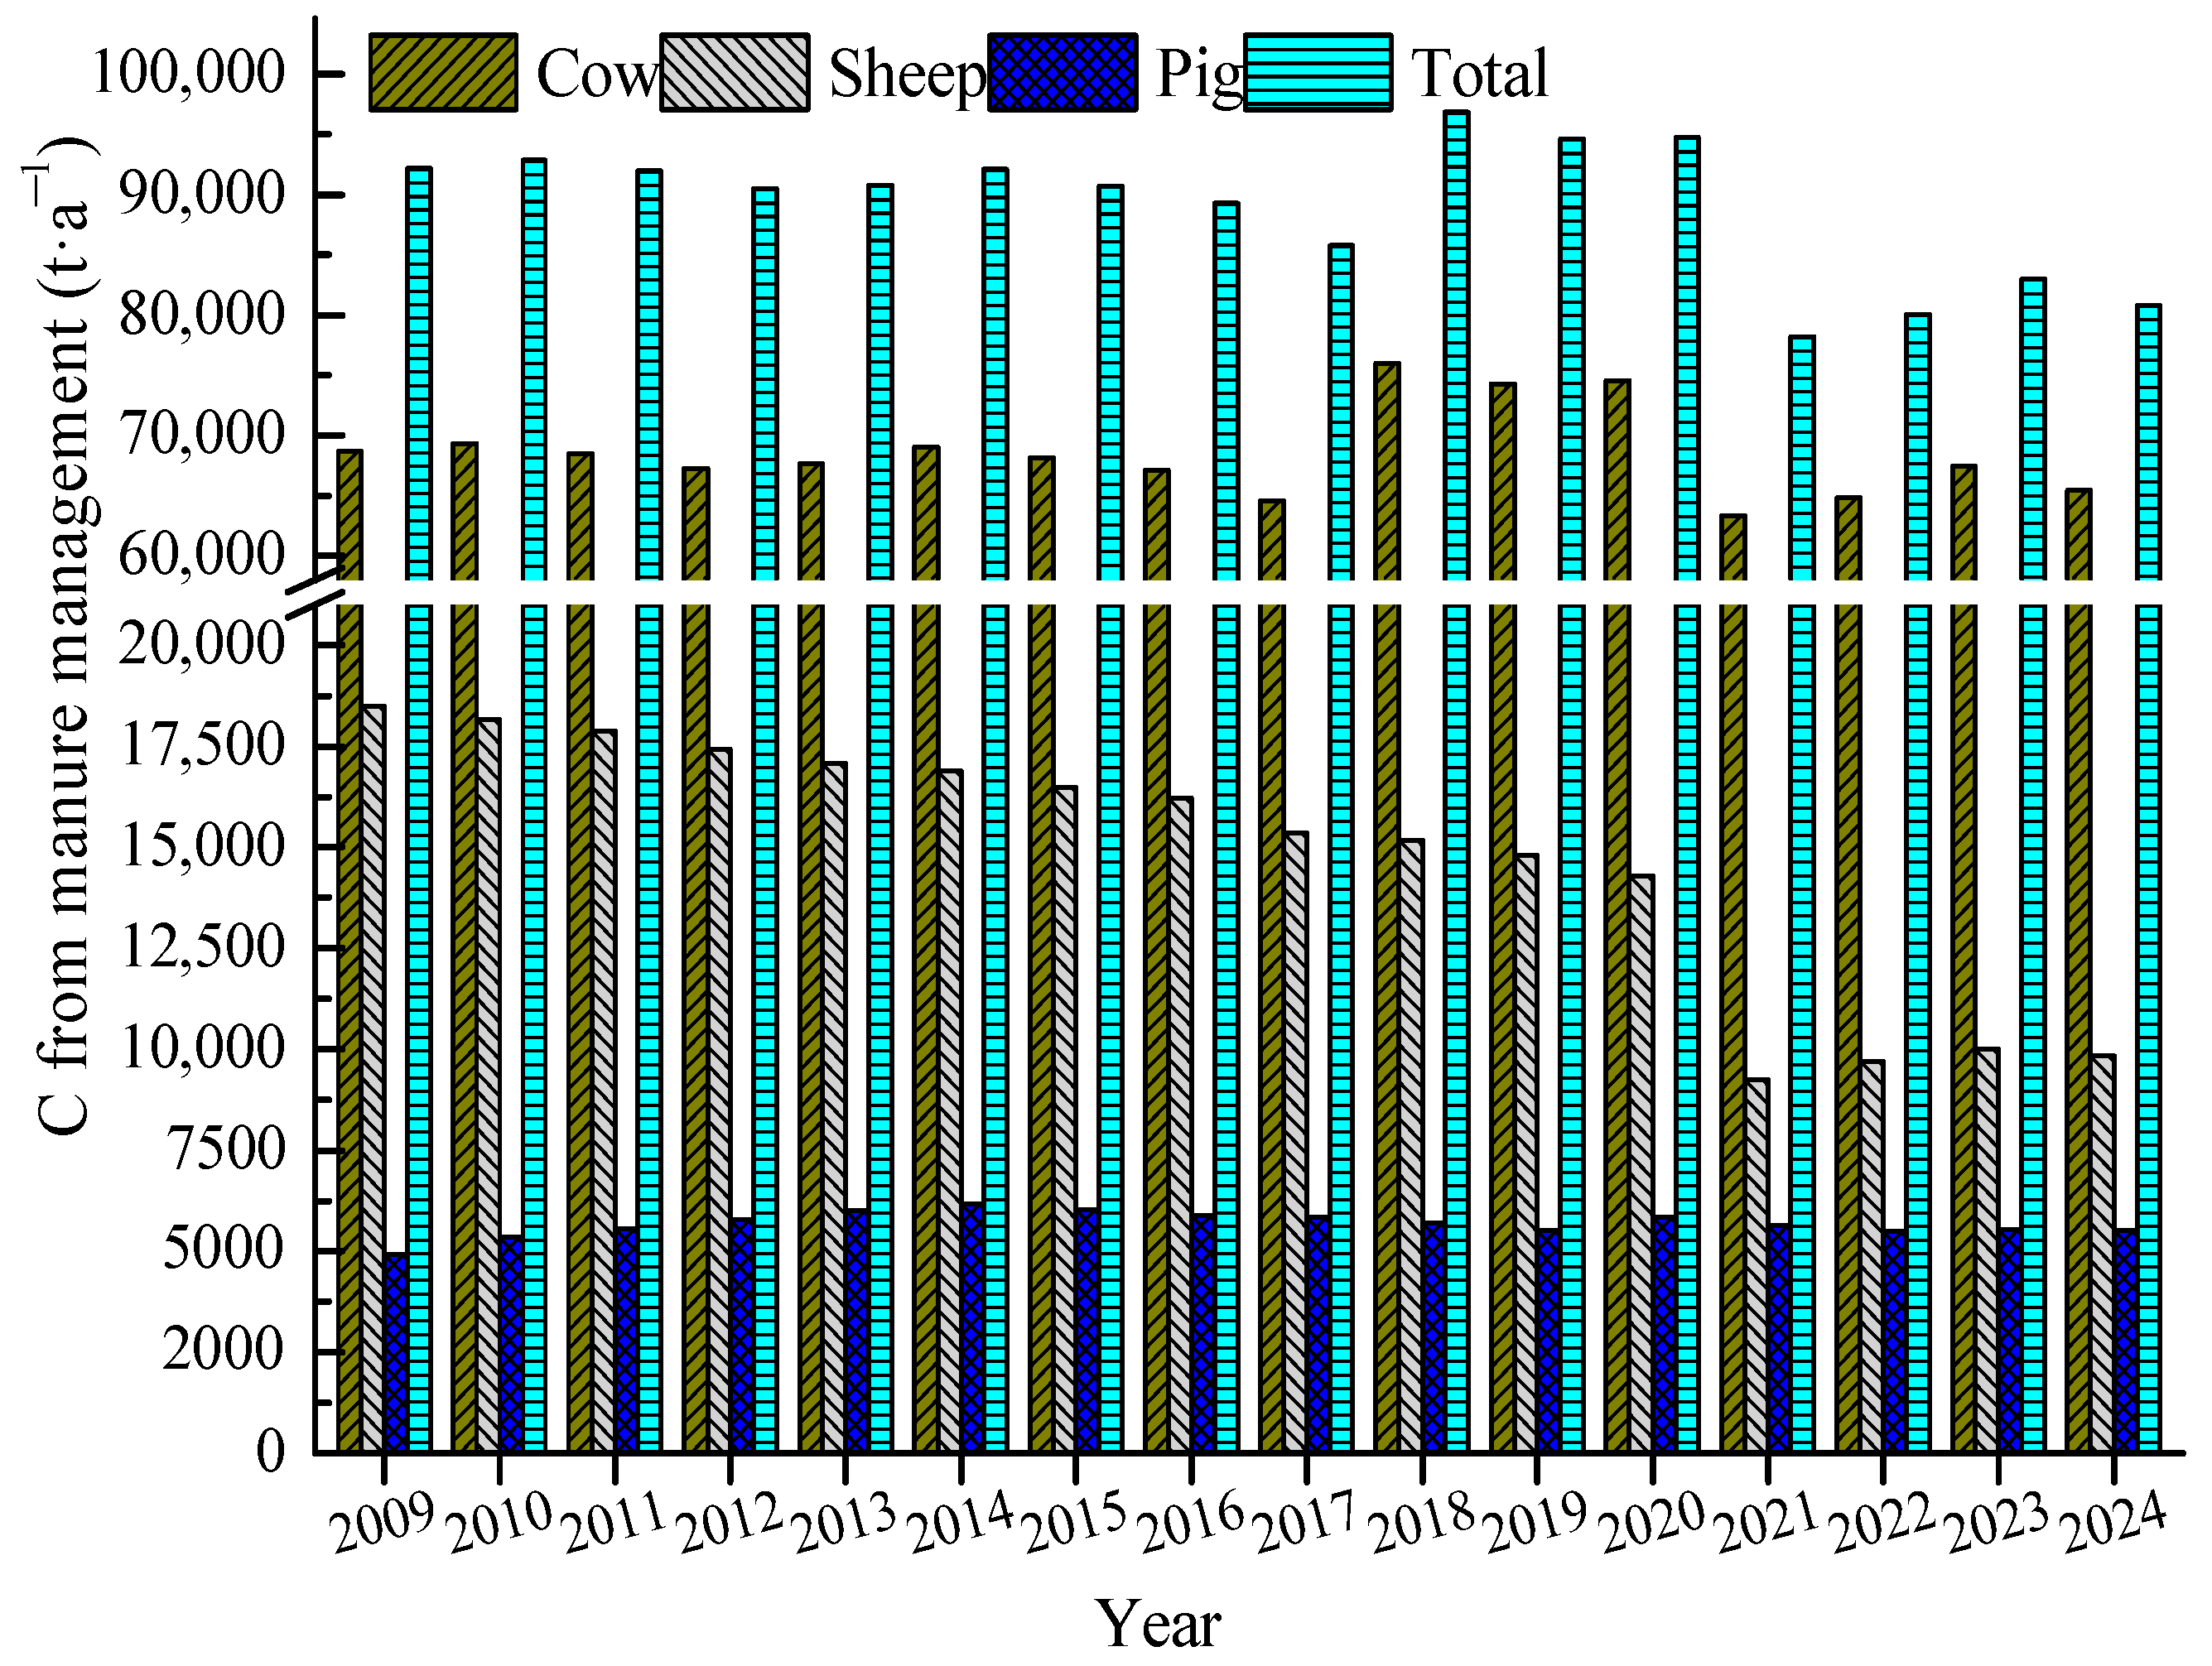
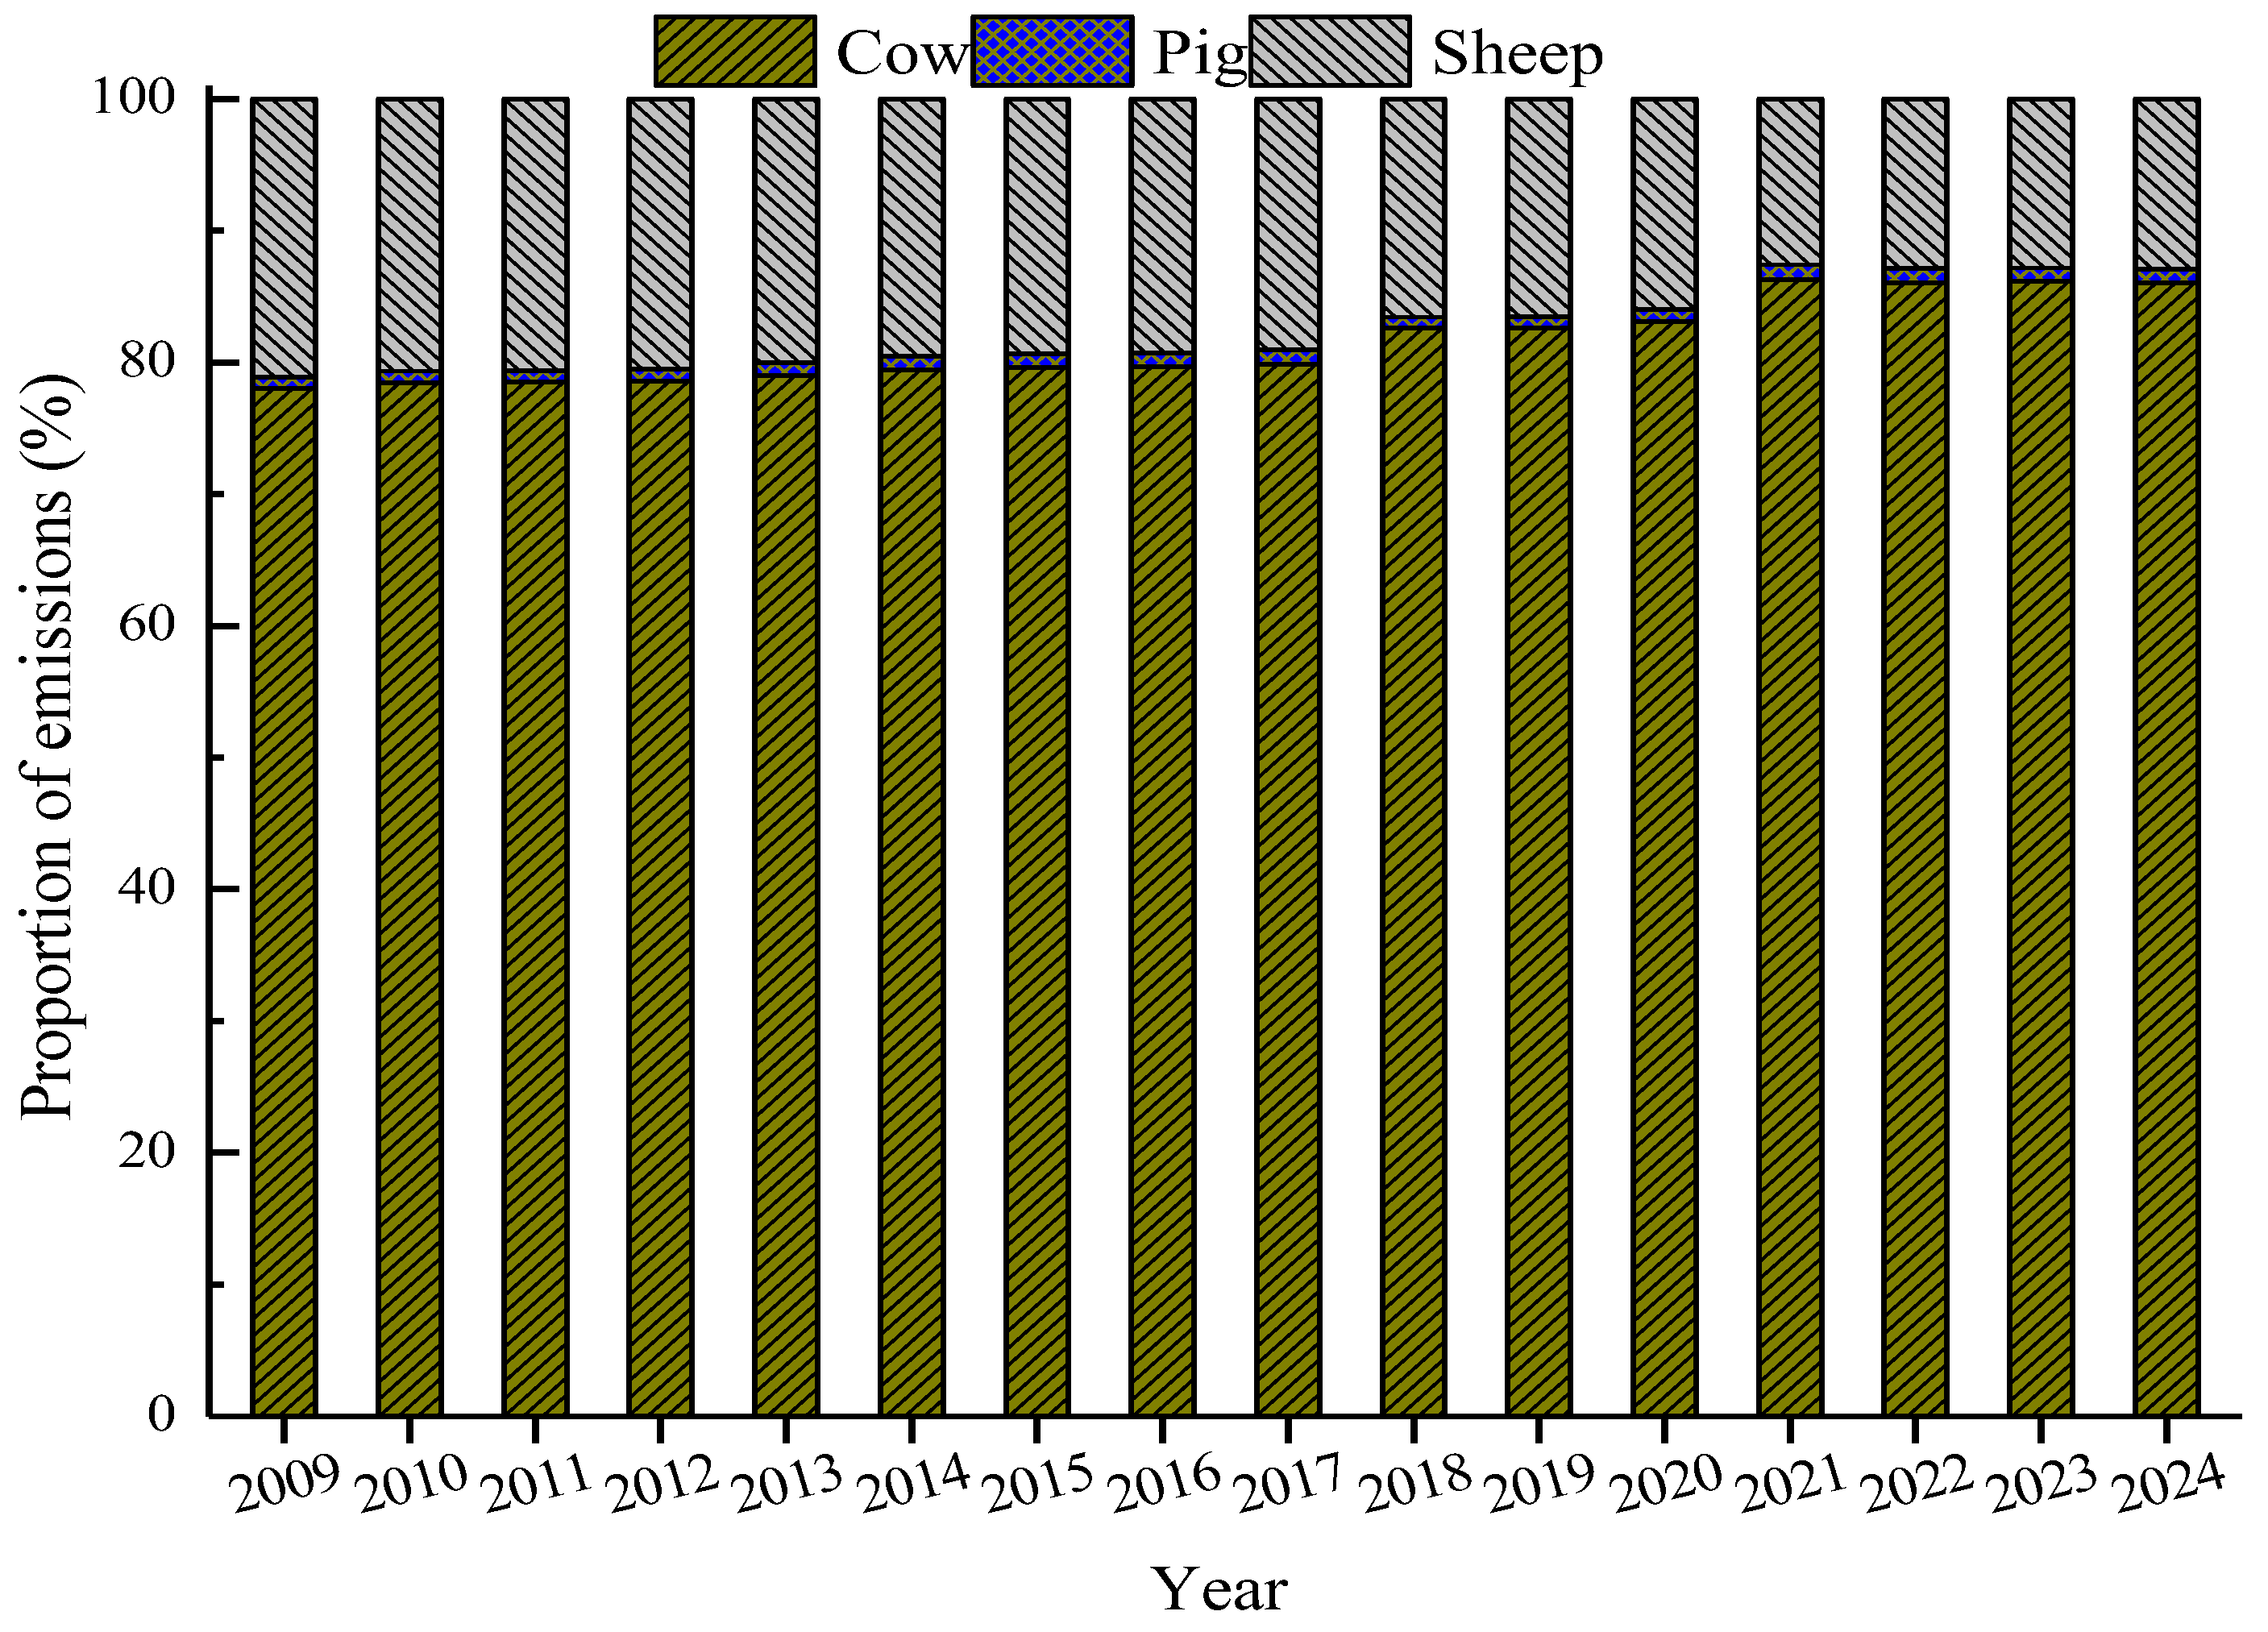
3.1. Changes in Livestock Carbon Emissions
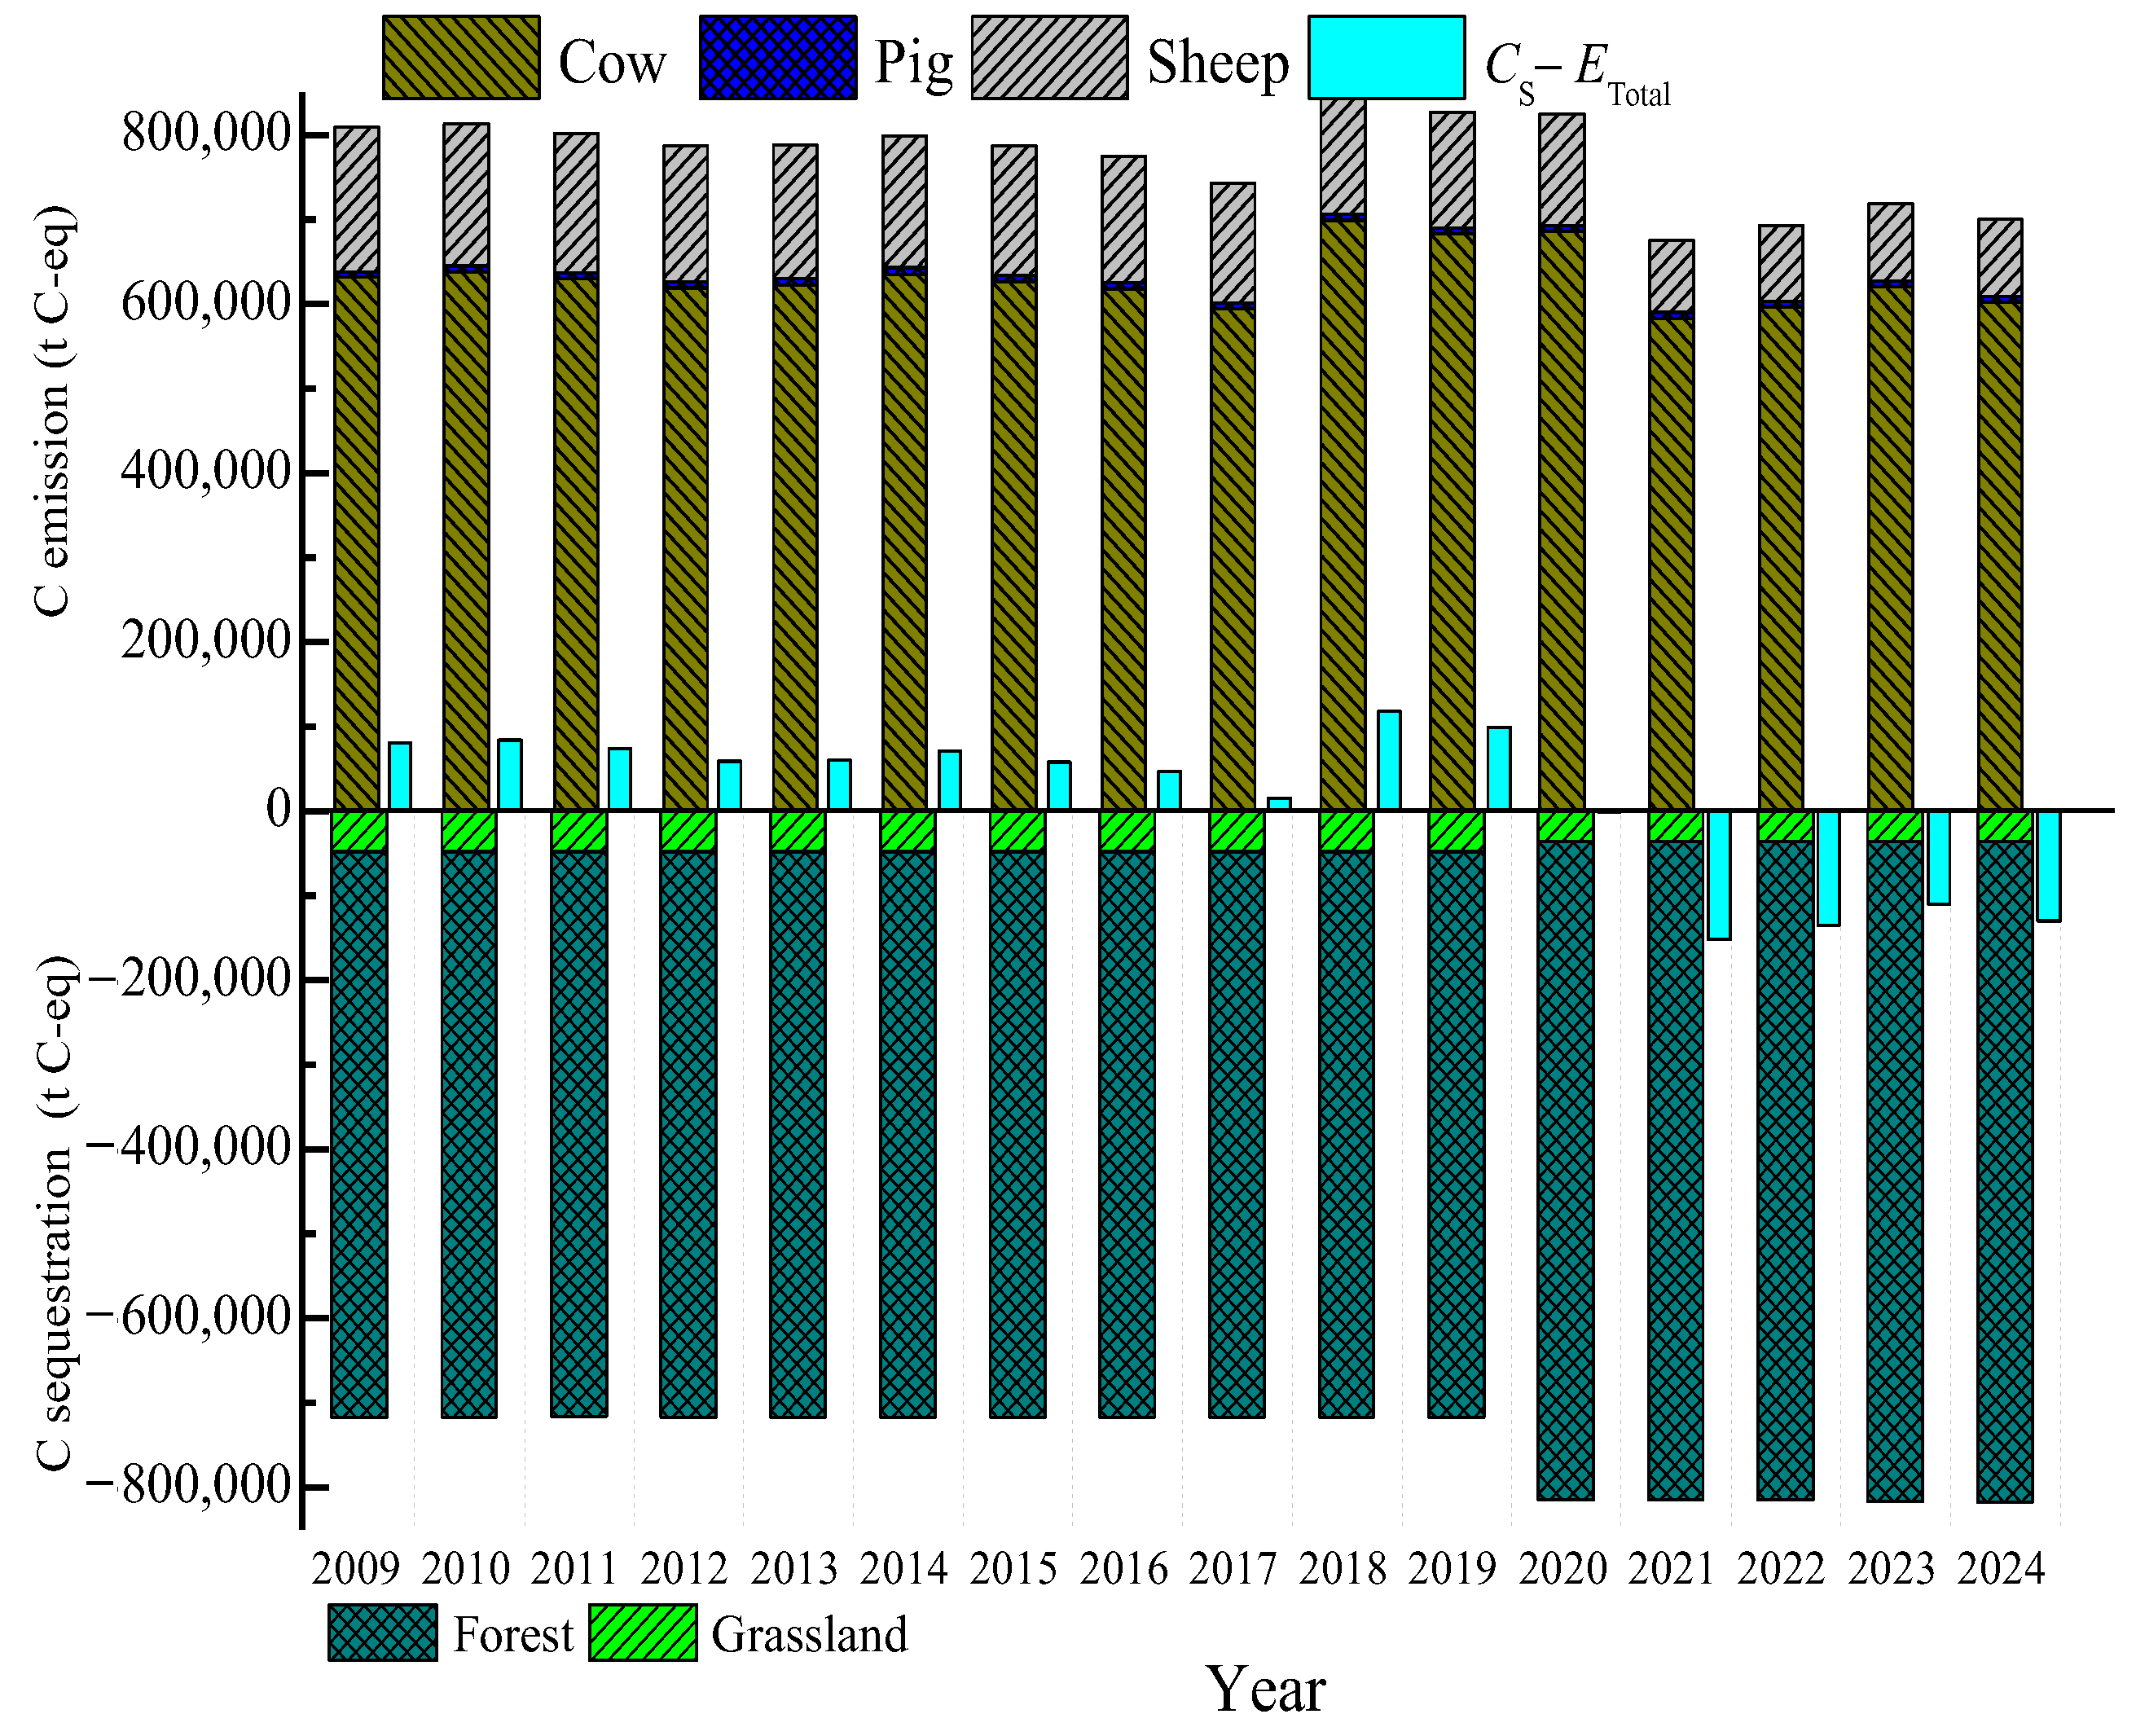
3.2. Carbon Sequestration of Production System
3.3. Carbon Indicators of Production System
3.4. Characteristics of Land-Use Carbon Emissions
4. Discussion
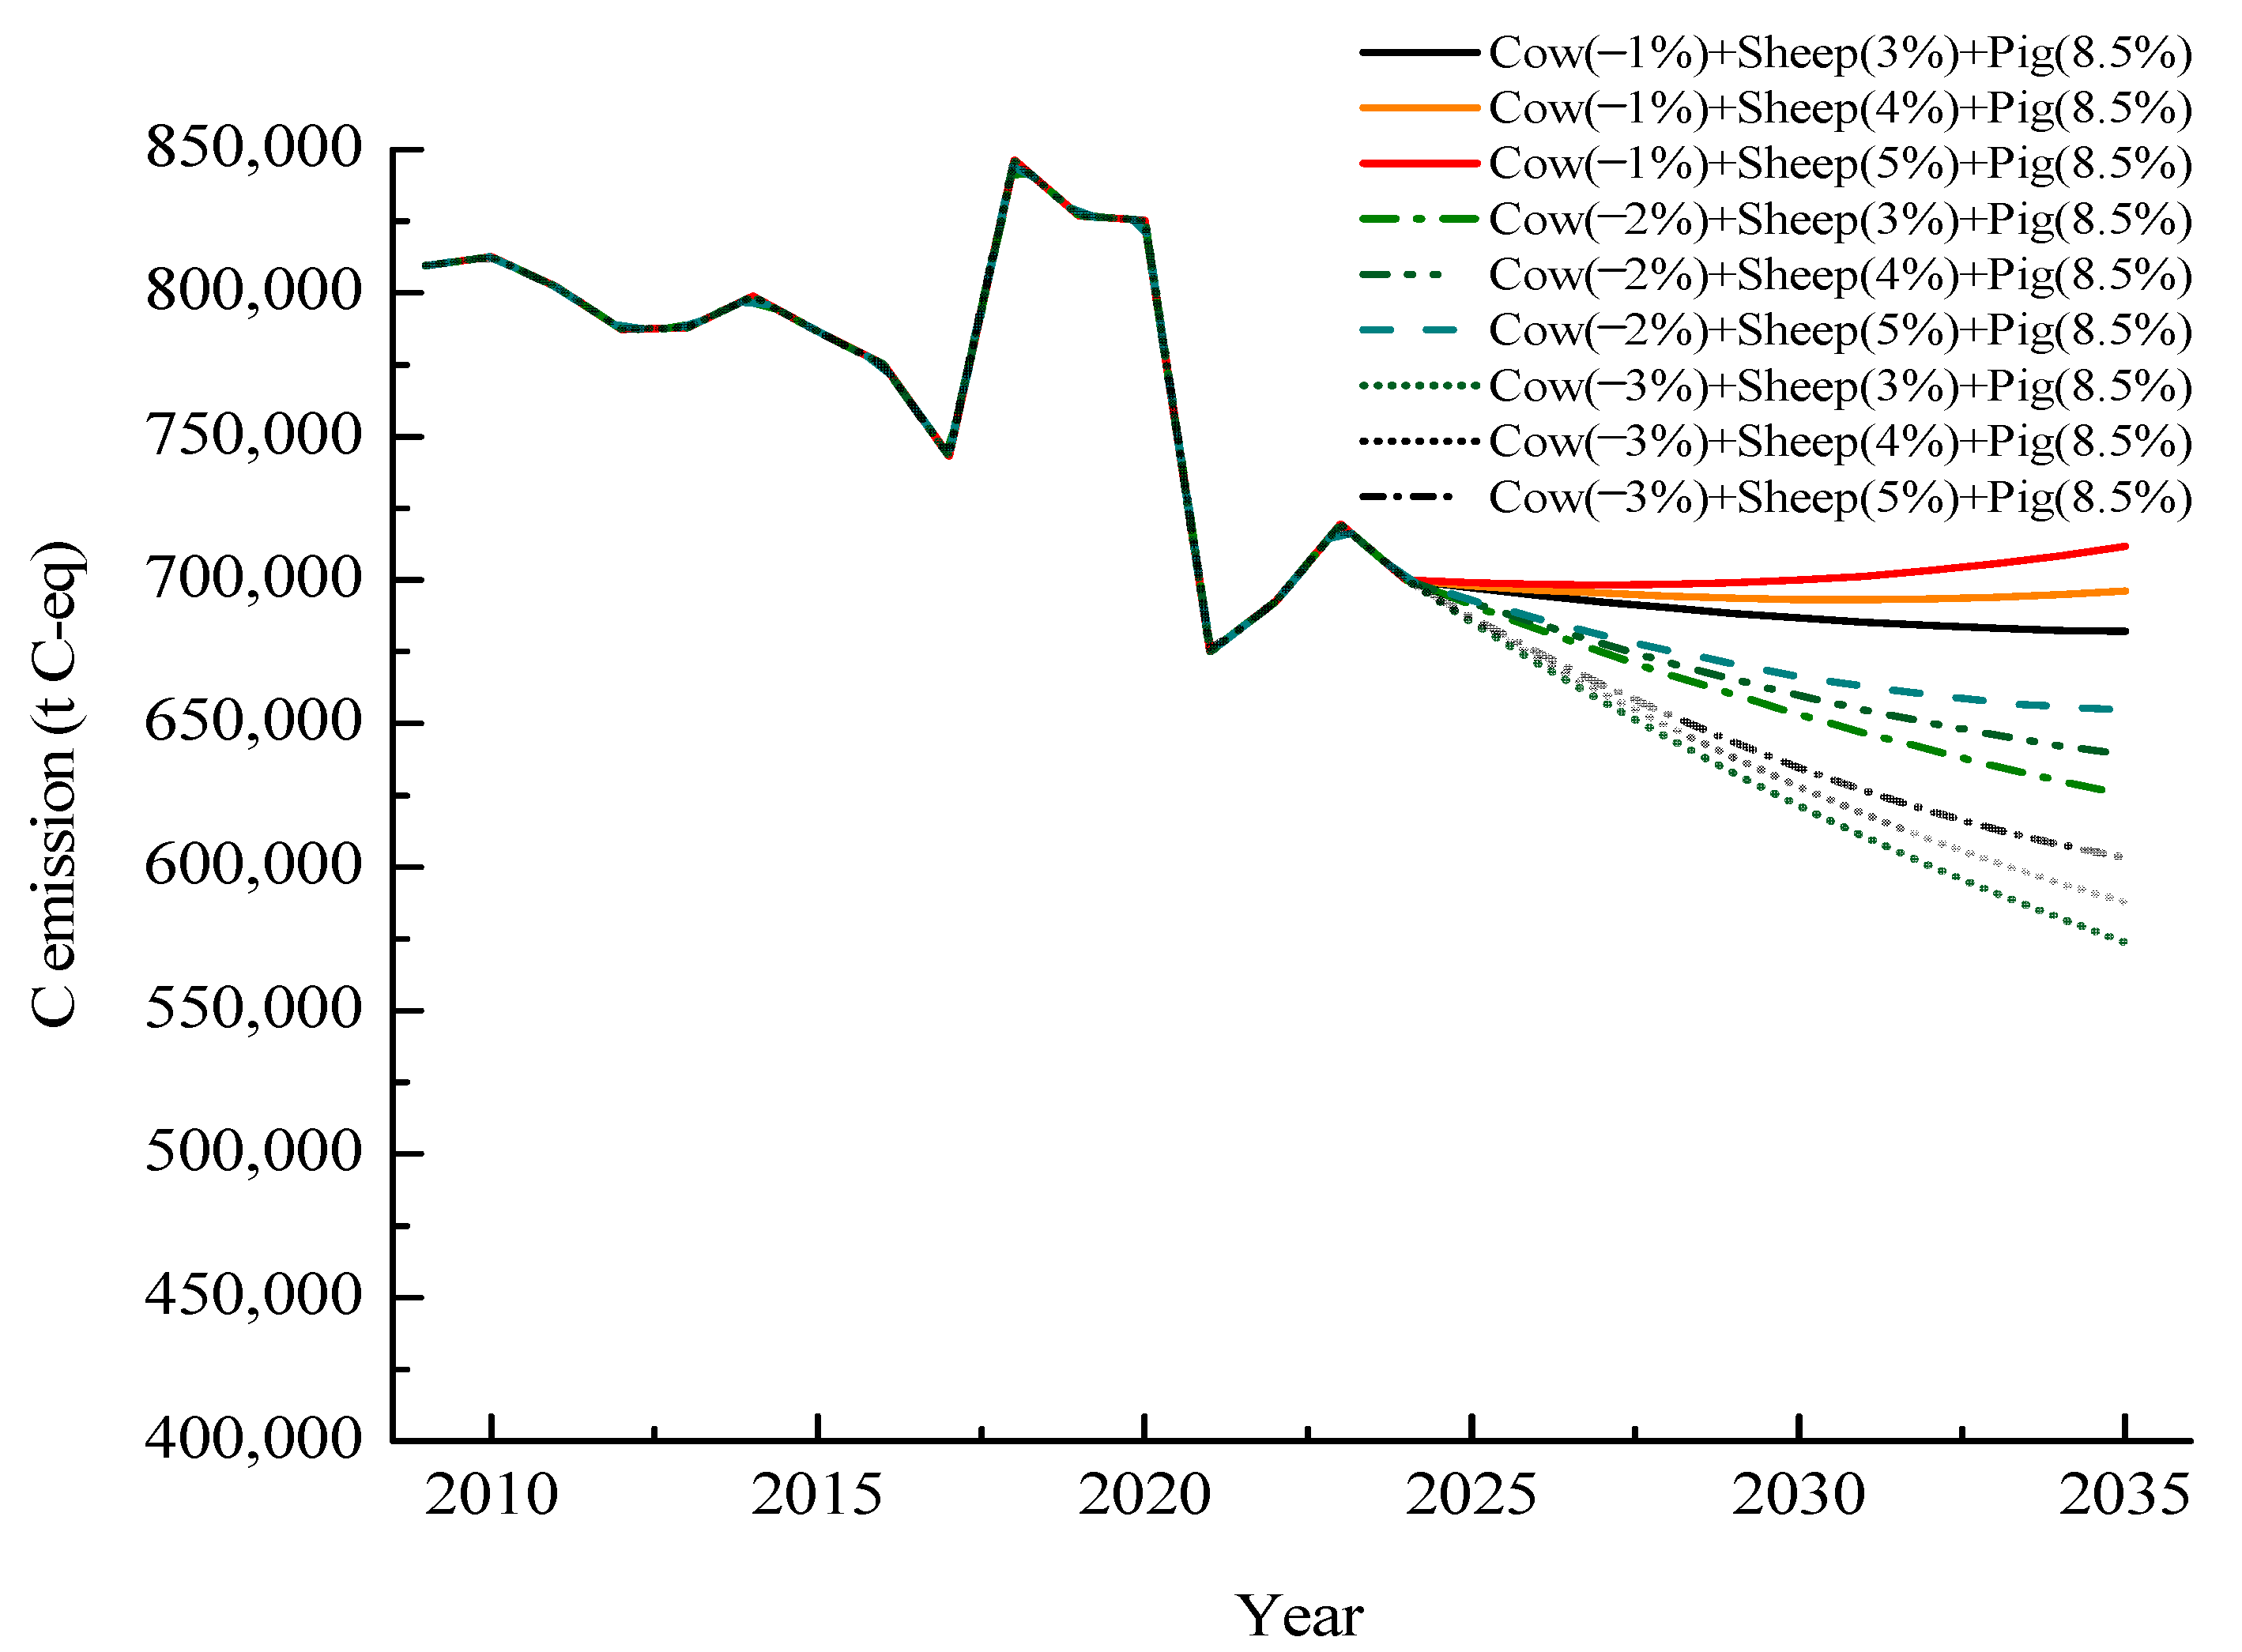
5. Prediction
6. Conclusions
Supplementary Materials
Author Contributions
Funding
Institutional Review Board Statement
Data Availability Statement
Acknowledgments
Conflicts of Interest
Correction Statement
References
- Bhatti, U.A.; Bhatti, M.A.; Tang, H.; Syam, M.S.; Awwad, E.M.; Sharaf, M.; Ghadi, Y.Y. Global production patterns: Understanding the relationship between greenhouse gas emissions, agriculture greening and climate variability. Environ. Res. 2024, 245, 118049. [Google Scholar] [CrossRef] [PubMed]
- Anderegg, W.R.; Trugman, A.T.; Badgley, G.; Anderson, C.M.; Bartuska, A.; Ciais, P. Climate-driven risks to the climate mitigation potential of forests. Science 2020, 368, eaaz7005. [Google Scholar] [CrossRef]
- The World Bank. Total Greenhouse Gas Emissions Excluding LULUCF (Mt CO2e). Available online: https://data.worldbank.org/indicator/EN.GHG.ALL.MT.CE.AR5 (accessed on 28 November 2024).
- FAOSTAT (The Food and Agriculture Organization of the United Nation). Emissions Totals. Available online: https://www.fao.org/faostat/en/#data/GT/visualize (accessed on 29 November 2024).
- Herrero, M.; Henderson, B.; Havlík, P.; Thornton, P.K.; Conant, R.T.; Smith, P.; Wirsenius, S.; Hristov, A.N.; Gerber, P.; Gill, M.; et al. Greenhouse gas mitigation potentials in the livestock sector. Nat. Clim. Change 2016, 6, 452–461. [Google Scholar] [CrossRef]
- IPCC (Intergovernmental Panel on Climate Change). Climate Change 2022: Impacts, Adaptation, and Vulnerability. Contribution of Working Group II to the Sixth Assessment Report of the Intergovernmental Panel on Climate Chang; Pörtner, D.C., Roberts, M., Tignor, E.S., Poloczanska, K., Mintenbeck, A., Alegría, M., Craig, S., Langsdorf, S., Löschke, V., Möller, A., et al., Eds.; Cambridge University Press: Cambridge, UK; New York, NY, USA, 2022; p. 3056. Available online: https://www.ipcc.ch/report/ar6/wg2/ (accessed on 8 October 2024).
- Zhang, X.; Sun, S.H.; Yao, S.B. Influencing factors and spatiotemporal heterogeneity of livestock greenhouse gas emission: Evidence from the Yellow River Basin of China. J. Environ. Manag. 2024, 358, 120788. [Google Scholar] [CrossRef] [PubMed]
- Ma, Y.F.; Hou, Y.; Dong, P.B.; Velthof, G.L.; Long, W.T.; Ma, L.; Ma, W.Q.; Jiang, R.F.; Oenema, O. Cooperation between specialized livestock and crop farms can reduce environmental footprints and increase net profits in livestock production. J. Environ. Manag. 2022, 302, 113960. [Google Scholar] [CrossRef]
- Du, Y.; Ge, Y.; Ren, Y.; Fan, X.; Pan, K.; Lin, L.; Wu, X.; Min, Y.; Meyerson, L.A.; Heino, M.; et al. A global strategy to mitigate the environmental impact of China’s ruminant consumption boom. Nat. Commun. 2018, 9, 4133. [Google Scholar] [CrossRef]
- Yang, W.; Zhang, W.F.; Xing, J.H.; Zheng, Y.Y.; Yabar, H.; Song, J.N. Contributions of a mitigation measure portfolio to directing Chinese crop-livestock production system towards net-zero emissions. Sustain. Prod. Consum. 2025, 56, 112–127. [Google Scholar] [CrossRef]
- Pei, X.D.; Li, J.H.; Zhou, L.H.; Wang, Y.; Shi, G.; Zhang, C.; Yang, J. Spatiotemporal characteristics and influencing factors of non-CO2 greenhouse gas emission intensity from China’s livestock sector. Sci. Total Environ. 2025, 958, 178191. [Google Scholar] [CrossRef]
- Wang, R.; Bai, Z.; Chang, J.; Li, Q.; Hristov, A.; Smith, P.; Yin, Y.; Tan, Z.; Wang, M. China’s low-emission pathways toward climate-neutral livestock production for animal-derived foods. Innovation 2022, 3, 100220. [Google Scholar] [CrossRef]
- He, D.W.; Deng, X.Z.; Wang, X.S.; Zhang, F. Livestock greenhouse gas emission and mitigation potential in China. J. Environ. Manag. 2023, 348, 119494. [Google Scholar] [CrossRef]
- Li, M.Q.; Liu, S.L.; Sun, Y.X.; Liu, Y.X. Agriculture and animal husbandry increased carbon footprint on the Qinghai-Tibet Plateau during past three decades. J. Clean. Prod. 2021, 278, 123963. [Google Scholar] [CrossRef]
- Caro, D.; Davis, S.J.; Bastianoni, S.; Ken, C. Global and regional trends in greenhouse gas emissions from livestock. Clim. Change 2014, 126, 203–216. [Google Scholar] [CrossRef]
- Jin, G.; Guo, B.; Deng, X. Is there a decoupling relationship between CO2 emission reduction and poverty alleviation in China? Technol. Forecast. Soc. Change 2020, 151, 119856. [Google Scholar] [CrossRef]
- Tian, P.P.; Li, D.; Lu, H.W.; Feng, S.S.; Nie, Q.W. Trends, distribution, and impact factors of carbon footprints of main grains production in China. J. Clean. Prod. 2021, 278, 123347. [Google Scholar] [CrossRef]
- Cui, Y.; Khan, S.U.; Deng, Y.; Zhao, M.J.; Hou, M.Y. Environmental improvement value of agricultural carbon reduction and its spatiotemporal dynamic evolution: Evidence from China. Sci. Total Environ. 2021, 754, 142170. [Google Scholar] [CrossRef]
- Wang, J.X.; Chang, G.H.; Liu, H.; Yin, Z.X.; Liu, P.L.; Zhao, Y.L.; Li, K.M.; Gao, T.P. Carbon balance analysis of agricultural production systems in oasis areas. Sci. Rep. 2024, 14, 16698. [Google Scholar] [CrossRef]
- Wu, C.X.; Xie, J.Z.; Bao, Q.; Lei, Y.Q. The analysis of land use change in Gannan Prefecture from 1990–2022. J. Gansu For. Sci. Tech. 2024, 49, 19–25. [Google Scholar]
- Gannan Tibetan Autonomous Prefecture Bureau of Statistics and National Bureau of Statistics Gannan Survey Team. Gannan Statistical Yearbook 2009–2024. Available online: http://www.gnzrmzf.gov.cn/zfxxgk/fdzdgknr1/tjxx/tjnj2.htm (accessed on 25 March 2025).
- IPCC (Intergovernmental Panel on Climate Change). Agriculture, forestry and other land use. In Guidelines for National Greenhouse Gas Inventories; Paustian, K., Ravindranath, N.H., Amstel, A.V., Gytarsky, M., Kurz, W.A., Ogle, S., Richards, G., Somogyi, Z., Eds.; Bibliogov: Asheville, NC, USA, 2006; Available online: https://www.ipcc-nggip.iges.or.jp/public/2006gl/pdf/4_Volume4/V4_01_Ch1_Introduction.pdf (accessed on 28 November 2024).
- IPCC (Intergovernmental Panel on Climate Change). Climate Change 2022: Mitigation of Climate Change. Contribution of Working Group III to the Sixth Assessment Report of the Intergovernmental Panel on Climate Change; Shukla, P.R., Skea, J., Slade, R., Al Khourdajie, A., van Diemen, R., McCollum, D., Pathak, M., Some, S., Vyas, P., Fradera, R., et al., Eds.; Chapter 7: Agriculture, forestry and other land uses (AFOLU); Cambridge University Press: Cambridge, UK, 2022; Available online: https://www.ipcc.ch/report/ar6/wg3/downloads/report/IPCC_AR6_WGIII_Chapter_07.pdf (accessed on 10 November 2024).
- Piao, S.L.; Fang, J.Y.; He, J.S.; Xiao, Y. Spatial distribution of grassland biomass in China. Acta Phytoecol. Sin. 2004, 28, 491–498. (In Chinese) [Google Scholar]
- Gannan Tibetan Autonomous Prefecture Ecology and Environment Bureau. Significant Progress in Strengthening Ecological Protection and Construction in Our Prefecture. 2025. Available online: http://sthj.gnzrmzf.gov.cn/info/1076/4393.htm (accessed on 28 November 2024).
- Yang, S.; Wen, L.; Zhang, A. The spatiotemporal response of land-use carbon emissions to climate change. Ecol. Indic. 2025, 170, 112893. [Google Scholar] [CrossRef]
- Niu, X.; He, M.; Zhang, Y.; Luan, Z. A study on the relationship between livestock carbon emission and economic growth in Inner Mongolia. Sustainability 2024, 16, 10180. [Google Scholar] [CrossRef]
- Xu, P.; Liao, Y.J.; Zheng, Y.; Zhao, C.X.; Zhang, X.F.; Zheng, Z.H.; Luan, S.J. Northward shift of historical methane emission hotspots from the livestock sector in China and assessment of potential mitigation options. Agric. For. Meteorol. 2019, 272, 1–11. [Google Scholar] [CrossRef]
- Wang, W.; Deng, X.; Wang, Y. Changes in Non-CO2 Greenhouse gas emissions from livestock production, meat consumption and trade in China. Sustain. Prod. Consum. 2023, 42, 281–291. [Google Scholar] [CrossRef]
- Li, X.; Pan, D.R.; Sun, B.; Jiang, J.C.; Yu, H.Y.; Wang, H.X.; Du, X.C.; Wu, D.D. Analysis of grassland degradation in Gansu Province based on two grassland surveys. Pratacultural Sci. 2022, 39, 85–494. [Google Scholar] [CrossRef]
- Gannan Forestry and Grassland Bureau. Grassland Management Measures in Gannan, Gansu Province. Available online: http://lycy.gnzrmzf.gov.cn/info/1174/6626.htm (accessed on 25 March 2025).
- Gannan Forestry and Grassland Bureau. Explanation on the Revised Grassland Management Measures of Gannan Tibetan Autonomous Prefecture, Gansu Province. Available online: http://lycy.gnzrmzf.gov.cn/info/1175/6628.htm (accessed on 25 March 2025).
- Gannan Forestry and Grassland Bureau. Regulations on Grass and Livestock Balance in Gannan Tibetan Autonomous Prefecture. Available online: http://lycy.gnzrmzf.gov.cn/info/1109/6965.htm (accessed on 25 March 2025).
- General Office of the People’s Government of Gansu Province. Gansu Provincial People’s Government Office Circular on Implementing the Policy Plan for Grassland Ecological Protection Subsidy and Incentive Mechanism. Available online: https://www.gsei.com.cn/html/1275/2011-09-29/content-58704.html (accessed on 27 October 2024).
- Gansu Provincial Forestry and Grassland Administration. Grassland Comprehensive Vegetation Coverage Increased to 97.14%: Significant Improvement in Grassland Ecology in Gannan. Available online: https://lycy.gansu.gov.cn/lycy/c105793/202501/174057213.shtml (accessed on 25 March 2025).
- NY/T 635—200; Calculation of Proper Carrying Capacity of Rangelands. China Agriculture Press: Beijing, China, 2002.
- National Forestry and Grassland Administration Government Website Gannan: Scientific Afforestation Enhances Grassland Ecological Functions. Available online: https://www.forestry.gov.cn/c/www/zhzs/516286.jhtml (accessed on 25 March 2025).
- Zhang, C.; Yan, H.M.; Yao, X.J. Dynamic assessment of grass-livestock balance in Gannan. J. Nat. Resour. 2022, 37, 1903–1917. [Google Scholar] [CrossRef]
- Chen, M.P.; Chen, M.P.; Cui, Y.R.; Jiang, S.; Forsell, N. Toward carbon neutrality before 2060: Trajectory and technical mitigation potential of non-CO2 greenhouse gas emissions from Chinese agriculture. J. Clean. Prod. 2022, 368, 133186. [Google Scholar] [CrossRef]
- Huang, S.; Ghazali, S.; Azadi, H.; Moghaddam, S.M.; Viira, A.H.; Janečková, K.; Sklenička, P.; Lopez-Carr, D.; Köhl, M.; Kurban, A. Contribution of agricultural land conversion to global GHG emissions: A meta-analysis. Sci. Total Environ. 2023, 876, 162269. [Google Scholar] [CrossRef]
- Kay, S.; Rega, C.; Moreno, G.; Herder, M.; Palma, J.H.N.; Borek, R.; Crous-Duran, J.; Freese, D.; Giannitsopoulos, M.; Graves, A.; et al. Agroforestry creates carbon sinks whilst enhancing the environment in agricultural landscapes in Europe. Land Use Policy 2019, 83, 581–593. [Google Scholar] [CrossRef]
- Hang, S.; Xu, Y.; Lyu, Y.; Gong, H.; Li, J. Expanding supporting land to reduce greenhouse gas emissions from livestock farms: Case studies in northern China. J. Clean. Prod. 2024, 467, 142784. [Google Scholar] [CrossRef]


Disclaimer/Publisher’s Note: The statements, opinions and data contained in all publications are solely those of the individual author(s) and contributor(s) and not of MDPI and/or the editor(s). MDPI and/or the editor(s) disclaim responsibility for any injury to people or property resulting from any ideas, methods, instructions or products referred to in the content. |
© 2025 by the authors. Licensee MDPI, Basel, Switzerland. This article is an open access article distributed under the terms and conditions of the Creative Commons Attribution (CC BY) license (https://creativecommons.org/licenses/by/4.0/).
Share and Cite
Chang, G.; Wang, J.; Liu, P.; Wang, Q.; Han, F.; Wang, C.; Sumpradit, T.; Gao, T. Key Influencing Factors in the Variation in Livestock Carbon Emissions in the Grassland Region of Gannan Prefecture, China (2009–2024). Agriculture 2025, 15, 1300. https://doi.org/10.3390/agriculture15121300
Chang G, Wang J, Liu P, Wang Q, Han F, Wang C, Sumpradit T, Gao T. Key Influencing Factors in the Variation in Livestock Carbon Emissions in the Grassland Region of Gannan Prefecture, China (2009–2024). Agriculture. 2025; 15(12):1300. https://doi.org/10.3390/agriculture15121300
Chicago/Turabian StyleChang, Guohua, Jinxiang Wang, Panliang Liu, Qi Wang, Fanxiang Han, Chao Wang, Tawatchai Sumpradit, and Tianpeng Gao. 2025. "Key Influencing Factors in the Variation in Livestock Carbon Emissions in the Grassland Region of Gannan Prefecture, China (2009–2024)" Agriculture 15, no. 12: 1300. https://doi.org/10.3390/agriculture15121300
APA StyleChang, G., Wang, J., Liu, P., Wang, Q., Han, F., Wang, C., Sumpradit, T., & Gao, T. (2025). Key Influencing Factors in the Variation in Livestock Carbon Emissions in the Grassland Region of Gannan Prefecture, China (2009–2024). Agriculture, 15(12), 1300. https://doi.org/10.3390/agriculture15121300