Article

The Influence of Weather Conditions and Available Soil Water on Vitis vinifera L. Albillo Mayor in Ribera del Duero DO (Spain) and Potential Changes Under Climate Change: A Preliminary Analysis

by
María Concepción Ramos
Department of Chemistry, Physics and Environmental and Soil Sciences, UdL-Agrotecnio CERCA Center, Av. Rovira Roure 191, 25198 Lleida, Spain
Agriculture 2025, 15(11), 1229; https://doi.org/10.3390/agriculture15111229
Submission received: 2 May 2025 / Revised: 28 May 2025 / Accepted: 30 May 2025 / Published: 4 June 2025
(This article belongs to the Special Issue Sustainable Viticulture for Climate Change Adaptation)

Abstract

Climate variability and trends are of increasing concern in grape-growing areas, although each cultivar can respond differently. In order to establish appropriate adaptation measures, it is necessary to know the relationship between climate variables and grape composition for each cultivar. This research attempts to provide information in this regard for the Albillo Mayor variety grown in the Ribera del Duero DO (Spain) and its potential changes under the shared socioeconomic pathways (SSPs) that lead to different radiative forcing targets. The response of this variety was evaluated in two plots during five seasons (2020–2024). For each year, the phenological dates and grape composition (berry weight, pH, titratable acidity, malic acid, alcoholic content, and the total polyphenol index) were evaluated and related to climate variables including maximum and minimum temperature and precipitation and the resulting water availability averaged over different periods within the growing season. Maximum and minimum temperatures in the pre-veraison period led to lower titratable acidity and malic acid, which, in addition, were favored by lower water availability in the same period. These conditions, on the contrary, led to an increase in the probable alcoholic degree, which is associated with a decrease in berry size. In addition, more available water during the ripening period increases the berry weight, which was also negatively affected by the difference between the maximum and minimum temperature in the same period. By 2050, with the predicted decrease in precipitation and increase in temperature, Albillo Mayor may undergo a decrease in acidity >14% and an increase in the probable alcoholic degree of about 5% in the SSP2-4.5 scenario (energy-balanced development, leading to a radiative forcing of 4.5 Wm−2), while changes could be up to 1.5 and 1.1 times greater, respectively, in the SSP5-8.5 scenario (heavily reliant in fossil-fueled development, leading to a radiative forcing of 8.5 Wm−2).

1. Introduction

The threat of climate change on viticulture is becoming of serious concern in viticultural areas. An increase in temperature and water scarcity can compromise not only production but also grape quality [1,2,3,4]. Vine-growers focus the interest especially on the native varieties and the those cultivated for centuries in a given area.
The Ribera del Duero Designation of Origin (Ribera del Duero DO) is known around the world by its red wines, in which the Tempranillo variety accounts for more than 90% of the cultivated surface. However, other varieties have also been traditionally grown in the area, and their interest in them seems to be increasing at present. This is the case of the white variety Albillo Mayor, cultivated in the area from the Middle Ages, which has been considered as a useful variety to prepare both young and aged wines, including rosé and white wines. Although it is a minority variety worldwide (24th in the ranking) [5] and represents only about 1.5% of the vineyard surface in the study area, it accounts for about 30% of the word surface occupied by this variety [5]. Interest in this variety in the area has increased in recent years (https://www.riberadelduero.es/mx/sites/default/files/2020-09/dossier_de_prensa_la_ribera_blanca.pdf, accessed on 15 Mach 2025), with most of the old vines (more than 50 years old) being maintained and complemented with new plantings. This white variety grows well in temperate climates and well-drained soils. The berries are spherical and small, with fine pale golden skins and colorless flesh. Albillo Mayor grapes produce fruity straw-yellow musts, with flavors ranging from fresh citrus to floral notes with balanced acidity, which brings complexity to the wines in which it is used.
It has been indicated that varieties with early phenological timing may be more affected that those with late phenology. In this sense, red varieties such as Tempranillo, with early phenology, may suffer from greater effects as has been indicated in previous research related to this variety in different vine-growing zones [2,3,6,7,8]. Similarly, some white varieties, which also tend to have an early phenology, could be among the varieties that may suffer from the effect of increased temperatures as denoted by research related to Albariño, Chardonnay, Macabeo, Müller-Thurgau, Riesling, Sauvignon Blanc, or Verdejo, among others [9,10,11,12]. However, there is no information on the direct effect of temperature and water availability on Albillo Mayor, which is a variety cultivated for centuries and to be maintained in the Ribera del Duero DO. To deepen this knowledge, the present research was carried out in that winegrowing area, as a preliminary study, referring to phenology and some parameters of grape composition. The phenology (budbreak (B), flowering (FL), veraison (V) and maturity (Mat)) and grape composition (berry weight (BW), sugar content-expressed as probable alcoholic degree (PVAD), titratable acidity (TAc), malic acid (MAc), pH, and the total polyphenol index (TPI)) were evaluated during five growing seasons (years from 2000 to 2024) and related to climate variables, defined for different periods within the growing cycle. Based on these relationships and the expected changes in climatic conditions associated with the projected climate change scenarios, the potential changes for the Albillo Mayor grapes cultivated in the Ribera del Duero DO were assessed. Different shared socioeconomic pathways (SSPs) were considered, which refer to the future development of the society and the use of fossil fuels: SSP2-4.5, which refers to a balanced energy development pathway, with intermediate greenhouse emissions, following the current development patterns and leading to a radiative forcing target of 4.5 Wm−2 by 2100; and SSP5-8.5, a scenario heavily reliant on fossil fuel development and increasing competitive markets, leading to a radiative forcing target of 8.5 Wm−2 by 2100, implying many challenges to mitigation and few challenges to adaptation.

2. Materials and Methods

Grapevine Data and Environmental Conditions

The research was conducted in the Ribera del Duero DO, Spain (Figure 1), in two plots located, respectively, at 915 and 920 m above the sea level (a.s.l.), planted with Albillo Mayor (an old vineyard conducted in goblet (G) and a young vineyard conducted in trellis (T) trained in double cordon). The planting density was 2200 vines/ha with distances between plants of 3 m × 1.2 m. Edaphological information was taken from the soil map of the Ribera del Duero DO [13] and soil profile data provided by the ITACYL. The main soil types are calcic Haploxeralf, Calcexerolic Xerochrept, and Fluventic Xerochrept, with loam and clay-loam textures. The characteristics of the soils of both plots are shown in Table 1.
The meteorological characteristics referred to maximum and minimum daily temperature, precipitation and estimated potential evapotranspiration for the period Oct/1999-Oct/2024 were taken from meteorological stations nearest to the plots (ITACYL (ftp://ftp.itacyl.es, accessed on 30 October 2024) and AEMET (www.aemet.es/es/idi/clima/registros_climaticos, accessed on 5 November 2024)). For each year, the average values referring to the growing season and to different periods between the phenological events were calculated, as well as the bioclimatic indices of Winkler and Hugling [14,15]. In addition, for each year and plot, a soil water balance was performed to evaluate the available soil water (ASW) in each period. The balance was performed using the Vineyard Soil Irrigation Model (VSIM) (https://sites.google.com/a/csumb.edu/vsim/, accessed on 14 October 2024), which had been used and calibrated for this purpose in previous research [16]. In addition, projected changes in temperature and precipitation for the study area under the SSP2-4.5 and SSP5-8.5 scenarios were downloaded from the AEMET (simulation with the AR6 ensemble of models https://www.aemet.es/es/serviciosclimaticos/cambio_climat, accessed on 5 March 2025) to assess the possible changes in the development of the variety analyzed.
Grapevine phenology, referring to the phenological stages of budbreak (B), flowering (FL) and version (V) (stages C, I and M according to Baillod and Bagiollini [17]), was analyzed in each plot for the five seasons recorded in the years from 2020 to 2024. Grape composition regarding berry weight (BW), probable volumetric alcoholic degree (PVAD), titratable acidity (TAc), malic acid (MAc), pH, and total polyphenol index (TPI) were analyzed at various dates during ripening until harvest. All analyses were performed following the methods recommended by the OIV [18] (berry weight refers to the weight of 100 berries randomly picked at different positions on the vine; the alcoholic degree was measured by refractometry-OIV-MA-AS312-01B; TAc by titration-OIV-MA-AS313-0; MAc by colorimetry-OIV-MA-AS313-10; pH by potentiometry-OIV-MA-AS313-15; and TPI was obtained by measuring the absorbance at 280 nm). The information was supplied by the Consejo Regulador of the Ribera del Duero DO. The maturity date was set according to acidity and the probable alcoholic degree (TAc around 7 g/L and PVAD around 12 °B were considered to make comparable the results) and it was used to analyze the variability in the maturity dates with climatic conditions. The values recorded at harvest were considered in the evaluation of the effect of climatic conditions on grape composition.
The relationship between grapevine phenology and grape composition with climate variables and available soil water was assessed by Principal Component Analysis (PCA) followed by varimax rotation. The loading matrix was then analyzed to extract information on the variables that had the greatest effect on each grape parameter. In addition, a stepwise multiple regression analysis was performed with the variables that showed a significant influence to evaluate changes in possible climate change scenarios.

3. Results

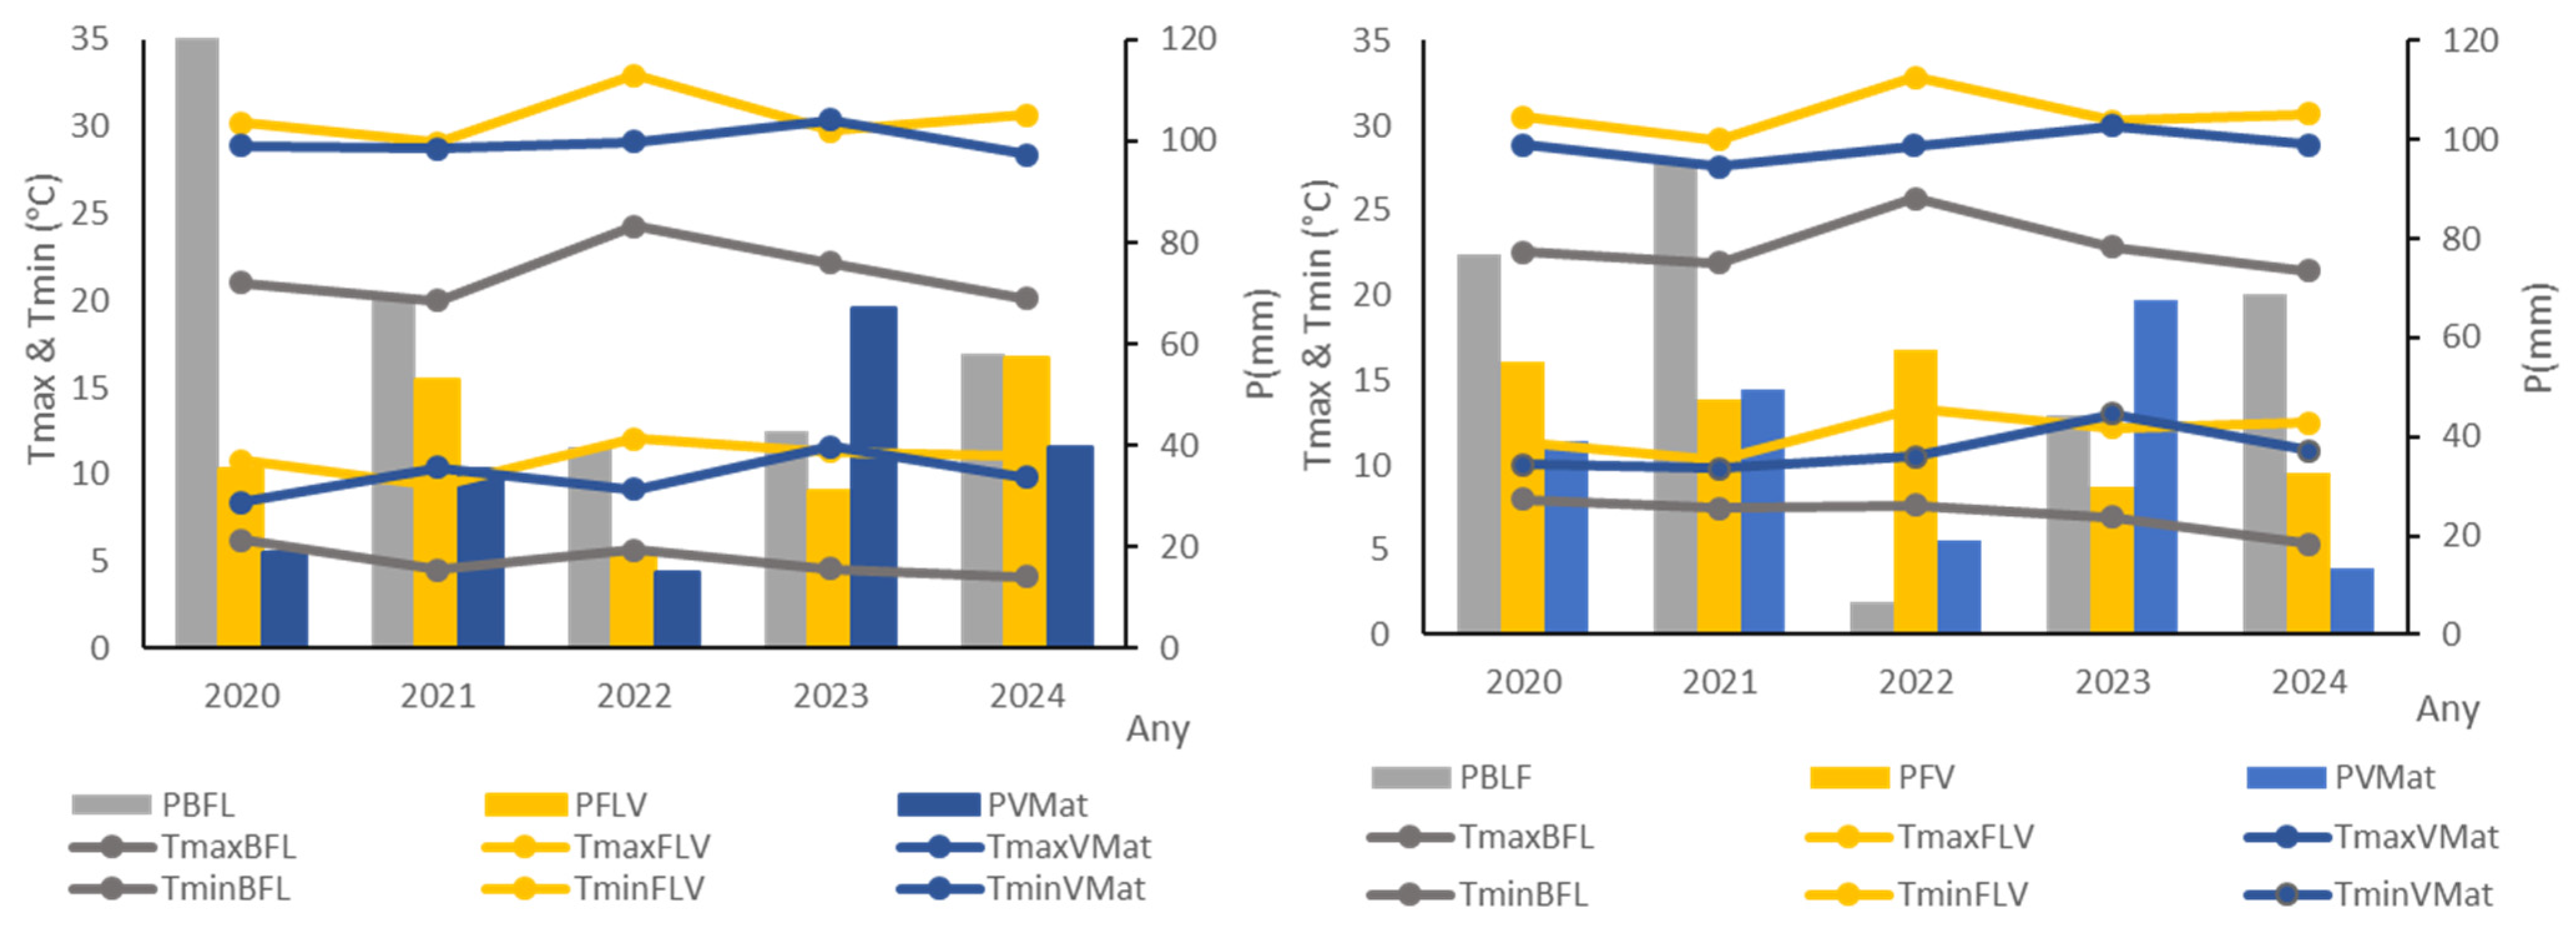
3.1. Meteorological Conditions During the Growing Seasons Analyzed

Table 2 summarizes the climatic characteristics of the growing seasons analyzed in both locations. The average temperature of the growing season ranged between 17.1 and 19.7 °C in P1 and between 17.8 and 20.6 °C in P2, with differences in the average maximum and minimum temperatures of more than 3.4 and 1.5 °C, respectively. Precipitation in the hydrological year ranged between 285 and 599 mm in P1 and between 329 and 488 mm in P2, with around 31.5% of the total falling in the growing season. The driest and warmest year was 2022, while the wettest and coolest was 2020, although growing season precipitation differed between plots. WI ranged from 1227 to 1597 GDD in P1 and from 1291 to 1662 GDD in P2, while HI ranged between 2017 and 2412 GDD in P1 and between 2044 and 2460 GDD in P2. The differences in the values of these indices between years corroborated the variability in the temperature recorded during the period analyzed. According to WI index, in the coolest years, the study area was located within the Region Ib, while in the warmest year moved to Region III. According to the HI index, the cold years can be classified as warm template, while the hottest can be classified as warm.
Figure 2 shows the projected average changes in temperature and precipitation in the study area under the SSP2-4.5 and SSP5-8.5 scenarios for the months that cover the growing season. In the SSP2-4.5 emission scenario, Tmax is projected to increase by 2050 relative to present by about 1.3 °C for BBL, 1.7 °C for FLV, and 1.5 °C for VMat, while for Tmin, the projected increase is about 1.0 °C for BBL, 1.3 °C for FLV, and 0.9 °C for VMat. In the SSP5-8.5 emission scenario, the changes could be 1.8 and 1.4 °C for BFL, 2.2 and 1.9 °C for FLV, and 1.7 and 1.4 °C for VMat periods, respectively, for Tmax and Tmin. In addition, the decrease in precipitation for the respective phenological periods could be 7.5, 7.1, and 5.4 mm in the SSP2-4.5 scenario, 12.0, 13.5, and 4.3 mm in the SSP5-8.5 scenario, respectively, for each period.

3.2. Vine Phenology and Grape Composition

Figure 3 shows the average phenological dates and their variability during the study periods. Budbreak occurred on average on April 17 and 24, respectively, in P1 and P2. Flowering and veraison took place, respectively, on June 9 to11 and August 9 to 10, and the greatest differences between years were found for the date when maturity was reached (between September 1 and 19 in P1 and between September 1 and 23 in P2). The variability in the phenological dates agreed with the observed differences in climatic variables. The earliest budbreak occurred in 2023 and 2024, while flowering and veraison were earlier in 2022 and 2023, although there were differences between plots. The earliest harvest took place in 2022 in both vineyards.
The composition of the grapes at harvest in the years analyzed is shown in Table 3. Unlike the case of phenological analysis, for which data were taken at maturity based on certain acidity and alcohol thresholds, here the data were taken on the date of harvest to avoid having constant values of acidity or alcohol content in all years that would make it impossible to evaluate the effect of temperature or available water on these grape parameters. Berry weight was higher in P2 than in P1, with the highest values in 2024 and the lowest in 2022. Titratable acidity was higher in P1 than in P2, while no differences were found for MAc, on average, between plots. Nevertheless, differences were observed between years, with TAc and MAc lowest in 2022 and highest in 2021, particularly in plot P1. In 2024, MAc was also higher than the average. As for PVAD, the highest values were recorded in 2022, while the lowest were recorded in the years 2021 and 2023 in both plots, and in 2024 in plot P2. The higher value could be a consequence of the drier and hotter conditions, which, as mentioned above, resulted in lower berry weight. As for TPI, the lowest values were recorded in 2022 and 2024 in both plots, while the relatively higher values were recorded in 2021 and 2023.
Since differences were found between plots and not all variations in grape parameters between the different years analyzed could be explained by the average values of temperatures and precipitation recorded in the growing season, the analysis was applied considering their values referred to different periods between phenological events (budbreak-flowering (BFL), flowering-veraison (FLV), veraison-maturity (VMat)), as well as the effect of the soil characteristics on the amount of water available to the plant. The average temperature and precipitation in the different periods are shown in Figure 4. The evolution of ASW during the growing season in each year is shown in Figure 5. The average ASW between phenological events was assessed and used together with the rest of climatic variables related to temperature in the analysis of the variability of grape composition.

3.3. Grape Composition—Climate Relationship

The results of the PCA performed on grape composition, climate variables and available soil water referring to different periods between phenological events are shown in Table 4 and Figure 6. Four components explaining 90.02% of the variance were retained. The loadings matrix values confirmed the relationship between grape composition and temperature and water availability in different periods. Thus, the negative effect of higher pre-veraison minimum and maximum temperatures as well as the positive effect of higher available soil water content in the same period and before flowering on acidity was confirmed in PC1, which described 39.81% of the variance. Both TAc and MAc responded in the same direction. Moreover, TAc was also positively affected by the differences between maximum and minimum temperature during ripening, while the opposite was found for MAc (PC2). ASW in the pre-veraison period favored TAc and MAc contents, while during the ripening period (VMat) it seemed to affect both TAc and MAc differently (PC2). For pH, the opposite results were observed, with its highest loadings appearing also in PC1. On the contrary, for sugar content represented by the PVAD, the increase in available soil water and the decrease in temperatures before veraison led to lower PVAD and higher TPI (PC1), while during ripening led to lower PVAD. In addition, a positive effect of the differences between maximum and minimum temperature during ripening on PVAD was confirmed in PC2, which described 27.65% of the variance. For TPI, however, despite what was mentioned about the relationships observed in PC1, it also appeared with high loading in PC4 that described 7.56% of the variance, with not significant relations with other variables. Regarding BW, an increase in BW with available water in the ripening period was confirmed, as well as a negative effect of the differences between maximum and minimum temperature during that period (PC2). The different sign in the loadings for BW and PVAD observed in PC2 can be justified by a dilution effect. The third component showed high loadings for some climate variables, but not for grape parameters.
Multiple regression analysis between grape parameters and the climatic variables that showed higher loadings in the PCA allows quantifying the effect of increasing temperatures and water availability, as well as estimating potential changes under future climate scenarios. The results of the regression analysis area are shown in Table 5

4. Discussion

4.1. Variability in Weather Conditions and Grapevine Response

The years included in the analysis differed in the average growing season temperature, as well as in the total amount and distribution of precipitation, with differences in the average temperature of up to 2.8 °C, and differences in the growing season precipitation that in some years were greater than 50% of the average growing season precipitation (Table 2). Thus, the results obtained in the five seasons analyzed have made it possible to extract information on the response of the Albillo Mayor variety under different climatic conditions and to confirm the impact that both temperature and water available have on the composition of the grape.
The extreme climatic conditions (hot and dry) recorded in 2022, led to earlier flowering, veraison, and ripening. The influence of high temperature on the advancement of phenology has been indicated by other authors [19,20,21,22]. Nevertheless, temperature may not be the only factor influencing phenology. In 2023, the earliest stages (bubdreak, flowering, and veraison) took place even earlier than in 2022. However, maturity was reached between 6 and 9 days later than in 2022. Given that temperatures in 2023 were high but lower than in 2022, the earlier timing could be justified by the drier conditions recorded during the dormancy and at the earliest stages and the wetter conditions that occurred in the ripening period in 2023. These findings of the effect of wetness on phenology coincide with those of Ramos et al. [23] for other varieties, who confirmed the effect of available water before the phenological event on the date on which it took place. In addition to the advancement of phenological dates, a shortening of the periods was also observed, with the greatest effect on the length of the BFL and VMat periods in 2022, which was about 14 and 13 days, respectively, shorter than in a wetter and cooler years (e.g., 2020), in agreement with that found by Cameron et al. [22].
Significant differences in grape composition were observed between the two plots for TAc and pH, with higher TAc and lower pH in the younger vine, while for MAc, the differences were not significant. In addition, berry weights were significantly lower in the younger vine. The differences were more pronounced in some years (e.g., 2020 or 2024), which could be related to differences not only in the weather condition but also to other plot factors that could be plot-specific, like the effect of the soil characteristics.

4.2. Influence of Climatic Variables on Grape Composition

The relationships between the different components of the berry and climatic variables provided information on the response of this variety and its possible changes to potential changes in temperature and precipitation, which could occur under climate change scenarios. Grape acidity, (both titratable acidity and malic acid) was sensitive to increasing temperatures, in agreement with Sadras et al. [24]. In the case study, it was observed that high temperature before veraison had a negative impact on titratable acidity and on malic acid, although the behavior of TAc and MAc was not exactly the same. In addition, the effect of temperature during ripening was opposite in TAc and MAc (Table 5). Although results using Tmax and Tmin during ripening separately were not shown, Tmax had no effect on acidity, but Tmin affected MAc positively and TAc negatively. Regarding the effect of temperature and acidity, Li et al. [25] reported that temperature had no significant effect on the content of TAc in nearly ripe berries, whereas TAc content in green berries was lower at high temperatures. However, Volschenk et al. [26] indicated that malic acid usually increased just before veraison, and Sweetman et al. [27] found a reduction in malate content when grapes were heated at veraison and ripening stages and in warm vintages. This is consistent with that observed in the warmest vintage (2022), where TAc and MAc were about 0.8 g/L lower than the average of the five years analyzed. Although the response to increasing temperatures depends on the cultivar, the results for Albillo Mayor found in this study follow a similar trend to those of other white cultivars such as Chardonnay or Semillon [24], and it can be concluded that the increase in minimum temperature and the smaller difference between maximum and minimum temperature were the factor that contributed most to reduce MAc.
In addition, soil water availability also influenced grape acidity (Table 5). In the study series, the driest year was also the hottest and was the vintage with the lowest acidity. However, comparing the rest of the years and both plots, the differences in TAc and MAc could be due not only to differences in temperature but also to water availability. Considering not only the growing season but also the accumulated reserve during the dormancy (considering the precipitation of the whole hydrological year), 2024 was the wettest year followed by 2020 and 2021, although 2024 had a drier growing season and 2020 the wettest. Within the growing season, in both 2020 and 2021, the wettest period was the budbreak to flowering period and the driest was ripening (Figure 4), which could explain the low berry weight in those years compared to 2024. However, acidity, which is more affected by water availability before veraison than during ripening, was higher in 2020 and 2021 than in 2024 (Table 3). In contrast, 2022 was the driest year and as discussed above, the year with the lowest acidity. In that case, both the flowering-veraison and veraison-maturity periods were very dry (< 20 mm in each period) (Figure 4), which contributed to the lowest TAc and MAc values. As already discussed, there were some differences between plots in acidity and berry weight, and the effect of water availability in the years in which the differences were higher (2020 and 2024) can be confirmed in Figure 3. Due to soil properties, the amount of water available in the period that had higher influence on acidity was greater in plot P1 than in plot P2.
Regarding polyphenols, although they are not usually analyzed in white varieties, they may be of interest [28] since phenolic compounds play important roles in plant metabolism and contribute to sensorial attributes, being also involved in different processes during the course of winemaking [29,30]. Among the phenolic compounds, different flavonols have been found in white varieties [30,31,32,33], their content being affected by environmental conditions. Some studies have pointed out that high temperatures during ripening decrease the expression of genes related to flavonoid synthesis but in addition, the concentration may be affected by differences in temperature between day and night [30]. Furthermore, under water deficit conditions, the concentration of phenolic compounds in grapes depends on the water status during the growing season [34]. The TPI analyzed in this case study and related to climate variables indicated that total polyphenol content in this variety can be affected by both increased temperatures, in particular, in the pre-veraison period, and by available water in the same period (Table 4 and Table 5). Nevertheless, the fact that in the case study, the TPI was isolated in PC4 and was not related to other variables, may indicate that other environmental variables not included in this analysis could be responsible for the changes. Sunlight has been indicated as one of the environmental factors that greatly influence flavonol biosynthesis in plants tissues [28,30,35] and in this respect, referring to a white variety, Williams et al. [28] found for Sauvignon Blanc an increase in flavonols under conditions of high light exposure compared to those of low exposure. It is also possible that the combined opposite effect of different variables masks their real impact.
Multiple regression analysis confirmed the difference in response of TAc and MAc with Tmax and Tmin. Tmax during the pre-veraison period affected both grape variables, with a decrease of 0.142 and 0.092 g/L, respectively, for TAc and MAc for a 1 °C increase during that period. But, during ripening, the effect of Tmax was much greater than that of Tmin, while the opposite was true for MAc. In addition, the effect of water availability during ripening seemed to affect TAc as well, producing a TAc decrease of 0.37 g/L in TAc for a 100 mm decrease in the ASW during ripening. At present, the variety analyzed has balanced acidity, but the expected decrease in precipitation and increase in temperature, especially during the warmer months, could result in significant reductions in acidity.

4.3. Projected Changes in Grape Composition Under Warming Scenarios

Table 6 summarizes the potential changes for Albillo Mayor variety grown in Ribera del Duero DO, based on the projected changes in climate and the relationships between climate variables and grape composition. Despite some differences in the climatic conditions between both plots analyzed, the projected changes were not significantly different. Therefore, an average value is given for the area. In relation to the analyzed period, a decrease in TAc and MAc may be expected, which could be on average for 2050, about 0.91 g/L and 0.30 g/L, respectively, for TAc and MAc in the SSP2.4.5 scenario, and about 1.35 and 0.40 g/L in the SSP5-8.5 scenario. Berry weight will also decrease, estimated at about 8 and 10.4 g/100 berries, depending on the scenario, and an average increase in PVAD of about 0.7 °B can be expected in the SSP2-4.5. In addition, the phenolic composition could also be negatively affected as denotes the reduction in the TPI. These results imply a decrease in titratable acidity by about 14.5% and a reduction of about 6% for berry weight in the SSP2-4.5 scenario, while the PVAD may increase associated with the decrease in berry size (by about 5%), and TPI may undergo a reduction of about 15%. Under the warmer conditions expected in the scenario SSP5-8.5, changes could be up to 1.5 times greater for TAc, and 1.3 times greater for MAc and for berry weight, while PVAD could be 1.1 times greater.
These projected changes are in agreement with the differences found in the most extreme conditions recorded in year 2022 relative to other years analyzed. The results referring acidity are in line with the decrease in titratable acidity found for other varieties in different winegrowing zones [11,36,37] or those projected for other white varieties by Neumann and Matzarakis [38] for the Baden and Wuerttemberg winegrowing districts as well as for the Bodensee area (0.5 to 2 g/L per 1 °C), although Barnuud et al. [39], for some regions in Australia, projected reductions in titratable acidity of up to 40% for Chardonnay. Similarly, the projected increase in PVAD associated with increased water stress leading to reduced berry weight is consistent with that observed for other white varieties related to temperature and precipitation during ripening [11,37]. Therefore, under the projected climatic conditions, adaptative measures such as reducing sun exposure and water requirements and delaying ripening [40,41,42,43,44,45] should have been adopted to maintain the sustainability of this variety in the area, as well as the production and quality of its grapes.

5. Conclusions

The analysis of the grapevine phenology and composition of the Albillo Mayo variety in Ribera del Duero DO, in a period that included years with extreme weather conditions, allows us to extract useful information about its response to changes in temperature and water availability. An earlier phenology was confirmed in the drier and warmer conditions, which affected ripening. The periods of the growing season when temperature and water availability have the greatest influence on grape parameters were confirmed, as well as the role of soil properties on available water. High maximum and minimum temperatures in the period prior to veraison resulted in low acidity, the effect of which was enhanced when available water decreased during this period. These conditions, on the other hand, favor the increase in PVAD, which is also affected by water availability during ripening. The increase in PVAD was associated with lower water availability during ripening in accordance with the reduction in berry size, which was also favored by the difference in the maximum and minimum temperature during ripening. Phenolic compounds will also suffer a reduction, which will have negative impact on flavors.
The expected increase in temperature and decrease in precipitation associated with climate change will have negative consequences for this variety, leading to a reduction in acidity (TAc and MAc), an increase in the probable alcoholic degree (PVAD), and a reduction in yield. Therefore, to preserve the growth of this variety in the area, where it has been cultivated for centuries, further research should be conducted on appropriate practices to optimize hydric requirements and delay the phenological timing to maintain the balance of the composition and quality of the grapes at harvest.

Author Contributions

The author is responsible for the compilation of the information, for the methodology applied, the analysis, and the full writing of the manuscript.

Funding

This research did not receive any specific grant from funding agencies in the public, commercial, or not-for-profit sectors.

Data Availability Statement

Vine data used in this study belong to Consejo Regulador de Ribera del Duero (https://riberadelduero.es/viticultor/informes-de-viticultura, accessed on 5 November 2024), and climatic data were obtained from ITACYL (ftp://ftp.itacyl.es) and from AEMET (www.aemet.es/es/idi/clima/registros_climaticos and www.aemet.es/es/serviciosclimaticos/cambio_climat, accessed on 5 November 2024).

Acknowledgments

The author thanks the Consejo Regulador of Ribera del Duero for the information related to the plots analyzed in the research, and the AEMET and ITACYL for the climatic information used in this study.

Conflicts of Interest

The author declares no conflicts of interest.

References

  1. Bock, A.; Sparks, T.; Estrella, N.; Menzel, A. Changes in the Phenology and Composition of Wine from Franconia, Germany. Clim. Res. 2011, 50, 69–81. [Google Scholar] [CrossRef]
  2. Kizildeniz, T.; Mekni, I.; Santesteban, H.; Pascual, I.; Morales, F.; Irigoyen, J.J. Effects of Climate Change Including Elevated CO2 Concentration, Temperature and Water Deficit on Growth, Water Status, and Yield Quality of Grapevine (Vitis vinifera L.) Cultivars. Agric. Water Manag. 2015, 159, 155–164. [Google Scholar] [CrossRef]
  3. Ramos, M.C.; Martínez de Toda, F. Variability in the Potential Effects of Climate Change on Phenology and on Grape Composition of Tempranillo in Three Zones of the Rioja DOCa (Spain). Eur. J. Agron. 2020, 115, 126014. [Google Scholar] [CrossRef]
  4. Yang, C.; Menz, C.; Fraga, H.; Costafreda-Aumedes, S.; Leolini, L.; Ramos, M.C.; Molitor, D.; van Leeuwen, C.; Santos, J.A. Assessing the Grapevine Crop Water Stress Indicator over the Flowering-Veraison Phase and the Potential Yield Lose Rate in Important European Wine Regions. Agric. Water Manag. 2022, 261, 107349. [Google Scholar] [CrossRef]
  5. Anderosn, K.; Nelgen, S. Which Winegrape Varieties are Grown Where? A Global Empirical Picture (Revised Edition); University of Adelaide Press: Adelaide, Australia, 2020; 800p. [Google Scholar]
  6. Chacón-Vozmediano, J.L.; Martínez-Gascueña, J.; Ramos, M.C. Projected Effects of Climate Change on Tempranillo and Chardonnay Varieties in La Mancha Designation of Origin. Agron. Sustain. Dev. 2021, 41, 24. [Google Scholar] [CrossRef]
  7. Parra, C.S.; Aguirreolea, J.; Sánchez-Díaz, M.; Irigoyen, J.J.; Morales, F. Effects of Climate Change Scenarios on Tempranillo Grapevine (Vitis vinifera L.) Ripening: Response to a Combination of Elevated CO2 and Temperature, and Moderate Drought. Plant Soil 2010, 337, 179–191. [Google Scholar] [CrossRef]
  8. Ramos, M.C.; Jones, G.V.; Yuste, J. Phenology of Tempranillo and Cabernet-Sauvignon Varieties Cultivated in the Ribera Del Duero DO: Observed Variability and Predictions under Climate Change Scenarios. Oeno One 2018, 52, 31–44. [Google Scholar] [CrossRef]
  9. Yang, C.; Menz, C.; De Abreu Jaffe, M.S.; Costafreda-Aumedes, S.; Moriondo, M.; Leolini, L.; Torres-Matallana, A.; Molitor, D.; Junk, J.; Fraga, H.; et al. Projections of Climate Change Impacts on Flowering-Veraison Water Deficits for Riesling and Müller-Thurgau in Germany. Remote Sens. 2022, 14, 1519. [Google Scholar] [CrossRef]
  10. Monteiro, A.I.; Aires, A.; Malheiro, A.C.; Bacelar, E.A. Biochemical Changes in Vitis vinifera Buds between Dormancy and Forced Bursting: A Case Study of Three Portuguese White Varieties. Agronomy 2022, 12, 382. [Google Scholar] [CrossRef]
  11. Nistor, E.; Dobrei, A.G.; Dobrei, A.; Camen, D. Growing Season Climate Variability and Its Influence on Sauvignon Blanc and Pinot Gris Berries and Wine Quality: Study Case in Romania (2005–2015). S. Afr. J. Enol. Vitic. 2018, 39, 196–207. [Google Scholar] [CrossRef]
  12. Ramos, M.C.; Yuste, J. Grapevine Phenology of White Cultivars in Rueda Designation of Origin (Spain) in Response to Weather Conditions and Potential Shifts under Warmer Climate. Agronomy 2023, 13, 146. [Google Scholar] [CrossRef]
  13. Gómez, V.; Sotés, V. El suelo de la denominación de origen Ribera del Duero. In Delimitación Cartográfica de Zonas Vitícolas en la Denominación de Origen Ribera del Duero; Fundación premio Arce, ETSIA, UPM: Madrid, Spain, 1992; Chapter 6. [Google Scholar]
  14. Winkler, A.J.; Cook, J.A.; Kliewer, W.M.; Lider, L.A. General Viticulture, 2nd ed.; Cerruti, L., Ed.; University of California Press: Berkley, CA, USA, 1974; 740p. [Google Scholar]
  15. Huglin, P. Nouveau mode d’évaluation des possibilités héliothermique d’un milieu viticole. Comptes Rendus L’Académie D’Agriculture Fr. 1978, 64, 1117–1126. [Google Scholar]
  16. Ramos, M.C.; Pérez-Álvarez, E.P.; Peregrina, F.; Martínez de Toda, F. Relationships between Grape Composition of Tempranillo Variety and Available Soil Water and Water Stress under Different Weather Conditions. Sci. Hortic. 2020, 262, 109063. [Google Scholar] [CrossRef]
  17. Baillod, M.; Baggiolini, M. Les stades repères de la vigne. Revue Suisse Vitic. Arboric. Hortic. 1993, 25, 10–12. [Google Scholar]
  18. OIV. Compendium of International Methods of Analysis of Wines and Musts; International Organization of Vine and Wine: Paris, France, 2012; Volume 2, 619p. [Google Scholar]
  19. Malheiro, A.C.; Campos, R.; Fraga, H.; Eiras-Dias, J.; Silvestre, J.; Santos, J.A. Winegrape Phenology and Temperature Relationships in the Lisbon Wine Region, Portugal. J. Int. Des Sci. La Vigne Du Vin 2013, 47, 287–299. [Google Scholar] [CrossRef]
  20. Hall, A.; Mathews, A.J.; Holzapfel, B.P. Potential Effect of Atmospheric Warming on Grapevine Phenology and Post-Harvest Heat Accumulation across a Range of Climates. Int. J. Biometeorol. 2016, 60, 1405–1422. [Google Scholar] [CrossRef]
  21. Ruml, M.; Korac, N.; Vujadinovic, M.; Vukovic, A.; Ivaniševic, D. Response of Grapevine Phenology to Recent Temperature Change and Variability in the Wine-Producing Area of Sremski Karlovci, Serbia. J. Agric. Sci. 2016, 154, 186–206. [Google Scholar] [CrossRef]
  22. Cameron, W.; Petrie, P.R.; Barlow, E.W.R. The Effect of Temperature on Grapevine Phenological Intervals: Sensitivity of Budburst to Flowering. Agric. For. Meteorol. 2022, 315, 108841. [Google Scholar] [CrossRef]
  23. Ramos, M.C.; Go, D.T.H.C.; Castro, S. Spatial and Temporal Variability of Cv. Tempranillo Response within the Toro DO (Spain) and Projected Changes under Climate Change. Oeno One 2021, 55, 346–366. [Google Scholar] [CrossRef]
  24. Sadras, V.O.; Petrie, P.R.; Moran, M.A. Effects of Elevated Temperature in Grapevine. II Juice PH, Titratable Acidity and Wine Sensory Attributes. Aust. J. Grape Wine Res. 2013, 19, 107–115. [Google Scholar] [CrossRef]
  25. Li, M.; Su, J.; Yang, H.; Feng, L.; Wang, M.; Xu, G.; Shao, J.; Ma, C. Grape Tartaric Acid: Chemistry, Function, Metabolism, and Regulation. Horticulturae 2023, 9, 1173. [Google Scholar] [CrossRef]
  26. Volschenk, H.; Vuuren, H.; Viljoen-Bloom, M. Malic Acid in Wine: Origin, Function and Metabolism during Vinification. S. Afr. J. Enol. Vitic. 2006, 27, 123–136. [Google Scholar] [CrossRef]
  27. Sweetman, C.; Sadras, V.O.; Hancock, R.D.; Soole, K.L.; Ford, C.M. Metabolic Effects of Elevated Temperature on Organic Acid Degradation in Ripening Vitis vinifera Fruit. J. Exp. Bot. 2014, 65, 5975–5988. [Google Scholar] [CrossRef]
  28. Williams, D.L.; Zietsman, A.J.J.; Brand, J.; Eyeghe-Bickong, H.A.; Vivier, M.A. Polyphenolic Compounds in Sauvignon Blanc—From Grapes to Wine. Oeno One 2025, 59, 8298. [Google Scholar] [CrossRef]
  29. Fulcrand, H.; Dueñas, M.; Salas, E.; Cheynier, V. Phenolic Reactions during Winemaking and Aging. Am. J. Enol. Vitic. 2006, 57, 289–297. [Google Scholar] [CrossRef]
  30. Flamini, R.; Mattivi, F.; De Rosso, M.; Arapitsas, P.; Bavaresco, L. Advanced Knowledge of Three Important Classes of Grape Phenolics: Anthocyanins, Stilbenes and Flavonols. Int. J. Mol. Sci. 2013, 14, 19651–19669. [Google Scholar] [CrossRef]
  31. Makris, D.P.; Kallithraka, S.; Kefalas, P. Flavonols in Grapes, Grape Products and Wines: Burden, Profile and Influential Parameters. J. Food Compos. Anal. 2006, 19, 396–404. [Google Scholar] [CrossRef]
  32. Jeffery, D.W.; Parker, M.; Smith, P.A. Flavonol Composition of Australian Red and White Wines Determined by High-Performance Liquid Chromatography. Aust. J. Grape Wine Res. 2008, 14, 153–161. [Google Scholar] [CrossRef]
  33. Downey, M.O.; Harvey, J.S.; Robinson, S.P. Synthesis of Flavonols and Expression of Flavonol Synthase Genes in the Developing Grape Berries of Shiraz and Chardonnay (Vitis vinifera L.). Aust. J. Grape Wine Res. 2003, 9, 110–121. [Google Scholar] [CrossRef]
  34. Jasse, A.; Berry, A.; Aleixandre-Tudo, J.L.; Poblete-Echeverría, C. Intra-Block Spatial and Temporal Variability of Plant Water Status and Its Effect on Grape and Wine Parameters. Agric. Water Manag. 2021, 246, 106696. [Google Scholar] [CrossRef]
  35. Azuma, A.; Yakushiji, H.; Koshita, Y.; Kobayashi, S. Flavonoid Biosynthesis-Related Genes in Grape Skin Are Differentially Regulated by Temperature and Light Conditions. Planta 2012, 236, 1067–1080. [Google Scholar] [CrossRef] [PubMed]
  36. Vršič, S.; Vodovnik, T. Reactions of Grape Varieties to Climate Changes in North East Slovenia. Plant Soil Environ. 2012, 58, 34–41. [Google Scholar] [CrossRef]
  37. Ramos, M.C.; Martínez de Toda, F. Macabeo (Viura) Grape Response to Climate Variability in Areas Located at Different Elevations in the Rioja Designation of Origin. J. Sci. Food Agric. 2022, 102, 5670–5679. [Google Scholar] [CrossRef] [PubMed]
  38. Neumann, P.; Matzarakis, A. Viticulture in Southwest Germany under Climate Change Conditions. Clim. Res. 2011, 47, 161–169. [Google Scholar] [CrossRef]
  39. Barnuud, N.N.; Zerihun, A.; Mpelasoka, F.; Gibberd, M.; Bates, B. Responses of Grape Berry Anthocyanin and Titratable Acidity to the Projected Climate Change across the Western Australian Wine Regions. Int. J. Biometeorol. 2014, 58, 1279–1293. [Google Scholar] [CrossRef]
  40. Ramírez-Cuesta, J.M.; Intrigliolo, D.S.; Lorite, I.J.; Moreno, M.A.; Vanella, D.; Ballesteros, R.; Hernández-López, D.; Buesa, I. Determining Grapevine Water Use under Different Sustainable Agronomic Practices Using METRIC-UAV Surface Energy Balance Model. Agric. Water Manag. 2023, 281, 108247. [Google Scholar] [CrossRef]
  41. Miccichè, D.; Puccio, S.; Di Lorenzo, R.; Turano, L.; Di Carlo, F.; Pisciotta, A. Adapting Viticulture to Climate Change: Impact of Shading in Sicily. Horticulturae 2025, 11, 163. [Google Scholar] [CrossRef]
  42. Dinis, L.-T.; Mota, N.; Martins, S.; Ribeiro, A.C.; Moutinho-Pereira, J.; Pereira, S. Foliar Silicon Application in the Era of Climate Change as a Part of Strategy to Reduce Water Requirements in Mediterranean Viticulture. Horticulturae 2024, 10, 1224. [Google Scholar] [CrossRef]
  43. Cataldo, E.; Fucile, M.; Mattii, G.B. Effects of Kaolin and Shading Net on the Ecophysiology and Berry Composition of Sauvignon Blanc Grapevines. Agriculture 2022, 12, 491. [Google Scholar] [CrossRef]
  44. Previtali, P.; Giorgini, F.; Mullen, R.S.; Dookozlian, N.K.; Wilkinson, K.L.; Ford, C.M. A Systematic Review and Meta-Analysis of Vineyard Techniques Used to Delay Ripening. Hortic. Res. 2022, 9, uhac118. [Google Scholar] [CrossRef]
  45. Andreotti, C.; Benyahia, F.; Petrillo, M.; Lucchetta, V.; Volta, B.; Cameron, K.; Targetti, G.; Tagliavini, M.; Zanotelli, D. Comparing Defoliation and Canopy Sprays to Delay Ripening of Sauvignon Blanc Grapes. Sci. Hortic. 2024, 326, 112736. [Google Scholar] [CrossRef]
Figure 1. Location of the study area, plots, and meteorological stations used in this research.
Agriculture 15 01229 g001
Figure 2. Changes in monthly maximum and minimum temperatures and precipitation in the SSP2-4.5 and SSP5-8.5 emission scenarios, projected with the AR6-ensemble of models (download from AEMET).
Agriculture 15 01229 g002
Figure 3. Phenological dates corresponding to budbreak (B), flowering (FL), veraison (V) and maturity (Mat) in both plots analyzed (1 and 2).
Agriculture 15 01229 g003
Figure 4. Average maximum and minimum temperatures and precipitation in the periods between phenological events (budbreak to flowering (BFL), flowering to veraison (FLV), and veraison to maturity (VMat)) in each plot (plot P1 and plot P2) and year.
Agriculture 15 01229 g004
Figure 5. ASW in the growing seasons analyzed in both plots (P: precipitation; ASW1: available soil water in plot P1; ASW2: available soil water in plot P2).
Agriculture 15 01229 g005
Figure 6. Graphical representation of the first two components of the PCA performed including grape composition (pH, TAc (titratable acidity), MAc (malic acid), PVAD (probable alcoholic degree), TPI (total polyphenol index), and BW (weight of 100 berries)) and Tmax (maximum temperature), Tmin (minimum temperature), and ASW (available soil water) in different periods between phenological events (BFL: budbreak to flowering; FFLV: flowering to veraison; VMat: veraison to maturity).
Agriculture 15 01229 g006
Table 1. Soil properties of the analyzed vineyards (plots P1 and P2). (Conducting system (T: trellis; G: goblet); plot altitude in m above sea level: Elev.; organic matter content: OM; water retention capacity at field capacity (FC) and at wilting point (WP).
PlotCond.
Syst.
Elev.
(m a.s.l)
Clay
(%)
Silt
(%)
Sand
(%)
Gravels
(%)
OM
(%)
FC
(%)
WP
(%)
P1T92020.927.045.621.81.1923.111.0
P2G91625.233.547.815.71.2024.811.8
Table 2. Average growing season temperatures (average (TmGS), maximum (TmaxGS) and minimum (TminGS)), bioclimatic indices (WI and HI), precipitation referring to the growing season (PGS) and the hydrological year (PHY) and evapotranspiration during the growing season (ETcGS). Growing season (GS is defined as the period from budbreak (B) to Maturity (Mat)).
PlotYearTmGS
B-Mat
(°C)
TmaxGS
B-Mat
(°C)
TminGS
B-Mat
(°C)
WI
April-Oct.
(GDD)
HI
April-Sept.
(GDD)
PGS
B-Mat
(mm)
PHY
Oct.-Sep.
(mm)
ETcGS
B-Mat
(mm)
P1202018.027.48.812522077211.5599.3300.1
202117.626.88.512272017158.3432.4307.9
202219.729.69.61597241272.9285.8323.6
202318.027.18.815022312140.8421.0320.3
202417.126.18.113532115155.0578.8275.3
Aver. 18.1 ± 1.027.4 ± 1.38.8 ± 0.61386 ± 1602187 ± 168147.7 ± 49.7463.5 ± 128.5305.4 ± 19.3
P2202018.327.39.812912101171.05480.6312.8
202117.826.69.312352044192.6455.0327.5
202220.630.011.11662246083.5329.8341.6
202319.127.710.615642353141.7422.0321.4
202417.826.69.313892180115.0532.8130.0
Aver. 18.7 ± 1.227.6 ± 1.410.0 ± 0.8140.8 ± 180227 ± 174140.8 ± 43.3444.0 ± 75.65288.7 ± 88.2
Table 3. Grape composition at harvest in each plot and year analyzed during the 2020–2024 period (TAc: titratable acidity, MAc: malic acid; BW100b; weight of 100 berries; PVAD: probable volumetric alcoholic degree, and TPI: total polyphenol index).
PlotYearpHTAc
(g/L)
MAc
(g/L)
BW 100b
(g)
PVAD
(°B)
TPI
P120203.177.471.28108.112.722
20213.087.892.16119.012.147
20223.216.511.19101.213.421
20233.196.011.80119.211.831
20243.147.051.96139.612.520
average3.16 ± 0.057.0 ± 0.81.7 ± 0.4107 ± 1512.6 ± 0.827 ± 11
P220203.396.251.70170.412.536
20213.616.312.18173.212.033
20223.596.051.03166.212.426
20233.365.801.58174.312.132
20243.495.562.17191.311.823
average3.49 ± 0.116.0 ± 0.31.7 ± 0.5175 ± 1012.2 ± 0.630 ± 5
Table 4. Loading matrix and variance explained by the components retained in the PCA including grape composition (pH, TAc (titratable acidity), MAc (malic acid), PVAD (probable alcoholic degree), TPI (total polyphenol index), and BW (berry weight)) and Tmax (maximum temperature), Tmin (minimum temperature), and ASW (available soil water) in different periods between phenological events (BFL: budbreak to flowering; FFLV: flowering to veraison; VMat: veraison to maturity).
PC1PC2PC3PC4
Tmax BFL0.9220.0590.1150.321
Tmin BFL0.4500.4700.6920.262
Tmax FLV0.896−0.376−0.016−0.028
Tmin FLV0.9280.107−0.128−0.266
Tmax-Tmin_VMat0.0030.8350.452−0.125
ASW_BFLa−0.378-0.1370.845−0.143
ASWFL-Va0.7550.0300.518−0.277
ASW_VMATa−0.2350.5710.4390.092
pH0.5140.7670.267−0.030
TAc0.7730.5340.0040.217
MAc0.7320.486−0.296−0.167
PVAD0.609-0.6750.2250.178
TPI0.5170.325−0.0680.735
BW0.2330.8840.019−0.216
Variance (%)39.80927.64715.0037.565
Bold numbers indicate variables with loadings >0.4.
Table 5. Coefficients of the multiple regression analysis of grape parameters with climate variables (TAc: titratable acidity, MAc: malic acid; BW100b; weight of 100 berries; PVAD: probable alcoholic degree, and TPI: total polyphenol index; BFL: budbreak to flowering period; FLV: flowering to veraison period and VMat: veraison to maturity period).
VariablecoefR2p
TAcTmaxBF−0.16674.710.0012
TminBF−0.158
TmaxFV−0.142
TminFV−0.304
Tmax-Tmin VMat0.160
ASW-FLV−0.00005
ASW-VMat−0.0037
MAcTmaxBF−0.07073.740.0001
TminBF−0.046
TmaxFV−0.092
TminFV−0.085
Tmax-Tmin VMat−0.082
ASW-FLV−0.00016
ASW-VMat0.00004
PVADTmaxBF0.08784.480.0015
TminBF0.019
TmaxFV0.229
TminFV0.029
Tmax-Tmin VMat0.284
ASW-FLV−0.0003
ASW-VMat−0.003
BWTmaxBF−0.90391.550.0001
TminBF2.953
TmaxFV−2.861
TminFV4.857
Tmax-Tmin VMat−15.776
ASW-FLV0.182
ASW-VMat0.256
TPITmaxBF0.97291.600.00018
TminBF2.837
TmaxFV−2.651
TminFV−2.798
Tmax-Tmin VMat−2.117
ASW-FLV−0.140
ASW-VMat0.039
Bold numbers indicate variables with significant correlation.
Table 6. Potential changes in Albillo Mayor grapes under climate change scenarios.
ScenarioYearTAc (g/L)Mac (g/L)PVAC (°B)BW100b (g)TPI
SSP2-4.52050−0.91−0.30.70−8.0−4.67
SSP2-4.52070−1.13−0.360.71−8.7−5.6
SSP5-8.52050−1.35−0.400.80−10.4−5.9
SSP5-8.52070−1.98−0.621.25−12.7−10.3
Disclaimer/Publisher’s Note: The statements, opinions and data contained in all publications are solely those of the individual author(s) and contributor(s) and not of MDPI and/or the editor(s). MDPI and/or the editor(s) disclaim responsibility for any injury to people or property resulting from any ideas, methods, instructions or products referred to in the content.

