Article

Research on Spatial–Temporal Differences and Convergence Characteristics of Ecological Total Factor Productivity of Cultivated Land Use in China

Institute of Agricultural Economics and Development, Chinese Academy of Agricultural Sciences, Beijing 100081, China
*
Author to whom correspondence should be addressed.
Agriculture 2025, 15(11), 1172; https://doi.org/10.3390/agriculture15111172
Submission received: 24 April 2025 / Revised: 26 May 2025 / Accepted: 27 May 2025 / Published: 29 May 2025

Abstract

The scientific evaluation of ecological total factor productivity of cultivated land use (ETFPCLU) is fundamental for advancing sustainable utilization of cultivated land resources and safeguarding national food security and ecological stability. Using the epsilon-based measure and the global Malmquist–Luenberger (EBM–GML) index, this study quantifies and decomposes ETFPCLU across China. Spatial–temporal variations and convergence patterns are systematically investigated via an analytical toolkit comprising the spatial mismatch index, Dagum’s Gini coefficient decomposition, and convergence models. The results indicate that Chinese ETFPCLU increased by an average of 2.1% per year from 2001 to 2022, primarily attributed to technical change (TC), with limited contributions from efficiency change (EC). The spatial mismatch between ETFPCLU and TC, as well as EC, is predominantly characterized by low to medium mismatch types, exhibiting a high degree of spatial distribution similarity; inter-regional differences are the main contributors to regional disparities. Furthermore, except for the central region, significant σ-convergence exists in ETFPCLU across the country and in other regions, alongside absolute β-convergence and conditional β-convergence in the four major regions. The analysis concludes that to enhance ETFPCLU, it is essential to strengthen technological innovation, synergistically improve technological efficiency, formulate ecological protection policies tailored to local conditions, and foster collaboration among regions for cultivated land protection.

1. Introduction

The sustainable use and development of agriculture, as a foundation for human survival and development, cannot be achieved without a healthy cropland ecosystem. China holds less than 7% of the world’s arable land, yet it supports nearly 20% of the global population [1,2]. To achieve sustainable utilization of cultivated land and ensure food security, the report of the 20th National Congress of the Communist Party of China emphasizes that “we must firmly hold the red line of 120 million hectares of cultivated land and gradually build all capital farmland into well-facilitated farmland [3]”. Therefore, the health and stability of its agricultural system are essential for maintaining food production and quality. Currently, China faces challenges such as limited arable land per person, poor soil quality, pollution, and land degradation. Statistically, the country’s cultivated land has decreased by 752.31 hm2, resulting in a reduction of 0.01 hm2 per person [4]. Regarding quality, the average grade of China’s cultivated land is only 4.76, with 22% classified as low quality (seventh to tenth grades), amounting to over 26.7 million hm2 [5]. From an ecological standpoint, overusing fertilizers and pesticides is a key driver of soil contamination and land degradation [6]. In 2022, the application of chemical fertilizers and pesticides in China reached 299 kg/hm2 and 8.18 kg/hm2, both exceeding the internationally recognized thresholds of 225 kg/hm2 and 7 kg/hm2, respectively [7]. Furthermore, degraded cultivated land now constitutes over 50% of China’s total cultivated area [8]. In this context, effectively improving the sustainable utilization of cultivated land resources remains a fundamental, global, and strategic issue.
To alleviate the dual challenges of resource scarcity and environmental pollution, relying solely on the continuous increase of production factor inputs to drive economic growth can lead to escalating costs and diminishing output efficiency. Total factor productivity (TFP) reflects the extent to which improvements in factor quality and optimization of factor allocation contribute to output [9]. As a result, improving the ETFPCLU is now a key strategy for promoting balanced cultivated land use and ecological protection. This approach, in turn, supports the sustainable management of agricultural resources. This raises several important questions: What is the definition of the ETFPCLU? How do the spatial–temporal dynamics of ETFPCLU evolve across China, and what are its convergence characteristics? How can we improve the ETFPCLU? A thorough investigation of these issues carries substantial theoretical and practical importance for safeguarding national food security and ecological stability, as well as for developing a sustainable model for the management of cultivated land resources.
In 1990, Schaltegger and Sturm introduced ‘eco-efficiency’, a measure of how well economic activities balance resource use with environmental protection [10]. This concept emphasizes achieving economic output while minimizing negative impacts on environmental pollution and resource consumption. The concept of eco-efficiency was first endorsed at the Earth Summit in Rio de Janeiro in 1992. After its introduction and promotion by the World Business Council for Sustainable Development, eco-efficiency has been widely applied in various fields, including agricultural production, energy consumption, tourism management, and regional development [11,12,13]. Eco-efficiency, in the context of cultivated land utilization, is commonly understood by scholars as the practice of minimizing the degradation of cultivated land resources and environmental pollution while simultaneously ensuring food security and maintaining agricultural productivity [14,15,16]. However, cultivated land use is a complex process that emphasizes not only efficient land use but also the need for technological advancements. It requires the optimization of all production factors, including labor, capital, and technology, while considering both resource limitations and environmental impacts. This approach aims to maximize economic, social, and ecological benefits [17,18]. Therefore, evaluating cultivated land eco-efficiency within the TFP framework remains a critical analytical priority. Building upon established research frameworks, this study conceptualizes eco-efficiency as a multidimensional metric that systematically optimizes production factor inputs, including labor, capital, land, and technology, while integrating ecological constraints into output evaluations. By harmonizing resource allocation efficiency with environmental feedback mechanisms, this approach quantifies the synergistic benefits and resilience thresholds of cultivated land systems under dynamic sustainability objectives.
Existing studies on the eco-efficiency of cultivated land use within the TFP framework concentrate on three main dimensions. First, researchers typically evaluate eco-efficiency using methods such as Data Envelopment Analysis (DEA) and Slack-Based Measure (SBM) models. These approaches are widely used because they can effectively handle multiple inputs and outputs and capture changes in efficiency over time [19,20]. For example, Yang et al. employed the SBM model with non-desired outputs to investigate the spatial–temporal variations in eco-efficiency within the context of environmental constraints [11]. Similarly, Yin et al. employed a three-stage super-SBM model to analyze the eco-efficiency of cultivated land use with and without environmental factors [21]. In analyzing the dynamic changes in TFP, most scholars combine the Malmquist–Luenberger (ML) index with the DEA model to reveal the impacts of EC, TC, and resource allocation efficiency on productivity [22]. However, the traditional ML index often faces issues such as the lack of feasible solutions and non-transferability, making it challenging to accurately reflect actual applications. In contrast, the Generalized Malmquist–Luenberger (GML) index addresses these problems and is more effective in evaluating productivity under non-desired outputs and environmental constraints, providing a more reliable basis for policy formulation [23]. Second, the selection of indicators for the ETFPCLU is crucial. Grounded in the realities of agricultural production, scholars have developed an indicator system that includes both inputs and outputs. Input indicators typically encompass labor, capital, land, fertilizers, pesticides, agricultural films, water resources, and energy [24,25,26]. Output indicators include both desired and non-desired outputs, with desired outputs comprising economic returns, crop yields, and carbon sinks, while non-desired outputs consist of carbon emissions and surface water pollution. In addition, several studies have integrated the value of ecosystem services as target outputs within their indicator frameworks. This approach enables a more comprehensive evaluation of cultivated land use eco-efficiency by accounting not only for production performance but also for the broader ecological benefits derived from agricultural practices [27,28,29]. Third, the influencing factors on the ETFPCLU are varied, including economic development levels, dynamic landscape pattern evolution, and the application of policy tools [13,30]. For instance, research by Yin and Yang on the Yangtze River Economic Belt shows that economic growth, strong financial support, and technological progress significantly boost the eco-efficiency of cultivated land use [11,21]. Cao et al. examined Jiangsu Province and found that cultivated land area and patch size positively impact eco-efficiency using a panel data regression model [13]. Additionally, Hou et al. utilized a Generalized Method of Moments (GMM) model to show that the agglomeration effect of urbanization negatively impacts the ecological efficiency of cultivated land use. In contrast, the barrier, driving, and feedback effects of urbanization have positive influences on eco-efficiency [31].
In summary, existing studies have provided valuable insights into the topics relevant to this paper; however, there remains significant room for further exploration. First, the design of the indicator system for the ETFPCLU is still inadequate. Current research has primarily focused on agricultural economic output, often neglecting ecological output when selecting desired output indicators. Additionally, non-desired outputs typically concentrate on carbon emissions from cultivated land, overlooking factors such as non-point source pollution. Second, research on the development of the ETFPCLU lacks an in-depth exploration of long-term trends and global perspectives. Most studies currently emphasize short-term data and localized analyses, highlighting the urgent need to broaden research horizons. Third, a significant research limitation exists concerning the dynamic evolution and convergence characteristics of ETFPCLU. Consequently, it is imperative to investigate the development level and spatial–temporal evolution of ETFPCLU, considering the distinctive attributes of cultivated land use.
The potential contributions advanced in this study are threefold. First, the design of the indicator system incorporates both non-point source pollution and carbon emissions from cultivated land as non-desired output indicators. This integration of environmental pollution and greenhouse gas emissions generated during cultivated land utilization aligns more closely with the actual agricultural production context, thereby facilitating the monitoring of ecological development performance in cultivated land use. Second, regarding research content, this paper analyzes and discusses the time-series characteristics, spatial mismatch patterns, regional differences, and convergence of the ETFPCLU across China. This aims to clarify the development of ETFPCLU in China and provide empirical support for promoting the sustainable development of cultivated land resource use. Third, the EBM model methodologically resolves critical deficiencies inherent in conventional DEA frameworks through its capacity to concurrently optimize slack variables and stabilize multi-objective weight allocation matrices. Furthermore, the GML index offers transferability and multiplicability, enabling it to more accurately reflect long-term dynamic changes in productivity when measuring technological progress and efficiency changes. As a result, this study constructs the EBM–GML model to measure and decompose the ETFPCLU in China. It uses methods such as the spatial mismatch index, Dagum’s Gini coefficient, and convergence model to analyze the time-series characteristics, spatial characteristics, and convergence patterns of the ETFPCLU, aiming to ensure the scientificity and reliability of the research results.
The remainder of this study is organized as follows. Section 2 primarily introduces the overview of the study area, the construction of the indicator system, research methods, and data sources. Section 3 mainly analyzes the time-series characteristics, spatial characteristics, and convergence patterns of ETFPCLU. Section 4 discusses the research methodology employed, highlights the key findings, and addresses the limitations inherent in the study. Section 5 synthesizes core analytical inferences and formulates actionable policy recommendations to optimize cultivated land resource sustainability. Figure 1 outlines the main research framework discussed in this paper.

2. Materials and Methods
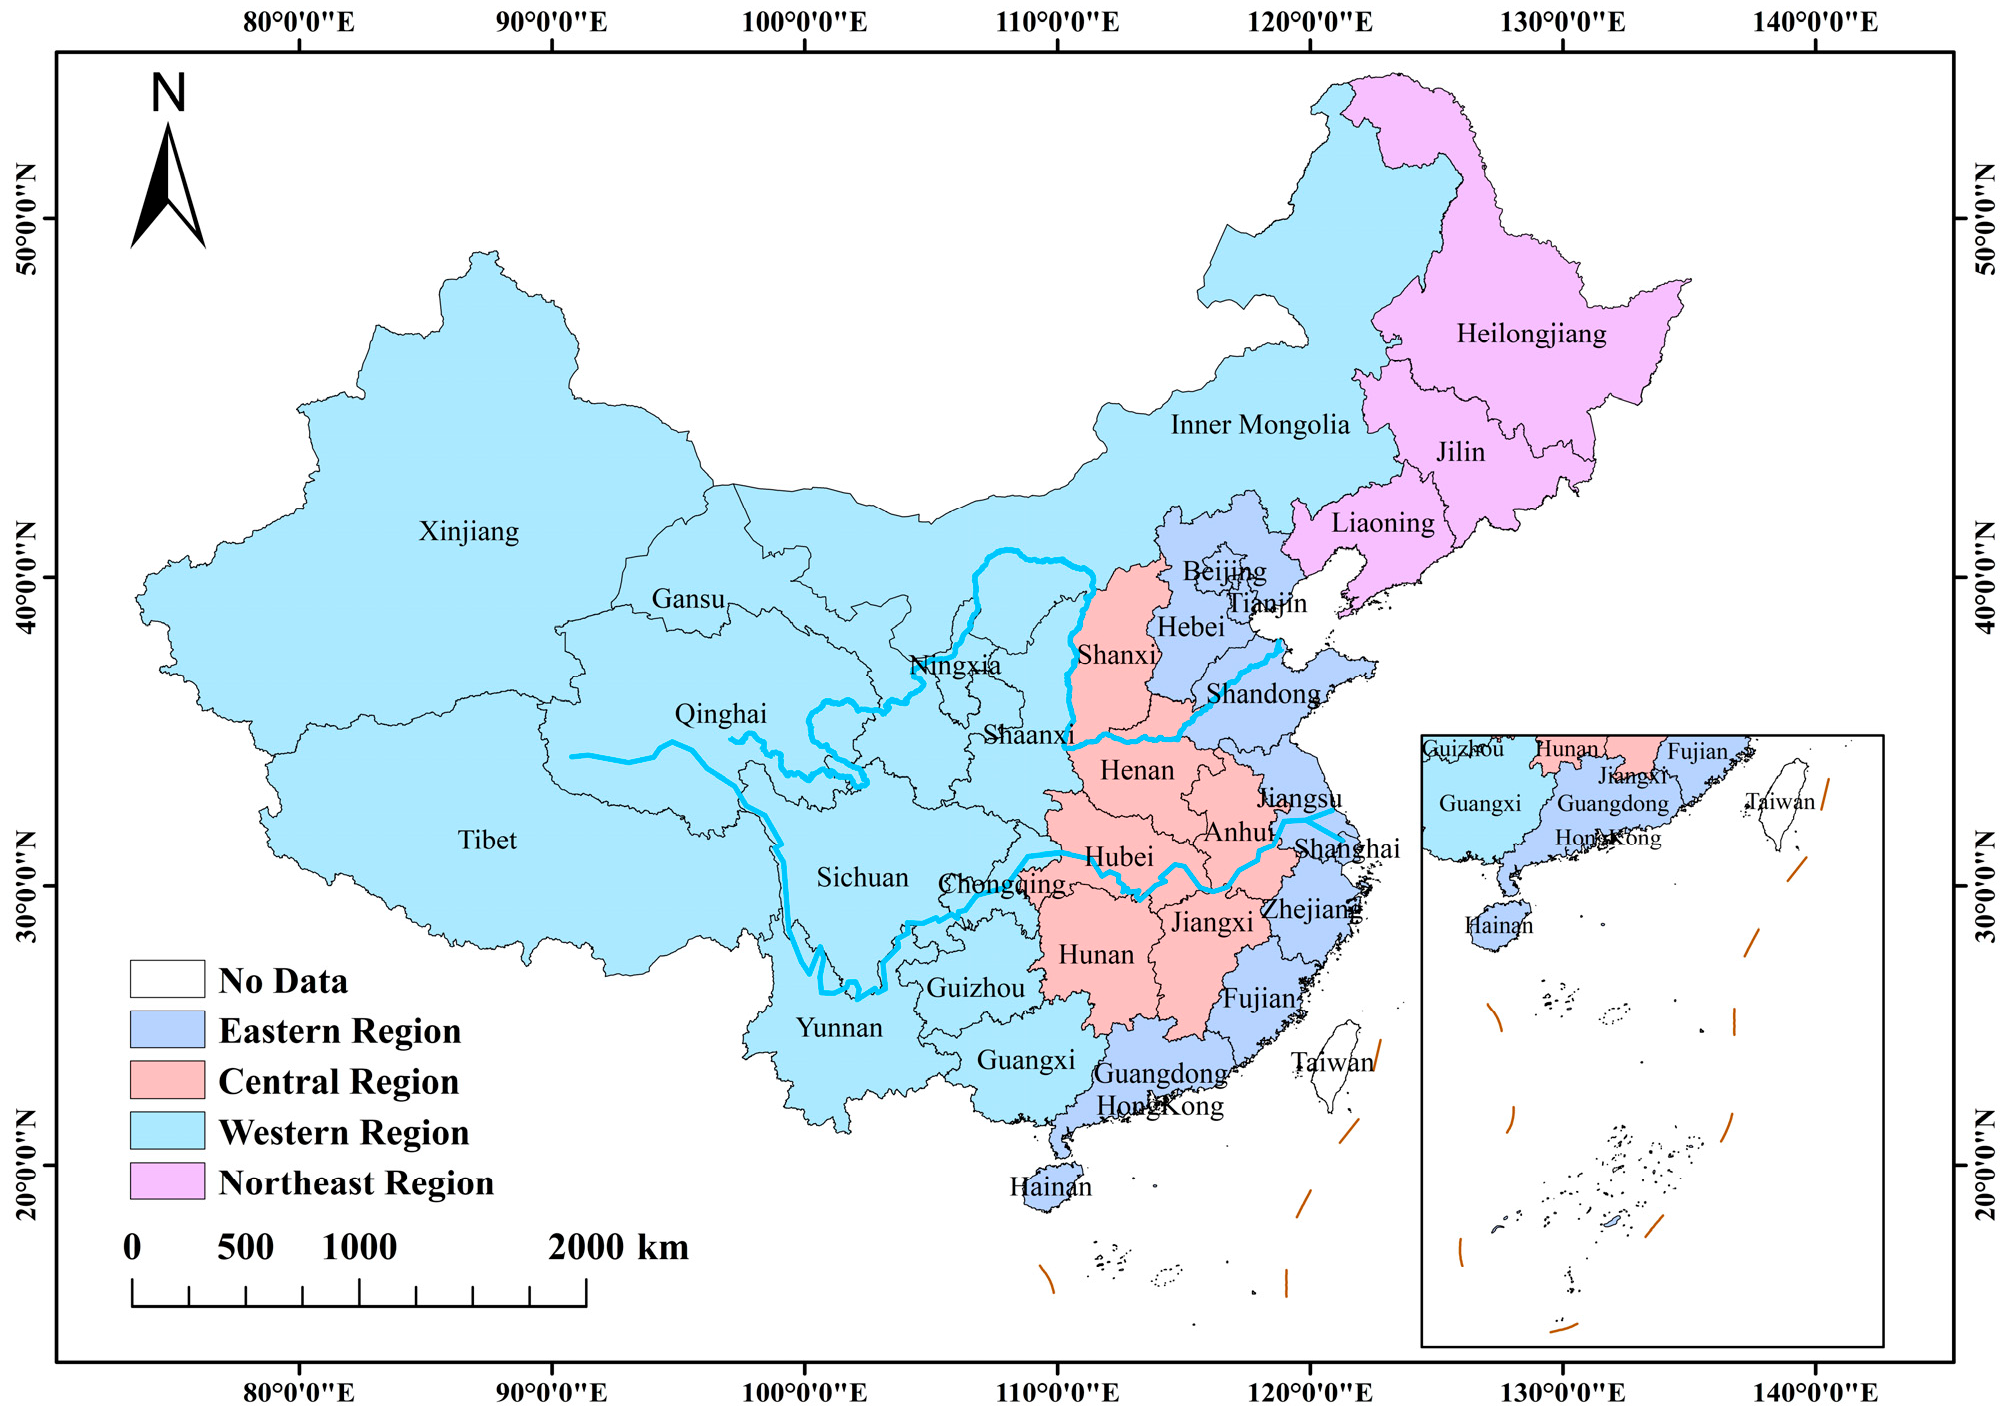
2.1. Study Area

To effectively analyze the variations in ETFPCLU across different regions, this paper aims to establish a basis for formulating policies that encourage the sustainable management of cultivated land resources in these areas. Consistent with this aim, we utilize the regional classification criteria set forth by the National Bureau of Statistics of China, categorizing the study area into four primary regions: eastern, central, western, and northeastern China [32], as shown in Figure 2.

2.2. Methodology

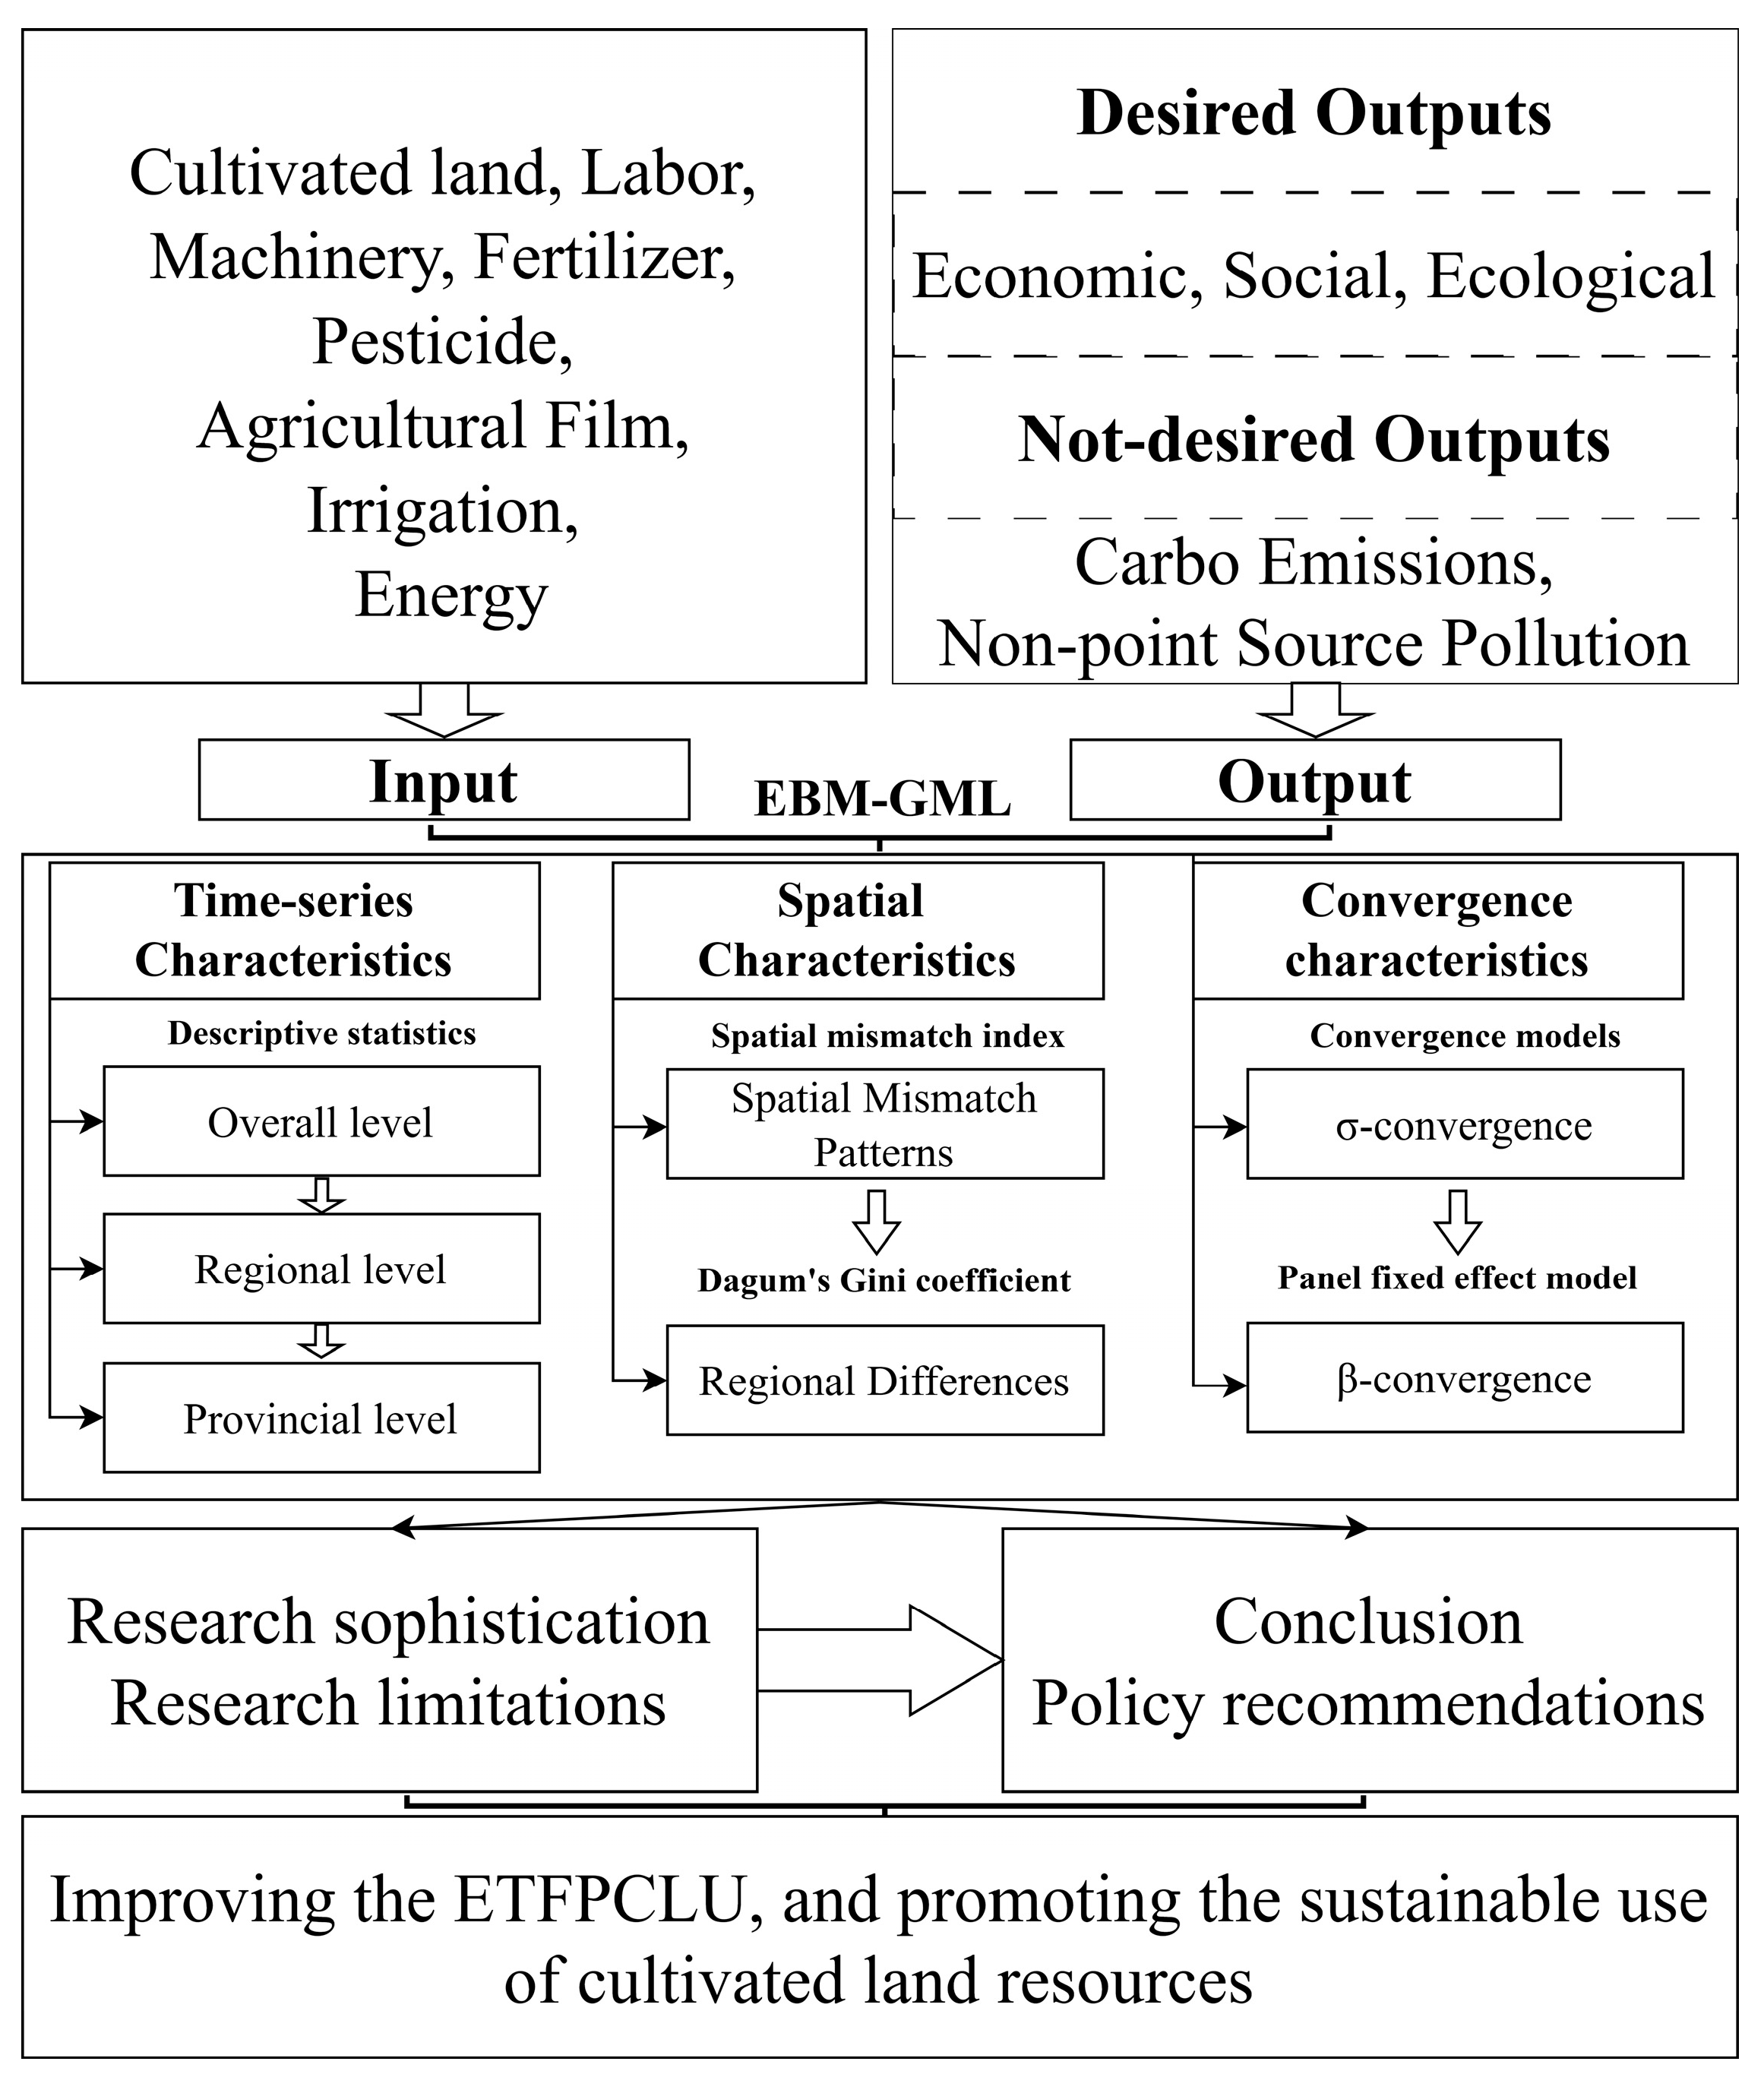
2.2.1. EBM–GML Model

Both the EBM–GML model and the SBM–DDF–ML model were used for the evaluation of TFP, but they have significant differences. Among them, the EBM model is suitable for integrating radial and non-radial distance functions, and it dynamically analyzes TFP through the GML index, directly optimizing the slack variables of non-desired outputs, making the calculation more efficient [33]. The SBM–DDF model gradually deals with non-desired outputs by relying on the directional distance function, and then decomposes the efficiency change through the ML index [34]. But this method is relatively complex and prone to introducing errors. Therefore, this study selected the EBM–GML model, which can effectively avoid the cumulative deviation of multi-step calculations in the SBM–DDF–ML model, and is more suitable for panel data analysis and mechanism research.
  • EBM model
To mitigate methodological constraints in extant models regarding input–output relational disambiguation, Tone et al. pioneered the EBM model, integrating radial and non-radial operational dimensions. Among them, the radial approach assumes that all inputs or outputs are adjusted proportionally (as DEA models), while the non-radial approach allows adjustments at varying rates and more flexibly handles slack variables (as SBM models). Diverging from conventional DEA and SBM paradigms, the EBM framework synthesizes the conceptual bifurcation of distance function typologies [35]. This hybrid architecture operationalizes proportional (radial) and discrete (non-radial) calibrations across decision-making unit parameters, thereby enhancing metric robustness through cross-efficiency harmonization. Consequently, this investigation operationalizes the EBM model to quantify the eco-efficiency of cultivated land use, aiming to prioritize the derivation of methodologically robust and empirically generalizable efficiency metrics. The calculation formula is presented below [36]:
γ * = min θ ε x i = 1 m ω i u i x i k φ + ε y r = 1 s ω r + u r + y r k + ε b p = 1 q ω p b u p b b p k
s . t . j = 1 n x i j λ j + u i = θ x i k , i = 1 , , m j = 1 n y r j λ j u i + = φ y r k , r = 1 , , s j = 1 n b p j λ j + u p b = φ b p k , p = 1 , , q λ j 0 , u i , u i + , u p b 0
where γ* represents the combined efficiency value. The variables xik, yrk, and bpk denote the inputs, desired outputs, and non-desired outputs, respectively. The slacks of the i-th input, r-th desired output, and p-th non-desired output are denoted by u i , u r + , and u p b , respectively. The relative importance of the i-th input, r-th desired output, and p-th non-desired output is represented by ω i , ω r + , and ω p b . The parameters θ and φ are the planning parameters of the radial component. Additionally, εx, εy, and εb represent the significance of the non-radial components of inputs, desired outputs, and non-desired outputs in the calculation of the efficiency value. The variable n represents the number of target decision units, while λj refers to the linear combination coefficient.
2.
GML index
Since the EBM model cannot capture changes in technological progress and productivity, the GML index is employed to analyze TFP changes from a global perspective [37]. The formula for this calculation is provided below [38]:
G M L t , t + 1 x t + 1 , y t + 1 , b t + 1 ; x t , y t , b t = 1 + F G T x t , y t , b t 1 + F G T x t + 1 , y t + 1 , b t + 1
G M L t , t + 1 x t + 1 , y t + 1 , b t + 1 ; x t , y t , b t = 1 + F G t x t , y t , b t 1 + F G t + 1 x t + 1 , y t + 1 , b t + 1 × 1 + F G T x t , y t , b t / 1 + F C t x t , y t , b t 1 + F G T x t + 1 , y t + 1 , b t + 1 / 1 + F C t + 1 x t + 1 , y t + 1 , b t + 1 = T E t + 1 T E t × B P G t + 1 t , t + 1 B P G t t , t + 1 = E C t , t + 1 × T C t , t + 1
In this model, xt, yt, and bt represent inputs, desired outputs, and non-desired outputs, respectively, for a decision unit in period t. The global directional distance function F G T x t , y t , b t quantifies performance. The G M L t , t + 1 index measures ETFPCLU between periods t and t + 1, splitting into two parts: E C t , t + 1 and T C t , t + 1 . Values above 1 for G M L t , t + 1 , E C t , t + 1 , or T C t , t + 1 signal growth in ETFPCLU, E C t , t + 1 , or T C t , t + 1 . Values below 1 indicate declines in ETFPCLU, E C t , t + 1 , or T C t , t + 1 .

2.2.2. Spatial Mismatch Index

The spatial mismatch index, proposed by Martin [39], is now widely utilized in fields such as tourism management, demography, and sociology. This model effectively reflects the degree of spatial distribution fit between the ETFPCLU and both EC and TC. The calculation formula is as follows [40]:
S M I i = 1 G M L C i C G M L G M L i × 100
where SMIi represents the spatial dislocation index of province i, with its absolute value indicating the spatial dislocation intensity between the ETFPCLU and the indices of EC and TC. A larger absolute value reflects a more significant spatial dislocation phenomenon and lower similarity in spatial distribution, whereas a smaller value suggests a higher degree of similarity. The variable i corresponds to a province, while Ci indicates either the EC or TC of province i. If SMI > 0, it suggests that EC or TC changes faster than the ETFPCLU, exerting a strong positive driving effect on ETFPCLU. Conversely, if SMI < 0, it indicates that EC or TC lags behind the changes in ETFPCLU, thereby restricting improvements in ETFPCLU. Additionally, GMLi represents the ETFPCLU index of province i. Based on relevant studies, this study categorizes the research area into six types of areas, as shown in Table 1.

2.2.3. Dagum’s Gini Coefficient

The Dagum’s Gini coefficient decomposition method systematically addresses the issue of sample distribution overlap while delineating structural contributors to territorial heterogeneities, thereby establishing its popularity in spatial disparity analytics [41]. The calculation formula is presented below [42]:
G = 1 2 n 2 D ¯ j = 1 k h = 1 k i = 1 n j r = 1 n h D j i D h r
G = G w + G n b + G t
In this context, n corresponds to the total count of provinces, k designates the number of regions, and nj and nh characterize the respective provincial counts within regions j and h. The variables Djr and Dhr correspond to the ETFPCLU values for any province in regions j and h. The symbol D ¯ indicates the mean ETFPCLU, while G denotes the overall regional variance of ETFPCLU. The variable Gw represents the intra-region variance of ETFPCLU, and Gnb signifies the inter-region variance of ETFPCLU. Finally, Gt refers to the hypervariance density of the ETFPCLU, which represents the crossover between different regions.

2.2.4. Convergence Models

Commonly analyzed convergence models primarily consist of σ-convergence, absolute β-convergence, and conditional β-convergence [43].
The σ-convergence method evaluates the dispersion of ETFPCLU. The calculation formula is presented below [44]:
σ t = 1 n i = 1 n x i , t x t ¯ 2 / x t ¯
Let σt represent the coefficient of variation of ETFPCLU in period t. A higher value of σt indicates greater divergence among provinces, while a lower value suggests convergence. The variable n stands for the number of provinces. Here, xi,t represents the ETFPCLU of province i during period t, and x t ¯ denotes the average ETFPCLU across all provinces in that period.
Absolute β-convergence investigates the propensity of ETFPCLU to approach a unified steady-state level temporally. The calculation formula is as follows [45]:
ln x i , t ln x i , 0 / T = α + β ln x i , 0 + ε i , t
where T represents the study’s time span. xi,t denotes the ETFPCLU in the i-th province during the final year, while xi,0 indicates the ETFPCLU in the i-th province during the initial year. Parameters α and β are to be estimated. If the beta value is negative, it indicates convergence. Conversely, a positive beta value suggests dispersion. The term εi,t represents the random error in the model.
Conditional β-convergence investigates whether the economic development levels of different provinces can converge to their respective steady-state levels under specific economic conditions. It primarily involves two tests: one adds control variables to the regression model for testing, while the other employs a panel fixed-effects model that does not require additional control variables [46]. Based on the study by Yang et al. [47], the calculation formula is presented below:
ln x i , t + 1 ln x i , t = α + β ln x i , t + ε i , t
In this model, xi,t and xi,t+1 represent the ETFPCLU for province i in the current period and the following period, respectively. The term α accounts for the fixed effect term in the panel data model, while β is the coefficient measuring the relationship between variables. If β is negative and statistically significant, this suggests conditional beta-convergence. The random error term εi,t captures unexplained variations in the data.

2.3. Indicator Selection and Data Sources

To holistically analyze the interdependencies among resource utilization efficiency, socioeconomic benefits, and ecological-environmental effects in cultivated land use, this study adopts the “input–output environment” analytical framework. It constructs a systematic assessment framework that encompasses production factors, socio-economics, and the ecological environment to measure the ETFPCLU [48,49]. The indicator system is provided in Table 2.
From the input dimension, this study selected eight categories of indicators for cultivated land, labor, machinery, fertilizer, pesticide, agricultural film, irrigation, and energy. These indicators cover the core agricultural production factors such as land, manpower, capital, and technology [50,51,52]. These input factors directly affect both the quantity and quality of outputs. Among them, the sown area of crops reflects the actual utilization scale of cultivated land [53]. The quantification of labor input is derived through an integrative approach that incorporates the employment share within the primary sector alongside agricultural productivity metrics [54]. This methodology incorporates weighting adjustments to mitigate estimation inaccuracies stemming from labor allocation overlaps across agriculture, forestry, livestock, and aquaculture sectors. Mechanization progress and energy utilization intensity are evaluated using two proxies: agricultural machinery capacity and diesel fuel consumption [50]. Furthermore, the application rates of synthetic fertilizers, pesticidal, and agricultural films exhibit a direct correlation with both resource intensification levels and ecological hazard potentials inherent in farming practices [55]. These operational variables serve dual analytical purposes: they systematically evaluate the magnitude of production factor distribution while simultaneously revealing the ecological strain imposed by contemporary cultivated land use strategies, particularly through chemical overapplication and heightened reliance on non-renewable energy inputs.
The desired output dimension is operationalized through a tripartite framework encompassing economic, social, and ecological components, holistically encapsulating the synergistic advantages of agricultural land utilization. Within this framework, the gross agricultural output value functions as a primary economic metric, quantifying direct financial returns from agrarian activities [56]. Total food production, positioned as a societal gauge, emphasizes the pivotal role of arable landscapes in safeguarding national food security [57]. Finally, the total carbon sinks on cultivated land act as an indicator of ecological output. This incorporates the positive externality of cultivated land into the accounting framework, emphasizing the contribution of agricultural production to carbon emission reduction and ecological services [58,59]. The total carbon sink of cultivated land is calculated using the following formula: C s = i = 1 n C s i = i = 1 n C i × Y i × 1 M i / E i , where Csi represents the carbon uptake of crops, and n denotes the crop type. Five types of crops—rice, wheat, maize, beans, and potatoes—were selected based on the cultivation practices in the study area. As delineated in Table 3.
The non-desired output dimension encompasses two critical metrics: carbon emissions from cultivated land and non-point source pollution. When integrated with agricultural production externalities, these parameters holistically characterize the multidimensional equilibrium between socioeconomic development, resource utilization efficiency, and ecosystem integrity. Cultivated land-derived carbon emissions quantify greenhouse gas emissions attributable to agrochemical synthesis and farm machinery operations, as substantiated by existing empirical studies [60,61,62,63]. The carbon emission quantification operates through the multiplicative relationship: E = E i = G i × δ i , where Ei denotes the carbon output from the i-th emission source, Gi signifies the activity intensity of the source, and δi characterizes the source emission intensity coefficient. The coefficients are as follows: tillage at 312.58 kg/km2, fertilizers at 0.8962 kg/kg, pesticides at 4.9341 kg/kg2, agricultural films at 5.17 kg/kg3, agricultural machinery at 0.19 kg/kw, and irrigation at 25 kg/hm2. Cultivated land non-point source pollution was calculated using the statistics and pollution coefficients of various pollution sources to quantify the negative impacts of nitrogen and phosphorus loss from fertilizers, pesticide pollution, and agricultural film residues on the soil and water environment [64]. Specifically, nitrogen and phosphorus loss levels are calculated using the following method: Amount of nitrogen and phosphorus loss = Amount of fertilizer used × Proportion of nitrogen and phosphorus in fertilizer × Fertilizer loss coefficient. According to relevant studies [65], the proportion of nitrogen and phosphorus was set at 0.42 and 0.18, respectively, with the fertilizer loss coefficient at 0.65, the coefficient of pesticide pollution at 0.5, and the coefficient of pesticide film residue at 0.1.
This paper employs indicators derived from 31 Chinese provinces spanning 2000–2022 to measure ETFPCLU. Primary datasets were sourced from authoritative repositories, including the China Economic and Social Big Data Platform, the China Statistical Yearbook, the China Rural Statistical Yearbook, and the China Environmental Statistical Yearbook [66,67,68]. Missing values in datasets were addressed through linear interpolation techniques to ensure methodological rigor [69].

3. Results

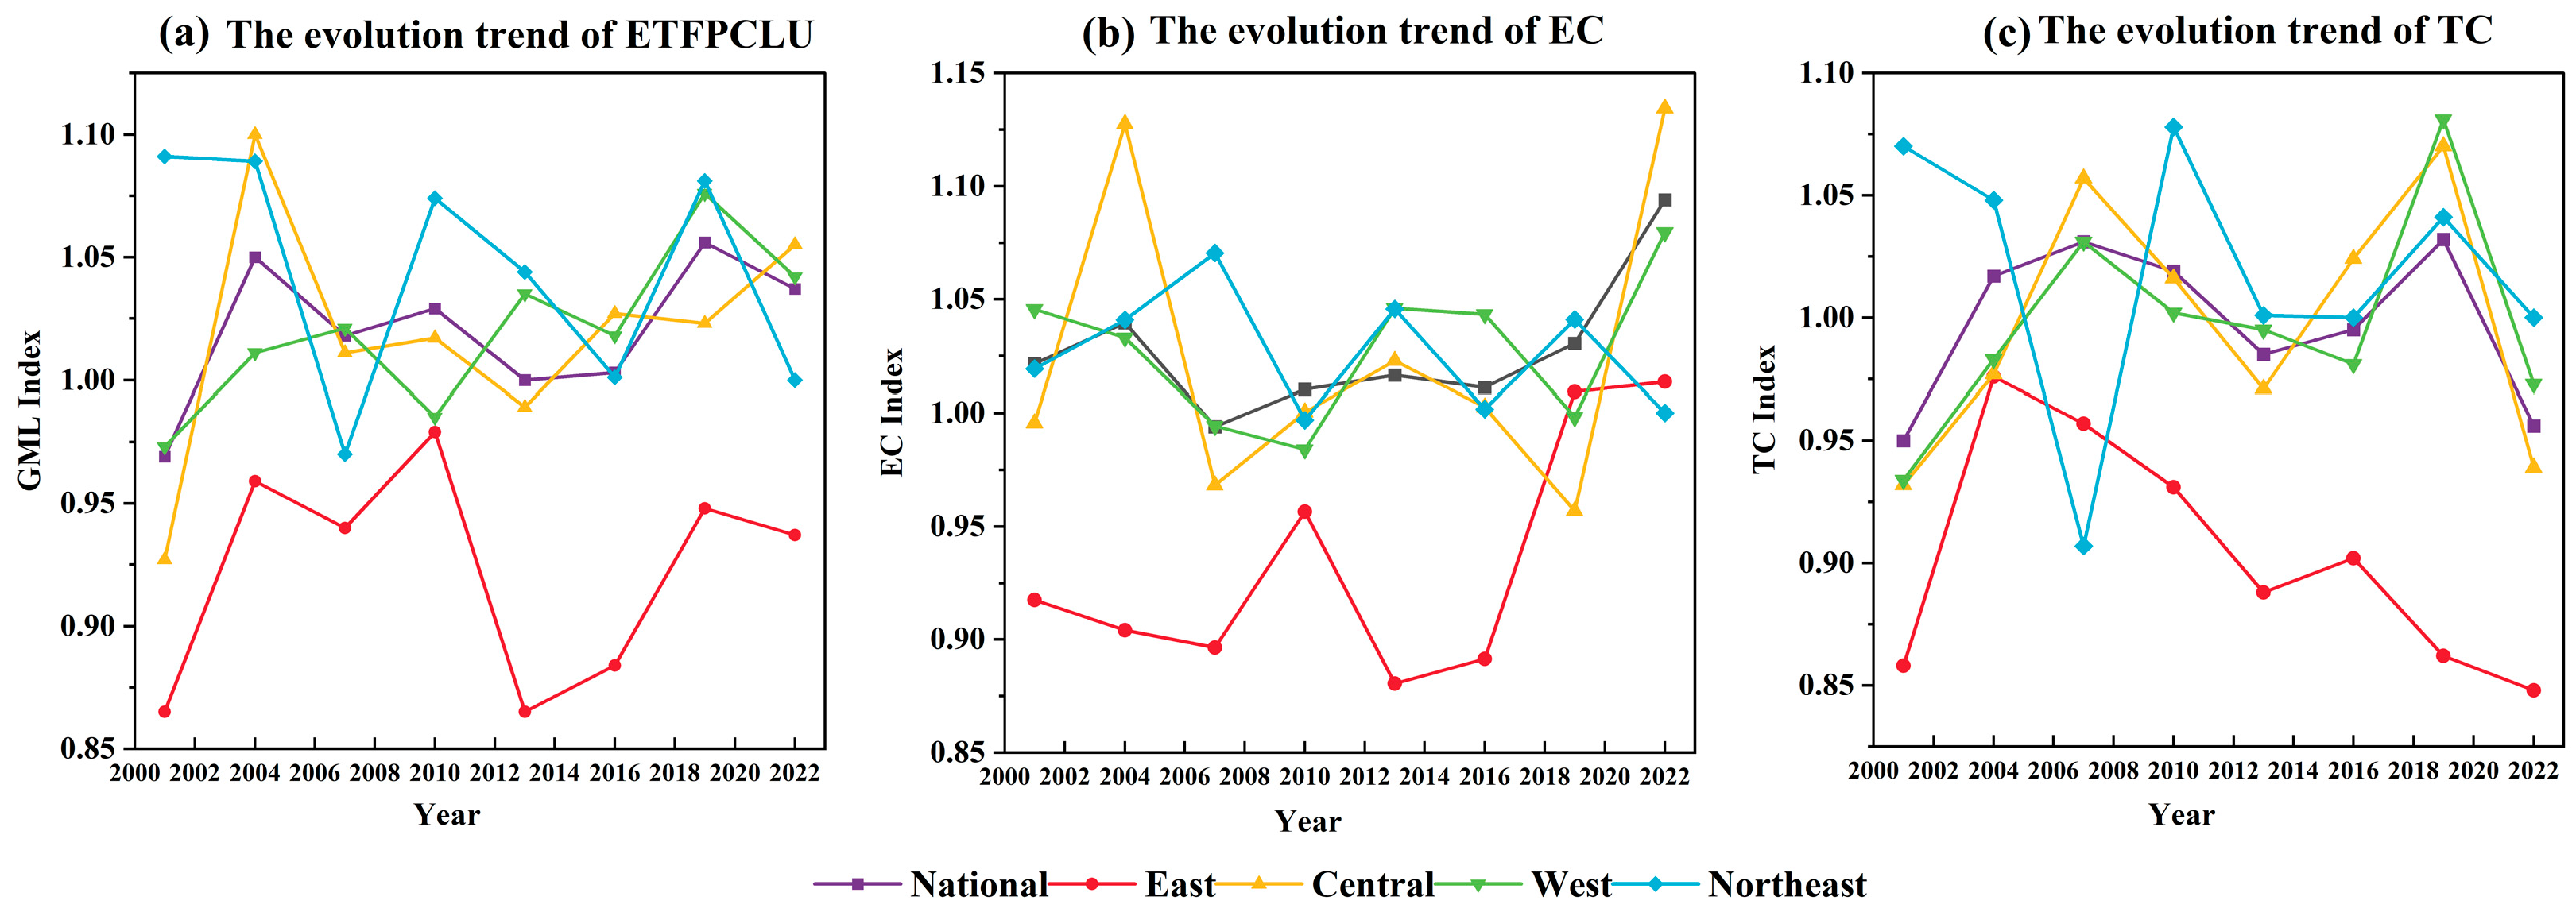
3.1. Time-Series Characteristics of the ETFPCLU

We employed MATLAB R2022b to analyze Chinese provincial panel data (2000–2022), measuring ETFPCLU and its decomposition terms using the EBM–GML index. Figure 3 presents these results.
Overall, Chinese ETFPCLU showed a fluctuating rise nationwide during the study period, with alternating phases of growth and decline in productivity. The GML index averaged 1.021, translating to a 2.1% annual growth rate. This indicates that the national ETFPCLU is generally on an upward trajectory; however, the sustainability and stability of this development still require consolidation. When analyzing the decomposition terms, it is evident that the efficiency level, represented by the EC index, ranged from 0.948 to 1.094 during the study period, while the TC index varied between 0.934 and 1.161. The EC index grew at an annual rate of 0.31%, whereas the TC index rose only slightly (0.03% per year). The analytical outcomes posit that the evolution of cultivated land ecological technology constitutes the principal determinant of China’s ETFPCLU escalation throughout the observational interval, whereas the contribution of cultivated land ecological technology efficiency remains limited.
At the regional level, the ETFPCLU in China’s four major regions is characterized by significant spatial imbalances. The northeast and west regions show the highest performance, with averages of 1.019 and 1.017 and annual growth rates of 1.90% and 1.71%, respectively. The central region ranks next, averaging 1.014 with 1.37% annual growth, while the east trails significantly at 0.938, reflecting a 6.22% yearly decline. Analysis of contributing factors reveals that both EC and TC drive growth in the central and northeastern regions. The central region’s EC and TC grew at annual rates of 0.77% and 1.13%, respectively. The northeast followed a similar pattern, with EC at 0.52% and TC at 1.45%, demonstrating their combined role in driving growth.
At the provincial level, the ETFPCLU shows a growth trend, primarily developing in a single-wheel drive mode. This study categorized the growth of the ETFPCLU into three types: strong effective growth type (GML ≥ 1.1), weak effective growth type (1 ≤ GML < 1.1), and ineffective growth type (GML < 1). As illustrated in Figure 3, the growth of the ETFPCLU in most provinces in 2001 was concentrated in the ineffective growth type, comprising 74.19% of the total. By 2011 and 2022, the weak effective growth type became the most prevalent, with shares of 41.94% and 77.42%, respectively, indicating significant improvement in the ETFPCLU across many provinces after years of development. Analyzing the decomposition terms reveals that the five provinces with the most notable efficiency improvements are Shanxi, Guangxi, Hainan, Shandong, and Beijing, in that order. Meanwhile, the five provinces demonstrating the most significant technical progress are Qinghai, Zhejiang, Chongqing, Jiangxi, and Tibet. This study found that more than half of the provinces experienced slight increases in EC and small decreases in TC during the sample period. This suggests that most provinces have made reasonable allocations of production factors and achieved a moderate degree of agglomeration, but have seen a slight decline in frontier technology (Figure 4).

3.2. Spatial Characteristics of the ETFPCLU

Building on the examination of time-series characteristics of the ETFPCLU, this paper further explores the spatial mismatch patterns and regional differences in this productivity across China. It employs the spatial mismatch index and Dagum’s Gini coefficient to analyze these aspects from the perspective of spatial characteristics.

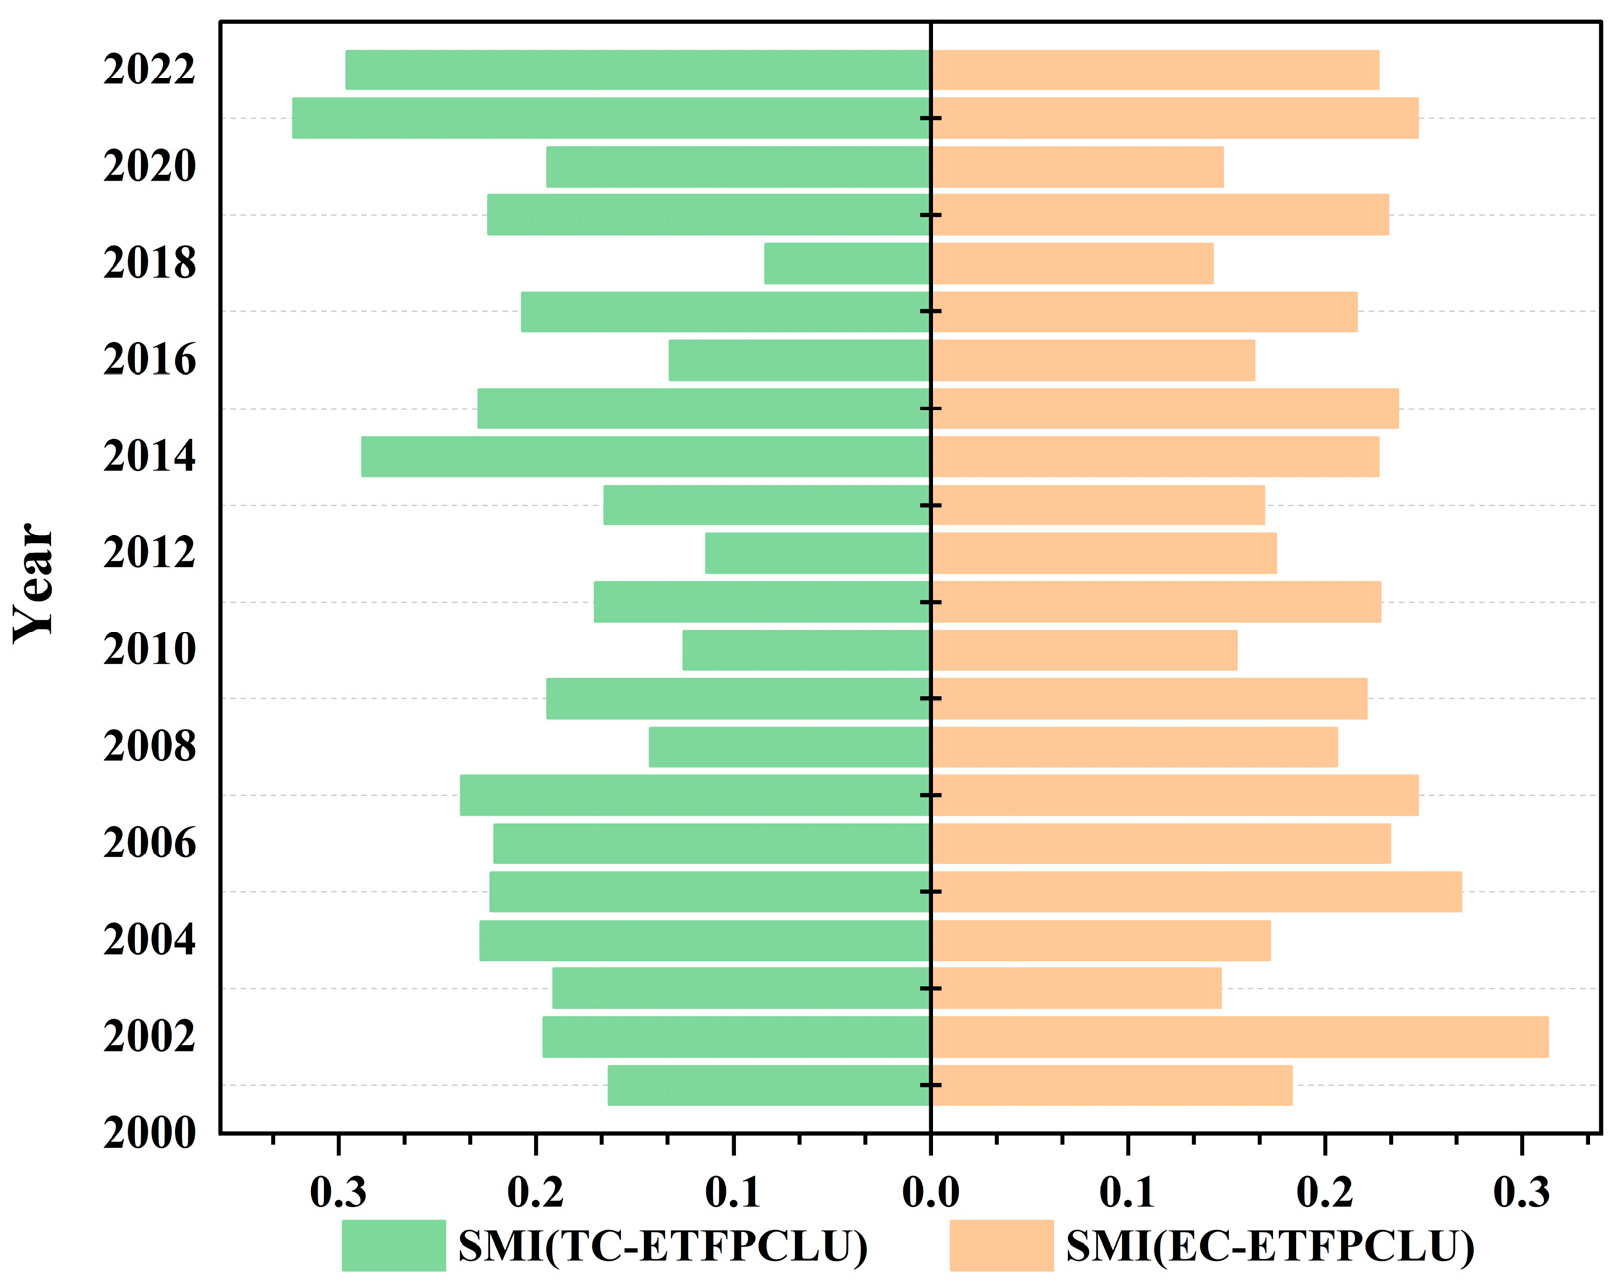
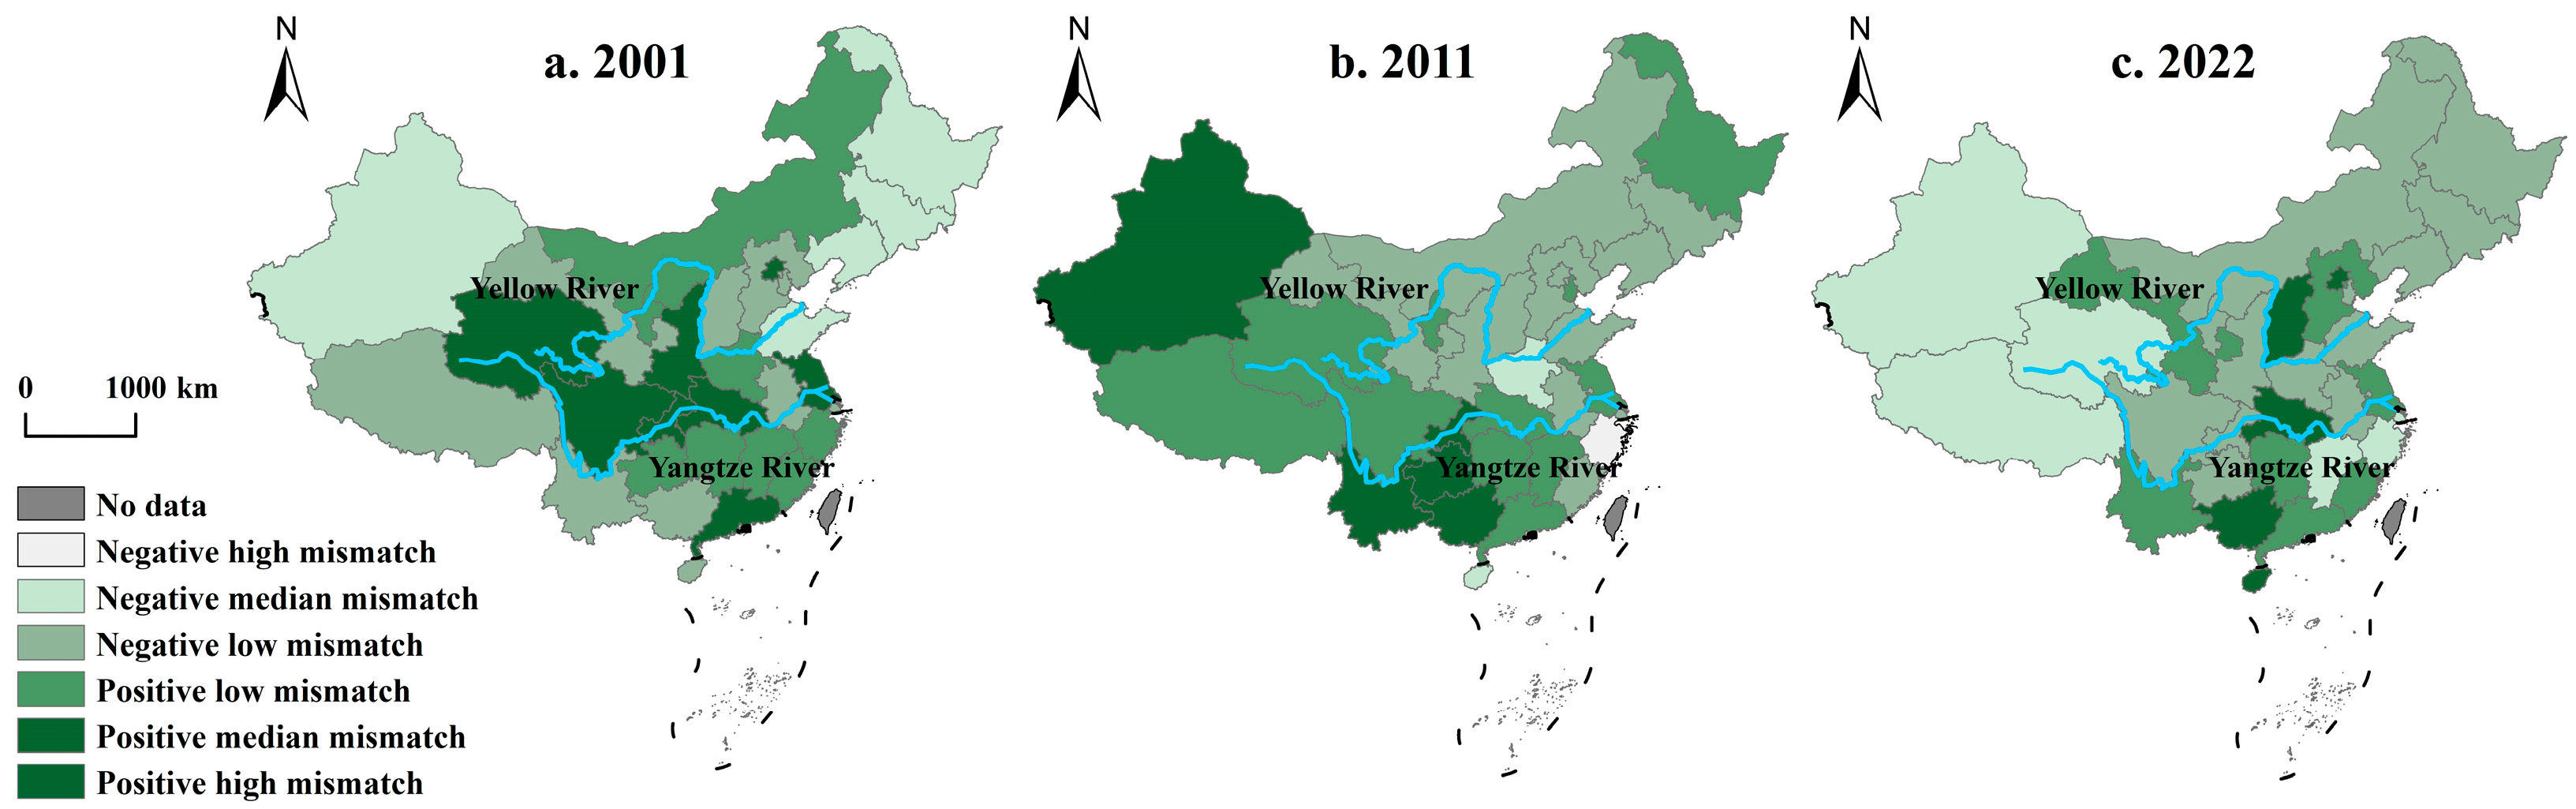
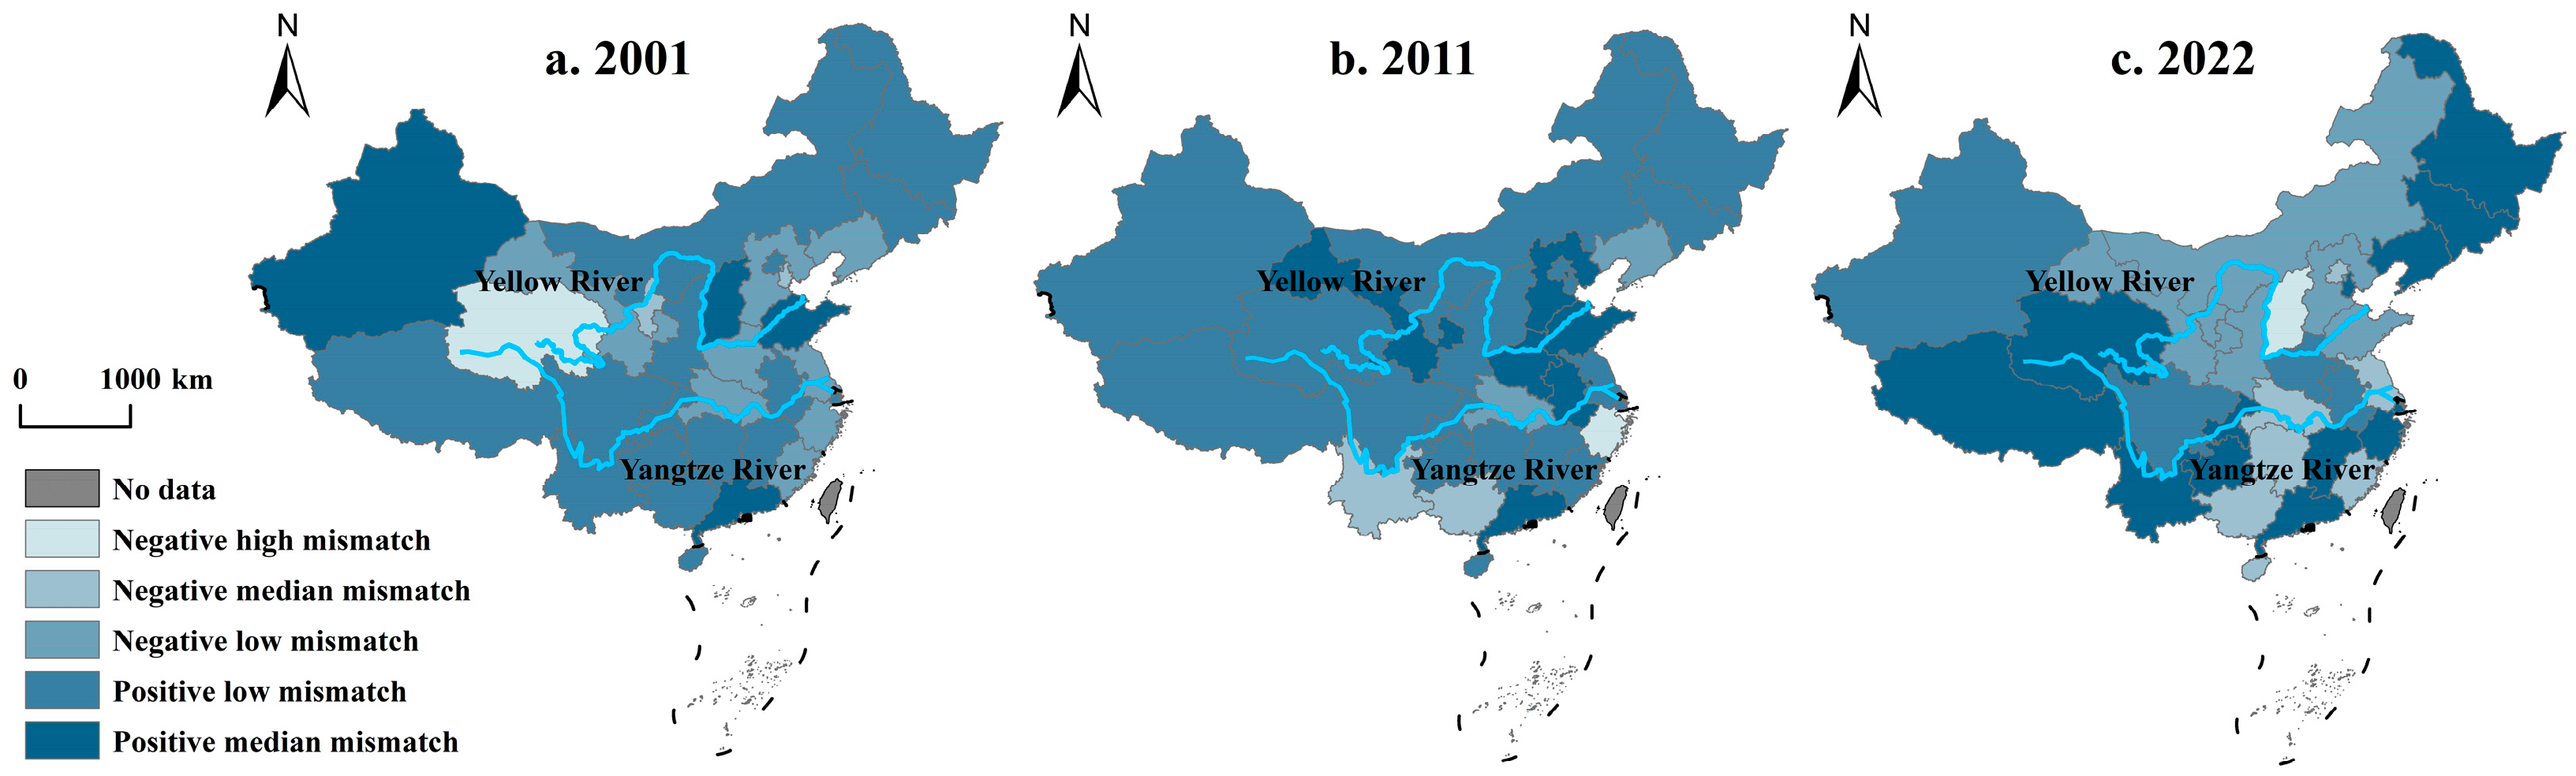
3.2.1. Analysis of Spatial Mismatch Patterns

As shown in Figure 5, the absolute values of the spatial dislocation index between the Chinese ETFPCLU, EC, and TC during the sample period range from 0 to 0.4. The spatial distributions of the ETFPCLU, EC, and TC demonstrate a high degree of similarity. According to the trend analysis, the spatial misalignment between ETFPCLU and EC initially increased before gradually decreasing over the study period. In contrast, the spatial misalignment between ETFPCLU and TC followed a fluctuating upward trajectory. Notably, the spatial mismatch between the ETFPCLU and EC was greater than that with TC in 2001 and 2011, while the reverse was true in 2022.
As illustrated in Figure 6, the spatial misalignment between the ETFPCLU and EC in China during the sample period is primarily characterized by low to median mismatch types, indicating a high similarity in their spatial distributions. Among the high mismatch types, in 2011, only Zhejiang Province exhibited a negative high mismatch type, while Guizhou Province showed a positive high mismatch type; no provinces with high mismatch were identified in 2001 or 2022. The number of negative mismatch provinces increased from 15 to 19 between 2001 and 2022, suggesting a rise in the provinces where EC has an inhibitory effect on the ETFPCLU. Spatially, in 2001, the positive mismatch provinces were mainly located in the Yangtze River Basin, the Yellow River Basin, and south China (notably Shaanxi, Hubei, and Guangdong Provinces), while negative mismatch provinces were predominantly found in northeast China, north China, and the western border provinces (such as Heilongjiang, Hebei, and Yunnan Provinces). By 2011, the positive mismatch provinces had shifted westward, now primarily located in the western region and south China (including Qinghai, Yunnan, and Guangdong Provinces), while negative mismatch provinces concentrated in the area north of the Yangtze River (like Anhui, Shaanxi, and Liaoning Provinces). In 2022, positive mismatch provinces gradually concentrated in the Beijing-Tianjin-Hebei region and the area south of the Yangtze River, with a decreasing number of such provinces. Meanwhile, negative mismatch provinces expanded eastward, westward, and into northeast China.
Figure 7 demonstrates a pronounced spatial mismatch between Chinese ETFPCLU and TC throughout the study period. Notably, the number of provinces with median mismatch increased, while those with low mismatch declined from 2001 to 2022, indicating a decreasing trend in the spatial distribution of similarity between the two metrics. In each of the years 2001, 2011, and 2022, there was one province classified as having a high mismatch: Qinghai Province in 2001, Zhejiang Province in 2011, and Shanxi Province in 2022, all of which are negative high-mismatch types. From 2001 to 2022, the number of provinces with positive mismatch rose from 20 to 26 before decreasing to 17. Conversely, provinces with negative mismatch decreased from 11 to 5 and then increased to 14. This suggests that most provinces have benefited from TC, positively impacting the ETFPCLU. Spatially, in 2001, positive mismatch provinces were primarily located in the western region (such as Shaanxi, Sichuan, and Tibet), while negative mismatch provinces were concentrated in the eastern coastal areas (including Jiangsu, Zhejiang, and Fujian). By 2011, positive mismatch provinces shifted north of the Yangtze River, with provinces like Qinghai, Gansu, and Henan transitioning from negative to positive mismatch. Negative mismatch provinces remained predominantly in the northern regions, while positive mismatch provinces were also concentrated north of the Yangtze River. Temporally, 2022 observations revealed that provinces demonstrating positive mismatches were predominantly clustered in western and northeastern zones, albeit with a reduced number. Conversely, provinces demonstrating negative mismatch expanded notably within the Yellow River’s mid-lower basins and the Yangtze River’s central reaches. Spatially, provinces in China exhibiting positive ETFPCLU-TC misalignment are predominantly clustered within western territories, central zones, and the Yangtze River’s mid-reach basins.

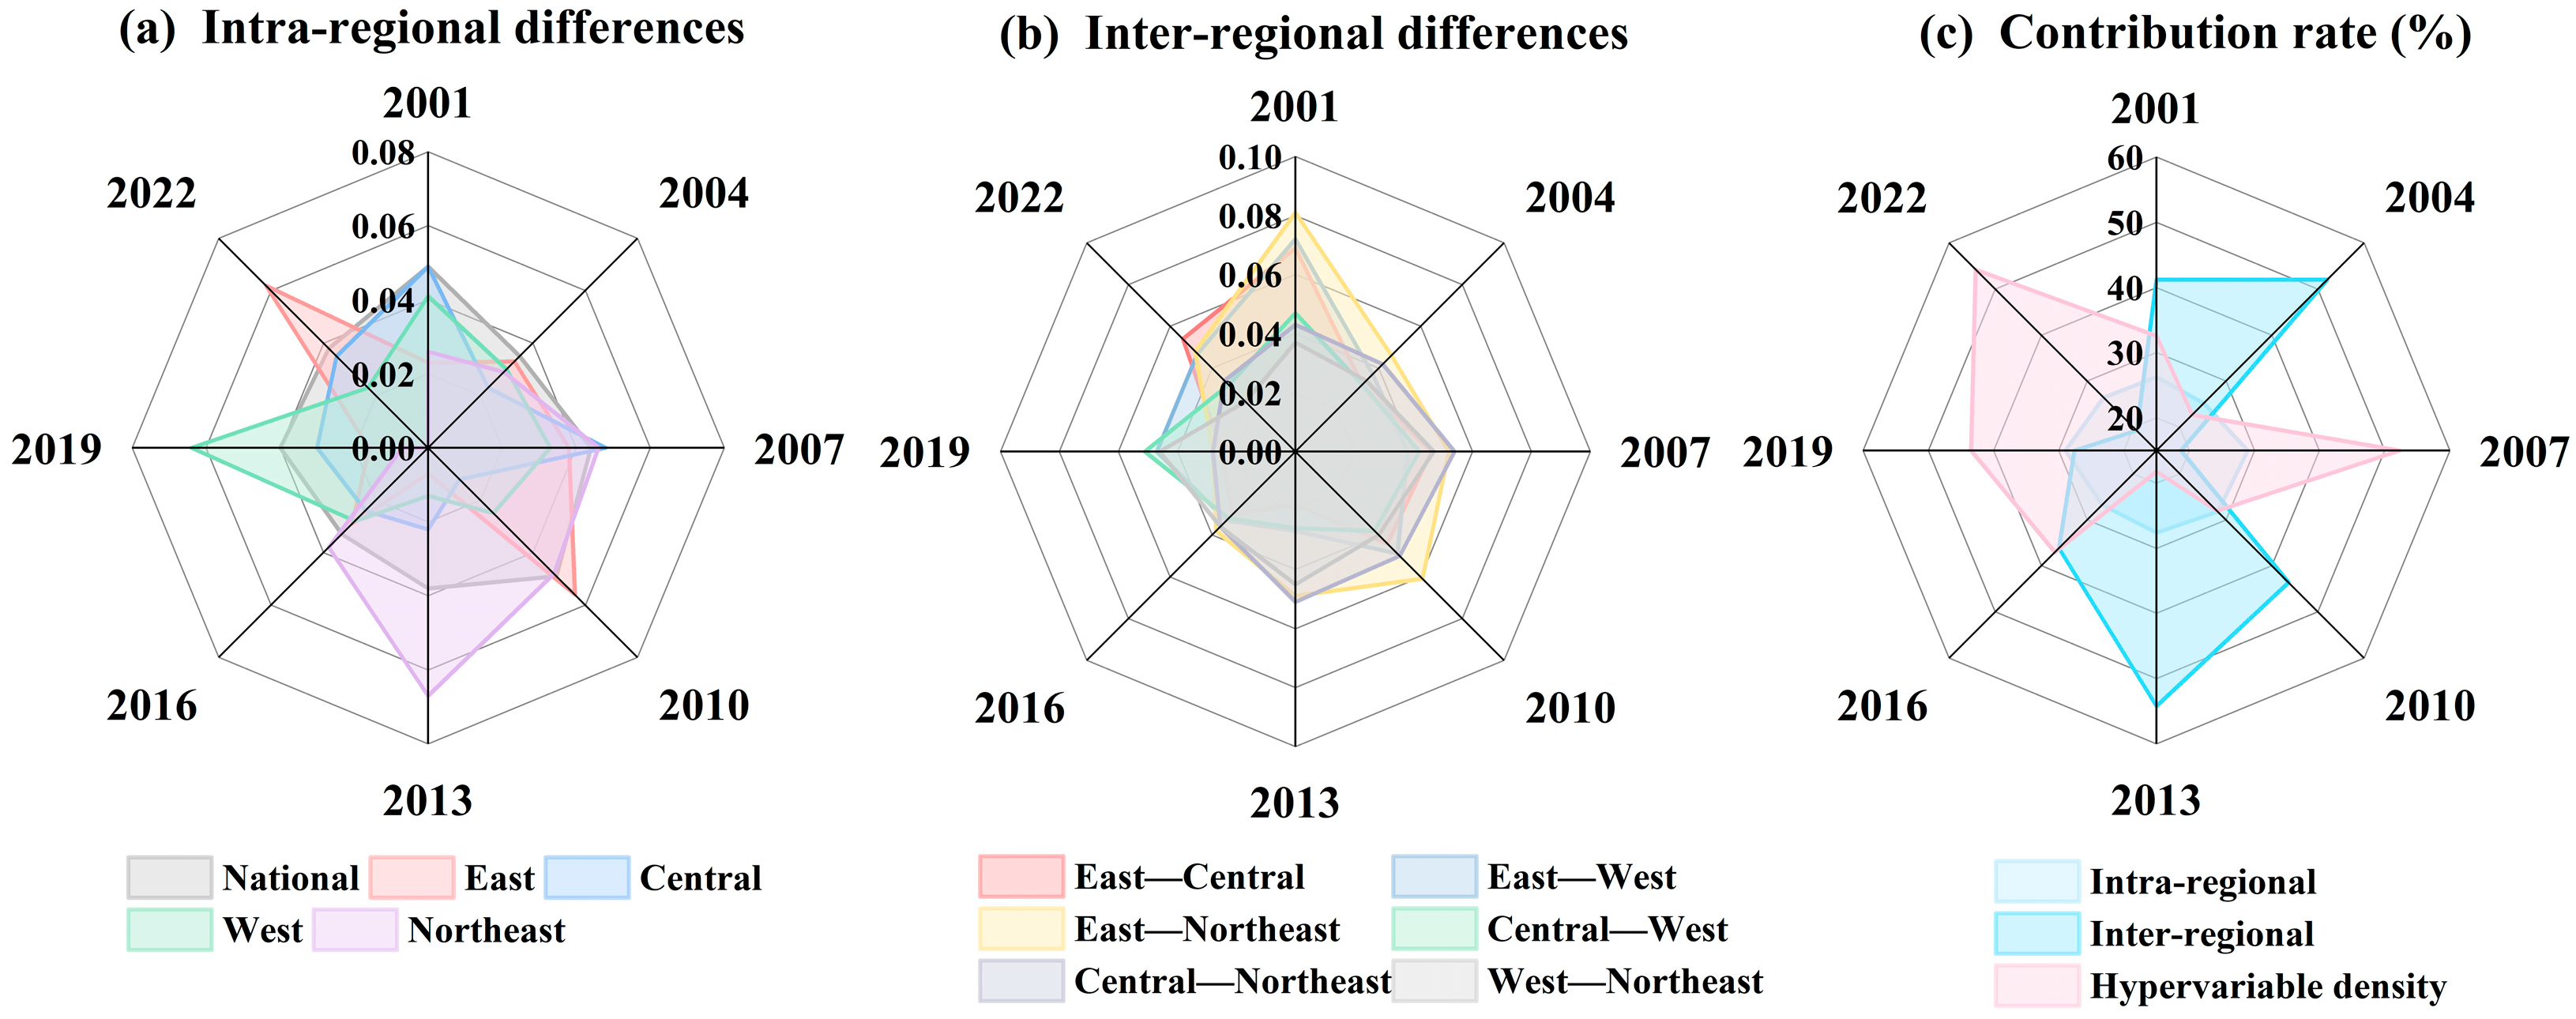
3.2.2. Characterization of Regional Differences

Figure 8 reveals that the ETFPCLU variation followed a cyclical rise-and-fall pattern throughout the study period. The average Gini coefficient for this period is 0.045, which decreased from 0.049 to 0.038—a decline of 22.42%. The findings reveal a consistent narrowing of regional ETFPCLU differences across China during the research period.
Regarding intra-regional disparities, the eastern region manifested the highest disparity level, registering a mean Gini coefficient of 0.040. Subsequent rankings included the central and northeastern regions, with mean coefficients of 0.035 and 0.033, respectively, while the western region demonstrated the most minimal intra-regional variation, with mean coefficients of 0.029. Temporally, excluding the eastern region, where marked divergence in ETFPCLU persists, disparities across central, western, and northeastern regions have progressively diminished, thereby mitigating spatial imbalances.
Regarding inter-regional differences, the greatest degree of variation was observed between the east and northeast regions, with an average Gini coefficient of 0.057. Conversely, the smallest degree of regional differences was found between the central and western regions, with an average Gini coefficient of 0.045. Regarding the evolution trend, there is a general convergence in interregional differences in the ETFPCLU across all regions. Significant reductions were observed in interregional Gini coefficients, with the east–central disparity contracting by 21.14%, while the east–west and east–northeast gaps diminished by 34.89% and 41.14%, respectively. Similarly, central–western disparities exhibited a 33.23% decline, while the central–northeast coefficient reduction measured 20.15%. West–northeast disparities exhibited a 34.76% decline.
Inter-regional disparities constitute the primary drivers of spatial differentiation in ETFPCLU, accounting for a mean contribution rate of 39.11%. Hypervariable density follows as the second-largest contributor, with a mean value of 33.44%, while intraregional differences account for the smallest contribution rate at 27.45%. Regarding shifts in the contribution rates of decomposition terms, the hypervariable density term exhibited the most pronounced rise, with its contribution rate escalating by 66.63%. Conversely, the increase in the contribution rate within regions was minimal, at just 0.77%, while the decrease in the contribution rate between regions was substantial, at 53.13%.

3.3. Convergence Analysis of the ETFPCLU

This study employed a convergence model to analyze whether regional differences in the ETFPCLU across the entire country and its four regions tend to converge or diverge over time. The goal is to explore the patterns of convergence in the ETFPCLU.

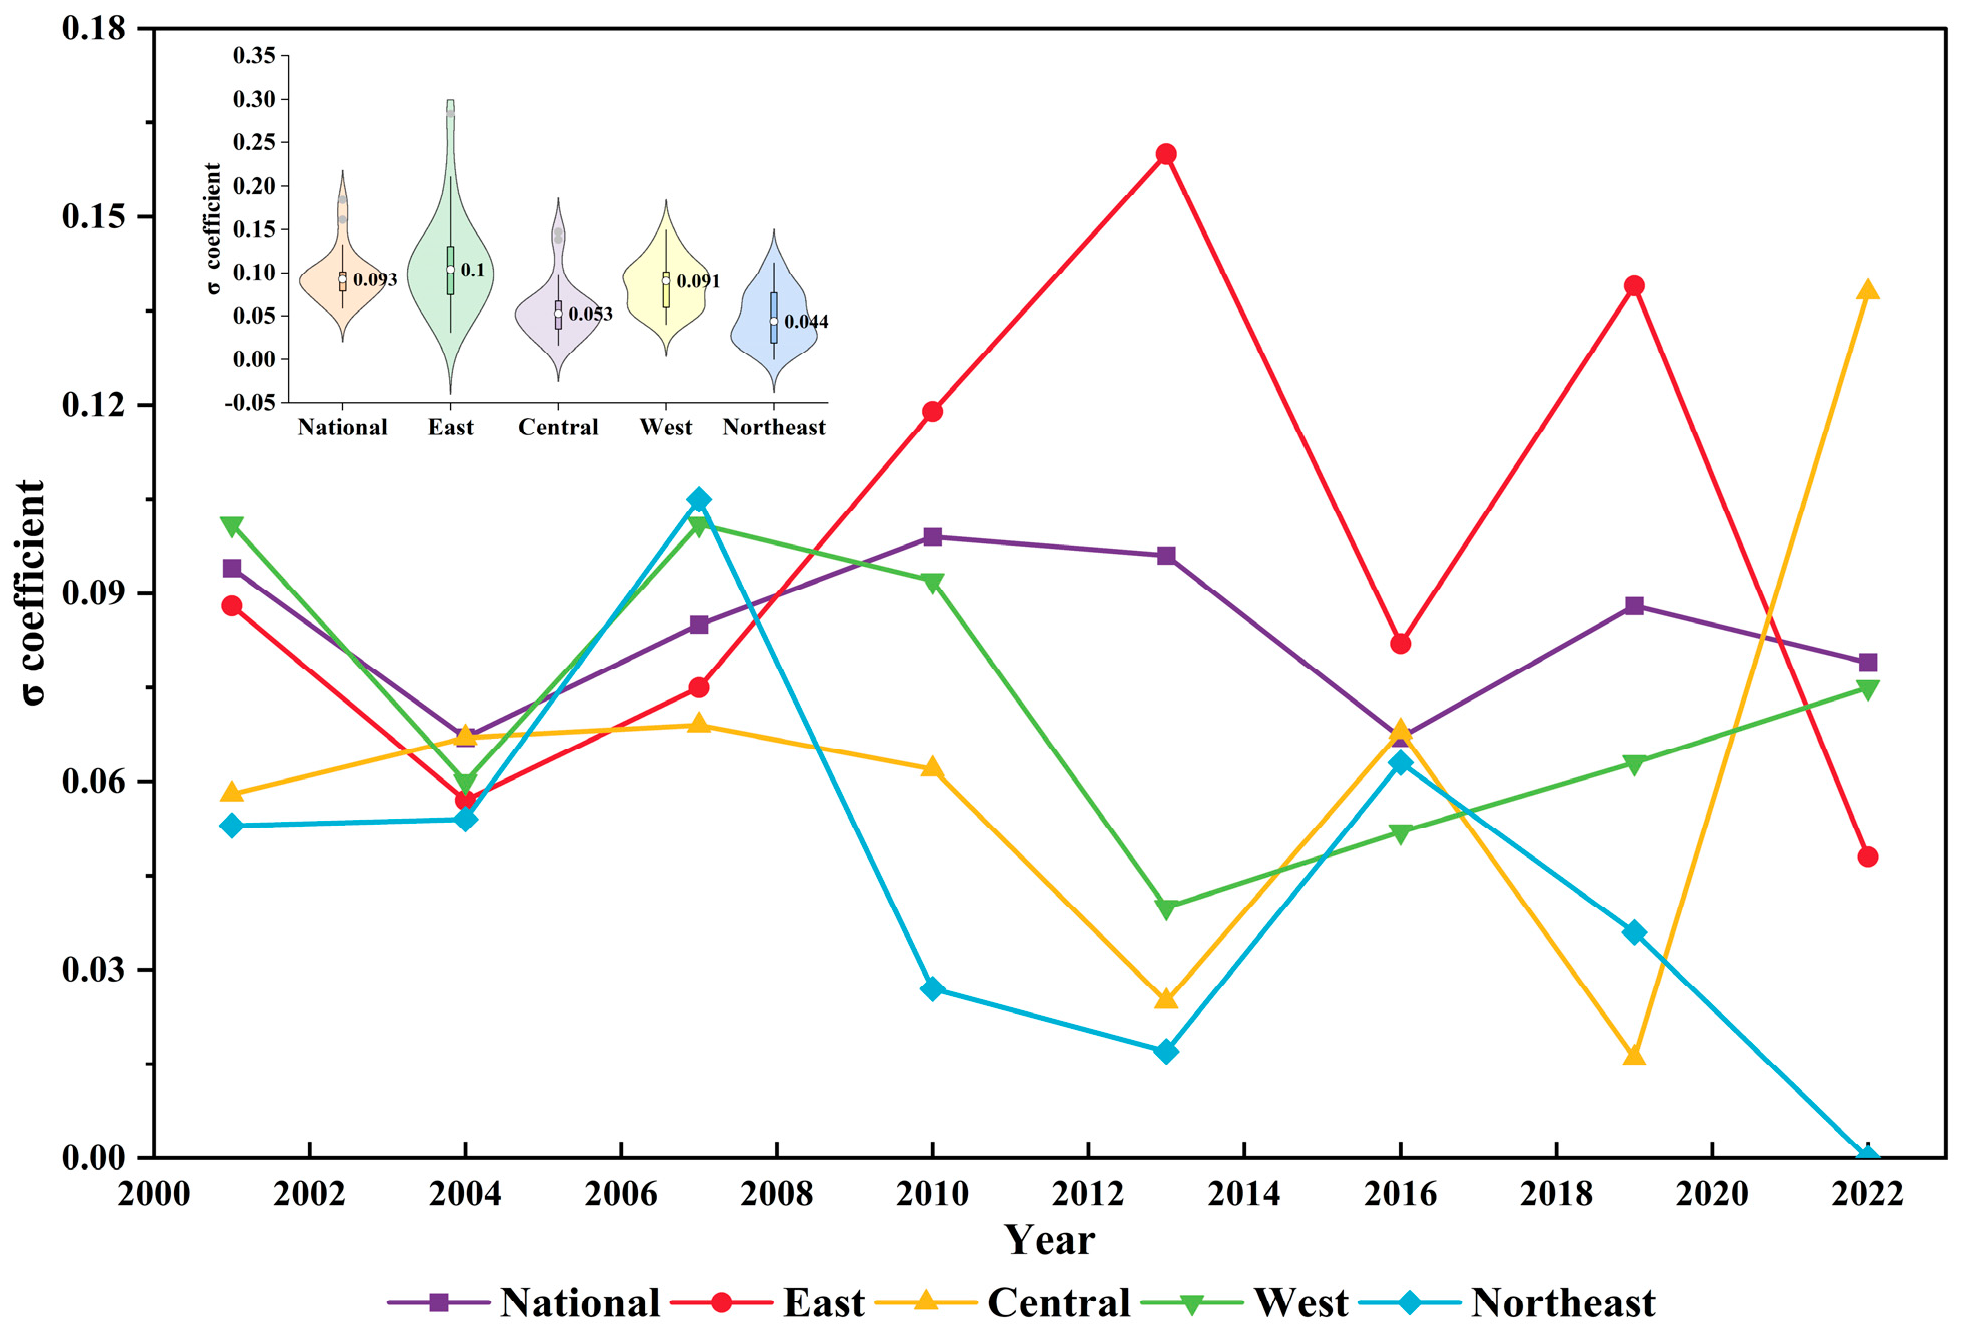
3.3.1. σ-Convergence

Figure 9 delineates the σ-convergence test outcomes of ETFPCLU at both the national level and its four primary regional subdivisions over the temporal span of 2001–2022. At the national level, the σ coefficient for ETFPCLU generally exhibits an ‘M’-shaped fluctuating and decreasing trend, indicating σ-convergence. This suggests that internal differences in ETFPCLU among provinces have gradually narrowed over time. The analysis can be divided into two phases, with 2011 serving as a critical turning point. From 2001 to 2011, the σ coefficient displayed a characteristic pattern of “long rise and short fall”, increasing from 0.094 to 0.184. In contrast, from 2012 to 2022, the σ coefficient showed a slowly fluctuating and decreasing trend.
Regionally level analyses demonstrate that vertical comparative assessments of σ coefficients in the eastern, western, and northeastern regions exhibited oscillatory declines across the observational timeframe, providing empirical evidence for σ-convergence dynamics. In contrast, the central region exhibited a ‘U’-shaped upward trend, characterized by increasing dispersion. This empirically substantiates that interprovincial ETFPCLU disparity within eastern, western, and northeastern regions is progressively attenuating. Conversely, the central region manifests a persistent divergence trajectory in provincial-level discrepancies. Furthermore, compared with the central and western regions, the convergence speed of ETFPCLU in the eastern region is faster, which is consistent with the convergence conclusion of Zhuang et al. (2022) [70]. In horizontal comparisons, the mean σ coefficient associated with ETFPCLU demonstrates its highest values in the eastern region. This suggests a comparatively greater degree of variability in ETFPCLU across the eastern region relative to other geographic zones. On the other hand, the northeastern region recorded the lowest mean σ coefficient, reflecting a more balanced distribution of ETFPCLU among its provinces.

3.3.2. β-Convergence

Table 4 outlines the findings from absolute and conditional β-convergence evaluations for the ETFPCLU, with analyses executed on a nationwide scope and for the four regions. Columns with odd numbers correspond to outcomes from the absolute β-convergence evaluations, whereas even-numbered columns detail outcomes derived from the conditional β-convergence analysis. Analytical outcomes from the absolute β-convergence assessments demonstrate that the β coefficients associated with ETFPCLU, measured nationally and within each of the four principal regions, exhibit statistically negative values at the 1% significance level. This implies the presence of absolute β-convergence, reflecting a “catching-up effect” where provinces with lower ETFPCLU progressively narrow gaps with their more developed counterparts. Analysis reveals sustained national prioritization of food security and arable land conservation policies over the observed period. It has consistently highlighted the construction of an arable land protection system in the No.1 document of the Central Government, gradually establishing and improving a “trinity” protection system focused on the quantity, quality, and ecology of cultivated land. Additionally, nationwide institutions for monitoring and protecting arable land quality, as well as for promoting agricultural technology, have been developed. This national system has actively facilitated the flow of resources in arable land utilization. As a result, the application, popularization, and dissemination of relevant ecological protection technologies have effectively narrowed the gap in the ETFPCLU. Findings from the conditional β-convergence assessments further demonstrate that nationally and across all four regions, the ETFPCLU β coefficients remain statistically negative at the 1%, thereby confirming the existence of conditional β-convergence. This suggests that ETFPCLU, when examined nationally and across the four regions, is projected to converge toward steady-state equilibria across extended temporal horizons. This trajectory emerges as an influence of disparities in economic development, spatial heterogeneity in agricultural resource allocations, and topographic characteristics inherent to each regional context.

4. Discussion

The ETFPCLU provides a clearer approach to balancing agricultural growth with environmental and resource limits. Unlike traditional TFP methods, which often misjudge efficiency by ignoring environmental costs, this framework offers more accurate assessments. A review of China’s provincial data (2000–2022) shows distinct regional differences and periodic shifts in ETFPCLU performance. Moreover, the synergistic effects of EC and TC have yet to be fully realized. This finding not only enhances our understanding of the complexities involved in agricultural green transformation but also provides a scientific basis for optimizing cultivated land use patterns. Furthermore, it underscores the necessity of reconstructing the efficiency evaluation system in the context of agricultural green transformation.
Traditional TFP analysis mainly measures economic outputs but ignores two critical factors: land use for farming and environmental impacts, like pollution from agriculture. This oversight can lead to systematic biases in efficiency evaluation [71,72]. To align with real-world farming conditions, this study added environmental impacts like carbon emissions and water pollution to its evaluations—factors often missed in traditional efficiency assessments. Simultaneously, recognizing the positive externality characteristics of cultivated land ecosystems, carbon sinks are introduced as desired outputs [13,27]. The results show that this method better accounts for both environmental health and economic gains in cultivated land management. Improving this method also helps optimize cultivated land use efficiency measurement, shifting the focus from just limiting environmental harm to actively using eco-friendly practices. This approach provides theoretical support for constructing a sustainable use evaluation system for cultivated land resources and serves as a valuable reference for international comparative research in related fields. The study’s results indicate that the increase in the ETFPCLU is influenced by geographic location, agricultural resource endowment, and the level of economic development. Geographic location affects the ETFPCLU through natural conditions and regional policies. Natural features like land shape, weather patterns, soil quality, and water availability shape farmland output. At the same time, government actions like cultivated land protection and farmer subsidies influence financial decisions and environmental limits in agricultural land use [31,73,74]. For example, the northeastern black soil region exhibits high cultivated land use efficiency due to its fertile soil and favorable climatic conditions. However, the region also faces environmental challenges like fertile soil loss and erosion [75]. The availability of farming resources strongly shapes agricultural productivity. Using water, land, labor, and funding more effectively boosts both crop yields and operational efficiency [76]. Additionally, the heterogeneity of agricultural resource endowments can lead to differences in technological adaptation, largely reflected in regional variations in resource availability, food production demands, and how actively communities adopt new farming tools. The level of economic development impacts the ETFPCLU through technological progress, industrial structure adjustments, and shifts in market demand. Technological progress serves as a core driving force for enhancing the ETFPCLU; economically developed regions can more rapidly introduce and apply new technologies, improving both production efficiency and ecological benefits. Conversely, economically underdeveloped regions may lag in technology adoption due to funding and talent constraints [77]. As the economy develops, the proportion of agriculture in the regional economy has gradually declined, yet the ecological function of agriculture has become increasingly important [78,79]. Therefore, rationally adjusting the agricultural industry structure and developing ecological and green agriculture are crucial for enhancing the ETFPCLU. Additionally, as consumer demand grows for green and organic farm products, agricultural practices must shift toward sustainable methods. This transition helps meet market expectations while reducing environmental impacts.
While this study improved measurement tools and research methods, some limitations remain. Future work should better align the ETFPCLU framework with the UN’s Zero Hunger goals (SDG 2). Researchers should also create a dual-scale analysis framework to share insights from China’s sustainable land use practices. At the national level, studies need to analyze how climate change, technology advances, and policies affect ETFPCLU over time through scenario modeling. Moreover, based on China’s national conditions, researchers should learn from the experiences of developed countries in enhancing ecological TFP and explore localized strategies for improving it. At the micro level, farmers are the key players in cultivated land use, and their behavioral choices directly influence changes in the ETFPCLU. Therefore, research should focus on the production behaviors, resource use efficiency, and ecological awareness of farmers to investigate how these micro-level behaviors affect the ETFPCLU.

5. Conclusions and Policy Recommendations

5.1. Conclusions

Investigating ETFPCLU dynamics proves essential for identifying a sustainable utilization path of cultivated land resources. The main research conclusions of this article include the following three aspects.
(1)
Regarding time-series characteristics, the Chinese ETFPCLU exhibited an overall growth trend during the sample period. This growth has primarily been driven by advancements in cultivated land ecological technology, with the contribution of ecological technical efficiency being relatively limited. Significant spatial imbalances exist in the ETFPCLU across China’s four major regions. In recent years, most provinces have demonstrated weak effective growth in the ETFPCLU, largely due to a reliance on a single-wheel drive mode of technical efficiency.
(2)
Regarding spatial characteristics, the distribution of China’s ETFPCLU resembles that of EC and TC. The regional gap in the ETFPCLU has generally narrowed over the sample period. Notably, the spatial mismatch between ETFPCLU and EC is predominantly a low-median mismatch type, while the spatial mismatch with TC indicates an increasing number of median-mismatch provinces and a decreasing number of low-mismatch provinces. Notably, with the exception of the eastern region, intra-regional disparities in ETFPCLU have been decreasing, and inter-regional differences in ETFPCLU across all regions exhibit a convergence trend. These inter-regional variations constitute the predominant driver of disparities between areas.
(3)
Regarding convergence characteristics, robust empirical evidence of σ-convergence in ETFPCLU is detected throughout China and its predominant regions over the analyzed timeframe, with findings empirically validating the coexistence of absolute and conditional β-convergence manifestations. The σ value of the ETFPCLU in China shows an ‘M’-shaped fluctuating and decreasing trend, reflecting a ‘catching-up effect’ of lagging provinces toward developed provinces. Overall, there is a tendency for the ETFPCLU to converge toward its own steady-state level across the country and within each province across the four regions.

5.2. Policy Recommendations

To this end, the following strategic interventions are proposed:
Firstly, a synergistic strategy should be implemented to strengthen technological innovation and improve technological efficiency, creating a comprehensive system encompassing research and development (R&D), transformation, and application. Regarding technological innovation, it is essential to enhance the R&D mechanism for cultivated land utilization technology. This can be achieved by establishing an industry–university–research collaborative innovation platform, where enterprises take the lead and universities and research institutes provide support. Regarding efficiency improvement, a differentiated agricultural technology promotion list should be developed based on the resource endowments and ecological characteristics of different regions.
Secondly, to ensure farmland resources are used effectively, policies for protecting and developing cultivated land must account for local conditions. Eastern regions should prioritize efficient farmland use while protecting local ecosystems. This includes vigorously developing ecological and urban agriculture and enhancing the monitoring and upgrading of cultivated land quality. The central region, a vital grain-producing area in China, needs to focus on constructing high-standard farmland and implementing measures to prevent and control agricultural surface pollution. In the western region, adopting varied restoration methods can improve farmland’s natural benefits while supporting healthier ecosystems. Northeast China, known for its extensive black soil, should establish a linkage system between black soil protection projects and ecological compensation.
Thirdly, a mechanism for coordinated development of ecological regions concerning cultivated land use should be established to enhance synergy and cooperation in inter-regional cultivated land protection. First, it is essential to improve top-level design by building an inter-regional cultivated land protection coordination platform and formulating unified ecological protection red lines and cultivated land quality control standards. Second, the compensation mechanism should be innovated to provide economic compensation to regions that undertake greater cultivated land protection responsibilities, facilitating economic feedback from ecological beneficiary areas to the protected areas. Finally, authorities should establish joint enforcement programs to strengthen cross-regional collaboration in farmland protection.

Author Contributions

Conceptualization, S.L. and X.C.; methodology, S.L. and G.D.; resources, S.L.; software, S.L.; visualization, S.L.; formal analysis, Y.W., G.D. and X.C.; data curation, S.L. and G.D.; writing—original draft preparation, S.L.; writing—review and editing, Y.W. and X.C.; supervision, Y.W., G.D. and X.C.; project administration, Y.W.; funding acquisition, Y.W. and X.C. All authors have read and agreed to the published version of the manuscript.

Funding

This research was funded by the National Natural Science Foundation Project (No. 42271285), The Agricultural Science and Technology Innovation Program (No. 10-IAED-07-2025), the Cooperation Project between the Chinese Academy of Engineering and Local Authorities (No. 2024-GS-XZ-03), the Special Fund for Basic Scientific Research Business Expenses of Central-level Public Welfare Research Institutes (No. 1610052025039), and the Basic Scientific Research Business Expenses of Central-level Public Welfare Research Institutes (No. Y2025CY34).

Institutional Review Board Statement

Not applicable.

Data Availability Statement

The data that are presented in this study are available from the corresponding author upon request. The data are not publicly available due to privacy restrictions.

Conflicts of Interest

The authors declare no conflicts of interest.

References

  1. Cai, Y.L.; Huo, Y.L. Reevaluating Cultivated Land in China: Method and Case Studies. Acta. Geogr. Sin. 2006, 10, 1084–1092. [Google Scholar]
  2. Yang, G.Q.; Sun, X.Y. China’s Land Consolidation Policies from the Perspective of Supply-demand and Resilience: Changes, Evolutive Logic and Policy Orientation. Rural. Econ. 2024, 3, 44–53. [Google Scholar]
  3. Qstheory.cn. Xi Jinping: Hold High the Great Banner of Socialism with Chinese Characteristics and Unite to Strive for the Comprehensive Construction of a Modern Socialist Country—Report at the 20th National Congress of the Communist Party of China. Available online: http://www.qstheory.cn/yaowen/2022-10/25/c_1129079926.htm (accessed on 16 October 2022).
  4. Xinhua News Agency. The Third National Land Resource Survey. Available online: https://www.gov.cn/xinwen/2021-08/26/content_5633497.htm (accessed on 26 August 2021).
  5. Ministry of Agriculture of the People’s Republic of China. Bulletin on the Quality Grades of Cultivated Land in China in 2019. Available online: http://www.ntjss.moa.gov.cn/zcfb/202006/P020200622573390595236.pdf (accessed on 6 May 2020).
  6. Zhang, B.Y.; Chen, T.L.; Wang, B. Effects of Long-term Uses of Chemical Fertilizers on Soil Quality. Chin. Agr. Sci. Bull. 2010, 26, 182–187. [Google Scholar]
  7. Kong, X.B.; Chen, W.G.; Dang, Y.X. Current Situation, Challenges and Transformation of Cultivated Land Protection in China. J. Soc. Sci. Hunan Norm. Univ. 2023, 52, 31–41. [Google Scholar]
  8. Nie, Y. Analysis of the Contribution of Cultivated Land to China’s Food Security. Economist 2015, 01, 83–93. [Google Scholar]
  9. Chen, Y.L.; Liu, Y. Market-based Allocation of Data Factors and Total Factor Productivity: Evidence from the Establishment of Data Trading Platforms. J. Zhongnan Univ. Econ. Law 2024, 6, 131–143. [Google Scholar] [CrossRef]
  10. Schaltegger, S.; Sturm, A. Ökologische rationalität: Ansatzpunkte zur ausgestaltung von ökologieorientierten managementinstrumenten. Die Unternehm. 1990, 44, 273–290. [Google Scholar]
  11. Yang, B.; Wang, Z.; Zou, L.; Zou, L.L.; Zhang, H.W. Exploring the eco-efficiency of cultivated land utilization and its influencing factors in China’s Yangtze River Economic Belt, 2001–2018. J. Environ. Manag. 2021, 294, 112939. [Google Scholar] [CrossRef]
  12. Reith, C.C.; Guidry, M.J. Eco-efficiency analysis of an agricultural research complex. J. Environ. Manag. 2003, 68, 219–229. [Google Scholar] [CrossRef]
  13. Cao, W.; Zhou, W.; Wu, T.; Wang, X.C.; Xu, J.H. Spatial-temporal characteristics of cultivated land use eco-efficiency under carbon constraints and its relationship with landscape pattern dynamics. Ecol. Indic. 2022, 141, 109140. [Google Scholar] [CrossRef]
  14. Coluccia, B.; Valente, D.; Fusco, G.; Leo, F.D.; Porrini, D. Assessing agricultural eco-efficiency in Italian Regions. Ecol. Indic. 2020, 116, 106483. [Google Scholar] [CrossRef]
  15. Fan, Y.; Ning, W.; Liang, X.; Wang, L.; Lv, L.; Li, Y.; Wang, J. Spatial—Temporal Characteristics and Influencing Factors of Eco-Efficiency of Cultivated Land Use in the Yangtze River Delta Region. Land 2024, 13, 219. [Google Scholar] [CrossRef]
  16. Li, S.; Mu, N.; Ren, Y.; Glauben, T. Spatiotemporal characteristics of cultivated land use eco-efficiency and its influencing factors in China from 2000 to 2020. J. Arid. Land 2024, 16, 396–414. [Google Scholar] [CrossRef]
  17. Barbosa, J.A.; Bragança, L.; Mateus, R. Assessment of land use efficiency using BSA tools: Development of a new index. J. Urban. Plan. Dev. 2015, 141, 04014020. [Google Scholar] [CrossRef]
  18. Ke, X.; Zhang, Y.; Zhou, T. Spatio-temporal characteristics and typical patterns of eco-efficiency of cultivated land use in the Yangtze River Economic Belt, China. J. Geogr. Sci. 2023, 33, 357–372. [Google Scholar] [CrossRef]
  19. Feng, L.; Lei, G.; Nie, Y. Exploring the eco-efficiency of cultivated land utilization and its influencing factors in black soil region of Northeast China under the goal of reducing non-point pollution and net carbon emission. Environ. Earth Sci. 2023, 82, 94. [Google Scholar] [CrossRef]
  20. Picazo-Tadeo, A.J.; Gómez-Limón, J.A.; Reig-Martínez, E. Assessing farming eco-efficiency: A data envelopment analysis approach. J. Environ. Manag. 2011, 92, 1154–1164. [Google Scholar] [CrossRef]
  21. Yin, Y.; Hou, X.; Liu, J.; Zhou, X.; Zhang, D.J. Detection and attribution of changes in cultivated land use ecological efficiency: A case study on Yangtze River Economic Belt, China. Ecol. Indic. 2022, 137, 108753. [Google Scholar] [CrossRef]
  22. Zhu, Q.; Liu, C.; Li, X.; Zhou, D.Q. The total factor carbon emission productivity in China’s industrial Sectors: An analysis based on the global Malmquist-Luenberger index. Sustain. Energy Technol. Assess. 2023, 56, 103094. [Google Scholar] [CrossRef]
  23. Yang, S.; Shen, J.; Deng, X.; Lu, K.; Liu, Z.R.; Cheng, B.Q. Digital economy revolutionizing green total factor productivity in construction industry. Technol. Forecast. Soc. Change 2024, 206, 123564. [Google Scholar] [CrossRef]
  24. Guo, Y.; Tong, L.; Mei, L. Spatiotemporal characteristics and influencing factors of agricultural eco-efficiency in Jilin agricultural production zone from a low carbon perspective. Environ. Sci. Pollut. Res. 2022, 29, 29854–29869. [Google Scholar] [CrossRef] [PubMed]
  25. Fan, Z.; Deng, C.; Fan, Y.; Zhang, P.W.; Lu, H. Spatial-temporal pattern and evolution trend of the cultivated land use eco-efficiency in the National Pilot Zone for ecological conservation in China. Int. J. Environ. Res. Public Health 2021, 19, 111. [Google Scholar] [CrossRef] [PubMed]
  26. Kuang, B.; Lu, X.; Zhou, M.; Chen, D.L. Provincial cultivated land use efficiency in China: Empirical analysis based on the SBM-DEA model with carbon emissions considered. Technol. Forecast. Soc. Change 2020, 151, 119874. [Google Scholar] [CrossRef]
  27. Liao, J.J.; Yu, C.Y.; Feng, Z.; Zhao, H.F.; Wu, K.N.; Ma, X.Y. Spatial differentiation characteristics and driving factors of agricultural eco-efficiency in Chinese provinces from the perspective of ecosystem services. J. Clean. Prod. 2021, 288, 125466. [Google Scholar] [CrossRef]
  28. Su, X.; Fan, Y.; Wen, C. Systematic coupling and multistage interactive response of the urban land use efficiency and ecological environment quality. J. Environ. Manag. 2024, 365, 121584. [Google Scholar] [CrossRef]
  29. Geng, Y.; Li, X.; Chen, J. Integration of land use resilience and efficiency in China: Analysis of spatial patterns, differential impacts on SDGs, and adaptive management strategies. Appl. Geogr. 2025, 175, 103490. [Google Scholar] [CrossRef]
  30. Wang, Y.; Yang, S.; Ahmad, F.; Chandio, A.A. Agricultural eco-efficiency and sustainable agricultural development influential factors and heterogeneities: Exclusive evidence from Chinese cities. Environ. Dev. Sustain. 2024, 1–25. [Google Scholar] [CrossRef]
  31. Hou, X.H.; Liu, J.M.; Zhang, D.J.; Zhao, M.J.; Xia, C.Y. Impact of urbanization on the eco-efficiency of cultivated land utilization: A case study on the Yangtze River Economic Belt, China. J. Clean. Prod. 2019, 238, 117916. [Google Scholar] [CrossRef]
  32. National Bureau of Statistics of the People’s Republic of China. The Classification Method of Eastern, Central and Northeastern Regions. Available online: https://www.stats.gov.cn/zt_18555/zthd/sjtjr/dejtjkfr/tjkp/202302/t20230216_1909741.htm (accessed on 13 June 2011).
  33. Wang, W.L.; Wang, J.L.; Wu, H.T. The impact of energy-consuming rights trading on green total factor productivity in the context of digital economy: Evidence from listed firms in China. Energy Econ. 2024, 131, 107342. [Google Scholar] [CrossRef]
  34. Zhai, X.Q.; Xue, R.; He, B.; Yang, D.; Pei, X.Y.; Li, X.; Shan, Y.L. Dynamic changes and convergence of China’s regional green productivity: A dynamic spatial econometric analysis. Adv. Clim. Change Res. 2022, 13, 266–278. [Google Scholar] [CrossRef]
  35. Tone, K.; Tsutsui, M. An epsilon-based measure of efficiency in DEA—A third pole of technical efficiency. Eur. J. Oper. Res. 2010, 207, 1554–1563. [Google Scholar] [CrossRef]
  36. Xia, W.; Ruan, Z.; Ma, S.; Zhao, J.; Yan, J.L. Can the digital economy enhance carbon emission efficiency? Evidence from 269 cities in China. Int. Rev. Econ. Financ. 2025, 97, 103815. [Google Scholar] [CrossRef]
  37. Oh, D. A global Malmquist-Luenberger productivity index. J. Prod. Anal. 2010, 34, 183–197. [Google Scholar] [CrossRef]
  38. Yan, J.; Jie, Q. Mechanisms of policy intervention for China’s transformation of the low-carbon economy. J. Clean. Prod. 2025, 487, 144550. [Google Scholar] [CrossRef]
  39. Martin, R.W. Spatial mismatch and the structure of American metropolitan areas, 1970–2000. J. Regional. Sci. 2004, 44, 467–488. [Google Scholar] [CrossRef]
  40. Feng, Y.; Lv, X.; Tian, Y.; Zhuo, L.; Xue, J.Y.; Chen, Y.L. A study on the spatial differences between the tourism network attention and tourism flow in Shanghai, China. Heliyon 2024, 10, e31990. [Google Scholar] [CrossRef]
  41. Dagum, C. A new approach to the decomposition of the Gini income inequality ratio. Empir. Econ. 1997, 22, 515–531. [Google Scholar] [CrossRef]
  42. Zhan, X.; Zhao, Y.; Zhang, H.; Long, Y.H.; Shao, C.F. Spatiotemporal variation and regional disparities analysis of county-level sustainable development in China. Sustain. Prod. Consum. 2025, 57, 1–15. [Google Scholar] [CrossRef]
  43. Zhao, P.Y.; Lu, Z.G.; Kou, J.L.; Du, J. Regional differences and convergence of green innovation efficiency in China. J. Environ. Manag. 2023, 325, 116618. [Google Scholar] [CrossRef]
  44. Tiwari, A.K.; Nasir, M.A.; Shahbaz, M.; Raheem, I.D. Convergence and club convergence of CO2 emissions at state levels: A nonlinear analysis of the USA. J. Clean. Prod. 2020, 288, 125093. [Google Scholar] [CrossRef]
  45. Xia, R.; Wei, D.Q.; Jiang, H.T.; Yi, D.; Luo, X.Y.; Yin, J. Research on the coordinated development and convergence characteristics of China’s urban competitiveness and green total factor productivity. Ecol. Indic. 2024, 161, 111954. [Google Scholar] [CrossRef]
  46. Bai, P.W.; Xu, J. Capital Stockand the Rate of Return to Capital in the Three Industries and the Convergence Hypothesis in China: 1978–2013. China. Econ. Q. 2018, 17, 1171–1206. [Google Scholar]
  47. Yang, Z.Y.; Peng, L.W.; Yan, Z.F. Dynamic Evolution and Convergence Analysis of Green Developmentlevel of Freshwater Aquaculture in China: From the Perspective of Green Total Factor Productivity. J. Agro. Econ. 2023, 12, 57–77. [Google Scholar]
  48. Chen, Y.F.; Hao, G.; Chen, M.H. What drives urban land green use efficiency in China: A global meta-frontier Malmquist Index approach. Ecol. Indic. 2025, 175, 113550. [Google Scholar] [CrossRef]
  49. Li, Z.Q.; Ye, W.J.; Jiang, H.Y.; Song, H.Q.; Zheng, C.W. Impact of the eco-efficiency of food production on the water–land–food system coordination in China: A discussion of the moderation effect of environmental regulation. Sci. Total Environ. 2023, 857, 159641. [Google Scholar] [CrossRef]
  50. He, P.; Zhang, J.; Li, W. The role of agricultural green production technologies in improving low-carbon efficiency in China: Necessary but not effective. J. Environ. Manag. 2021, 293, 112837. [Google Scholar] [CrossRef]
  51. Jin, B.Y.; Cui, C.; Wen, L.; Shi, R.; Zhao, M.J. Regional differences and convergence of agricultural carbon efficiency in China: Embodying carbon sink effect. Ecol. Indic. 2024, 169, 112929. [Google Scholar] [CrossRef]
  52. Huang, J.; Han, W.; Zhang, Z.F.; Ning, S.S.; Zhang, X.L. The decoupling relationship between land use efficiency and carbon emissions in China: An analysis using the Socio-Ecological Systems (SES) framework. Land Use Policy 2024, 138, 107055. [Google Scholar] [CrossRef]
  53. Sun, X.T.; Zhao, Y.; Wang, Z.H. Promotion Path of Agricultural Eco-Efficiency Under the Background of Low Carbon Pilot Policy. Pol. J. Environ. Stud. 2023, 32, 755–771. [Google Scholar] [CrossRef]
  54. Zhai, R.Z.; Lou, Z.H. Chinese agricultural output and TFP: 1661–2019. Econ. Lett. 2022, 213, 110415. [Google Scholar] [CrossRef]
  55. Nuruzzaman, M.; Md, M.B.; Ravi, N. Diffuse soil pollution from agriculture: Impacts and remediation. Sci. Total Environ. 2025, 962, 178398. [Google Scholar] [CrossRef] [PubMed]
  56. Liu, Y.; Zou, L.; Wang, Y. Spatial-temporal characteristics and influencing factors of agricultural eco-efficiency in China in recent 40 years. Land Use Policy 2020, 97, 104794. [Google Scholar] [CrossRef]
  57. Lv, T.G.; Fu, S.F.; Zhang, X.M.; Hu, H.; Zhang, Y.W. Spatiotemporal evolution and convergence of agricultural eco-efficiency in the middle reaches of the Yangtze River. Phys. Chem. Earth Parts A B C 2023, 131, 103438. [Google Scholar] [CrossRef]
  58. Han, Z.Y.; Meng, Y.L.; Xu, J.; Wu, Y.; Zhou, Z.G. Temporal and Spatial Difference in Carbon Footprint of Regional Farmland Ecosystem—Taking Jiangsu Province as a Case. J. Agro-Environ. Sci. 2012, 31, 1034–1041. [Google Scholar]
  59. Schneider, J.M.; Delzeit, R.; Neumann, C.; Heimann, T.; Seppelt, R.; Schuenemann, F.; Söder, M.; Mauser, W.; Zabel, F. Effects of profit-driven cropland expansion and conservation policies. Nat. Sustain. 2024, 7, 1335–1347. [Google Scholar] [CrossRef]
  60. Adu, J.T.; Kumarasamy, M.V. Assessing non-point source pollution models: A review. Pol. J. Environ. Stud. 2018, 27, 1913–1922. [Google Scholar] [CrossRef]
  61. Cheng, K.; Pan, G.; Smith, P.; Luo, T.; Li, L.Q.; Zheng, J.W.; Zhang, X.H.; Han, X.J.; Yan, M. Carbon footprint of China’s crop production—An estimation using agro-statistics data over 1993–2007. Agr. Ecosyst. Environ. 2011, 142, 231–237. [Google Scholar] [CrossRef]
  62. Johnson, J.M.F.; Franzluebbers, A.J.; Weyers, S.L.; Reicosky, D.C. Agricultural opportunities to mitigate greenhouse gas emissions. Environ. Pollut. 2007, 150, 107–124. [Google Scholar] [CrossRef]
  63. Yun, T.; Zhang, J.; He, Y. Research on spatial-temporal characteristics and driving factor of agricultural carbon emissions in China. J. Integr. Agr. 2014, 13, 1393–1403. [Google Scholar]
  64. Chen, Y.; Miao, J.; Zhu, Z. Measuring green total factor productivity of China’s agricultural sector: A three-stage SBM-DEA model with non-point source pollution and CO2 emissions. J. Clean. Prod. 2021, 318, 128543. [Google Scholar] [CrossRef]
  65. Liu, T.; Shang, X.F.; Su, Y.Y.; Huo, J.J. Green Utilization Efficiency, Convergence, and Influencing Factors of Cultivated Land in Lower Yellow River Under “Double Carbon” Target. Bull. Soil. Water. Conserv. 2023, 43, 291–299. [Google Scholar]
  66. Chen, X.; Tzeng, S.J.; Wang, D. Green Productivity growth in Chinese Agriculture Industry—A novel approach and its empirical verification. Econ. Anal. Policy 2025, 86, 2001–2018. [Google Scholar] [CrossRef]
  67. Fang, L.; Hu, R.; Mao, H.; Chen, S.J. How crop insurance influences agricultural green total factor productivity: Evidence from Chinese farmers. J. Clean. Prod. 2021, 321, 128977. [Google Scholar] [CrossRef]
  68. Jiang, Y.K.; Han, G.H.; Yu, D. Digital finance and agricultural green total factor productivity: The mediating role of digital village development. Financ. Res. Lett. 2024, 67, 105948. [Google Scholar] [CrossRef]
  69. Addo, F.; Klaus, S. Transient and persistent technical efficiency and its determinants: The case of crop farms in Austria. Appl. Econ. 2022, 54, 2916–2932. [Google Scholar] [CrossRef]
  70. Zhuang, W.; Wang, Y.; Lu, C.C.; Chen, X. The green total factor productivity and convergence in China. Energy. Sci. Eng. 2022, 10, 2794–2807. [Google Scholar] [CrossRef]
  71. Koiry, S.; Huang, W. Do ecological protection approaches affect total factor productivity change of cropland production in Sweden? Ecol. Econ. 2023, 209, 107829. [Google Scholar] [CrossRef]
  72. Yue, S.; Shen, Y.; Yuan, J. Sustainable total factor productivity growth for 55 states: An application of the new malmquist index considering ecological footprint and human development index. Resour. Conserv. Recycl. 2019, 146, 475–483. [Google Scholar] [CrossRef]
  73. Shah, S.M.; Liu, G.; Yang, Q.; Wang, X.Q.; Casazza, M.; Agostinho, F.; Lombardi, G.V.; Giannetti, B.F. Emergy-based valuation of agriculture ecosystem services and dis-services. J. Clean. Prod. 2019, 239, 118019. [Google Scholar] [CrossRef]
  74. Liu, J.; Jin, X.; Xu, W.Y.; Sun, R.; Han, B.; Yang, X.H.; Gu, Z.M.; Xu, C.L.; Sui, X.Y.; Zhou, Y.K. Influential factors and classification of cultivated land fragmentation, and implications for future land consolidation: A case study of Jiangsu Province in eastern China. Land Use Policy 2019, 88, 104185. [Google Scholar] [CrossRef]
  75. Li, X.; Wu, K.N.; Yang, Q.J.; Hao, S.H.; Feng, Z.; Ma, J.L. Quantitative assessment of cultivated land use intensity in Heilongjiang Province, China, 2001–2015. Land Use Policy 2023, 125, 106505. [Google Scholar] [CrossRef]
  76. Zhang, J.Y.; Yang, F.; Duan, N.; Zheng, B.H.; Xiong, S.W.; Xu, Y.M. Spatial transition and obstacle factor diagnosis based on the evaluation of the quality of arable land use in plain Lake Areas: A case study of the Dongting Lake region. Ecol. Indic. 2024, 169, 112881. [Google Scholar] [CrossRef]
  77. Luo, Y.S.; Lu, Z.N.; Salman, M.; Song, S.F. Impacts of heterogenous technological innovations on green productivity: An empirical study from 261 cities in China. J. Clean. Prod. 2022, 334, 130241. [Google Scholar] [CrossRef]
  78. Unay-Gailhard, İ.; Bojnec, Š. The impact of green economy measures on rural employment: Green jobs in farms. J. Clean. Prod. 2019, 208, 541–551. [Google Scholar] [CrossRef]
  79. Valenzuela, V.G.; Holl, A. Growth and decline in rural Spain: An exploratory analysis. Eur. Plan. Stud. 2024, 32, 430–453. [Google Scholar] [CrossRef]
Figure 1. Thesis flowchart.
Agriculture 15 01172 g001
Figure 2. Study area.
Agriculture 15 01172 g002
Figure 3. Trends in the evolution of the ETFPCLU, EC, and TC from 2001 to 2022.
Agriculture 15 01172 g003
Figure 4. Spatial distribution of the GML index of the ETFPCLU in China.
Agriculture 15 01172 g004
Figure 5. Changes in the ETFPCLU and absolute values of spatial mismatch indices for EC and TC.
Agriculture 15 01172 g005
Figure 6. Characteristics of the spatial mismatch pattern of the ETFPCLU and EC in China.
Agriculture 15 01172 g006
Figure 7. Characteristics of the spatial mismatch pattern of the ETFPCLU and TC in China.
Agriculture 15 01172 g007
Figure 8. Gini coefficient and contribution rate of the ETFPCLU in China.
Agriculture 15 01172 g008
Figure 9. Results of the σ-convergence test for the ETFPCLU in the entire country and the four regions.
Agriculture 15 01172 g009
Table 1. Discriminant table for types of spatial mismatch index.
SMIPositiveNegative
High MismatchSMI > 1SMI ≤ −1
Medium Mismatch0.2 < SMI ≤ 1−1 < SMI ≤ −0.2
Low Misalignment0 < SMI ≤ 0.2−0.2 < SMI ≤ 0
Table 2. Indicator system for measuring the ETFPCLU.
IndicatorVariableVariable DescriptionUnit
InputCultivated land inputsTotal sown area of crops103 hm2
Labor inputsPrimary industry employees×(agricultural output value/agricultural, forestry, animal husbandry and fishery output value)104 person
Machinery inputsTotal power of agricultural machinery104 kw
Fertilizer inputsAgricultural fertilizer application quantity104 tons
Pesticide inputsPesticide usage104 tons
Agricultural film inputsAgricultural film usage104 tons
Irrigation inputsEffective irrigated area103 hm2
Energy inputsAgricultural diesel usageton
Desired outputEconomic outputsGross agricultural output value108 yuan
Social outputsTotal food production104 tons
Ecological outputsTotal carbon sinks on cultivated land104 tons
Non-desired outputCarbon emissions from cultivated landTotal carbon emissions from cultivated land104 tons
Cultivated land non-point source pollutionTotal non-point source pollution104 tons
Table 3. Economic coefficient and carbon absorption rate of cultivated land using major crops.
Crop Variety nCarbon Absorption Rate CEconomic Coefficient EMoisture Content M
Rice0.4140.450.12
Wheat 0.4850.40.12
Maize0.4710.40.13
Beans0.450.340.13
Potatoes0.4230.70.7
Table 4. β-Convergence Tests for the ETFPCLU.
VariableNationalEastCentralWestNortheast
(1)(2)(3)(4)(5)(6)(7)(8)(9)(10)
β−0.952 ***
(0.029)
−1.145 ***
(0.042)
−0.909 ***
(0.029)
−1.145 ***
(0.045)
−1.165 ***
(0.094)
−1.332 ***
(0.081)
−0.922 ***
(0.014)
−1.131 ***
(0.088)
−0.814 ***
(0.074)
−1.185 ***
(0.117)
α0.017 ***
(0.002)
−0.041 **
(0.016)
0.027 ***
(0.005)
−0.068 **
(0.030)
−0.002
(0.010)
−0.077 ***
(0.019)
0.015 ***
(0.002)
−0.034
(0.025)
0.0002
(0.006)
0.100
(0.041)
R20.4080.5900.2610.6230.4340.7800.4310.5950.1700.872
Number of Obs6826512202101321262642526663
Note: Values in parentheses are robust standard errors; *, **, and *** indicate that regression coefficients are significant at the 10%, 5%, and 1% statistical levels, respectively.
Disclaimer/Publisher’s Note: The statements, opinions and data contained in all publications are solely those of the individual author(s) and contributor(s) and not of MDPI and/or the editor(s). MDPI and/or the editor(s) disclaim responsibility for any injury to people or property resulting from any ideas, methods, instructions or products referred to in the content.

