Article

Research on the Water–Energy–Carbon Coupling Changes and Their Influencing Factors in the Henan Section of the Sha Ying River Basin, China

1
College of Resources and Environment, Henan Agricultural University, Zhengzhou 450002, China
2
College of Civil Engineering, Zhengzhou University of Technology, Zhengzhou 450044, China
*
Author to whom correspondence should be addressed.
Agriculture 2025, 15(11), 1165; https://doi.org/10.3390/agriculture15111165
Submission received: 22 April 2025 / Revised: 25 May 2025 / Accepted: 27 May 2025 / Published: 28 May 2025
(This article belongs to the Section Agricultural Economics, Policies and Rural Management)

Abstract

:
The Henan section of the Sha Ying River Basin, as the core agricultural area of the Central Plains Urban Agglomeration (CPUA), plays a significant role in promoting regional green and sustainable development through the coordinated management of water–energy–carbon (WEC). This study takes the Henan section of the Sha Ying River Basin as a case study to analyze the spatiotemporal evolution characteristics of the region from 2010 to 2022, establish an evaluation system to assess the level of coupled coordination development, and utilize the gray correlation model to identify key influencing factors. The results show a fluctuating downward trend in WEC consumption, with low coupling coordination transitioning from high coordination to moderate imbalance. Key factors influencing coupling coordination include water consumption per 10,000 CNY of GDP, agricultural industry structure, and year-end population. Spatial heterogeneity in WEC coupling coordination factors was observed across cities. This research provides a scientific basis for understanding ecosystem dynamics in agricultural cities and supports differentiated environmental policies for sustainable regional development.

1. Introduction

As global ecological and environmental problems become increasingly severe, and climate change has become a common challenge for all humanity, there is a growing international focus on the coordinated development of energy and the environment [1]. In response to international calls [2], China has proposed higher requirements for water resource utilization, energy consumption (EC), and carbon emission (CE) control through the 14th Five-Year Plan (2021–2025) [3]. The government has made it clear that it is committed to achieving comprehensive improvements in the efficiency of water resource utilization, promoting clean and efficient energy, and strictly controlling total CE. The overarching objective is to achieve a mutually beneficial situation in which economic development and ecological protection can be pursued in a balanced manner [4]. In this context, the question of how to achieve the coupled development and coordinated management of water resources, energy, and carbon (WEC) emissions in the main grain production area of Henan Province is an urgent issue that needs to be addressed for the current development of the predominantly agricultural Central Plains Urban Agglomeration (CPUA).
WEC represent the pivotal components of the “natural-social-economic” composite system, exhibiting dynamic interactions and adaptability, thereby contributing to the formation of a complex WEC system [5]. With the rollout of China’s “dual carbon” goals, the WEC relationship has become a research hotspot, being studied from different industries, scales, and methodological perspectives. In terms of the research on industries, the focus has been primarily on a few typical sectors including electricity [6], steel [7], and water industries [8], revealing significant differences in the water–energy–carbon relationship among various industries or departments. In terms of research scales, the trend goes from the macro to the micro level, covering international, national, provincial, urban agglomeration, and city levels [9,10,11,12,13]. In terms of research methods, such methods as input–output analysis [14], life cycle analysis [15], the LEAP–WEAP–Binio model [16], the system dynamics model [17], and ecological network analysis [18] are introduced to analyze the WEC system, centering on clarifying the matching characteristics and efficiency [19] of WEC multi-elements, inter-regional flows [20], and association networks [21]. Additionally, to further reveal the dynamic interaction characteristics of the WEC system, some studies have started from the perspective of coupling and synergy to explore the impact of multiple factors on the coupling coordination effect of the WEC system. However, there are still certain limitations. For example, Venkatesh et al. [22] conducted a case study based on international cities, revealing the roles of climatic, technological, and geographic factors. However, their conclusions are constrained by the developed city sample, making it difficult to generalize to agriculture-dominated regions. He [23] employed the entropy-weight method and the coupling coordination degree model to analyze 31 provinces and municipalities in China, but the indicator system failed to adequately reflect regional heterogeneity and only performed static spatial correlation analysis, thus failing to capture the temporal evolution patterns of the WEC system. Li et al. [24], based on a system dynamics model, revealed that factors such as clean energy, industrial regulation, and the GDP growth rate have a progressively increasing impact on the WEC system in the three northeastern provinces. However, their study overlooked the characteristics of small-to-medium-sized watersheds, making it difficult to apply the conclusions to regions with significantly different geographical and economic backgrounds.
Overall, existing research [25,26,27] mostly focuses on theoretical discussions at the macro level or case studies of economically developed regions and energy cities, thus leaving significant gaps in agriculture-dominated regions. The Henan section of the Shaying River Basin, as an important part of the CPUA, is responsible for ensuring agricultural irrigation and residential water use, and its rational use and efficient allocation will be vital for food security and the economic stability of this region. Nevertheless, in the context of accelerated economic growth and urbanization, issues such as water resource shortages, augmented EC, and escalating CE have come to the fore, substantially impeding regional sustainable development. Therefore, an in-depth discussion of the coupled WEC change patterns and their influencing factors in the Henan section of the Shaying River Basin is of practical significance for strengthening the control of agricultural nonpoint source pollution [28], promoting the coordinated development of the economy and the environment, and guaranteeing grain safety. The present study focuses on the southern section of the Shaying River Basin, utilizing a comprehensive and systematic approach to analyze the spatiotemporal development characteristics of the regional WEC system. To this end, an evaluation system is constructed to assess its coupling and coordinated development level. Furthermore, a grey correlation model is employed to identify the key influencing factors. The research results will provide a foundation for understanding the dynamic, changing processes and driving mechanisms of the agriculture-dominated urban ecosystem in the research region, formulating differentiated environmental governance policies, and promoting regional sustainable development.

2. Materials and Methods
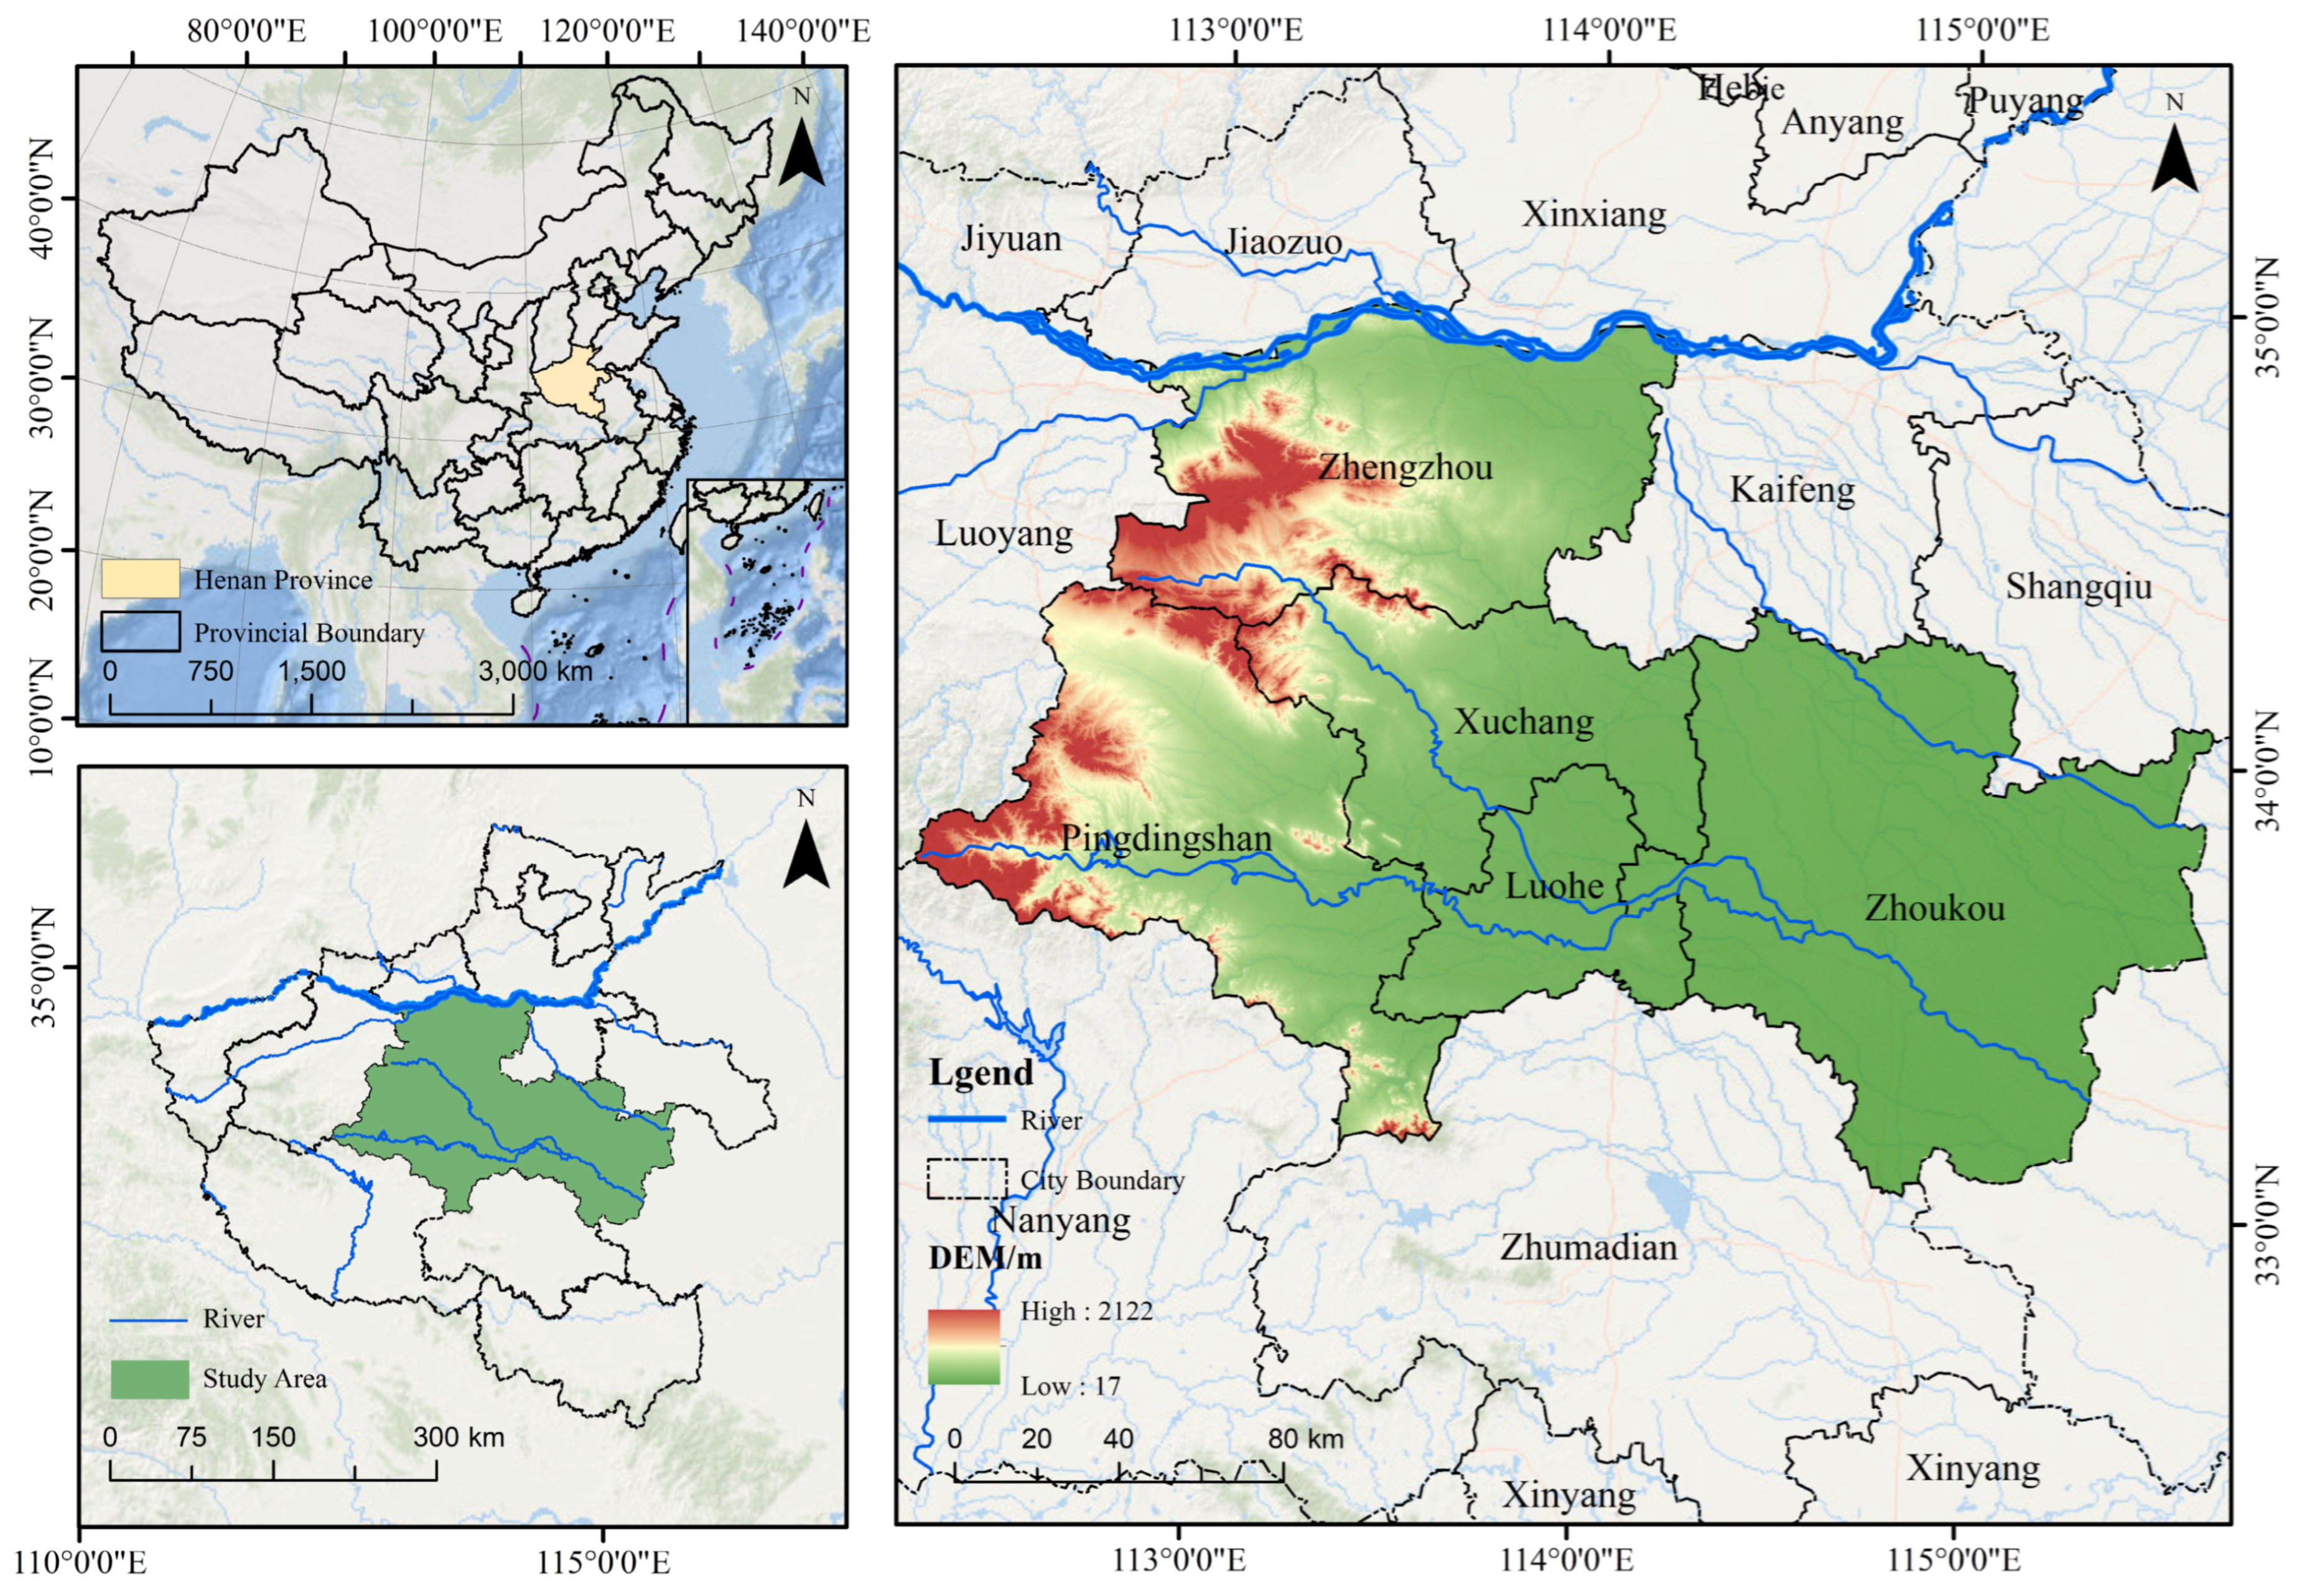
2.1. Study Area

The Shaying River, the largest tributary of the Huai River, originates from the eastern foothills of the Funiu Mountain in Lushan County, Henan Province. It has a total basin area of 39,075.31 km2, with 35,049.21 km2, or 88.21%, distributed within Henan Province. It is located between 112°14′ E to 115°39′ E and 33°03′ N to 34°58′ N, with three rivers that flow through it, namely the Sha River, the Ying River, and the Jialu River, and thus serves as an important water source in Henan Province. Based on existing research findings and considering the integrity of administrative divisions [29], Henan Province has been defined to encompass five prefecture-level cities: Zhengzhou, Pingdingshan, Xuchang, Luohe, and Zhoukou (Figure 1). The terrain is higher in the west and lower in the east, with elevations ranging from 31 m to 2137 m. The topography of the western region is characterized by a prevalence of mountains and hills, while the eastern part is predominantly occupied by plains. The region’s climate is classified as a warm temperate semi-humid monsoon climate, with an average annual temperature of 14–15 °C and precipitation of approximately 750 mm. As of 2022, the total population reached 33.35 million, with a GDP of 2495.073 billion CNY, and a total grain output of 17.4174 million tons, accounting for 33.99%, 40.67%, and 26.29% of Henan Province’s total, respectively. It is a major grain-producing area and economic development hub. The country has undergone rapid economic development and industrialization, yet is also confronted with challenges, including the imbalanced distribution of water resources across space and time. The catchment area is distinguished by the presence of multiple sluices, elevated levels of pollution, and a substantial population density [29]. Therefore, conducting research on the coupling changes and influencing factors of WEC can alleviate the contradiction between socio-economic development and resource environmental protection, thereby achieving the synergistic goals of water resource management, energy security, and CE reduction. This will be of crucial importance for the promotion of sustainable development in the primary grain-producing regions of the CPUA. Furthermore, this research will provide a foundation for the advancement of the region’s agriculture-focused, diversified economic collaborative development.

2.2. Data Sources

The data for this study were drawn from the China City Statistical Yearbook [30], China Energy Statistical Yearbook [31], Henan Statistical Yearbook [32], and the statistical yearbooks of the five cities in the Henan section of the Shaying River Basin from 2010 to 2022. The total output, import, and export volumes of agricultural and livestock products over the years are taken from the Statistical Bulletin of National Economic and Social Development of each city. Data on water use per 10,000 CNY of GDP, industrial water use, rural and urban water use, ecological environment water use, and total water resources have been obtained from the Water Resources Bulletin and Henan Water Resources Bulletin of each city from 2010 to 2022.

2.3. Research Methods

2.3.1. Water Footprint Accounting

Water footprint (WF) represents the net water consumption of a region over a specific period [33]. Based on the Water Footprint Assessment Manual compiled by Hoekstra et al. [34], the top-down approach in WF accounting was selected to calculate the total WF of the research region. The calculation formula was as follows:
WF = WFa + WFn + WFi + WFe + WFg + WFec − WFex
where WF represents the total WF, WFa denotes the agricultural WF; WFn stands for the industrial WF; WFi indicates the domestic WF; WFe refers to the ecological environment WF; WFg means the grey WF; and WFec and WFex signify the imported WF and the exported WF, respectively.
Whether freshwater resource usage has been sustainable can be determined by a benchmark combining the planetary boundary for water with the WF [35]. Based on the principle of equitable allocation, the reduced planetary boundary for water is worked out using the per capita equal distribution method [36]. The calculation formula is as follows:
W P B i = P O P i P O P W P B
where WPBi represents the reduced planetary boundary for water in city i; POPi denotes the population of city i; POP is the total global population; and WPB means the global planetary boundary for water, which is set at 4 trillion cubic meters [37]. When WF exceeds WPB, the regional water withdrawal will surpass the safe threshold, resulting in a water deficit. Conversely, a surplus indicates a higher level of sustainable water resource utilization.

2.3.2. Energy Footprint Accounting

Drawing on the method proposed by Fang et al. [38]. The energy footprint was delineated as the area of land needed to absorb the CO2 resulting from energy combustion, using the net primary productivity (NPP) approach. The specific calculation formula is as follows:
N P P = j = 1 n N P P j A j A
M C = i n E i V i C i
E F = N e e f = M C / N P P
where NPP represents the regional average net primary productivity, measured in t/(hm2·a); j denotes the land use type code; NPPj refers to the global average net primary productivity corresponding to the j-th type of biologically productive land, measured in t/(hm2·a); Aj is the area of the j-th type of land (hm2); and A is the total land area of the region (hm2). The change in land use has directly caused the differences in NPP. As land use changes have been happening constantly, the NPP values for each type of land were taken as global averages for the sake of comparability [39]. MC represents the total CE; Ei is the consumption of the i-th energy source (t); Vi means the combustion heat value coefficient of the i-th energy source (TJ/t); Ci is used to describe the CE coefficient of the i-th energy source (t/TJ); N is the population (persons); and eef signifies the per capita energy footprint (hm2/person).

2.3.3. Carbon Footprint Accounting

(1)
Carbon Emissions
For the measurement of CE, the method proposed by Zhu et al. [40] has been used as reference to analyze the direct and indirect sources of CE. Direct sources consider CE generated by land use activities, while the indirect ones account for CE from EC in industrial development. The specific calculation formula is as follows:
E t = i E i t
C t = Q e i S e i D e i
where Et represents the total CE generated across farmland activities; Eit means the CE generated by the type-I carbon source, mainly from chemical fertilizers, pesticides, agricultural film, agricultural planting area, agricultural facility power and irrigation area; I and t denote the energy type and year respectively; Ct is the total CE of EC; Qei is the EC (104 t or m3); Sei is the standard coal reference coefficient (kg/kg); and Dei is the CE coefficient.
(2)
Carbon Footprint
Relying on the method proposed by Yan et al. [41], the carbon footprint is measured for natural ecosystems and socio-economic systems. The carbon footprint calculation model is constructed as follows:
C E F i t = C T i t N P P i t S i t
C B I i t = C T i t N P P i t
C E F i t = C E F i t S i t
where CEFit, CTit, Sit, and NPPit represent the carbon footprint (km2), total CE (g), productive land area (km2), and net primary productivity of the vegetation (Cg/km2) in region i in year t, respectively. CBIit represents the carbon footprint pressure index and C E F i t represents the carbon deficit.

2.3.4. Coupling Coordination Degree Model

The coupling coordination degree (CCD) model is widely used to analyze the interactions among resource, energy, and the environment [42]. Therefore, it is employed in this research to calculate the coupling coordination level among the water resource consumption, EC and CE systems. The calculation formula is as follows:
C = n U 1 × U 1 U n ( U 1 + U 1 + + U n ) n 1 n
T = γ 1 U 1 + γ 2 U 2 + γ n U n
D = C T
where C is the coupling degree, C ⊂ [0, 1], with a larger value showing a higher coupling degree between the systems; Un means the standardized WF, EC, and carbon footprint; n indicates the number of systems involved in the CCD; T represents the comprehensive evaluation index of coordinated development between systems, γ1 = γ2 = … = γn = 1/n; D is the CCD, D ⊂ [0, 1], with a value closer to 1 indicating a higher coordination degree between systems and a more orderly coordinated development, while a value closer to 0 symbolizes a more chaotic system, implying that development is on the verge of imbalance. The CCD is divided into five levels [43] (Table 1).

2.3.5. Relational Model

(1)
Selection of Influencing Factors
Nine economic and social development indicators that may influence the CCD of WEC were selected as driving factors [44,45,46]. Specifically, these include the year-end resident population, the proportion of the urban population, the proportion of employment in the secondary and tertiary industries, regional GDP per capita, total fixed asset investment in society, per capita road area, the proportion of the built-up area to the total urban land area, water consumption per 10,000 CNY of GDP, and the agricultural industry structure. To avoid multicollinearity issues among the indicators and to eliminate the influence of different units, all variables were subjected to natural logarithm transformation.
(2)
Construction of the Grey Relational Model
The key influencing factors of the coupling coordination changes among water, energy and carbon were identified by grey relational analysis model [47]. The CCD of “water-energy”, “water-carbon”, “energy-carbon”, and WEC were used as the reference sequence Y, while the driving factors were used as the comparative sequence X. The calculation formula is as follows:
y i j = min i min j U i X U j Y + ζ m a x i m a x j U i X U j Y U i X U j Y + ζ m a x i m a x j U i X U j Y
where yij represents the gray correlation, whose value is between 0 and 1, with a larger value meaning a greater effect; UiX and UjY are the normalized values for each indicator; and ζ is the resolution coefficient, with a general value of 0.5. The correlation coefficient adopts the average of the number of cities. The average value calculated by the rows or columns of the matrix can be used to analyze the main factors influencing the resource and environment.

3. Results

3.1. Spatiotemporal Evolution Characteristics of “Water–Energy–Carbon”

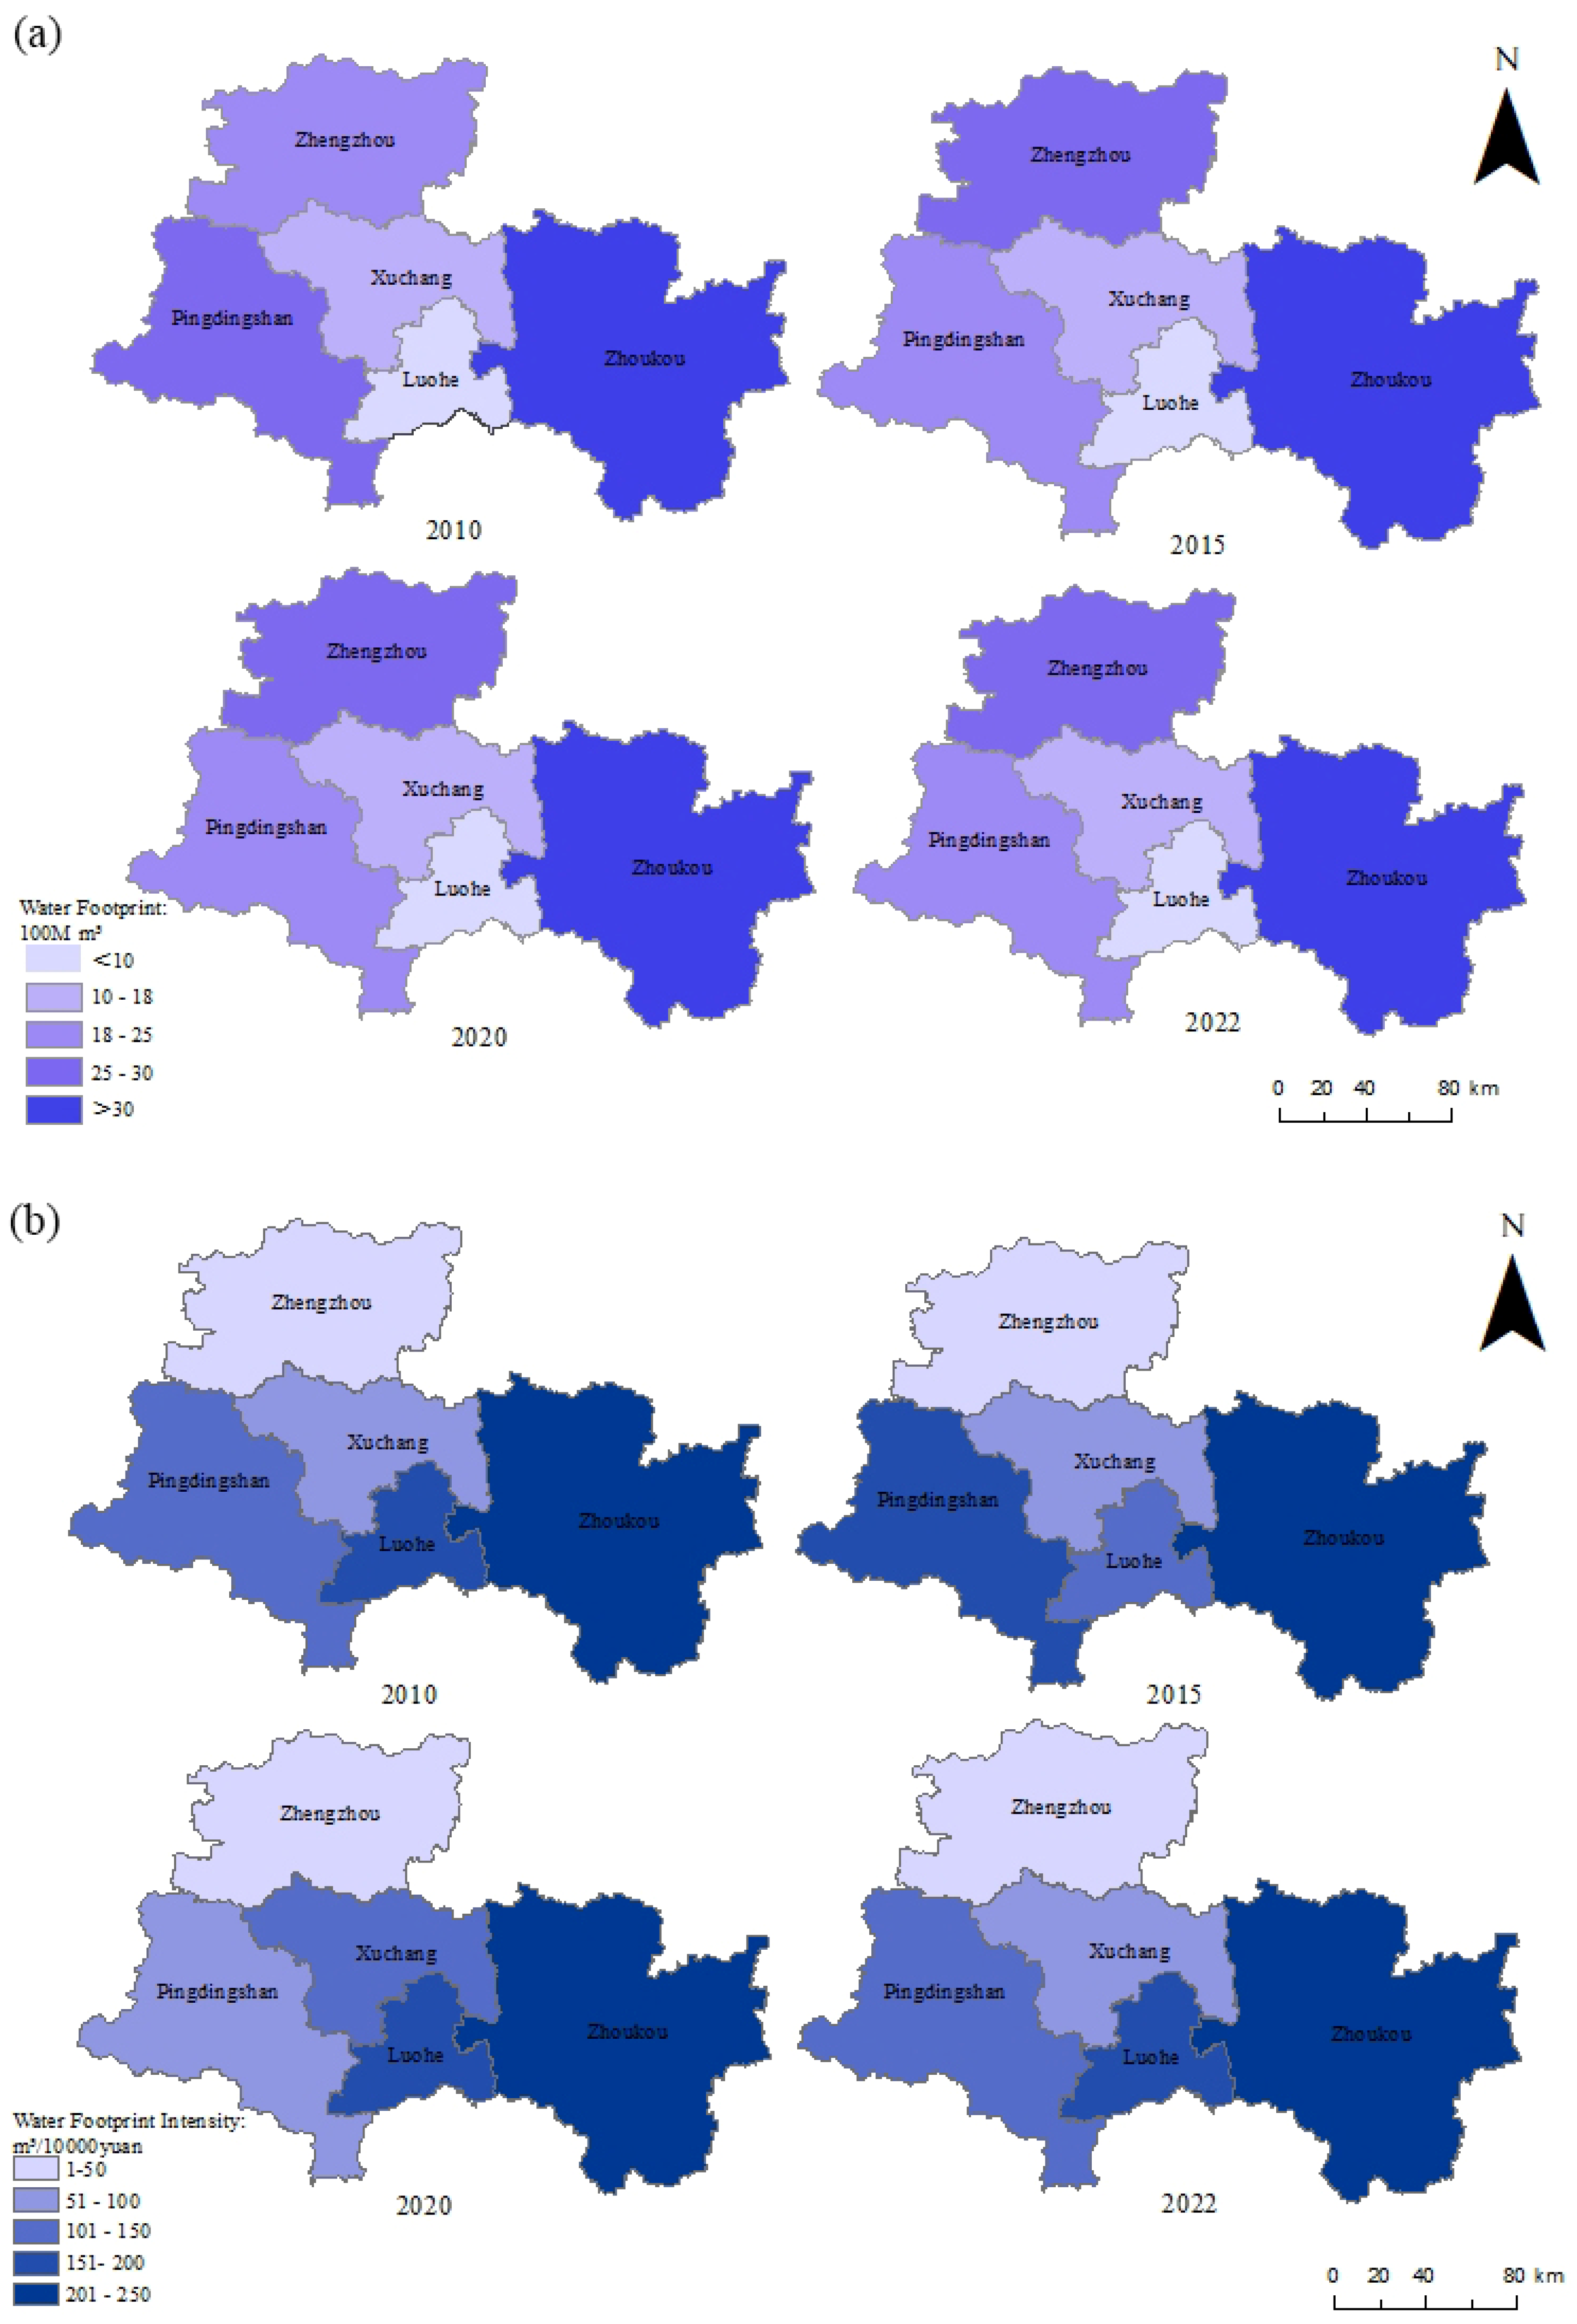
3.1.1. Spatiotemporal Evolution Characteristics of Water Footprint

From 2010 to 2022 (Figure 2), the total WF of the Henan section of the Shaying River Basin exhibited a trend of “first rising and then declining”. It rose from 10.928 billion m3 in 2010 to 12.089 billion m3 in 2012, and subsequently decreased annually to 7.692 billion m3 by 2022. From the perspective of temporal changes, the period from 2010 to 2012 marked a rapid growth phase in the region’s WF, in which the agricultural water footprint and industrial water footprint increased by 15% and 23%, respectively, and the agricultural and industrial water footprints were the main drivers of the increase in the total water footprint during this period [48]. From 2013 to 2022, following economic development and social progress, water usage in industry and agriculture stabilized, leading to a steady agricultural and industrial WF. Concurrently, the grey WF demonstrated a persistent decline, yielding modest success in the mitigation of water contamination. From a spatial distribution perspective, the changes in the WF of the research region from 2010 to 2022 showed significant regional differences but a relatively stable pattern. Zhoukou City consistently exhibited a larger WF, represented by deeper blue shades, across all years (2010, 2015, 2020, 2022). This is attributed to its highly developed agriculture and substantial agricultural water use, resulting in a higher WF. In contrast, other cities, with a larger proportion of industrial activities, demonstrated relatively higher water resource efficiency but lower WF. From the perspective of individual accounts (Figure 3a), from 2010 to 2022, the agricultural WF accounted for the largest share, consistently exceeding 3 billion cubic meters, followed by the grey WF, which showed a fluctuating decline overall. Furthermore, the ecological WF and the grey WF exhibited opposite trends, because of increasing attention to ecological construction and environmental protection during this period. Notably, the WF intensity generally declined from 2010 to 2022, reflecting continuous improvement in the economic efficiency of water resource use. Calculations based on the water planetary boundary (Figure 3b) revealed no significant change in the water planetary boundary of the research region from 2010 to 2022, with the boundary consistently exceeding the total WF, resulting in a water surplus. This indicates that water resource use there remained within the safe usage range in absolute sustainability assessments, contributing to the achievement of the clean water (SDG6) goal. In summary, future efforts should focus on optimizing the agricultural structure, strengthening water conservation, and promoting regional collaborative water management, which are imperative when seeking to ensure the efficacious utilization of water resources in the agriculturally dominant CPUA.

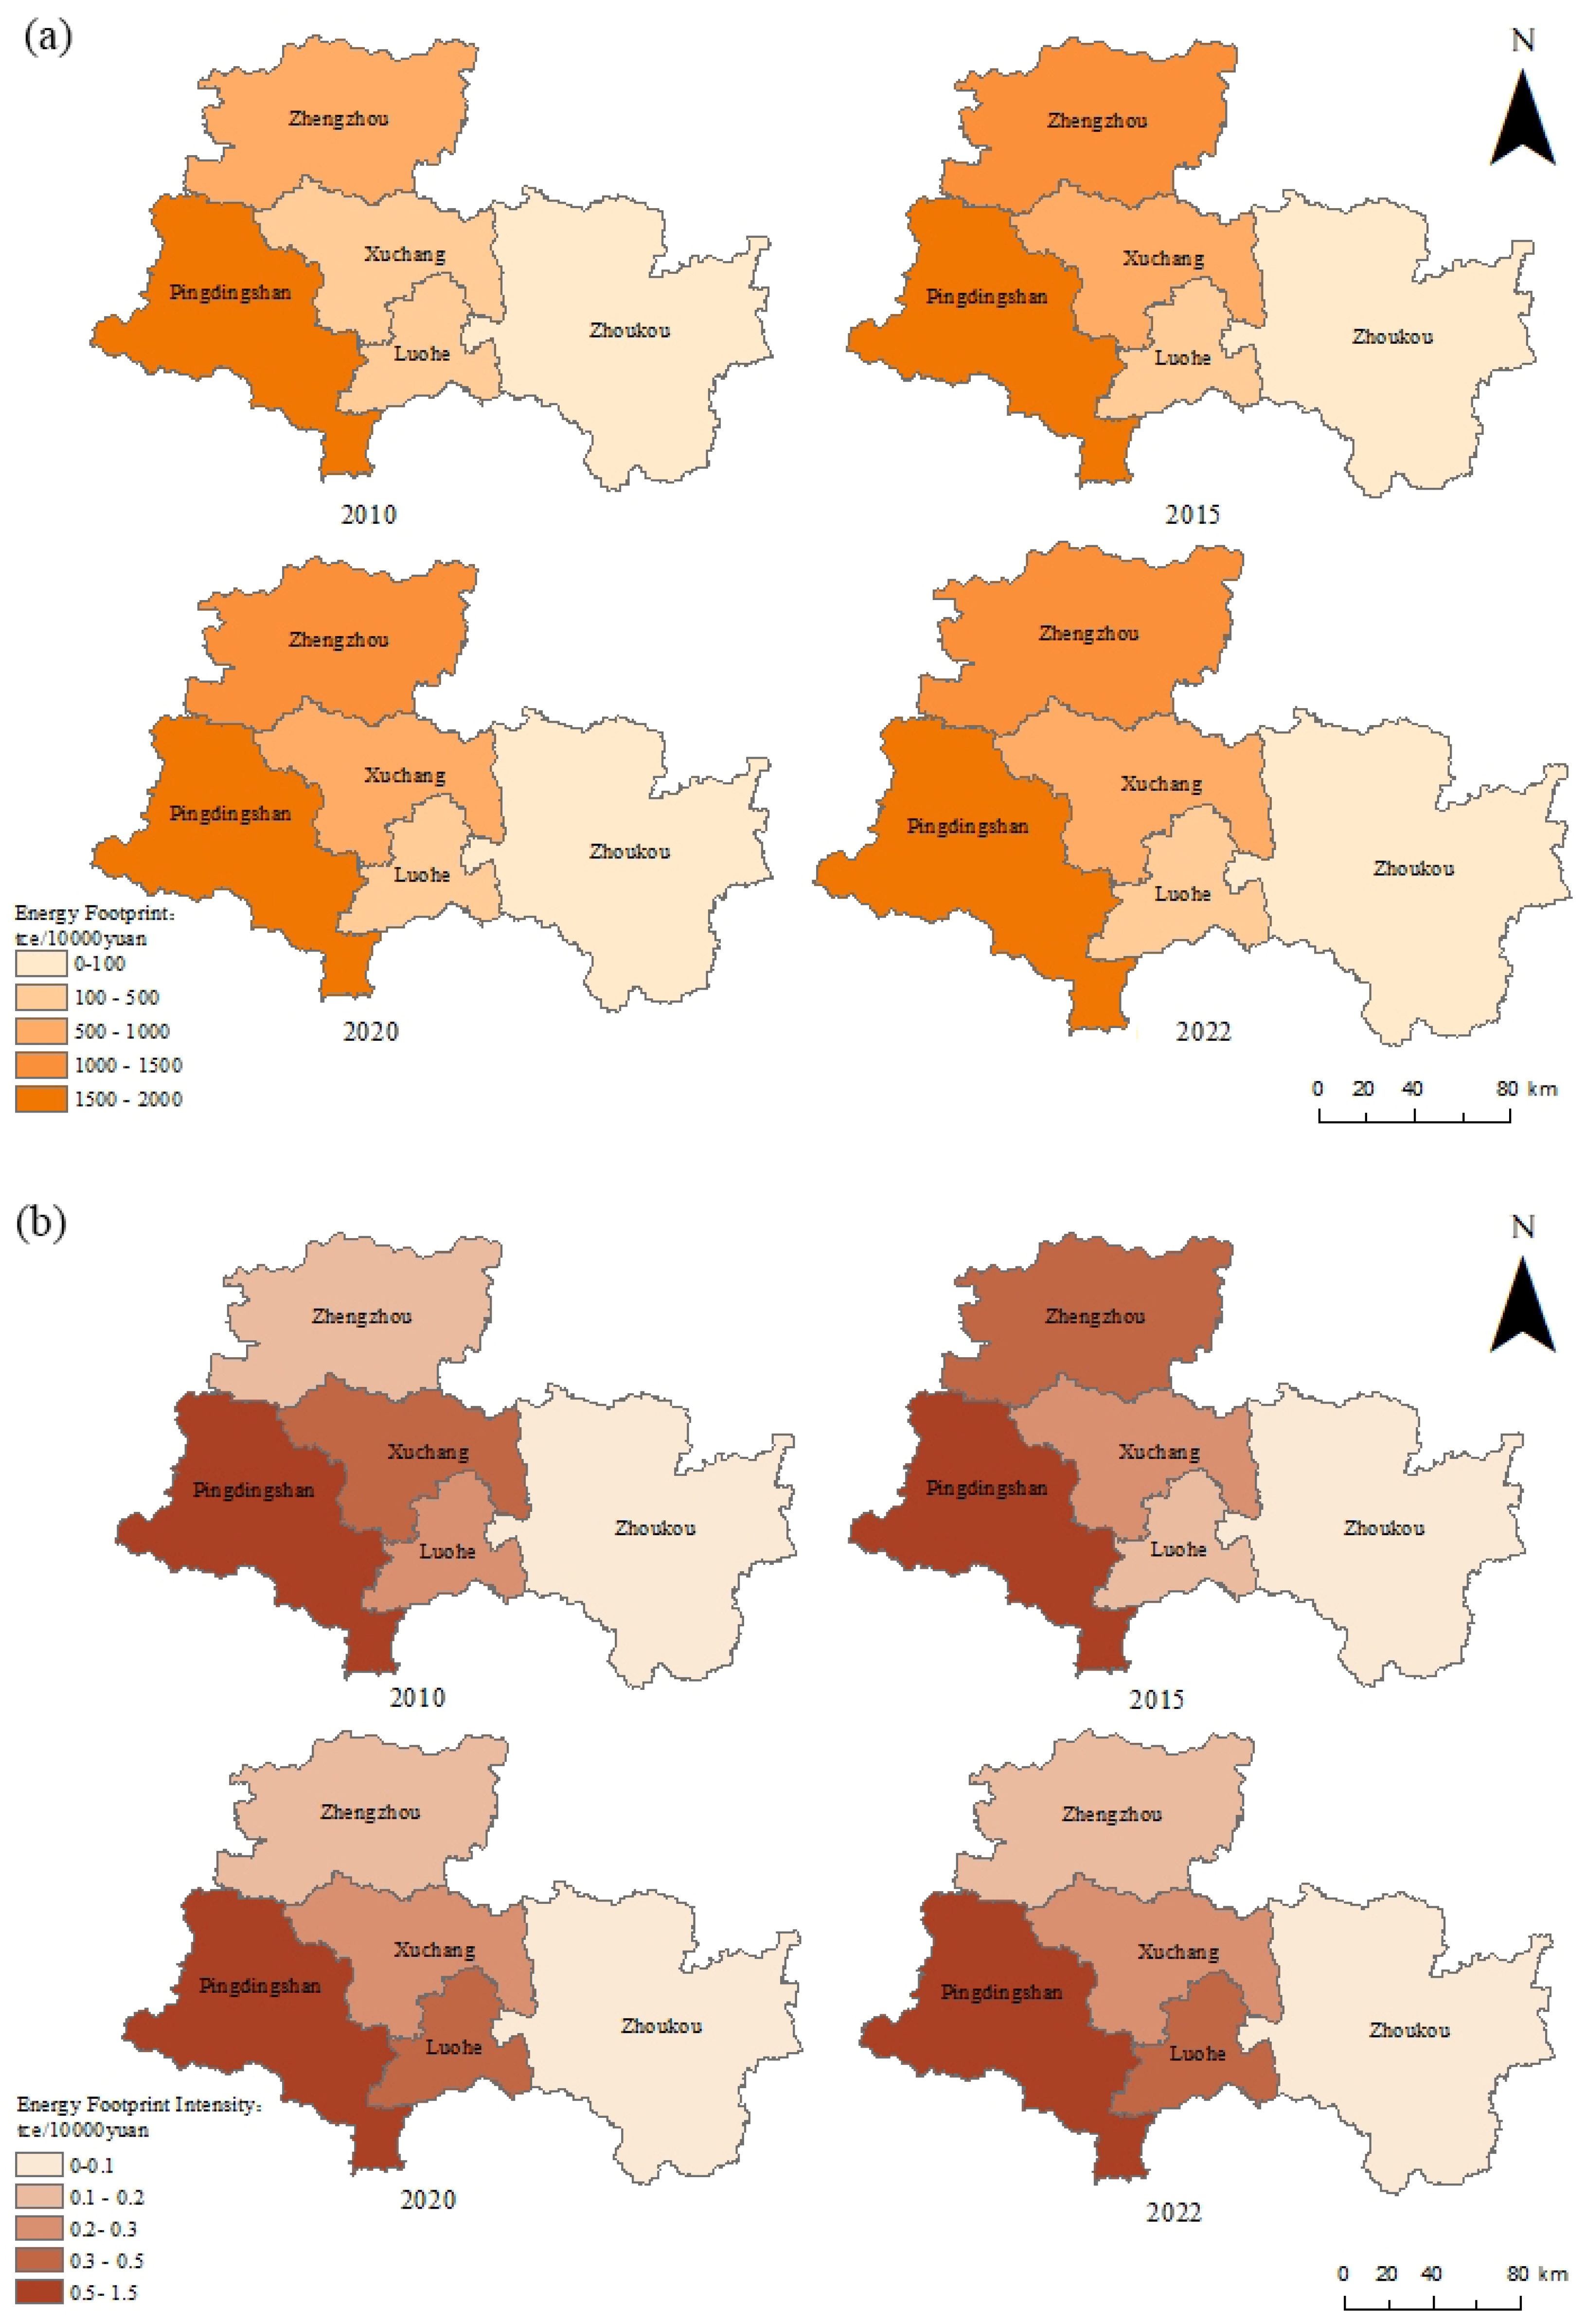
3.1.2. Spatiotemporal Evolution Characteristics of Energy Footprint

As shown in Figure 4, from 2010 to 2022, the energy footprint in the research region exhibited an overall trend of initial increase followed by decline and subsequent rebound, rather than a unidirectional linear progression. Temporally, the region experienced rapid EC growth from 2010 to 2015, expanding from 33.8807 million tce to 34.6273 million tce, this stage is characterized by the rapid advancement of industrialization and urbanization in China. The Henan section of the Sha Ying River basin, relying on traditional industries, combined with the enhancement of agricultural mechanization and the acceleration of urban–rural infrastructure development, jointly drives a sustained increase in energy demand. Between 2015 and 2020, energy footprints across cities began to decline, with total EC falling from 34.6273 million tce to 23.9879 million tce, representing an annual average decline rate of 9.8%, this is mainly attributed to the strict requirements for energy conservation and emissions reduction outlined in the national ‘14th Five-Year Plan’ [3], which has led to the elimination of outdated production capacity in various regions within the watershed, the shutdown of energy-intensive and high-pollution enterprises, and the promotion of clean energy technologies. Meanwhile, from 2020 to 2022, a slight rebound occurred, one that was related to the post-pandemic economic recovery [2], the restoration of industrial production, and the phase-related increase in energy input brought about by new energy infrastructure projects. Spatially, from 2010 to 2022, although the total energy footprint of Pingdingshan City was relatively high, it shows a declining trend. This is primarily attributed to the region’s active implementation of supply-side structural reforms [49]: on one hand, advancing the intelligence transformation of coal mines to improve the efficiency of coal extraction and processing while reducing waste; while, on the other, vigorously developing non-coal industries such as nylon new materials and high-end equipment manufacturing to reduce dependence on coal. Regarding EC intensity, the research region demonstrated a continuous downward trend from 2010 to 2022, dropping from 2.22 tce/10,000 CNY to 0.8 tce/10,000 CNY. Zhoukou City had the lowest EC intensity at an average of 0.0425 tce/10,000 CNY, this indicates that Zhoukou City, as a major agricultural city, primarily focuses on grain cultivation and the initial processing of agricultural products, with a low proportion of energy-intensive industries. In recent years, it has further reduced energy consumption in the agricultural sector by promoting water-saving irrigation equipment and developing ecological agriculture. Overall, the EC intensity in the research region experienced a consistent annual decline throughout the 2010–2022 period, this reflects significant achievements in energy transition and sustainable development within the region. However, the temporary rebound in energy footprints also serves as a warning that continuous efforts are needed to promote the optimization of industrial structures and the substitution of clean energy, in order to address the dual challenges of future economic growth and ecological protection.

3.1.3. Spatiotemporal Evolution Characteristics of Carbon Footprint

From 2010 to 2022, the carbon footprint of the research region showed a trend of “first falling and then rising” (Figure 5). From 2010 to 2020, it decreased from 208.09 × 10⁴ km2 to 151.40 × 10⁴ km2, and then recovered to 182.99 × 10⁴ km2 after 2020. The decline in the early stage was primarily due to the adjustment of industrial structure and energy conservation and emission reduction policies in the Henan section of the Sha Ying River Basin, which to some extent reduced CE. The subsequent recovery is related to the expansion of industrial production and increased energy demand following economic recovery. From the perspective of the composition of carbon footprint accounts, indirect CE accounts took up more than 90%. This is because the local economy is predominantly agricultural, leading to significant CE from the input of agricultural production materials (such as fertilizers, pesticides, and agricultural films) and the use of agricultural machinery. Spatially, during the period from 2010 to 2022, Pingdingshan City recorded the highest carbon footprint. The city boasted an annual average carbon footprint of 105.18 × 10⁴ km2, accounting for 54% of the total CE in the Shaying River Basin. As such, it emerged as the largest contributor to CE in the area. This is primarily due to, on the one hand, the mining, processing, and coal-dependent industrial production in Pingdingshan City releasing vast amounts of carbon dioxide; while, on the other hand, the large-scale agricultural production activities in Pingdingshan City, such as mechanized farming and the input of agricultural materials, have also contributed to increased CE. In terms of the carbon footprint pressure index, the research region showed a trend of “fluctuation and change”, and the overall value fluctuation decreased, showcasing that this region had made progress in CE reduction, and that the adjustment of economic structure and EC had eased the carbon pressure. In 2022, the carbon pressure index rebounded to 326.75, revealing that the CE reduction work is a dynamic process that requires continuous attention and adjustment of strategies. From 2010 to 2022, although the carbon-carrying capacity of the research region increased slightly, it was always far below the carbon footprint and caused a carbon deficit. In terms of carbon footprint intensity, from 2010 to 2022, the carbon footprint intensity in this region exhibited a trend of “first decreasing and then rising”, from 0.14 km2/10,000 CNY in 2010 to 0.048 km2/10,000 CNY in 2021, and recovered to 0.054 km2/10,000 CNY in 2022. This indicates that, although there have been slight fluctuations, the overall CE efficiency in this region is continuously improving.

3.2. Analysis of the “Water–Energy–Carbon” Coupling Coordination Relationship

This study has constructed a multi-dimensional coupling coordination model of “water–energy”, “water–carbon”, “energy–carbon”, and WEC to further analyze relevant resource and environmental issues. Figure 6 reveals that, from 2010 to 2022, the WEC of CCD displayed an “increase-decrease-increase” trend, yet an overall fluctuating downward trend, revealing “high coordination—basic coordination—severe imbalance—moderate imbalance”. CCD change curves of each city were the same, with the five cities mostly maintaining relatively stable and high CCD from 2010 to 2013, after which the differentiation appeared. The phenomenon can be broadly categorized into three distinct stages. The initial phase spanned from 2010 to 2013, during which the WEC of CCD in the research region was relatively stable and high, above 0.8, with high water–energy, water–carbon, and energy–carbon CCD, and during which the WEC coupling coordination level showed an increasing trend. At this stage, Henan Province was promoting ecological protection and energy conservation and emission reduction policies in the watershed. In the urban areas of the Sha Ying River basin in Henan, there was an emphasis on strengthening the construction of water conservancy facilities, strictly controlling high-pollution projects, and maintaining a stable industrial structure. The energy demand of traditional industries was growing slowly, which helped to maintain a relatively high level of coupling coordination [50]. The second stage is from 2014 to 2020, during which the CCD of each city fluctuated greatly, with most cities showing a significant decline, from 0.922 to 0.17. This phase is characterized by the advancement of the CPUA, where industrialization and urbanization within the region were accelerating. Areas such as Xuchang and Pingdingshan were developing energy-intensive industries, leading to a surge in WC, EC, and CE. Additionally, the delayed resource management and environmental governance resulted in a sharp decline in the coordination of the WEC system. Finally, the third stage is 2020–2022, during which the CCD of each city slightly rebounded but remained at the level of severe imbalance to moderate imbalance. During this period, under the promotion of China’s ‘dual carbon’ goals and the green transformation policies of Henan Province, cities within the basin adjusted their industrial structures, developed clean energy, and raised public environmental awareness, resulting in a slight rebound in the degree of coupling coordination. In summary, the overall CCD of the research region presented a significant downward trend from 2010 to 2022, reflecting the significant challenges faced by the region in the comprehensive management of water, energy, and carbon resources, and the need to further strengthen resource coordination and environmental management measures.

3.3. Grey Association Analysis of the Influencing Factors of Water–Energy–Carbon Coupling Coordination Degree

Through grey association analysis of the urban agglomeration’s WEC of CCD and influencing factor indicators, we can see that the social, economic, and natural indicators selected here have a strong correlation with water, energy, and carbon CCD, all greater than 0.5 (Table 2), thus indicating that the urban agglomeration has a strong correlation with resource and environmental consumption during socio-economic development. Among all influencing factors, water use per 10,000 CNY of GDP has the highest average grey association degree with each CCD indicator, and the correlation with WEC of CCD has reached 0.81, meaning that water use per 10,000 CNY of GDP is the core factor affecting the urban agglomeration’s WEC of CCD. The agricultural structure and year-end resident population have correlations of 0.62 and 0.61 with water, energy, and carbon CCD, respectively, relatively lower than that of water use per 10,000 CNY of GDP but still significant. The urban population proportion and the secondary and tertiary industry employment proportion have the same average correlation of 0.58 with the WEC of CCD, indicating that the urbanization process and the proportion of non-agricultural industries have a certain impact on the WEC of CCD. The per capita road area and the built-up area proportion to the total land area have correlations of 0.56 and 0.55 with the WEC of CCD, respectively, indicating that the level of urban construction and development exerts a certain influence on the water, energy, and carbon of CCD.
Although the total fixed asset investment has a small short-term impact on the WEC of CCD, the investment direction and structure will affect urban infrastructure and industrial layout in the long term. Additionally, the research results show that water use per 10,000 CNY of GDP has the greatest impact on “water–energy”, “water–carbon”, “energy–carbon”, and WEC of CCD. The agricultural structure also exhibits a high correlation, indicating the necessity of enhancing water resource utilization efficiency and optimizing the agricultural structure, while implementing a rational urban population, industry and infrastructure construction plan.
The analysis results of each city in the urban agglomeration (Supplementary Tables S1–S5) show that WEC of CCD in different cities are affected by different key factors, closely related to their respective characteristics. Among them, Zhoukou, as a typical major agricultural city, exhibits highly representative influencing factors. The agricultural industrial structure in Zhoukou has a CCD correlation of up to 0.79, while the proportion of employment in the secondary and tertiary industries reaches a correlation degree of 0.76. As agriculture occupies a dominant position in the economy, the substantial water requirements for agricultural production and irrigation, alongside the direct impact of industrial structure on energy input and carbon emission scales, play significant roles. Additionally, the employment proportion in the secondary and tertiary industries reflects the process of industrial transformation, which has an important impact on energy consumption and carbon emission levels. These factors align closely with Zhoukou’s development path, which is primarily agricultural but gradually moving toward industrial diversification, thereby becoming core elements determining its coordinated development of WEC. In contrast, Zhengzhou, as the core city of the region, is dominated by the secondary and tertiary industries, the water consumption per ten thousand GDP and the proportion of employment in the secondary and tertiary industries are key factors influencing its CCD. Pingdingshan, Xuchang, and Luohe are mainly affected by water consumption per ten thousand GDP and the resident population at the end of the year. This is due to the high demand for industrial water, the significant requirement for water resources in the synergy between manufacturing and agriculture, and the food industry’s reliance on water resources, with the resident population scale affecting water consumption, energy consumption, and carbon emissions. Furthermore, the correlation of fixed asset investment across society in the five cities is generally low, with Zhoukou’s average correlation degree of 0.63 being relatively high, yet it is not a key factor driving the coordinated development of WEC. Overall, water consumption per ten thousand GDP significantly impacts the CCD. Each city should focus on its key elements, prioritizing the enhancement of water resource utilization efficiency to promote sustainable development within the urban agglomeration.

4. Discussion

This article employs a CCD and grey relational model to comprehensively analyze the variations and influencing factors of the WEC system CCD in the Henan section of the Shaying River Basin. The results show that there are similarities and variations in the WEC footprint coupling coordination changes and affecting factors among regions. WEC of CCD demonstrated an overall downward trend, which is consistent with the conclusion of Yang et al. [51] (the constraints between water resource consumption, EC, and CE are continuously intensifying, and the overall CCD shows a downward trend). In contrast to the conclusions drawn by Cao et al. [52] (which indicate an upward trend in WF, EF, and CF in the three northeastern provinces of China), this study finds a downward trend in WF, EF, and CF within the research area, mainly due to the region’s agricultural dominance. In the process of economic and social development, the efficiency of agricultural and industrial water use in the region has significantly improved. The transition from traditional extensive water use patterns to more refined and scientific methods has reduced the consumption of water resources. By increasing the proportion of clean energy sources such as solar and wind power, reliance on fossil fuels has been diminished, optimizing the energy structure. Additionally, since 2010, Henan Province has actively promoted energy conservation and emission reduction policies, resulting in significant positive impacts on the water–energy–carbon nexus in the Henan section of the Shaying River basin through the optimization of water resource utilization, reduction of agricultural energy consumption and carbon emissions, and enhancement of ecosystem services. In terms of water resource utilization, comprehensive irrigation and drainage facilities have been established to improve irrigation water use efficiency and reduce water waste. Regarding energy, intelligent facilities have lowered ineffective energy consumption, while the application of renewable energy has optimized the energy structure. On carbon emissions, soil improvement measures have enhanced the soil’s carbon sequestration capacity, and the improvement of farmland infrastructure has decreased energy consumption during agricultural production, thereby lowering carbon emissions. Although existing research [53] has explored the evolutionary characteristics of the WEC footprint from the Yellow River Basin, demonstrating a significant positive impact of technological innovation and economic foundation on coupled coordinated development, studies on the driving factors of the WEC footprint from different fields remain relatively limited. Moreover, the carbon sources in carbon footprint accounting mainly focus on EC in various industrial sectors, which may cause certain limitations in the calculated carbon footprint. Therefore, this paper has considered CE from both direct and indirect carbon sources, taking into consideration EC as well as the CE resulting from agricultural activities, thus more comprehensively accounting for the carbon footprint of the Henan section of the Shaying River Basin. Additionally, in its analysis of influencing factors, this paper has comprehensively weighed social, economic, and natural factors, systematically exploring the driving factors for WEC footprint changes, thereby providing a basis for formulating more scientific and reasonable differentiated urban governance measures.
The cities in the research region are primarily agriculture-oriented and are also major grain-producing areas in Henan Province and China as well. This distinguishes them significantly from resource-based cities in the central and western regions or coastal cities dominated by export-oriented economies and high-tech industries [54,55]. The research region is significantly impacted by various factors that influence the WEC of CCD, including agricultural production methods and the prevailing industrial structure, with the latter having a high correlation. Resource-based cities, due to high energy and water consumption in industry, have energy utilization and water resource protection as key factors. Meanwhile, export-oriented economic cities have EC and CE closely linked to international trade and logistics. In terms of development priorities and measures, the research region must optimize its agricultural structure, promote water-saving and low-carbon agriculture, and strengthen water resource recycling. Therefore, it significantly differs from central and western regions and coastal cities in its industrial structure, influencing the WEC of CCD, development priorities and measures.

5. Conclusions

This study analyzes the spatial and temporal evolution characteristics of WEC in the Henan section of the Shaying River Basin from 2010 to 2022, the level of CCD, and the key influencing factors. The main conclusions are as follows:
(1)
The evolution of water–energy–carbon footprints: From 2010 to 2022, the WF of the urban agglomeration in the Henan section of the Shaying River Basin exhibited an initial increase, followed by a subsequent decline. Concurrently, the energy footprint and carbon footprint demonstrated an aggregate upward trajectory, with significant differences and fluctuations in the change trends. Zhoukou City had a relatively high WF, Pingdingshan City generated high EC and CE, while Zhengzhou City’s carbon footprint first rose and then fell. Energy footprints and carbon footprints were positively correlated.
(2)
Changes in coupling coordination degree: From 2010 to 2022, the WEC of CCD the urban agglomeration presented an “increase-decrease-increase” trend. CCD change curves of each city were the same but showed significant spatial heterogeneity. The majority of cities demonstrated an ascending trend in the CCD from 2010 to 2015, but all produced varying degrees of decline and then rebounded from 2015 to 2022. Zhengzhou City and Pingdingshan City each showed an overall downward trend, with the lowest CCD among water, energy, and carbon in the urban agglomeration happening in 2020, featuring “severe imbalance”.
(3)
Key influencing factors: Water use per 10,000 CNY of GDP is the key influencing factor, followed by the agricultural structure and the year-end resident population. The urban agglomeration’s cities show significant spatial heterogeneity. Zhengzhou, Pingdingshan, Xuchang, and Luohe have the highest correlation between water use per 10,000 CNY of GDP and the water, energy, and carbon coupling coordination degree, while Zhoukou City has the highest correlation with the agricultural structure.
In summary, from 2010 to 2022, the evolution trend of the WEC footprint in the urban agglomerations of the Henan section of the Sha Ying River Basin has shown differentiation, with significant fluctuations in CCD and localized deterioration. The key influencing factors display spatial heterogeneity. In the face of prominent contradictions between economic development and resource environment, the Henan provincial government needs to base its governance on the characteristics of the cities, innovate resource utilization methods, resolve conflicts within the WEC system, and achieve green cooperative development.
Based on the above conclusions, the following policy recommendations are proposed:
(1)
Classification of emission reduction and green transformation: In response to the differential WEC footprints and environmental pressures, strict restrictions will be imposed on the entry of high-energy-consumption projects in high-value cities for energy and carbon emissions (such as Pingdingshan), while promoting the clean transformation of traditional industries; to address the significant water consumption issue in Zhoukou, water-saving irrigation and breeding technologies will be promoted. Additionally, the government will establish special funds to support cities like Zhengzhou in developing a new energy and digital economy, driving regional economic transformation towards a low-carbon model.
(2)
Collaborative governance and ecological interaction: In response to the imbalance in CCD, a basin-wide WEC Collaborative Management Committee will be established to uniformly manage and control the total amounts of WEC emissions, with a focus on supervising cities where coordination is deteriorating. By establishing a cross-regional ecological compensation mechanism, fiscal transfer payments will promote cooperative efforts among cities in the fields of energy conservation and emission reduction, as well as water resource protection.
(3)
Precise policies and dynamic regulation: Based on the spatial heterogeneity of key influencing factors, there should be a promotion of industrial water-saving transformations in industrial cities (Zhengzhou, Pingdingshan) and implement water consumption quota management; in the agricultural city of Zhoukou, adjust the planting structure and develop water-saving agriculture. At the same time, one should establish a dynamic monitoring platform for core indicators to evaluate policy effects in real time and optimize governance strategies promptly.
This study has certain limitations. The Henan section of the Sha Ying River basin only covers five cities, making it difficult to meet the large sample requirements of traditional regression analysis; in comparison, machine learning methods require fewer samples and have lower computational complexity. Therefore, the research adopted a grey relational model, which does not have strict requirements on sample size and distribution, for the analysis of influencing factors. However, this method can only reveal the degree of association between factors and cannot establish clear causal relationships. In future research, we will expand the scope of the study to include more agriculture-dominated cities and select cities in the Huang-Huai-Hai Plain region for analysis in order to enhance the generalizability and reliability of the research findings.

Supplementary Materials

The following supporting information can be downloaded at https://www.mdpi.com/article/10.3390/agriculture15111165/s1, Table S1: Factors influencing the coupling coordination degree of “water–energy–carbon” in Zhengzhou City; Table S2: Factors influencing the coupling coordination degree of “water–energy–carbon” in Pingdingshan City; Table S3: Factors influencing the coupling coordination degree of “water–energy–carbon” in Xuchang City; Table S4: Factors influencing the coupling coordination degree of “water–energy–carbon” in Luohe City; Table S5: Factors influencing the coupling coordination degree of “water–energy–carbon” in Zhoukou City.

Author Contributions

Conceptualization, X.L. and Y.W.; methodology, X.L.; software, X.L.; validation, X.L., Y.W. and L.L.; formal analysis, C.S.; investigation, C.S.; resources, L.L.; data curation, J.L.; writing—original draft preparation, X.L.; writing—review and editing, W.W.; visualization, X.L.; supervision, J.L.; project administration, L.L.; funding acquisition, L.L. All authors have read and agreed to the published version of the manuscript.

Funding

This study was funded by the Henan Province Science and Technology Research and Development Program Joint Fund, grant number 225200810045; the National Key Research and Development Program Department Provincial Joint Project, grant number 2021YFD1700900; the Henan Province Science and Technology Key Project, grant number 242102320138; the Henan Agricultural University Science and Technology Innovation Fund Project, grant number KJCX2020C05; the Zhengzhou University of Technology High level Talent Research Initiation Fund Project, grant number zzgk202111.

Institutional Review Board Statement

Not applicable.

Data Availability Statement

The original data source has been indicated in the article, and further research results can be obtained by consulting with the corresponding author.

Conflicts of Interest

The authors declare no conflicts of interest.

References

  1. Abdul, W.; Sher, K.; Martin, H.; Marian, S. The impact of hydro-biofuel-wind-solar energy consumption and coal consumption on carbon emission in G20 countries. Environ. Sci. Pollut. Res. Int. 2023, 30, 72503–72513. [Google Scholar]
  2. Cheng, Y.; Liu, H.M.; Wang, S.B. Global Action on SDGs: Policy Review and Outlook in a Post-pandemic Era. Sustainability 2021, 13, 6461. [Google Scholar] [CrossRef]
  3. Suggestions from the Henan Provincial Committee of the Communist Party of China on Formulating the 14th Five-Year Plan for National Economic and Social Development of Henan Province and the Long-Term Goals for 2035. Henan Daily, 8 January 2021.
  4. Zhang, L.; Wang, H.R.; Liu, X.; Li, Y.Y.; Jiang, X. An integrated analysis framework towards identifying circulation relationship of water-energy-carbon in complex system: A case study in Shandong Province. Ecol. Indic. 2024, 158, 111493. [Google Scholar] [CrossRef]
  5. Ni, X.J.; Huang, X.F.; Guo, R.; Wang, J.H.; Peng, K.M.; Zhang, W. Water–energy–carbon synergies and trade-offs: A daily nexus analysis for wastewater treatment plants. Resources. Conserv. Recycl. 2023, 188, 106712. [Google Scholar] [CrossRef]
  6. Zhang, Y.; Fang, J.; Wang, S. Energy-water nexus in electricity trade network: A case study of interprovincial electricity trade in China. Appl. Energy 2020, 257, 113685. [Google Scholar] [CrossRef]
  7. Wang, X.; Zhang, Q.; Xu, L. Water-energy-carbon nexus assessment of China’s iron and steel industry: Case study from plant level. J. Clean. Prod. 2020, 253, 119910. [Google Scholar] [CrossRef]
  8. Maziotis, A.; Garrido, S.R.; Arce, M.M. Understanding water-energy-carbon nexus in English and Welsh water industry by assessing eco-productivity of water companies. Npj Clean Water 2024, 7, 121. [Google Scholar] [CrossRef]
  9. Wang, X.; Klemeš, J.J.; Long, X. Measuring the environmental performance of the EU27 from the Water-Energy-Carbon nexus perspective. J. Clean. Prod. 2020, 265, 121832. [Google Scholar] [CrossRef]
  10. Tian, P.P.; Lu, H.W.; Heijungs, R.; Li, D.; Zhang, K.L.; Yang, Y.Y. Water-energy-carbon nexus in China’s intra and inter-regional trade. Sci. Total Environ. 2022, 806, 150666. [Google Scholar] [CrossRef]
  11. Zhang, D.; Jing, M.; Chang, B. Coordination Analysis and Driving Factors of “Water-Land-Energy-Carbon” Coupling in Nine Provinces of the Yellow River Basin. Water 2025, 17, 1138. [Google Scholar] [CrossRef]
  12. Yan, X.; Chen, J. Analysis of carbon emissions from social water cycle in the Pearl River Delta of COVID-19: Perspectives from water-energy-carbon nexus. J. Clean. Prod. 2024, 448, 141175. [Google Scholar] [CrossRef]
  13. Feng, M.Y.; Zhao, R.Q.; Huang, H.P.; Xiao, L.G.; Xie, Z.X. Water–energy–carbon nexus of different land use types: The case of Zhengzhou, China. Ecol. Indic. 2022, 141, 109073. [Google Scholar] [CrossRef]
  14. Wang, X.C.; Klemeš, J.J.; Wang, Y. Water-Energy-Carbon Emissions nexus analysis of China: An environmental input-output model-based approach. Appl. Energy 2020, 261, 114431. [Google Scholar] [CrossRef]
  15. Ma, X.T.; Zhang, T.Z.; Shen, X.Q.; Zhai, Y.J.; Hong, J.L. Environmental footprint assessment of China’s ceramic tile production from energy-carbon-water nexus insight. J. Clean. Prod. 2022, 337, 130606. [Google Scholar] [CrossRef]
  16. Wang, P.; Huang, R.; Zhang, S.F.; Liu, X.L. Pathways of carbon emissions reduction under the water-energy constraint: A case study of Beijing in China. Energy Policy 2023, 173, 113343. [Google Scholar] [CrossRef]
  17. Chhipi-Shrestha, G.; Hewage, K.; Sadiq, R. Water–energy–carbon nexus modeling for urban water systems: System dynamics approach. J. Water Resour. Plan. Manag. 2017, 143, 04017016. [Google Scholar] [CrossRef]
  18. Zhang, Y.; Fu, Z.H.; Xie, Y.L.; Li, Z.; Liu, Y.X.; Zhang, B.C.; Guo, H.C. Dynamic metabolism network simulation for energy-water nexus analysis: A case study of Liaoning Province, China. Sci. Total Environ. 2021, 779, 146440. [Google Scholar] [CrossRef]
  19. Xiang, W.q.; Yang, X.H.; Bian, D.H.; Pan, Z.S.; Chen, H.; Chen, Y.J.; Li, M.S. Evaluation and prediction of water-energy-carbon nexus efficiency in China based on a new multiregional input-output perspective. J. Environ. Manag. 2023, 339, 117786. [Google Scholar] [CrossRef]
  20. Liu, Y.T.; Chen, B. Water-energy scarcity nexus risk in the national trade system based on multiregional input-output and network environ analyses. Appl. Energy 2020, 268, 114974. [Google Scholar] [CrossRef]
  21. Wang, F.; Cao, Y.Q.; Chen, M.; Yang, Y.F. Network characteristics of the Water-Soil-Energy-Carbon association system in Nine Provinces/Regions of the Yellow River Basin. Adv. Sci. Technol. Water Resour. Hydropower 2024, 44, 31–37. [Google Scholar]
  22. Venkatesh, G.; Chan, A.; Brattebø, H. Understanding the water-energy-carbon nexus in urban water utilities: Comparison of four city case studies and the relevant influencing factors. Energy 2014, 75, 153–166. [Google Scholar] [CrossRef]
  23. He, Z.G. The Water–Energy–Carbon Coupling Coordination Level in China. Sustainability 2023, 16, 383. [Google Scholar] [CrossRef]
  24. Li, K.X.; Chao, Y.Q.; Fan, S.B. Simulation of “water-energy-carbon” system in three northeastern provinces based on system dynamics model. J. Ecol. 2023, 43, 6999–7011. [Google Scholar]
  25. Jonathan, C.; Al-Masri, R.A. The impact of adopting a water-energy nexus approach in Jordan on transboundary management. Environ. Sci. Policy 2021, 118, 49–55. [Google Scholar]
  26. Li, J.J. Spatialized carbon-energy-water footprint of emerging coal chemical industry in China. Renew. Sustain. Energy Rev. 2024, 189, 113919. [Google Scholar] [CrossRef]
  27. Wang, Y.F.; Han, Z.; Deng, X.Z. Water-Energy-Carbon Nexus Within the Urban Eco-Transformation of the Beijing-Tianjin-Hebei Region. Expert Syst. 2025, 42, e70015. [Google Scholar] [CrossRef]
  28. Gao, L.L.; Wu, Y.; Li, L.; Sun, C.; Li, D.H.; Liu, X.K. A Risk Assessment Method for Phosphorus Loss in Intensive Agricultural Areas—A Case Study in Henan Province, China. Agriculture 2024, 14, 1681. [Google Scholar] [CrossRef]
  29. Wang, S.X.; Wang, X.; Zhang, Z.C.; Wen, Q. Spatial and temporal distribution pattern of water yield in Henan section of Shaying River Basin and future multi-scenario modelling. Environ. Sci. Technol. 2024, 47, 47–56. [Google Scholar]
  30. Zhang, L.P. China City Statistical Yearbook 2023; China Statistics Press: Beijing, China, 2023; pp. 4–5. [Google Scholar]
  31. Hu, H.Z. China Energy Statistical Yearbook 2023; China Statistical Publishing House: Beijing, China, 2023; pp. 4–5. [Google Scholar]
  32. Li, Y.W.; Wu, X.W. Henan Statistical Yearbook 2023; China Statistics Press: Beijing, China, 2023; pp. 5–6. [Google Scholar]
  33. Hogeboom, R.J. The water footprint concept and water’s grand environmental challenges. One Earth 2020, 2, 218–222. [Google Scholar] [CrossRef]
  34. Hoekstra, Y.A. Water footprint assessment: Evolvement of a new research field. Water Resour. Manag. 2017, 31, 3061–3081. [Google Scholar] [CrossRef]
  35. Bunsen, J.; Berger, M.; Finkbeiner, M. Planetary boundaries for water–A review. Ecol. Indic. 2021, 121, 107022. [Google Scholar] [CrossRef]
  36. Lucas, P.L.; Wilting, H.C.; Hof, A.F. Allocating planetary boundaries to large economies: Distributional consequences of alternative perspectives on distributive fairness. Glob. Environ. Change 2020, 60, 102017. [Google Scholar] [CrossRef]
  37. Steffen, W.; Richardson, K.; Rockström, J. Planetary boundaries: Guiding human development on a changing planet. Science 2015, 347, 1259855. [Google Scholar] [CrossRef]
  38. Fang, K.; Shen, W.B.; Dong, D.M. Improvement and prediction of energy footprint accounting—A case study of Jilin province. Geogr. Res. 2011, 30, 1835–1846. [Google Scholar]
  39. Venetoulis, J.; Talberth, J. Refining the ecological footprint. In Sustainable Development; CRC Press: Boca Raton, FL, USA, 2008; Volume 10, pp. 441–469. [Google Scholar]
  40. Zhu, X.M.; Wang, Z.S. Research on the spatial correlation pattern of carbon footprint breadth and influencing factors in China. Res. World 2021, 05, 38–48. [Google Scholar]
  41. Yan, J.J.; Deng, N.; Chen, B.; Zhang, X.W. Study on carbon footprint change and its influencing factors in the Beijing-Tianjin-Hebei region under the “dual-carbon” target. J. Ecol. 2025, 45, 1275–1288. [Google Scholar]
  42. Zhang, N.; Yang, X.; Chen, T. Spatial and temporal characteristics of coupled water-energy-food system coordination in western China. China Environ. Sci. 2022, 42, 4444–4456. [Google Scholar]
  43. Li, W.J.; Wang, Y.; Xie, S.Y.; Cheng, X. Coupling coordination analysis and spatiotemporal heterogeneity between urbanization and ecosystem health in Chongqing municipality, China. Sci. Total Environ. 2021, 791, 148311. [Google Scholar] [CrossRef] [PubMed]
  44. Guo, X.Y.; Mu, X.Q.; Ding, Z.S.; Qin, D.L. Nonlinear effects and driving mechanisms of multidimensional urbanisation on PM2.5 concentration in the Yangtze River Delta. J. Geogr. 2021, 76, 1274–1293. [Google Scholar]
  45. Liu, S.C.; Ye, Y.M.; Zhong, S.Q. Research on the Relationship between Urban Construction Land Expansion and the Migration and Decoupling of Economic Growth Centers in China. Resour. Environ. Yangtze River Basin 2020, 29, 2563–2571. [Google Scholar]
  46. Li, Z.J.; Xu, J.L.; Wang, J. Study on the spatio-temporal heterogeneity of urban carbon emissions and its influencing factors in the Yangtze River Economic Belt. Resour. Environ. Yangtze Basin 2023, 32, 525–536. [Google Scholar]
  47. Liu, Y.F.; Yuan, Z.H.; Guo, L.X. Analysis of spatial and temporal evolution characteristics and influencing factors of green growth level in Shaanxi Province cities. J. Nat. Resour. 2022, 37, 200–220. [Google Scholar]
  48. Liu, N.; Li, H.J.; Bian, Z.Q.; Liu, X.J. Analysis of factors affecting water footprint based on spatial panel STIRPAT model—A case study of Shandong Province. J. Ecol. 2022, 42, 9335–9347. [Google Scholar]
  49. Huang, X.H. Research on the Development Strategies of Agricultural Industry Clusters in Henan Province under Supply-side Structural Reform. Agric. Econ. 2022, 09, 24–25. [Google Scholar]
  50. Yang, X.; Li, D.H.; Wang, M. Coupling Coordination Degree of Land, Ecology, and Food and Its Influencing Factors in Henan Province. Agriculture 2024, 14, 1612. [Google Scholar] [CrossRef]
  51. Yang, Y.; Zhang, Y.Y. Changes in water-energy-carbon coupling and influencing factors in Hubao-Eyu resource-based urban agglomeration. China Environ. Sci. 2023, 43, 6212–6224. [Google Scholar]
  52. Cao, Y.Q.; Li, J.; Xie, L.F.; Yao, J.Q.; Li, K.X.; Zhang, N.Y. Coupling coordination of the water–energy–carbon system in three provinces of Northeastern China. Front. Environ. Sci. 2023, 11, 1261339. [Google Scholar] [CrossRef]
  53. Liu, J.H.; Pu, L.Y.; Huang, L.C.; Shi, T.L. Research on the Coupling Evaluation and Driving Factors of Water–Energy–Carbon in the Yellow River Basin. Water 2023, 15, 2377. [Google Scholar] [CrossRef]
  54. Liu, S.Y.; Kang, H. Research on Influencing Factors and Emission Reduction Path of Carbon Emission in Shanxi. Ind. Innov. Res. 2024, 21, 116–118. [Google Scholar]
  55. Zhang, R.H. A new model of high-quality development of fishing villages led by sea ranch in the context of rural revitalization—Taking Qingyuitan Village in Rongcheng City, Shandong Province as an example. Sichuan Agric. Sci. Technol. 2024, 12, 92–95. [Google Scholar]
Figure 1. Location of the study area (review document number: GS (2024) 0650).
Agriculture 15 01165 g001
Figure 2. The temporal and spatial evolution of water footprint (a) and water footprint intensity (b) in the Henan section of the Sha Ying River Basin from 2010 to 2022.
Agriculture 15 01165 g002
Figure 3. The dynamic changes in water footprint accounts (a). Water footprint, water planetary boundaries, and water surplus (b) in the Henan section of the Shaying River Basin from 2010 to 2022.
Agriculture 15 01165 g003
Figure 4. The spatial and temporal evolution of the energy footprint (a) and energy consumption intensity (b) in the Henan Section of the Sha Ying River Basin from 2010 to 2022.
Agriculture 15 01165 g004
Figure 5. Temporal and spatial evolution of carbon footprint (a) and carbon consumption intensity (b) in the Henan section of the Sha Ying River Basin from 2010 to 2022.
Agriculture 15 01165 g005
Figure 6. Temporal and spatial evolution of the hydropower–carbon coupling coordination degree in the Sha Ying River Basin, Henan section from 2010 to 2022.
Agriculture 15 01165 g006
Table 1. Division of coupling coordination levels.
LevelSevere
Imbalance
Moderate
Imbalance
Basic
Coordination
Good
Coordination
High
Coordination
Coupling Coordination Degree(0, 0.2](0.2, 0.4](0.4, 0.6](0.6, 0.8](0.8, 1]
Table 2. Results of the coupling coordination degree of ‘water–energy–carbon’ in the Henan section of the Sha Ying River Basin.
IndicatorWater–Energy (Y1)Water–Carbon (Y2)Energy–Carbon (Y3)Water–Energy–Carbon (Y4)Average
Year-end resident population (X1)0.580.600.620.620.61
Urban population ratio (X2)0.560.570.590.590.58
Employment ratio of secondary and tertiary industries (X3)0.560.580.590.600.58
Regional per capita GDP (X4)0.500.510.530.530.51
Total social fixed investment (X5)0.500.500.520.530.51
Per capita road paving area (X6)0.540.550.570.570.56
Built-up area as a proportion of total land area (X7)0.530.540.560.570.55
Water consumption per 10,000 CNY GDP (X8)0.760.780.790.810.78
Agricultural industry structure (X9)0.600.620.630.630.62
Disclaimer/Publisher’s Note: The statements, opinions and data contained in all publications are solely those of the individual author(s) and contributor(s) and not of MDPI and/or the editor(s). MDPI and/or the editor(s) disclaim responsibility for any injury to people or property resulting from any ideas, methods, instructions or products referred to in the content.

