
Analysis of the Interactive Response Relationships Between Agricultural Pollution Reduction and Carbon Emission Mitigation and Agricultural Economic Development: A Case Study of Henan Province, China

 , , , ,
Abstract
1. Introduction
2. Materials and Methods
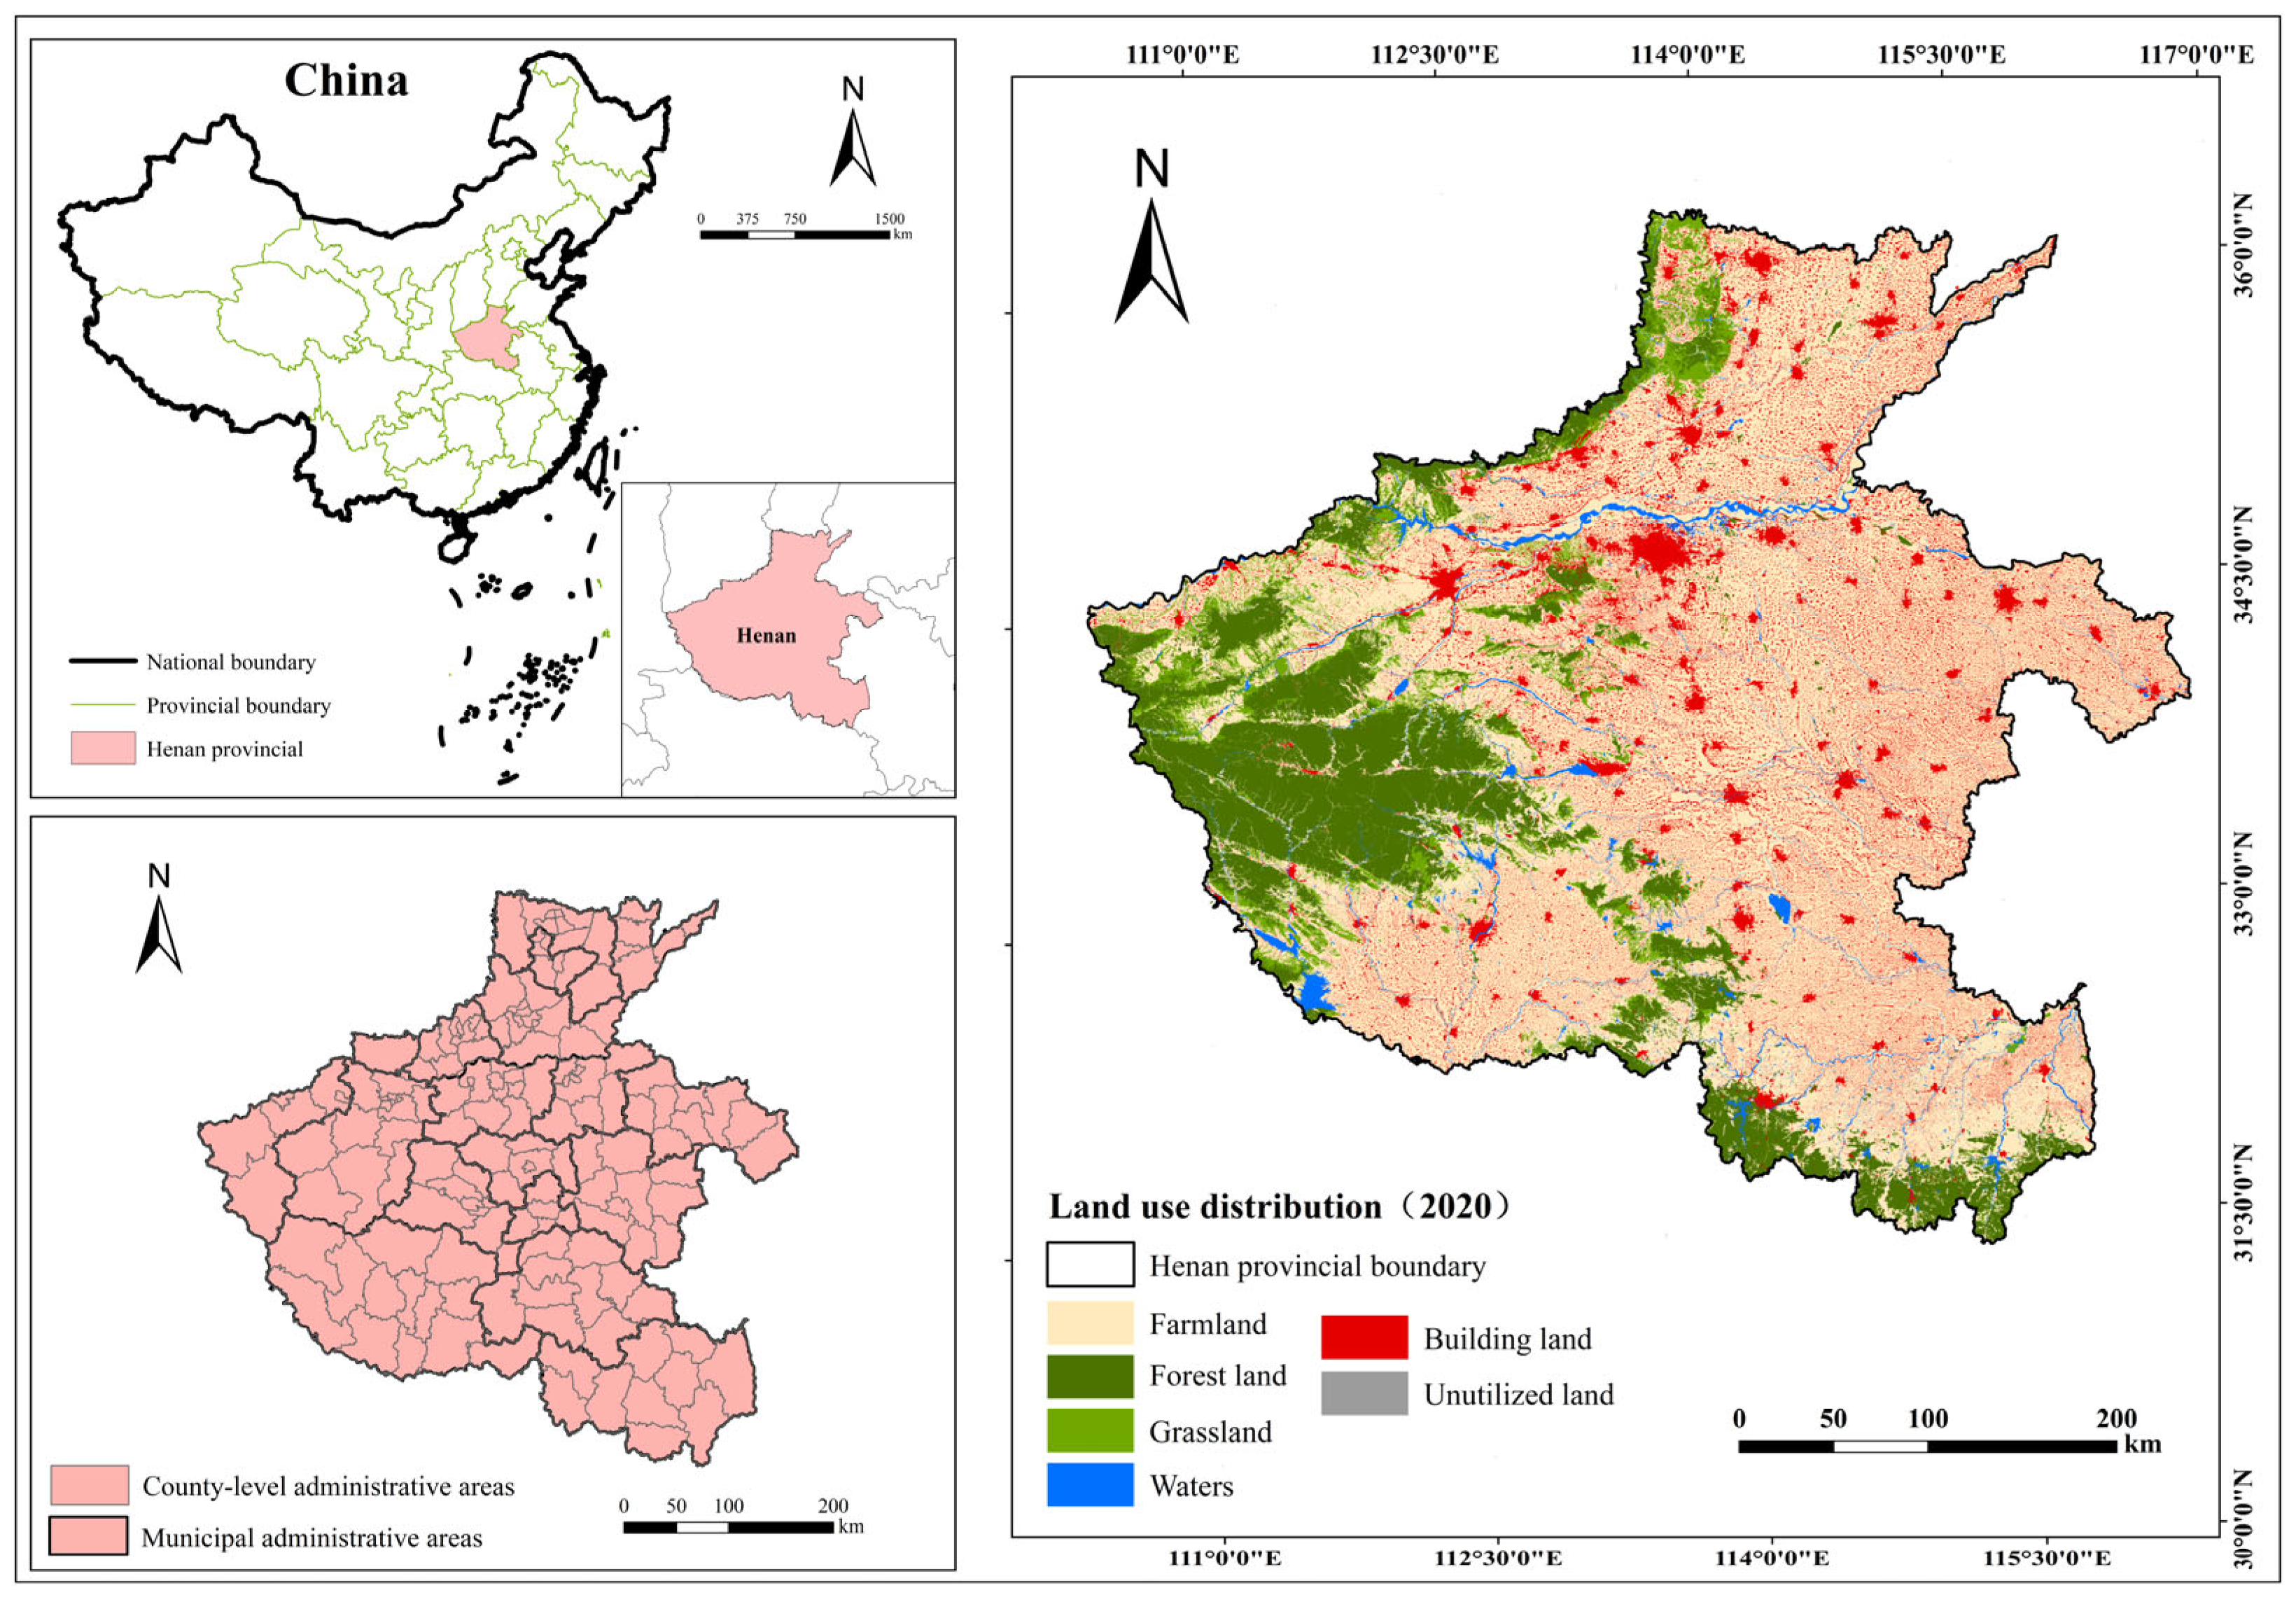
2.1. Study Area Profile and Data Sources
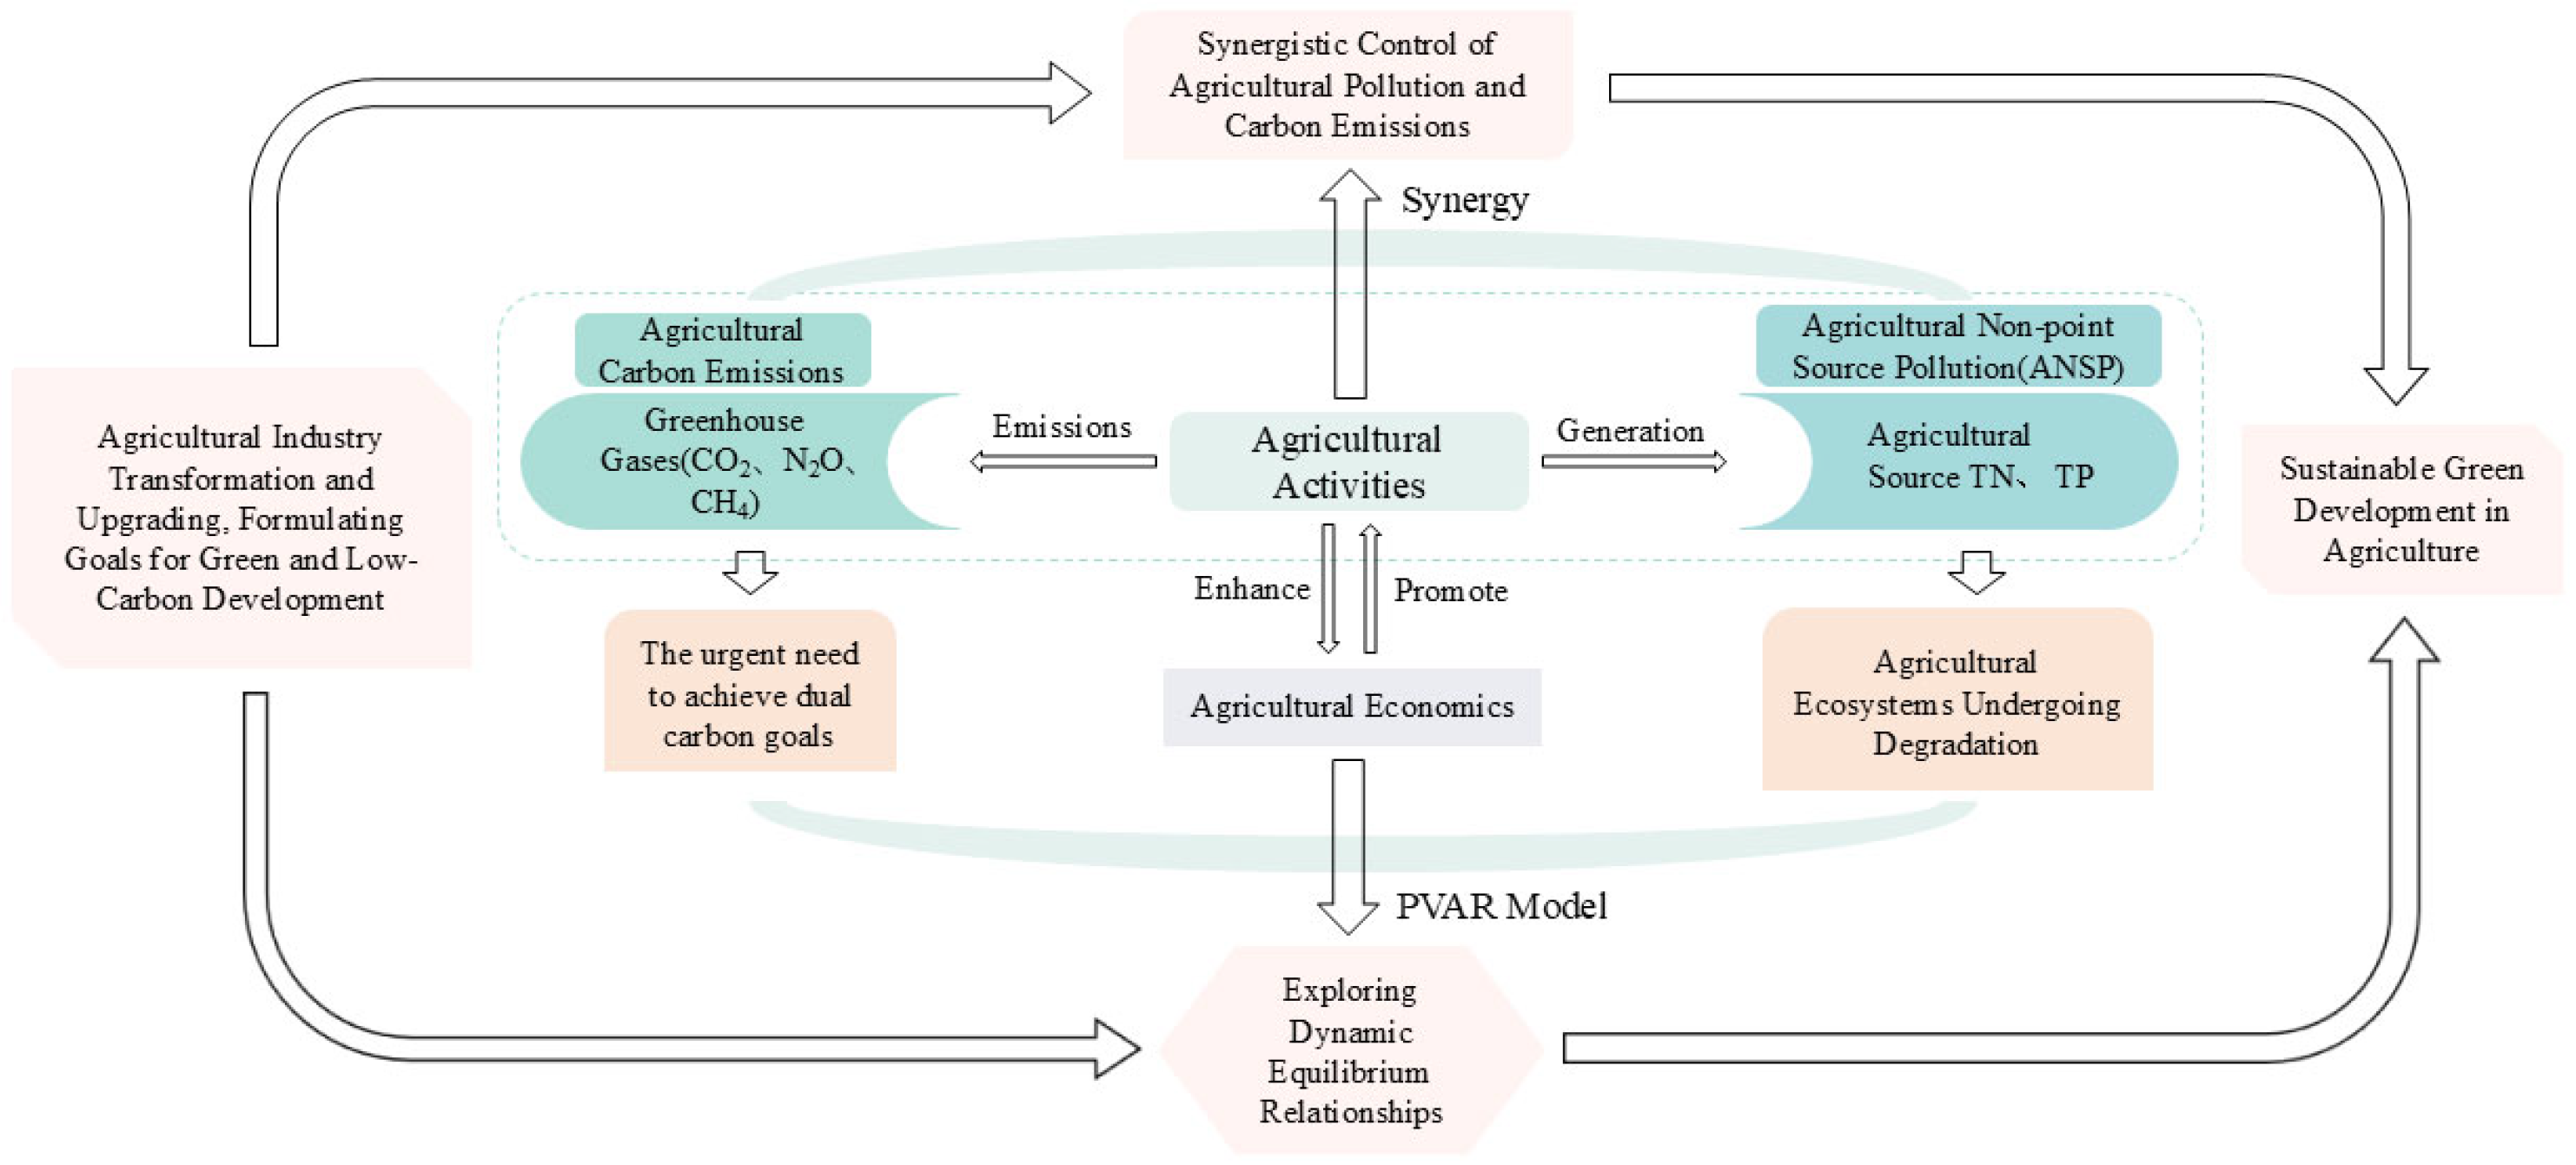
2.2. Coordination and Interaction Mechanism
2.3. Methods
2.3.1. Accounting for Agricultural Carbon Emissions and Non-Point Source Pollution
2.3.2. Coupling Coordination Model
2.3.3. Non-Parametric Kernel Density Estimation
2.3.4. PVAR Model
3. Results and Analysis
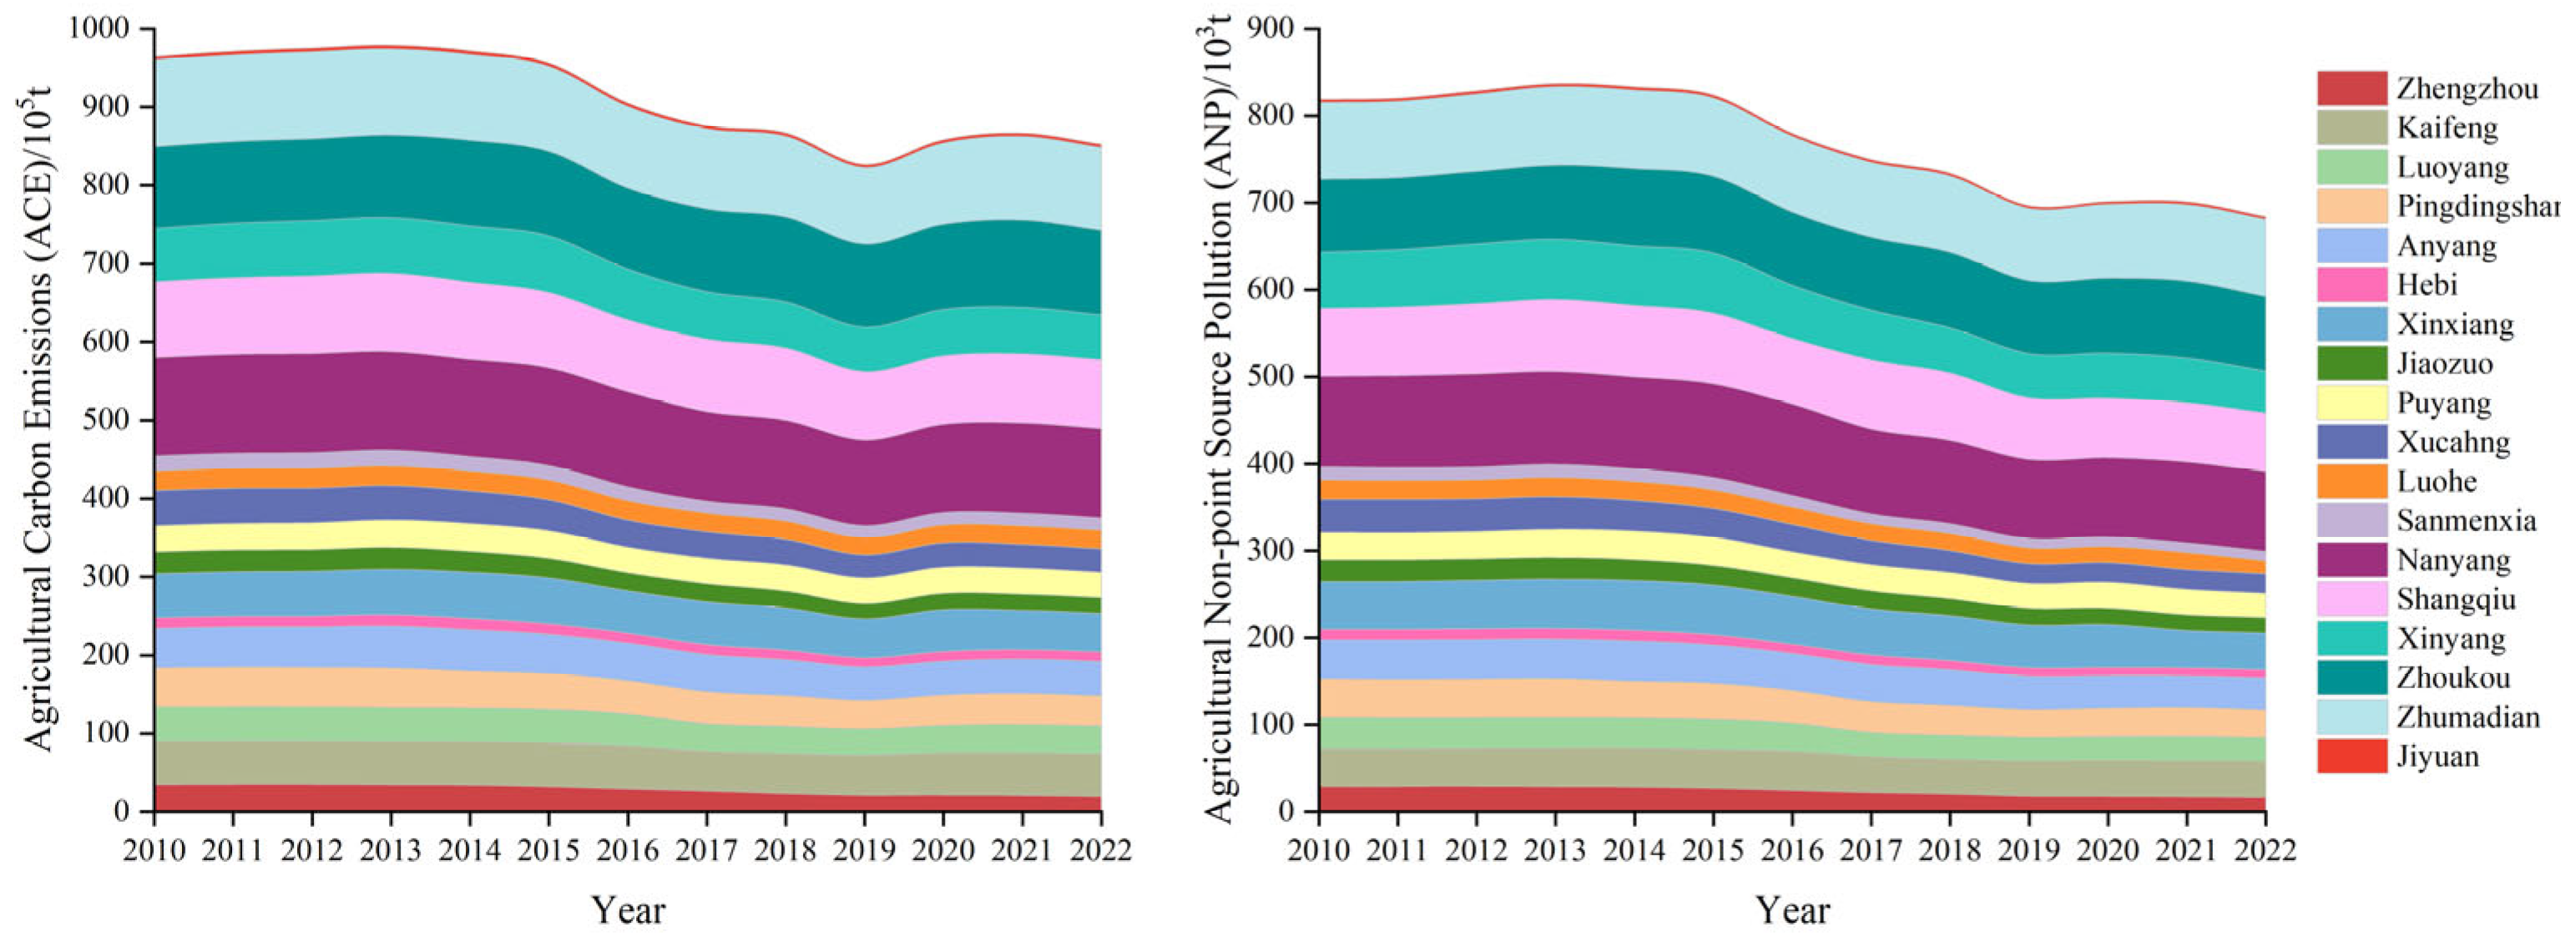
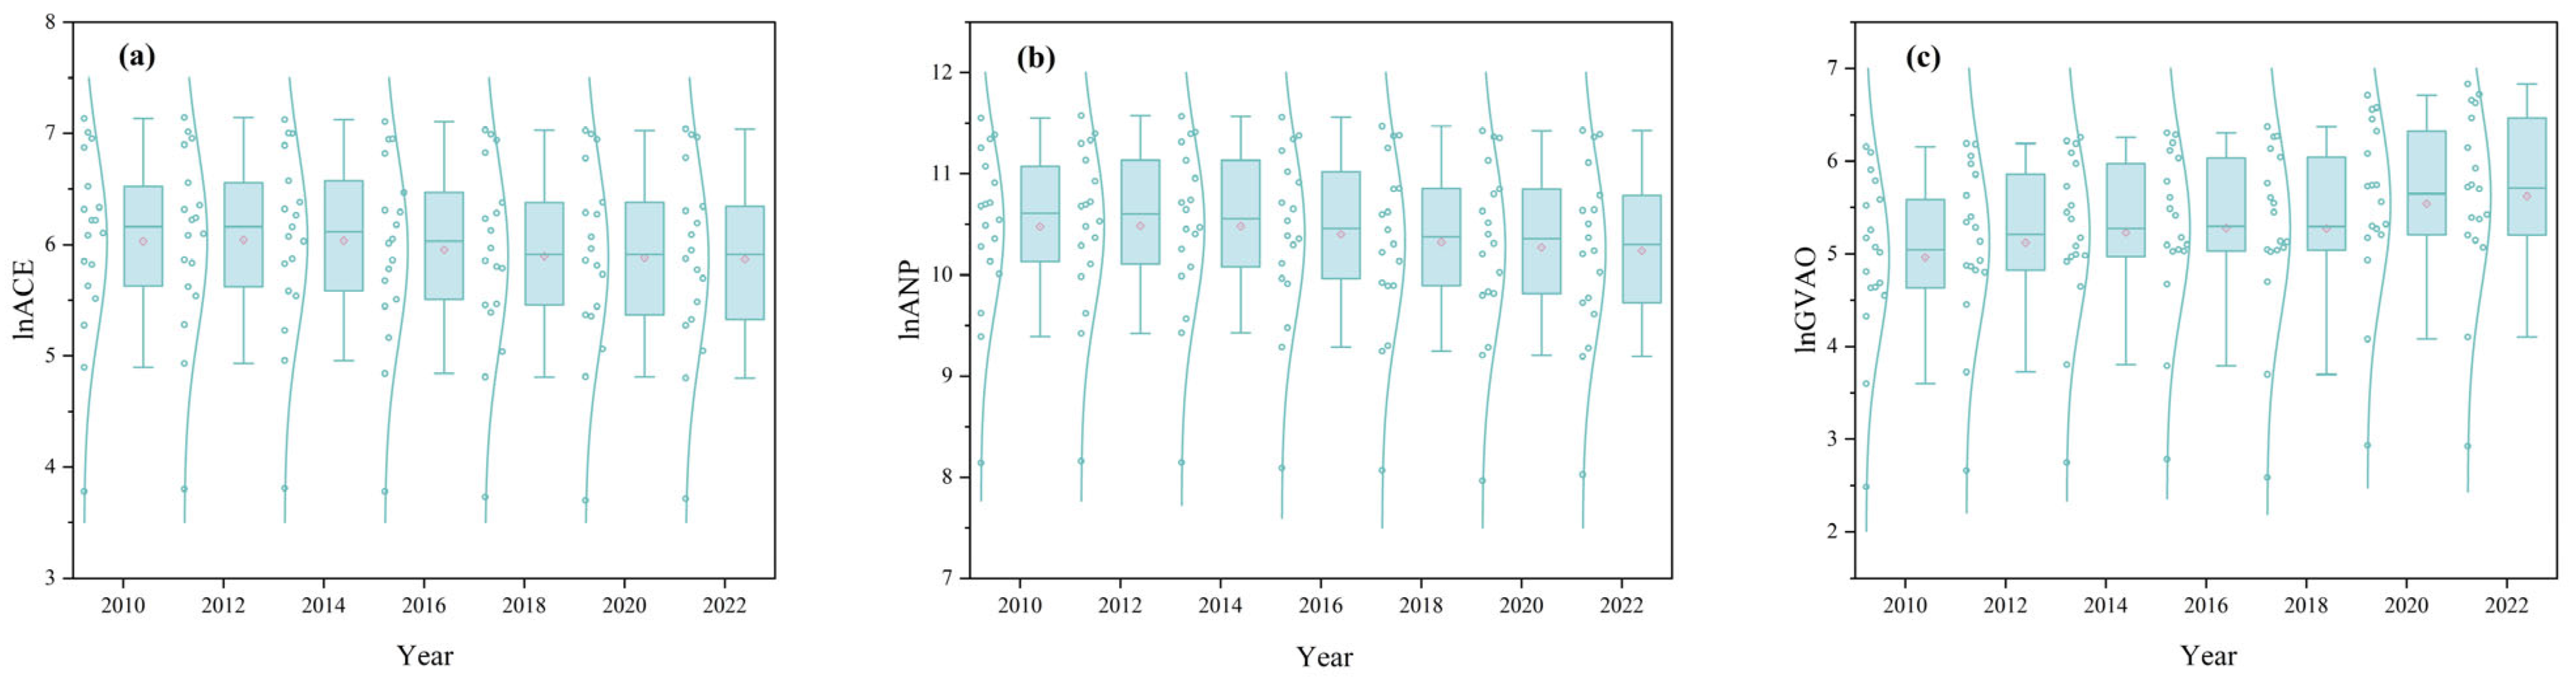
3.1. Temporal Analysis of Agricultural Carbon Emissions and Non-Point Source Pollution in Agriculture
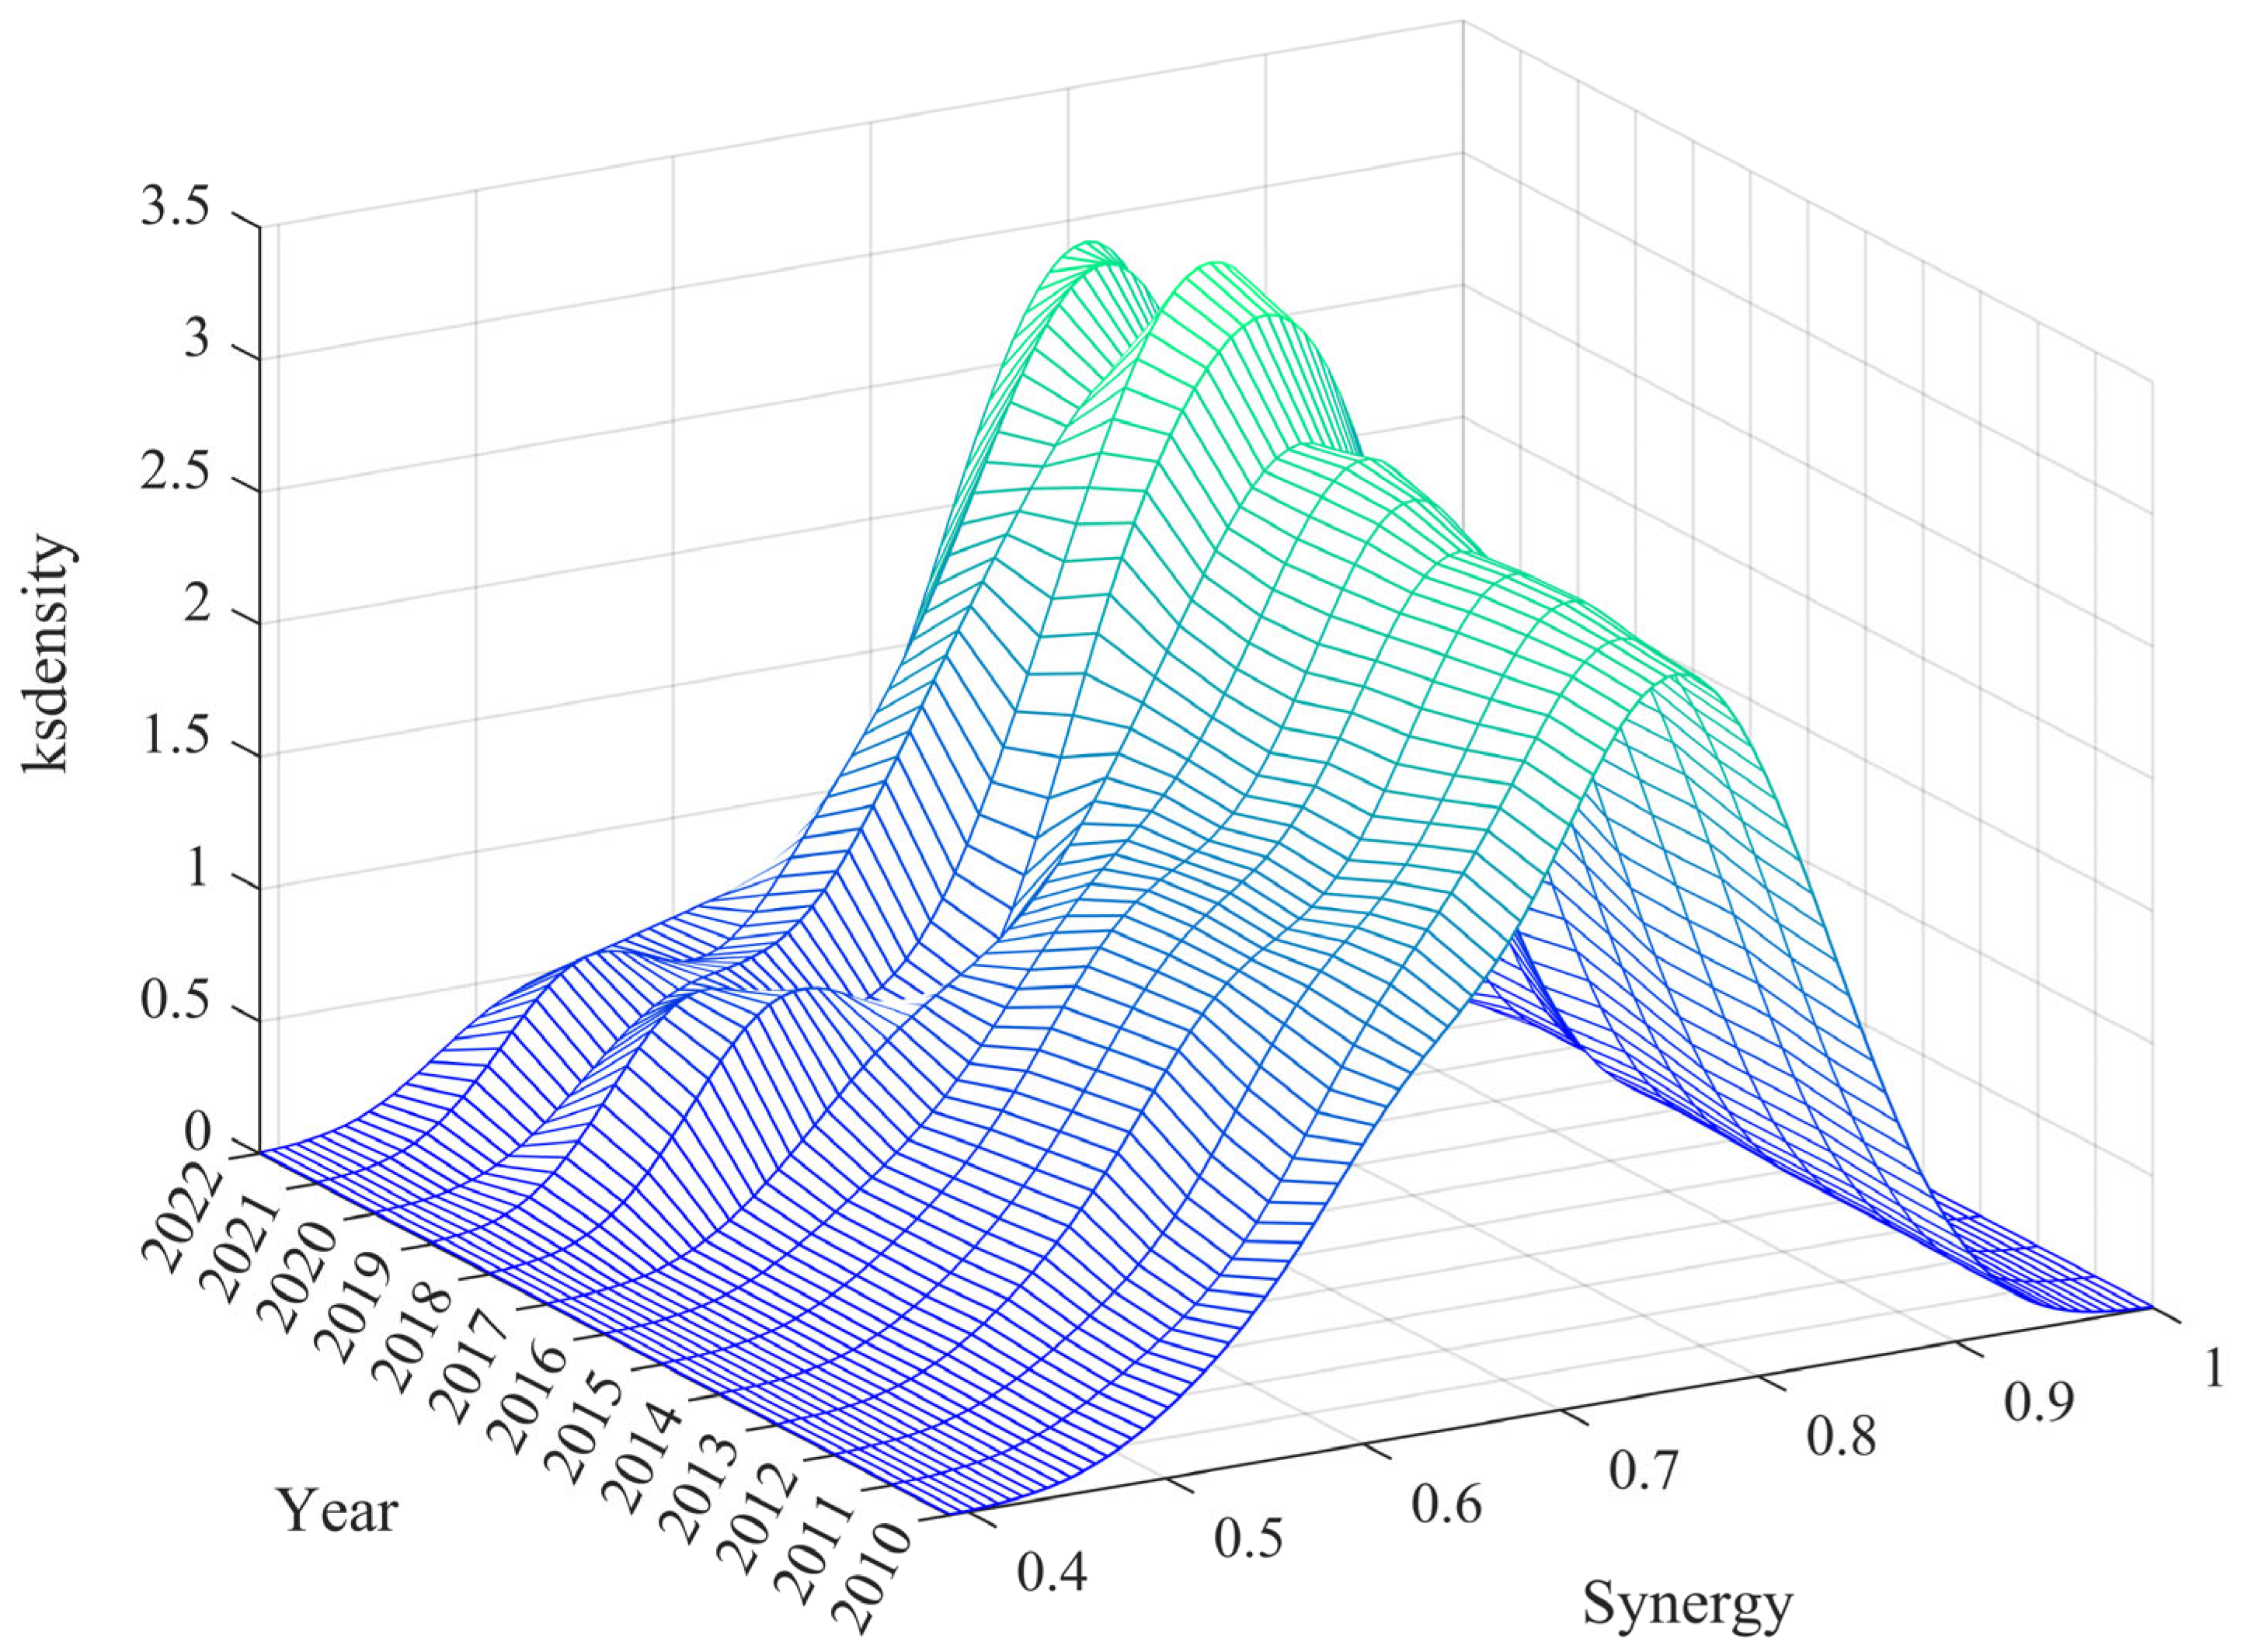
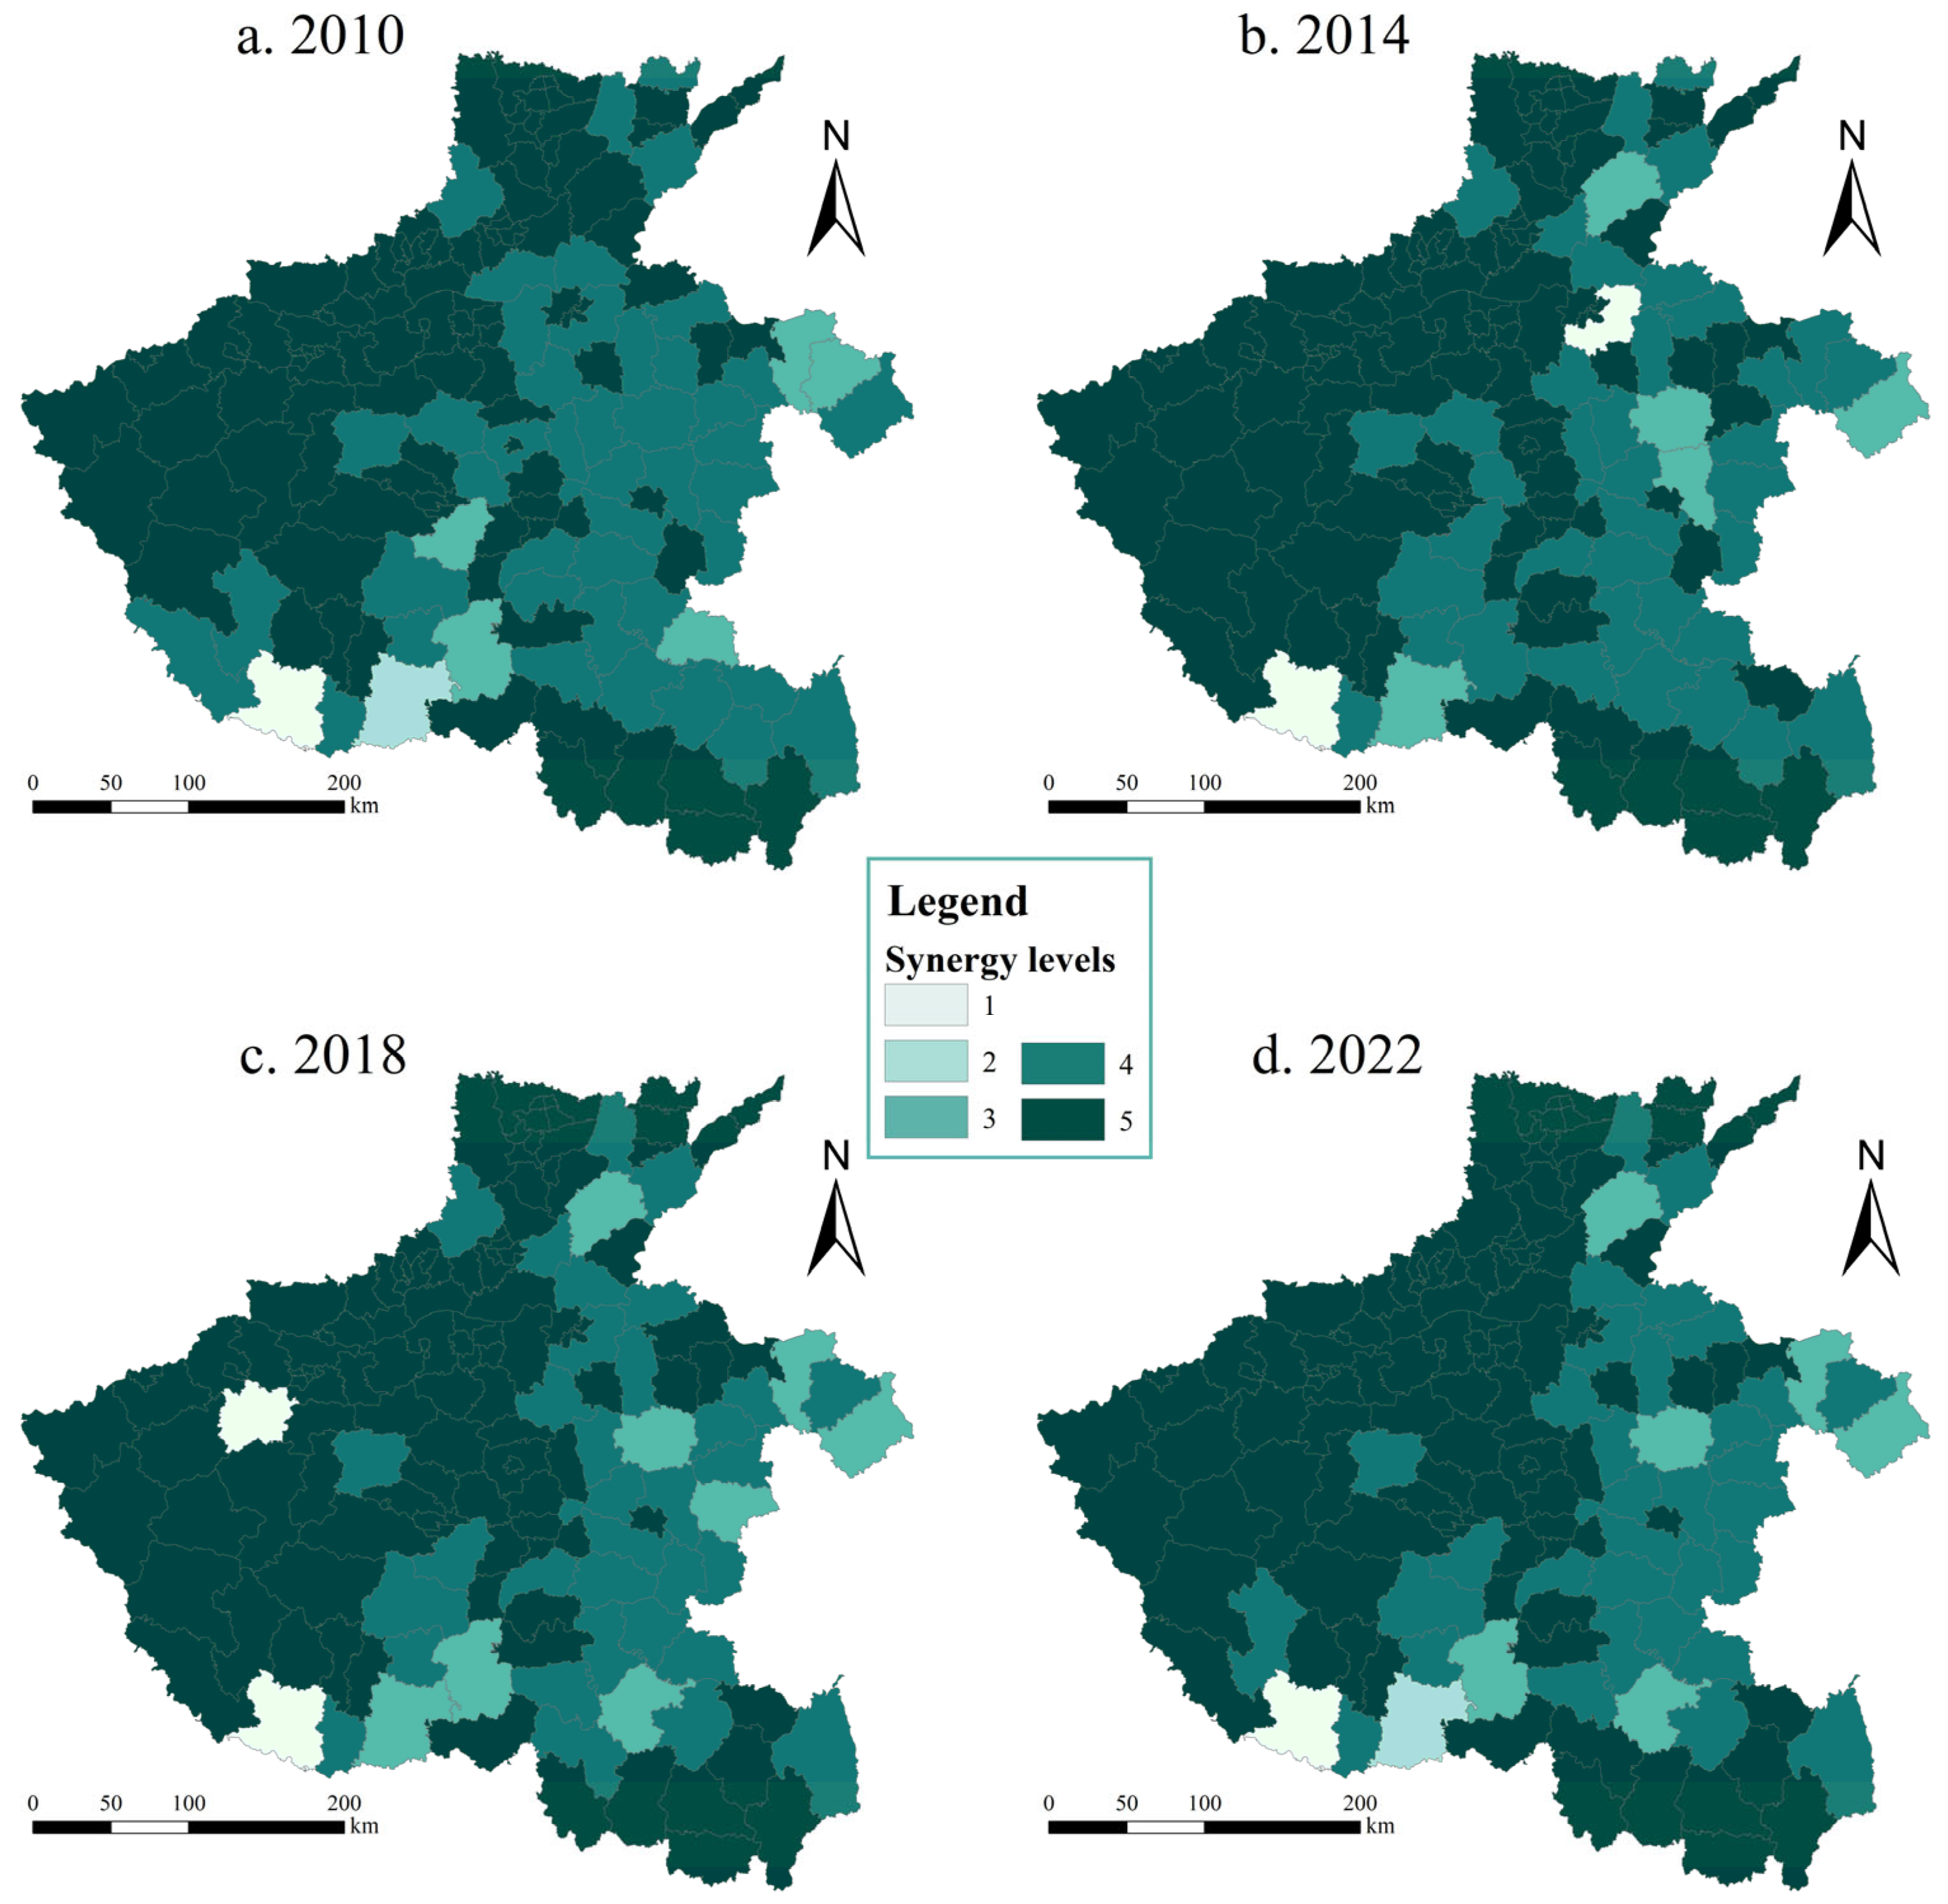
3.2. Spatio-Temporal Analysis of the Degree of Synergy of Agricultural Pollution Reduction and Carbon Emission Mitigation
3.3. Empirical Analysis of the PVAR Model
3.3.1. Descriptive Statistics of the Variables
3.3.2. Unit Root and Cointegration Tests of Variables
3.3.3. Determination of the Optimal Lag Order and Stability Test
3.3.4. Estimation Results of the PVAR Model
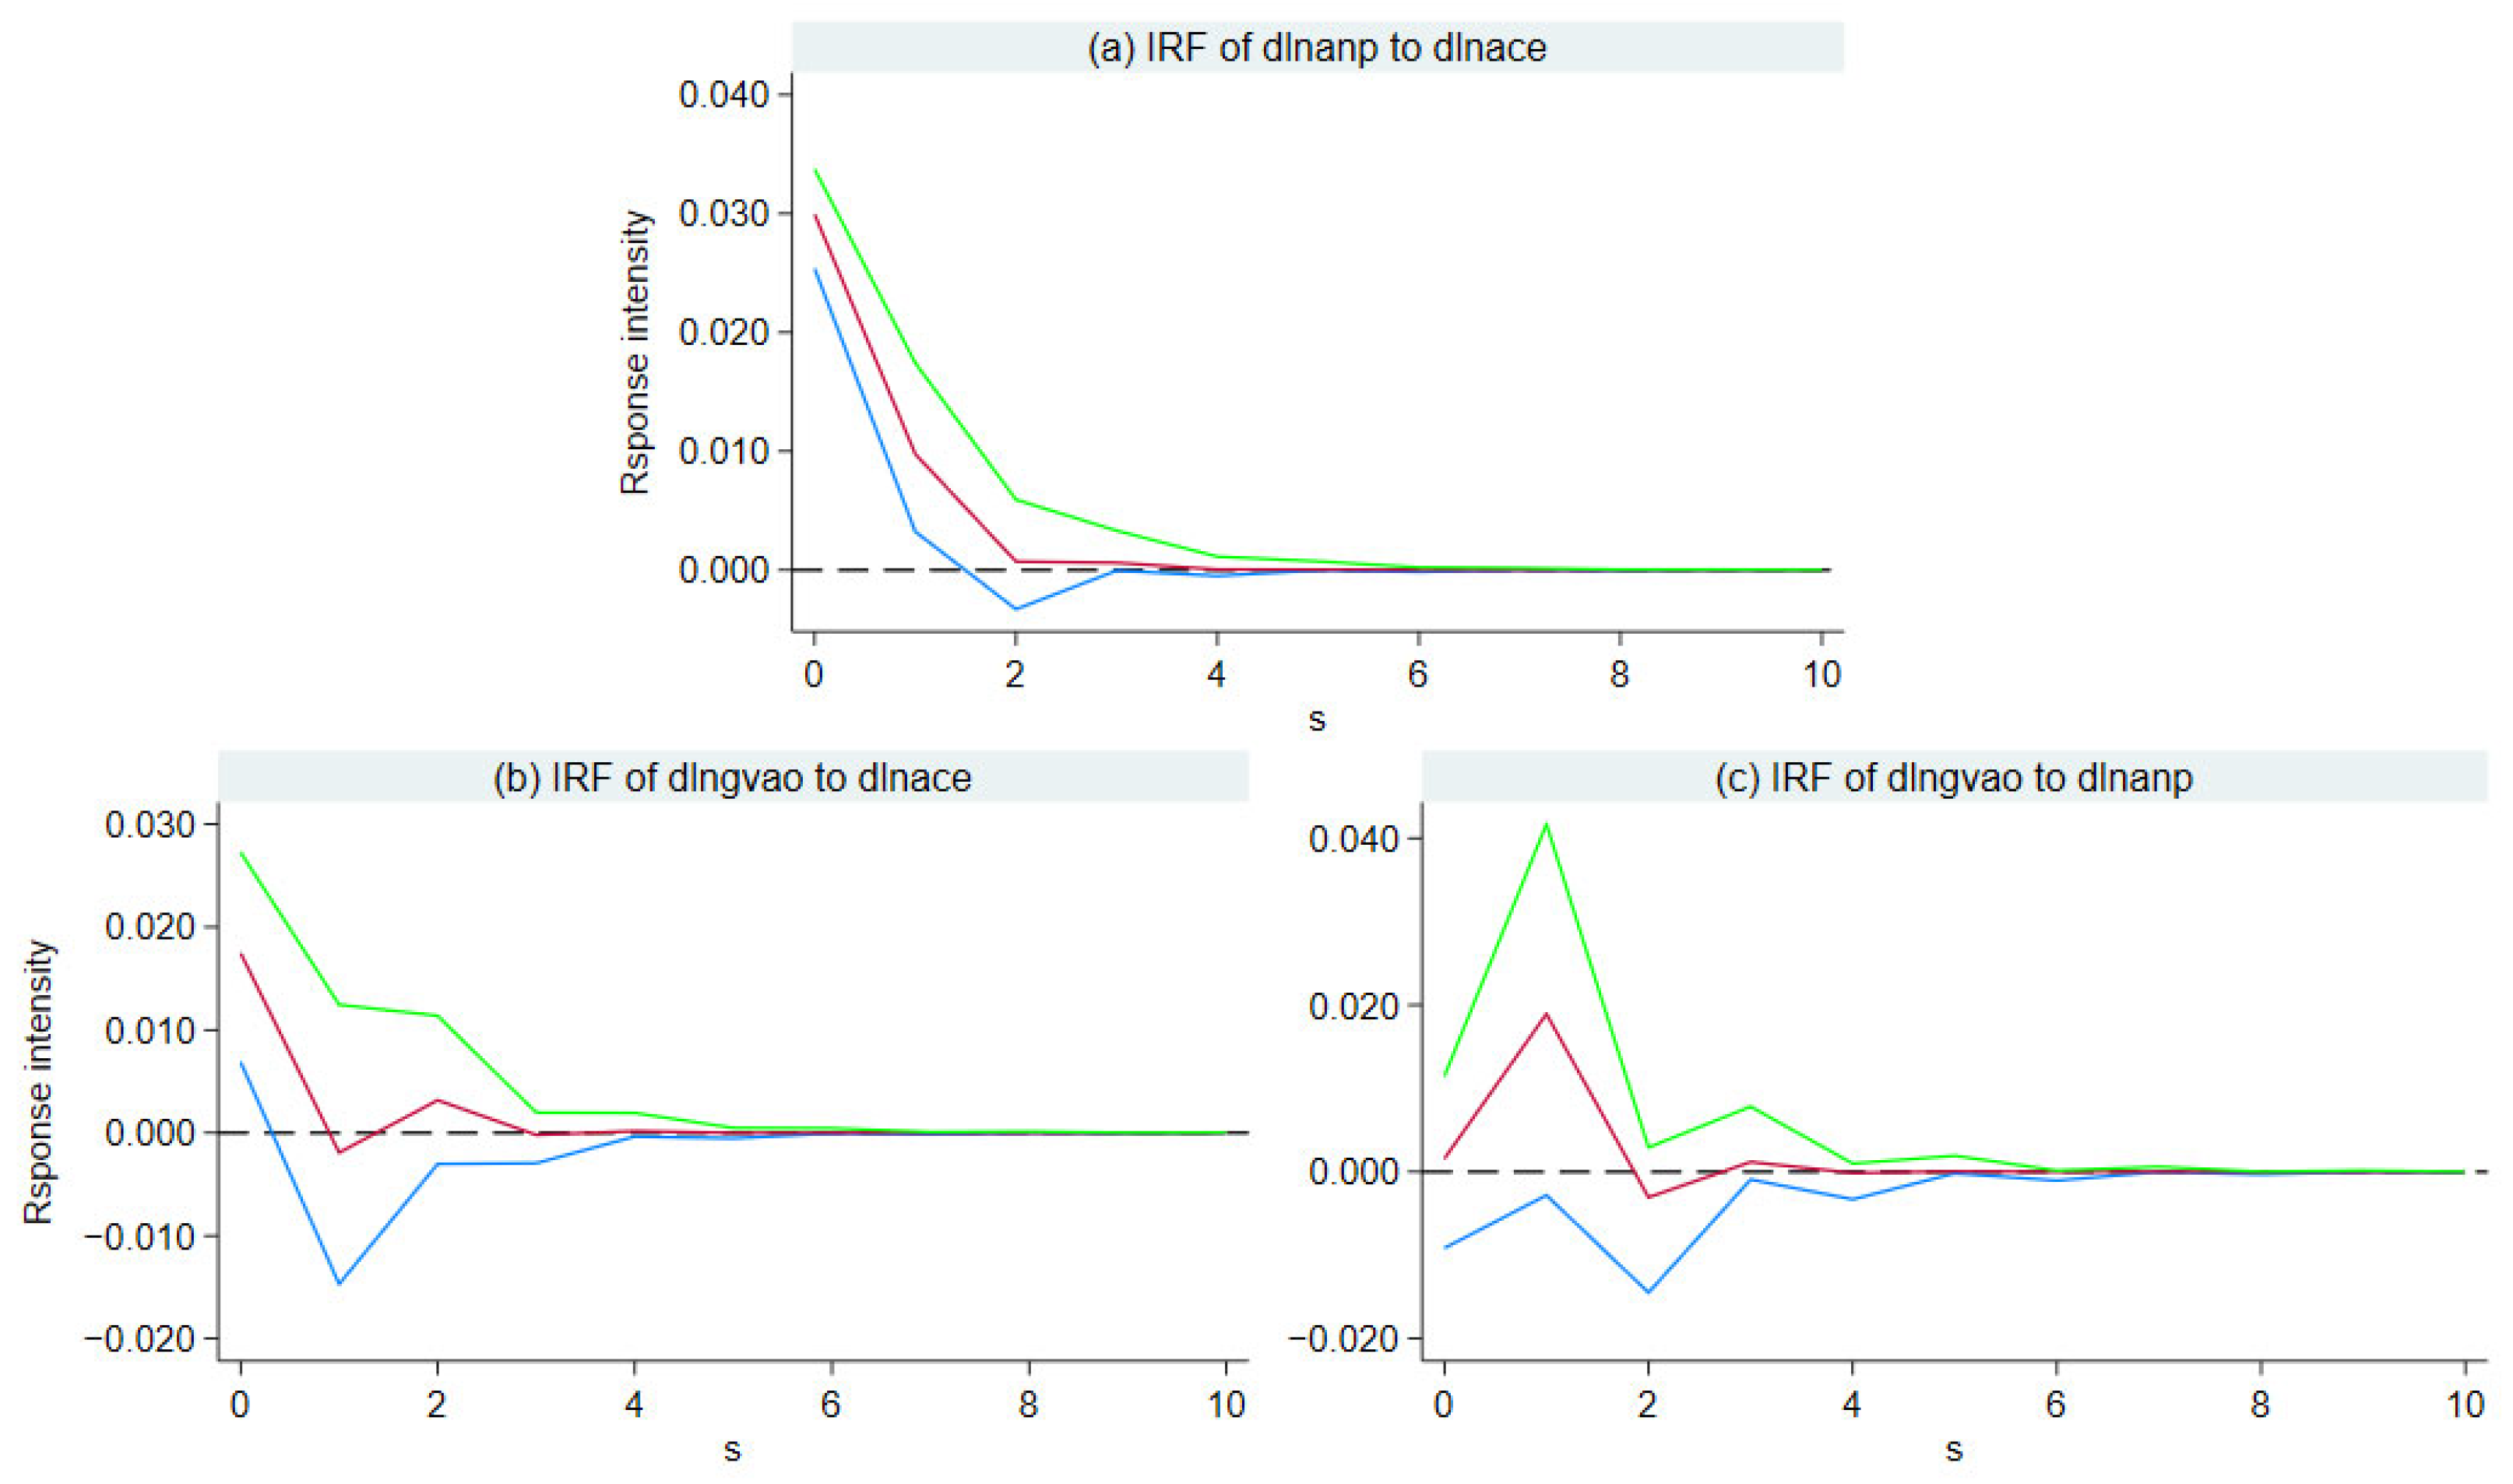
3.3.5. Impulse Response Analysis
3.3.6. Variance Decomposition
4. Discussion
5. Conclusions and Recommendations
5.1. Research Conclusions
5.2. Policy Recommendations
Author Contributions
Funding
Institutional Review Board Statement
Data Availability Statement
Conflicts of Interest
References
- Di, Q.; Liang, C.; Chen, X. Dynamic coordination effect of pollution reduction and carbon reduction and economic development in Guangdong Province. Environ. Sci. 2025, 46, 669–681. [Google Scholar] [CrossRef]
- Lulovicova, A.; Bouissou, S. Life cycle assessment as a prospective tool for sustainable agriculture and food planning at a local level. Geogr. Sustain. 2024, 5, 251–264. [Google Scholar] [CrossRef]
- Jónsdóttir, S.; Gísladóttir, G. Land use planning, sustainable food production and rural development: A literature analysis. Geogr. Sustain. 2023, 4, 391–403. [Google Scholar] [CrossRef]
- Fan, Z.; Qi, X.; Zeng, L.; Wu, F. Accounting of greenhouse gas emissions in the Chinese agricultural system from 1980 to 2020. Acta Ecol. Sin. 2022, 42, 9470–9482. [Google Scholar] [CrossRef]
- Qiu, W.; Zhong, Z.; Yuan, C.; Li, Z. Spatial differences and dynamic evolution of agricultural non-point source pollution in China. J. China Agric. Univ. 2018, 23, 152–163. [Google Scholar]
- Ma, J.; Yue, Z. The analysis of the spatial difference and its influencing factors of agricultural non-point source pollution in China. Res. Agric. Mod. 2021, 42, 1137–1145. [Google Scholar] [CrossRef]
- Zhao, R.; Huang, X.; Yun, W.; Wu, K.; Chen, Y.; Wang, S.; Lu, H.; Fang, K.; Li, Y. Key issues in natural resource management under carbon emission peak and carbon neutrality targets. J. Nat. Resour. 2022, 37, 1123–1136. [Google Scholar] [CrossRef]
- Zhang, H.; Yuan, P.; Zhu, Z. Decoupling effects of carbon emissions and reduction path in the Yellow River Basin. Resour. Sci. 2022, 44, 59–69. [Google Scholar] [CrossRef]
- Robert, U.A.; Jörg, W. The greenhouse effect: Damages, costs and abatement. Environ. Resour. Econ. 1991, 1, 237–270. [Google Scholar] [CrossRef]
- Feng, S.; Xu, D.; Zhang, R. How does the development of digital finance reduce CO2 emissions?—Empirical analysis based on prefecture-level cities. Mod. Econ. Sci. 2023, 45, 15–28. [Google Scholar] [CrossRef]
- Gao, Q.; Gao, W.; Ma, Z.; Tang, J.; Fu, J.; Li, Y.; Ren, J. The synergy effect assessment method and its application for air pollutants and greenhouse gases reduction. Clim. Change Res. 2021, 17, 268–278. [Google Scholar]
- Fan, H.; Jie, X.; Li, L.; Li, X.; Wu, Y.; Li, D.; Liu, J. Synergistic effect of agricultural pollution reduction and carbon reduction and its driving factors in Henan Province. Environ. Sci. 2025, 32, 1–18. [Google Scholar] [CrossRef]
- Zhu, Y.; Qi, Z.; Wang, L.; Yang, X. Spatial and temporal evolution and driving factors of synergistic effects of agricultural pollution and carbon emission reduction in China. J. Ecol. Rural Environ. 2024, 40, 1201–1212. [Google Scholar] [CrossRef]
- Liu, H.; Zhang, Y. Synergistic effect of pollution reduction and carbon emission reduction: Generating logic, connotation explanation and realization strategy. Mod. Econ. Sci. 2024, 46, 32–44. [Google Scholar] [CrossRef]
- Mao, X.; Yang, S.; Liu, Q.; Tu, J.; Jaccard, M. Achieving CO2 emission reduction and the co-benefits of local air pollution abatement in the transportation sector of China. Environ. Sci. Policy 2012, 21, 1–13. [Google Scholar] [CrossRef]
- Fu, J.; Yuan, Z. Evaluation of effect and analysis of expansion mechanism of synergic emission abatement in China’s power industry. China Ind. Econ. 2017, 2, 43–59. [Google Scholar] [CrossRef]
- Peng, S.; Zhao, H.; Chai, H. Pollution and carbon emission reduction and synergistic pathways in the operation phase of sponge city source control facilities. Environ. Sci. 2025, 46, 1548–1557. [Google Scholar] [CrossRef]
- Wu, X.; Qiu, W. Analysis of the synergistic effects of energy consumption permit trading scheme on pollution reduction and carbon abatement. Environ. Sci. 2024, 45, 4627–4635. [Google Scholar] [CrossRef]
- Liu, S.; Liu, C. Synergistic effect of agricultural pollution reduction and carbon reduction and its influence mechanism in China. Chin. J. Eco-Agric. 2024, 32, 1109–1121. [Google Scholar] [CrossRef]
- Li, Y.; Li, M. Coupling coordination, spatial-temporal patterns and dynamic impact of the new urbanization and ecological resilience in the Yangtze River Economic Belt. Resour. Environ. Yangtze Basin 2024, 33, 2329–2341. [Google Scholar]
- Li, X.; Long, X.; Qi, X. Dynamic evolution and analysis of coupling development of economy, society and environment in Yangtze River Economic Belt. Resour. Environ. Yangtze Basin 2019, 28, 505–516. [Google Scholar]
- Wang, Y.; Zhang, X.; Zhu, L.; Wang, X.; Zhou, L.; Yu, X. Synergetic effect evaluation of pollution and carbon emissions in an industrial park: An environmental impact perspective. J. Clean. Prod. 2024, 467, 142891. [Google Scholar] [CrossRef]
- Di, Q.; Chen, X.; Hou, Z. Regional differences and key pathway identification of the coordinated governance of pollution control and carbon emission reduction in the three major urban agglomerations of China under the “Double-Carbon” targets. Resour. Sci. 2022, 44, 1155–1167. [Google Scholar] [CrossRef]
- Gao, J. Pollution reduction and carbon reduction should be aimed at coordinating high-quality economic development. Environ. Sustain. Dev. 2021, 46, 11–12. [Google Scholar] [CrossRef]
- Shao, Z.; Li, K.; Li, M. Decoupling effect and interactive relationship among transportation infrastructure, economic growth, and carbon emissions in China. Environ. Sci. 2025. [Google Scholar] [CrossRef]
- Lian, Y. Economic levels and environmental pollution: A study on the Environmental Kuznets Curve based on carbon emissions. Stat. Decis. 2021, 37, 146–150. [Google Scholar] [CrossRef]
- Chen, H.; Zhang, X.; Wu, R.; Cai, T. Revisiting the environmental Kuznets curve for city-level CO2 emissions: Based on corrected NPP-VIIRS nighttime light data in China. J. Clean. Prod. 2020, 268, 121575. [Google Scholar] [CrossRef]
- Antonakakis, N.; Chatziantoniou, I.; Filis, G. Energy consumption, CO2 emissions, and economic growth: An ethical dilemma. Renew. Sust. Energ. Rev. 2017, 68, 808–824. [Google Scholar] [CrossRef]
- Charfeddine, L.; Kahia, M. Impact of renewable energy consumption and financial development on CO2 emissions and economic growth in the MENA region: A panel vector autoregressive (PVAR) analysis. Renew. Energy 2019, 139, 198–213. [Google Scholar] [CrossRef]
- Uche, E.; Da, N.; Bera, P. Re-examining the environmental Kuznets curve (EKC) for India via the multiple threshold NARDL procedure. Environ. Sci. Pollut. Res. 2023, 30, 11913–11925. [Google Scholar] [CrossRef]
- Wang, Q.; Wang, S. Decoupling economic growth from carbon emissions growth in the United States: The role of research and development. J. Clean. Prod. 2019, 234, 702–713. [Google Scholar] [CrossRef]
- Xu, G.; Song, D. An empirical study of the Environmental Kuznets Curve for China’s carbon emissions——Based on provincial panel data. China Ind. Econ. 2010, 37–47. [Google Scholar] [CrossRef]
- Cheng, L.; Hu, X.; Wang, Z.; Liu, K. The N-shaped industrial water use Environmental Kuznets Curve and its formation mechanism: A case study from Shandong Province. Adv. Water Sci. 2019, 30, 673–681. [Google Scholar] [CrossRef]
- Yan, M.; Ma, Y.; Qiao, J. Discussion on the relationship between agricultural economic growth and agricultural non-point source pollution in Henan Province: Empirical analysis based on EKC theory. J. Henan Univ. Nat. Sci. 2021, 51, 12–19. [Google Scholar] [CrossRef]
- Barut, A.; Kaya, E.; Bekun, F.V.; Cengiz, S. Environmental sustainability amidst financial inclusion in five fragile economies: Evidence from lens of environmental Kuznets curve. Energy 2023, 269, 126802. [Google Scholar] [CrossRef]
- Wang, Q.; Zhang, F. The effects of trade openness on decoupling carbon emissions from economic growth—Evidence from 182 countries. J. Clean. Prod. 2021, 279, 123838. [Google Scholar] [CrossRef] [PubMed]
- Xu, Y. Research on the Relationship Between China’s Industrial Environmental Quality and Economic Growth, Verification of the Environmental Kuznets Curve. Master’s Thesis, Guangdong University of Finance & Economics, Guangzhou, China, 2021. [Google Scholar]
- Chen, X.; Hou, B.; Chen, L.; Wang, J.; Wang, L.; Huang, Y. Formation mechanism and future development trend of Kuznets Curve for industrial water environment in Ningxia. South-North Water Transf. Water Sci. Technol. 2021, 19, 342–351. [Google Scholar] [CrossRef]
- Ghaderi, Z.; Saboori, B.; Khoshkam, M. Revisiting the Environmental Kuznets Curve Hypothesis in the MENA Region: The Roles of International Tourist Arrivals, Energy Consumption and Trade Openness. Sustainability 2023, 15, 2553. [Google Scholar] [CrossRef]
- Li, J.; Pei, X.; Yang, G.; Shi, G.; Zhang, C.; Zhou, L. Decoupling relationship and driving effect between livestock carbon emissions and economic efficiency in Qinghai Province. Acta Ecol. Sin. 2024, 44, 1–16. [Google Scholar] [CrossRef]
- Qin, X.; Hu, X.; Xia, W. Investigating the dynamic decoupling relationship between regional social economy and lake water environment: The application of DPSIR-Extended Tapio decoupling model. J. Environ. Manag. 2023, 345, 118926. [Google Scholar] [CrossRef]
- Zhang, H.; Huang, Y.; Wang, R.; Zhang, J.; Peng, J. Decoupling and spatiotemporal change of carbon emissions at the county level in China. Resour. Sci. 2022, 44, 744–755. [Google Scholar] [CrossRef]
- Hou, L.; Wang, L.; Qian, Y.; Tang, L. Decoupling status and driving mechanisms of carbon emissions in the Golden Triangle of Southern Fujian under “carbon peaking and neutrality” goals. Acta Ecol. Sin. 2022, 42, 9663–9676. [Google Scholar] [CrossRef]
- Wang, S.; Ji, G.; Qiu, F. Research on the decoupling and synergistic relationship between haze, carbon emissions and economic growth. Soft Sci. 2022, 36, 104–110. [Google Scholar] [CrossRef]
- Dong, K.; Sun, R.; Jiang, H.; Zeng, X. CO2 emissions, economic growth, and the environmental Kuznets curve in China: What roles can nuclear energy and renewable energy play? J. Clean. Prod. 2018, 196, 51–63. [Google Scholar] [CrossRef]
- Cheng, T.; Da, Y. Income balance, carbon emissions and economic growth. Soft Sci. 2022, 36, 68–74. [Google Scholar] [CrossRef]
- Loganathan, N.; Shahbaz, M.; Taha, R. The link between green taxation and economic growth on CO2 emissions: Fresh evidence from Malaysia. Renew. Sust. Energ. Rev. 2014, 38, 1083–1091. [Google Scholar] [CrossRef]
- Dai, Y.; Zhang, Y.; Ke, X.; Chen, Y. Coupling interaction and driving factors of cultivated land use transition and county urbanization: A case study in Henan Province. J. Nat. Resour. 2024, 39, 206–227. [Google Scholar] [CrossRef]
- Chen, X.; Di, Q.; Liang, C. Coupling relationship and interactive response between pollution control and carbon emission reduction and high-quality economic development in China’s urban agglomerations. Environ. Sci. 2024, 45, 6313–6325. [Google Scholar] [CrossRef]
- Yang, F.; Zhen, J. Relationship between pollution and carbon reduction and economic growth in typical regions under the “Dual Carbon” goals: A case study of urban agglomeration in the Yellow River Basin. Res. Environ. Sci. 2023, 36, 2050–2064. [Google Scholar] [CrossRef]
- Cheng, L. Spatial and Temporal Differentiation of China’s Agricultural Carbon Productivity: Mechanism and Demonstration. Ph.D. Thesis, Huazhong Agricultural University, Wuhan, China, 2018. [Google Scholar]
- Ding, B.; Yang, S.; Zhao, Y.; Yi, S. Study on spatio-temporal characteristics and decoupling effect of carbon emission from cultivated land resource utilization in China. China Land Sci. 2019, 33, 45–54. [Google Scholar] [CrossRef]
- Hu, X.; Wang, J. Estimation of livestock greenhouse gases discharge in China. Trans. CSAE 2010, 26, 247–252. [Google Scholar] [CrossRef]
- Li, B.; Zhang, J.; Li, H. Research on spatial-temporal characteristics and affecting factors decomposition of agricultural carbon emission in China. China Popul. Resour. Environ. 2011, 21, 80–86. [Google Scholar] [CrossRef]
- Min, J.; Hu, H. Calculation of greenhouse gases emission from agricultural production in China. China Popul. Resour. Environ. 2012, 22, 21–27. [Google Scholar] [CrossRef]
- Du, Y.; Liu, H.; Huang, H.; Li, X. The carbon emission reduction effect of agricultural policy—Evidence from China. J. Clean. Prod. 2023, 406, 137005. [Google Scholar] [CrossRef]
- Ning, J.; Li, Y.; Wang, Z.; Chen, K. Characteristics and influencing factors of agricultural carbon emissions in major grain producing provinces in China. Res. Soil Water Conserv. 2024, 31, 450–459. [Google Scholar] [CrossRef]
- Tian, Y.; Yin, M. Re-evaluation of China’s agricultural carbon emissions: Basic status, dynamic evolution and spatial spillover effects. Chin. Rural Econ. 2022, 3, 104–127. [Google Scholar]
- Lin, J.; Wang, Y.; Fan, X. Research on economic driving characteristics of agricultural non-point source pollution in Ningxia. J. Arid Land Resour. Environ. 2021, 35, 58–65. [Google Scholar] [CrossRef]
- Song, D.; Zuo, Q.; Liu, B.; Zou, G.; Liu, D. Estimation of spatio-temporal variability and health risks of nitorgen emissions from agricultural non-point source pollution: A case study of the Huaihe River Basin, China. J. Agro-Environ. Sci. 2018, 37, 1219–1231. [Google Scholar] [CrossRef]
- Zou, L.; Liu, Y.; Wang, Y.; Hu, X. Assessment and analysis of agricultural non-point source pollution loads in China: 1978–2017. J. Environ. Manag. 2020, 263, 110400. [Google Scholar] [CrossRef]
- Lai, S. Study on Non-Point Sources Pollution Investigation and Evaluation Method and Its Application. Master’s Thesis, Tsinghua University, Beijing, China, 2003. [Google Scholar]
- Ge, X.; Huang, B.; Yuan, Z.; Wang, D.; Wang, Q.; Chen, J.; Xie, Z. Temporal and spatial variation characteristics and source analysis of agricultural non-point source pollution load in Guangdong during the past 20 years. Environ. Sci. 2022, 43, 3118–3127. [Google Scholar] [CrossRef]
- Wang, N.; Weng, G. Coordinated relationship and interactive response between provincial-level cultural tourism economy and the construction of the rule of law in cultural tourism. Econ. Geogr. 2024, 44, 230–240. [Google Scholar] [CrossRef]
- Jiang, F.; Chen, B.; Li, P.; Jiang, J.; Zhang, Q.; Wang, J.; Deng, J. Spatio-temporal evolution and influencing factors of synergizing the reduction of pollution and carbon emissions—Utilizing multi-source remote sensing data and GTWR model. Environ. Res. 2023, 229, 115775. [Google Scholar] [CrossRef]
- Zhang, S.; Huang, C.; Li, X.; Song, M. The spatial-temporal evolution and influencing factors of the coupling coordination of new-type urbanization and ecosystem services value in the Yellow River Basin. Ecol. Indic. 2024, 166, 112300. [Google Scholar] [CrossRef]
- Jahanger, A.; Hossain, M.R.; Awan, A.; Adebayo, T.S.; Chishti, M.Z. Linking tourist’s footprint and environmental tragedy through transportation, globalization and energy choice in BIMSTEC region: Directions for a sustainable solution using novel GMM-PVAR approach. J. Environ. Manag. 2023, 345, 118551. [Google Scholar] [CrossRef] [PubMed]
- Liu, Z.; Xu, J.; Zhang, C. Technological innovation, industrial structure upgrading and carbon emissions efficiency: An analysis based on PVAR model of panel data at provincial level. J. Nat. Resour. 2022, 37, 508–520. [Google Scholar] [CrossRef]
- Li, W.; Hao, N.; Lu, C. A PVAR dynamic correlation appraisal of China’s carbon emissions in conjunction with economic growth and clean energy use. Renew. Energy 2023, 219, 119484. [Google Scholar] [CrossRef]
- Zhao, T.; Zhu, L.; Wang, L.; Sun, Z.; Zhang, Z.; Dong, Q.; Zhu, W. Coupling mechanisms of eco-environmental quality and human activities in China and their influencing factors. Environ. Sci. 2024, 45, 3341–3351. [Google Scholar] [CrossRef]
- Chang, Q.; Cai, W.; Gu, X.; Wu, Y.; Zhang, B. Spatial-temporal variation, influencing factors, and trend prediction of agricultural carbon emissions in Henan Province. Bull. Soil Water Conserv. 2023, 43, 367–377. [Google Scholar] [CrossRef]
- Wang, Y.; Li, B.; Zhang, Y.; Zhao, Y.; Miao, C.; An, J. Spatiotemporal characteristics and influencing factors of the synergistic effect of pollution reduction and carbon reduction in China. Environ. Sci. 2024, 45, 4993–5002. [Google Scholar] [CrossRef]
- Li, X.; Li, L.; Fan, H.; Shang, Y.; Li, D.; Wu, Y. Characterization of spatial and temporal evolution of total phosphorus pollution from agricultural non-point sources and analysis of influencing factors in Henan Province. J. Agric. Resour. Environ. 2025. [Google Scholar] [CrossRef]
- Pedroni, P. Purchasing power parity tests in cointegrated panels. Rev. Econ. Stat. 2001, 83, 727–731. [Google Scholar] [CrossRef]
- Westerlund, J. Testing for error correction in panel data. Oxf. Bull. Econ. Stat. 2007, 69, 709–748. [Google Scholar] [CrossRef]
- Ke, X.; Lin, J.Y.; Fu, C.; Wang, Y. Transport infrastructure development and economic growth in China: Recent evidence from dynamic panel system-GMM analysis. Sustainability 2020, 12, 5618. [Google Scholar] [CrossRef]
- Song, N.; Yuan, Y. Interactive response between tourism carbon emission reduction potential and tourism carbon emission efficiency in the Yangtze River Economic Belt. Econ. Geogr. 2023, 43, 225–233. [Google Scholar] [CrossRef]
- Tzeremes, P.; Dogan, E.; Alavijeh, N.K. Analyzing the nexus between energy transition, environment and ICT: A step towards COP26 targets. J. Environ. Manag. 2023, 326, 116598. [Google Scholar] [CrossRef]
- Yuan, W.; Sun, H.; Wang, J.; Li, J.; Ma, D. Spatial-temporal evolution and driving forces of urban pollution and carbon reduction in China. Econ. Geogr. 2022, 42, 72–82. [Google Scholar] [CrossRef]
- Yan, K.; Tang, D.; Gan, T. Quantitative evaluation and dynamic evolution of the synergistic effect of agricultural pollution and carbon reduction in China: An analysis based on marginal abatement cost. Chin. Rural Econ. 2024, 9, 22–41. [Google Scholar] [CrossRef]
- Li, L.; Li, X.; Fan, H.; Lu, J.; Wang, X.; Zhai, T. Quantifying and zoning ecological compensation for cultivated land in intensive agricultural areas: A case study in Henan Province, China. Land 2024, 13, 1720. [Google Scholar] [CrossRef]


| Types of Carbon Sources | Calculation Formula | Correlation Coefficient Values |
|---|---|---|
| Agricultural production input materials | In the equation, represents the carbon emissions from agricultural inputs; is the amount of the i-th type of carbon source used; is the emission coefficient of the i-th type of carbon source. | The carbon sources include chemical fertilizers, pesticides, agricultural films, diesel consumption, crop sowing area, and effective irrigation area, with coefficients of 0.8956 kg(C)/kg, 4.934 kg(C)/kg, 5.18 kg(C)/kg, 0.5927 kg(C)/kg, 312.6 kg(C)/km2, and 266.48 kg(C)/ha, respectively. |
| Crop cultivation | In the equation, represents the N2O emissions produced during the planting process of crops; is the sowing area of the i-th type of crop; is the N2O emission coefficient of the i-th type of crop. | The carbon sources selected are wheat, corn, beans, oil crops, and vegetables, with coefficients of 1.75 kg(N2O)/ha, 2.532 kg(N2O)/ha, 2.29 kg(N2O)/ha, 0.95 kg(N2O)/ha, and 4.944 kg(N2O)/ha, respectively. |
| Livestock and poultry breeding | In the equation, represents the N2O emissions produced during the process of livestock breeding, while and respectively represent the CH4 and N2O emissions generated by livestock breeding; is the number of the i-th type of animal raised; is the CH4 produced by enteric fermentation; is the CH4 or N2O produced by manure management. | The carbon sources selected are cattle, sheep, and poultry, with their coefficients being the CH4 and N2O emission coefficients generated by enteric fermentation and manure management, respectively. The coefficients are referenced from the research by Hu Xiangdong [53]. |
| Open burning of crop residues | In the equation, represents the greenhouse gas emissions from straw burning; is the yield of crop ; is the straw-to-grain ratio of crop ; is the open burning ratio of crop ; is the burning efficiency of crop is the emission factor of crop . | Open burning of wheat and maize stover was used as the carbon source to account for its crop-grass-to-grain ratio, open burning ratio, combustion efficiency, and emission factors with reference to the study by Cheng Linlin and other scholars [51]. |
| Types of Pollution Sources | Pollution Units | Pollution Emission Factor Formula | Correlation Coefficient Values |
|---|---|---|---|
| Agricultural fertilizers | Nitrogen fertilizer, phosphorus fertilizer, and compound fertilizer | Pollution emission coefficient = pollutant generation rate × loss rate | In the pollution units, the nitrogen pollutant generation rate for compound fertilizers is 31, and the phosphorus pollutant generation rate is 0.15. The nitrogen pollutant generation rate for nitrogen fertilizers is 1, while the phosphorus pollutant generation rate for phosphorus fertilizers is 0.44. The loss rates of nitrogen and phosphorus are 0.1 and 0.07, respectively. |
| Livestock and Poultry farming | Cattle, pigs, sheep, and poultry | Pollution emission coefficient = pollutant generation rate × loss rate | The TN (total nitrogen) pollutant generation rates per head for cattle, pigs, sheep, and poultry are 61.1, 4.51, 2.28, and 0.275 kg, respectively. The TP (total phosphorus) pollutant generation rates per head are 10.07, 1.7, 0.45, and 0.115 kg, respectively. The loss rates for TN and TP are 0.208 and 0.1715, respectively. |
| Solid waste from Rural living | Wheat, corn, legumes, oilseeds, and vegetables | Pollution emission coefficient = stubble generation coefficient × (stubble utilization structure proportion × pollutant generation rate) × loss rate | The straw coefficient, straw utilization structure proportion, pollutant generation rate, and loss rate for paddy, wheat, corn, legumes, tubers, oil crops, and vegetables are derived from the research by Lai Siyun [62]. |
| Solid waste from Rural living | The pollution emission coefficients for TN (Total Nitrogen) and TP (Total Phosphorus) per capita per year in rural areas are 0.89 kg and 0.2 kg. | ||
| Synergy Level | Synergy Degree | Categories |
|---|---|---|
| 1 | (0.00, 0.20] | Low value area |
| 2 | (0.20, 0.40] | Next medium value area |
| 3 | (0.40, 0.60] | Medium value area |
| 4 | (0.60, 0.80] | Next high value area |
| 5 | (0.80, 1.00] | High value area |
| Variables | Mean | Std. Dev | Max | Min | Observations |
|---|---|---|---|---|---|
| lnACE | 5.956868 | 0.8223884 | 3.607756 | 7.144036 | N = 234 |
| lnANP | 10.38476 | 0.8452691 | 7.966314 | 11.58799 | N = 234 |
| lnGVAO | 5.282085 | 0.9216374 | 2.48409 | 6.8343905 | N = 234 |
| Variables | LLC Test | IPS Test | ADF–Fisher Test | PP–Fisher Test | Conclusion |
|---|---|---|---|---|---|
| lnACE | −4.959 *** (0.000) | −3.240 *** (0.001) | 41.209 (0.252) | 41.632 (0.239) | Non-stationary |
| dlnACE | −7.244 *** (0.000) | −6.064 *** (0.000) | 71.984 *** (0.000) | 128.240 *** (0.000) | Stationary |
| lnANP | −3.573 *** (0.000) | −2.829 *** (0.000) | 42.434(0.213) | 52.719 ** (0.036) | Non-stationary |
| dlnANP | −4.496 *** (0.000) | −5.326 *** (0.000) | 54.610 ** (0.024) | 94.861 *** (0.000) | Stationary |
| lnGVAO | −2.770 *** (0.003) | −3.399 *** (0.000) | 62.288 *** (0.004) | 202.916 *** (0.000) | Stationary |
| dlnGVAO | −6.064 *** (0.000) | −7.012 *** (0.000) | 115.298 *** (0.000) | 351.501 *** (0.000) | Stationary |
| Testing Method | Test Item | Statistical Value |
|---|---|---|
| Pedroni test | Modified Phillips–Perron | 3.769 *** (0.000) |
| Phillips–Perron | −4.031 *** (0.000) | |
| Augmented Dickey–Fuller | −3.925 *** (0.000) | |
| Westerlund test | Variance ratio | 1.769 ** (0.038) |
| Lag Order | AIC | BIC | HQIC |
|---|---|---|---|
| 1 | −9.278 * | −8.161 * | −8.825 * |
| 2 | −8.866 | −7.494 | −8.309 |
| 3 | −8.221 | −6.550 | −7.542 |
| Test Variable | chi2 | df | p-Value | Null Hypothesis | Conclusion |
|---|---|---|---|---|---|
| dlnANP | 2.915 | 1 | 0.088 | dlnANP is not a Granger cause of dlnACE | Reject |
| dlnGVAO | 6.750 | 1 | 0.009 | dlnGVAO is not a Granger cause of dlnACE | Reject |
| dlnACE | 0.780 | 1 | 0.377 | dlnACE is not a Granger cause of dlnANP | Accept |
| dlnGVAO | 3.738 | 1 | 0.053 | dlnGVAO is not a Granger cause of dlnANP | Reject |
| dlnACE | 2.210 | 1 | 0.137 | ddlnACE is not a Granger cause of dlnGVAO | Accept |
| dlnANP | 2.455 | 1 | 0.117 | dlnANP is not a Granger cause of dlnGVAO | Accept |
| Explanatory Variable | Dependent Variable | ||
|---|---|---|---|
| h_dlnACE | h_dlnANP | h_dlnGVAO | |
| L1.h_dlnACE | −0.0316 (0.779) | 0.2199 (0.192) | −0.5274 (0.185) |
| L1.h_dlnANP | 0.1633 ** (0.039) | −0.2709 (0.895) | 0.6194 (0.186) |
| L1.h_dlnGVAO | 0.1029 ** (0.029) | 0.1160 * (0.086) | 0.0030 (0.986) |
| Period | dlnACE | dlnANP | dlnGVAO | ||||||
|---|---|---|---|---|---|---|---|---|---|
| dlnACE | dlnANP | dlnGVAO | dlnACE | dlnANP | dlnGVAO | dlnACE | dlnANP | dlnGVAO | |
| 1 | 1 | 0.49 | 0.044 | 0 | 0.51 | 0 | 0 | 0 | 0.955 |
| 2 | 0.941 | 0.493 | 0.043 | 0.016 | 0.463 | 0.05 | 0.042 | 0.044 | 0.908 |
| 3 | 0.939 | 0.489 | 0.044 | 0.018 | 0.466 | 0.051 | 0.043 | 0.045 | 0.905 |
| 4 | 0.939 | 0.489 | 0.044 | 0.018 | 0.466 | 0.051 | 0.043 | 0.045 | 0.905 |
| 5 | 0.939 | 0.489 | 0.044 | 0.018 | 0.466 | 0.051 | 0.043 | 0.045 | 0.905 |
| 6 | 0.939 | 0.489 | 0.044 | 0.018 | 0.466 | 0.051 | 0.043 | 0.045 | 0.905 |
| 7 | 0.939 | 0.489 | 0.044 | 0.018 | 0.466 | 0.051 | 0.043 | 0.045 | 0.905 |
| 8 | 0.939 | 0.489 | 0.044 | 0.018 | 0.466 | 0.051 | 0.043 | 0.045 | 0.905 |
| 9 | 0.939 | 0.489 | 0.044 | 0.018 | 0.466 | 0.051 | 0.043 | 0.045 | 0.905 |
| 10 | 0.939 | 0.489 | 0.044 | 0.018 | 0.466 | 0.051 | 0.043 | 0.045 | 0.905 |
Disclaimer/Publisher’s Note: The statements, opinions and data contained in all publications are solely those of the individual author(s) and contributor(s) and not of MDPI and/or the editor(s). MDPI and/or the editor(s) disclaim responsibility for any injury to people or property resulting from any ideas, methods, instructions or products referred to in the content. |
© 2025 by the authors. Licensee MDPI, Basel, Switzerland. This article is an open access article distributed under the terms and conditions of the Creative Commons Attribution (CC BY) license (https://creativecommons.org/licenses/by/4.0/).
Share and Cite
Fan, H.; Li, L.; Li, X.; Yu, Y.; Wu, Y.; Li, D.; Liu, J.; Wang, X. Analysis of the Interactive Response Relationships Between Agricultural Pollution Reduction and Carbon Emission Mitigation and Agricultural Economic Development: A Case Study of Henan Province, China. Agriculture 2025, 15, 1163. https://doi.org/10.3390/agriculture15111163
Fan H, Li L, Li X, Yu Y, Wu Y, Li D, Liu J, Wang X. Analysis of the Interactive Response Relationships Between Agricultural Pollution Reduction and Carbon Emission Mitigation and Agricultural Economic Development: A Case Study of Henan Province, China. Agriculture. 2025; 15(11):1163. https://doi.org/10.3390/agriculture15111163
Chicago/Turabian StyleFan, Hanghang, Ling Li, Xingming Li, Yongjie Yu, Yong Wu, Donghao Li, Jianwei Liu, and Xiuli Wang. 2025. "Analysis of the Interactive Response Relationships Between Agricultural Pollution Reduction and Carbon Emission Mitigation and Agricultural Economic Development: A Case Study of Henan Province, China" Agriculture 15, no. 11: 1163. https://doi.org/10.3390/agriculture15111163
APA StyleFan, H., Li, L., Li, X., Yu, Y., Wu, Y., Li, D., Liu, J., & Wang, X. (2025). Analysis of the Interactive Response Relationships Between Agricultural Pollution Reduction and Carbon Emission Mitigation and Agricultural Economic Development: A Case Study of Henan Province, China. Agriculture, 15(11), 1163. https://doi.org/10.3390/agriculture15111163