Article

MAMNet: Lightweight Multi-Attention Collaborative Network for Fine-Grained Cropland Extraction from Gaofen-2 Remote Sensing Imagery

1
School of Information Science and Technology, Yunnan Normal University, Kunming 650500, China
2
Key Laboratory of Resources and Environmental Remote Sensing for Universities in Yunnan, Kunming 650500, China
3
Center for Geospatial Information Engineering and Technology of Yunnan Province, Kunming 650500, China
4
Department of Geography, Yunnan Normal University, Kunming 650500, China
5
School of Economics, Yunnan Normal University, Kunming 650500, China
*
Author to whom correspondence should be addressed.
Agriculture 2025, 15(11), 1152; https://doi.org/10.3390/agriculture15111152
Submission received: 13 April 2025 / Revised: 25 May 2025 / Accepted: 26 May 2025 / Published: 27 May 2025
(This article belongs to the Section Digital Agriculture)

Abstract

:
To address the issues of high computational complexity and boundary feature loss encountered when extracting farmland information from high-resolution remote sensing images, this study proposes an innovative CNN–Transformer hybrid network, MAMNet. This framework integrates a lightweight encoder, a global–local Transformer decoder, and a bidirectional attention architecture to achieve efficient and accurate farmland information extraction. First, we reconstruct the ResNet-18 backbone network using deep separable convolutions, reducing computational complexity while preserving feature representation capabilities. Second, the global–local Transformer block (GLTB) decoder uses multi-head self-attention mechanisms to dynamically fuse multi-scale features across layers, effectively restoring the topological structure of fragmented farmland boundaries. Third, we propose a novel bidirectional attention architecture: the Detail Improvement Module (DIM) uses channel attention to transfer semantic features to geometric features. The Context Enhancement Module (CEM) utilizes spatial attention to achieve dynamic geometric–semantic fusion, quantitatively distinguishing farmland textures from mixed ground cover. The positional attention mechanism (PAM) enhances the continuity of linear features by strengthening spatial correlations in jump connections. By cascading front-end feature module (FEM) to expand the receptive field and combining an adaptive feature reconstruction head (FRH), this method improves information integrity in fragmented areas. Evaluation results on the 2022 high-resolution two-channel image dataset from Chenggong District, Kunming City, demonstrate that MAMNet achieves an mIoU of 86.68% (an improvement of 1.66% and 2.44% over UNetFormer and BANet, respectively) and an F1-Score of 92.86% with only 12 million parameters. This method provides new technical insights for plot-level farmland monitoring in precision agriculture.

1. Introduction

In accelerating global urbanization and ecological and environmental evolution, the dynamic monitoring of arable land resources has emerged as a pivotal concern for ensuring food security and accomplishing the United Nations Sustainable Development Goals (SDGs 2.4, Food Security). The quantity and quality of arable land are directly associated with national strategic security and social stability [1,2,3]. The conventional approach of the manual census of the arable land monitoring system is characterized by its time-consuming and labour-intensive nature, exhibiting significant limitations. The prolonged arable land survey cycle results in inadequate data timeliness and substantial survey costs. Additionally, inherent defects, such as a higher error rate of manual interpretation, have impeded the capacity to achieve real-time monitoring of arable land resources in precision agriculture [4]. In this context, high-resolution remote sensing technology has emerged as a pivotal technological advancement, offering a novel approach for precisely extracting arable land information [5,6]. It is particularly evident in utilizing deep learning algorithms for intelligent interpretation of remote sensing images, thereby marking a paradigm shift in arable land information extraction from conventional visual interpretation to artificial intelligence-driven interpretation.
Since 2016, convolutional neural networks (CNNs) have made breakthrough progress in studying cultivated land by remote sensing information extraction. The existing research mainly focusses on optimizing the encoder–decoder architecture to unfold, forming a more mature technical system and method innovation. For instance, FCN [7] achieved end-to-end pixel-level cultivated land information extraction for the first time. At the same time, U-Net [8] adopts a symmetric jump-connection structure that preserves the spatial detail features and effectively mitigates the loss of spatial details in the deep network. PSPNet [9] enhances the global context information capture capability through the pyramid pooling module. DeepLab V3+ [10] enhances the multi-scale feature representation of cultivated land features by utilizing the empty spatial pyramid pooling (ASPP) method. MPSPNet [11] has been identified as the most effective Pyramid Scene Parsing Network solution. The ResU-Net [12,13] fusion residual connection structure further optimizes the feature extraction efficiency. These classical CNN models have achieved high overall accuracy in large-scale cropland information extraction from low- and medium-resolution remote sensing images. However, the inherent limitations of CNNs, such as their inability to model long-range spatial dependencies due to constrained local receptive fields of convolutional kernels, result in suboptimal performance. Moreover, successive pooling operations can lead to the progressive loss of geometric features in deeper networks. Additionally, the extraction of cropland ridge edge information is hindered by the interference of complex agricultural backgrounds. Identifying solutions to this issue is imperative for advancing intelligent remote sensing in interpreting cropland information in agriculture.
The development of computer vision technology has been continuous and progressive, and Visual Transformer (ViT) [14] represents a new paradigm for the intelligent interpretation of remote sensing information. Compared with traditional CNNs, ViT networks demonstrate considerable advantages in long-distance spatial dependency modelling of their attention mechanism. A systematic study by Xu et al. [15] demonstrated that the Swin Transformer [16] architecture enhances overall accuracy (OA) by 6.13% and 4.67% compared with U-Net and DeepLab V3, respectively, in the national-scale crop identification task, thereby substantiating the considerable potential of Transformer in the domain of agricultural remote sensing. The MSMTransformer [17] employs a parallel connection of multiple windows of varying sizes and performs multi-head self-attention operations to more effectively extract farmland information at different scales, achieving the highest performance in COCO segmentation metrics. The latest research primarily focusses on innovating the CNN–Transformer hybrid architecture to balance the advantages of local feature extraction and global context-building modelling. Xie et al. [18] compare ViT, Swin Transformer, and CNN–Transformer hybrid architectures, and the study shows that the hybrid model combines the advantages of CNN and Transformer and outperforms pure Transformer in agricultural image processing tasks. CTMENet [19] effectively suppresses the multi-internal pseudo-edge problem of multiple cultivated land states by designing a multi-scale edge-aware module. ECENet [20] is based on the CBAM [21] augmented EfficientNet [22], which achieves a lightweight real-time recognition task. SNUNet3+ [23] uses the improved UNet++ as a twin network. It introduces the scSE [24] attention mechanism, which outperforms the other state-of-the-art models in terms of the accuracy of cropland change detection in high-resolution remote sensing images. PACnet [25] proposes that the CCAM extract the local features from the horizontal and vertical directions. The following extracts local features from the image to highlight the differences between abandoned farmland and its surroundings and realize the delicate abandoned farmland recognition task. MFEPNet [26] combines ResNet50 [27] and the Swin Transformer dual-branching backbone network to build a more accurate and complete complex-shaped cropland extraction task. However, the extant methods continue to confront two fundamental scientific challenges: The computational intricacy of the prevailing CNN–Transformer hybrid architecture network is pronounced. Secondly, there are defects in the attention mechanism, and existing methods are insufficient in the collaborative optimization of channel attention and spatial attention, resulting in low ridge recognition in high-resolution remote sensing images. Consequently, developing a lightweight multi-attention synergistic new network architecture that can achieve an optimal balance between accuracy and efficiency is imperative to facilitate the intelligent interpretation of high-bit remote sensing of cultivated land for practical development.
In response to the aforementioned analysis, this study proposes a lightweight multi-attention collaborative segmentation network (MAMNet). The core innovation of this network is reflected in three aspects:
(1) Lightweight hierarchical attention architecture: Through the synergistic design of deeply separable convolution and a dynamic weight-sharing mechanism, combined with the multi-scale attention module, it achieves a 60.13% reduction in the number of parameters (12.0 M) compared with the baseline model, CMTFNet, while the average intersection and merger ratio (mIoU) is improved by 2.19 percentage points to 86.68%.
(2) Design dual-path feature enhancement module: (1) The DIM employs channel attention-guided multi-branch fusion, learns the detail weights and embeds them in shallow features, improves the detail features of the rest of the branches, and completely recognizes the fine ridges in the cultivated land (F1-Score reaches 92.86%). (2) The CEM realizes dynamic aggregation of cross-layer features through spatial attention and utilizes the shallow high-resolution feature information to reduce the misidentification rate of fine plots effectively (OA reaches 92.20%).
(3) A cascading feature reconstruction mechanism is proposed to realize multi-scale feature retention through the synergy of the global–local attention mechanism in the FEM module. An adaptive aggregation strategy is adopted in the FRH module to avoid information being discarded by the trunk and to realize final image fusion. It reduces model recognition and localization errors and enhances the model’s ability to acquire information about details.
The MAMNet network model proposed in this study has advanced the innovative application of deep learning in the intelligent interpretation of remote sensing data for farmland. In principle, the innovative lightweight multi-attention collaboration mechanism provides a novel network architecture reference for efficiently and accurately extracting farmland information. In practical applications, empirical studies based on GF-2 remote sensing imagery demonstrate the network’s capacity to achieve high-precision extraction of farmland boundaries. The research findings can serve as a transferable benchmark model for relevant departments to optimize land use planning and provide a reference tool for monitoring the construction of high-standard farmland.

2. Description of the Study Area and Data Sources

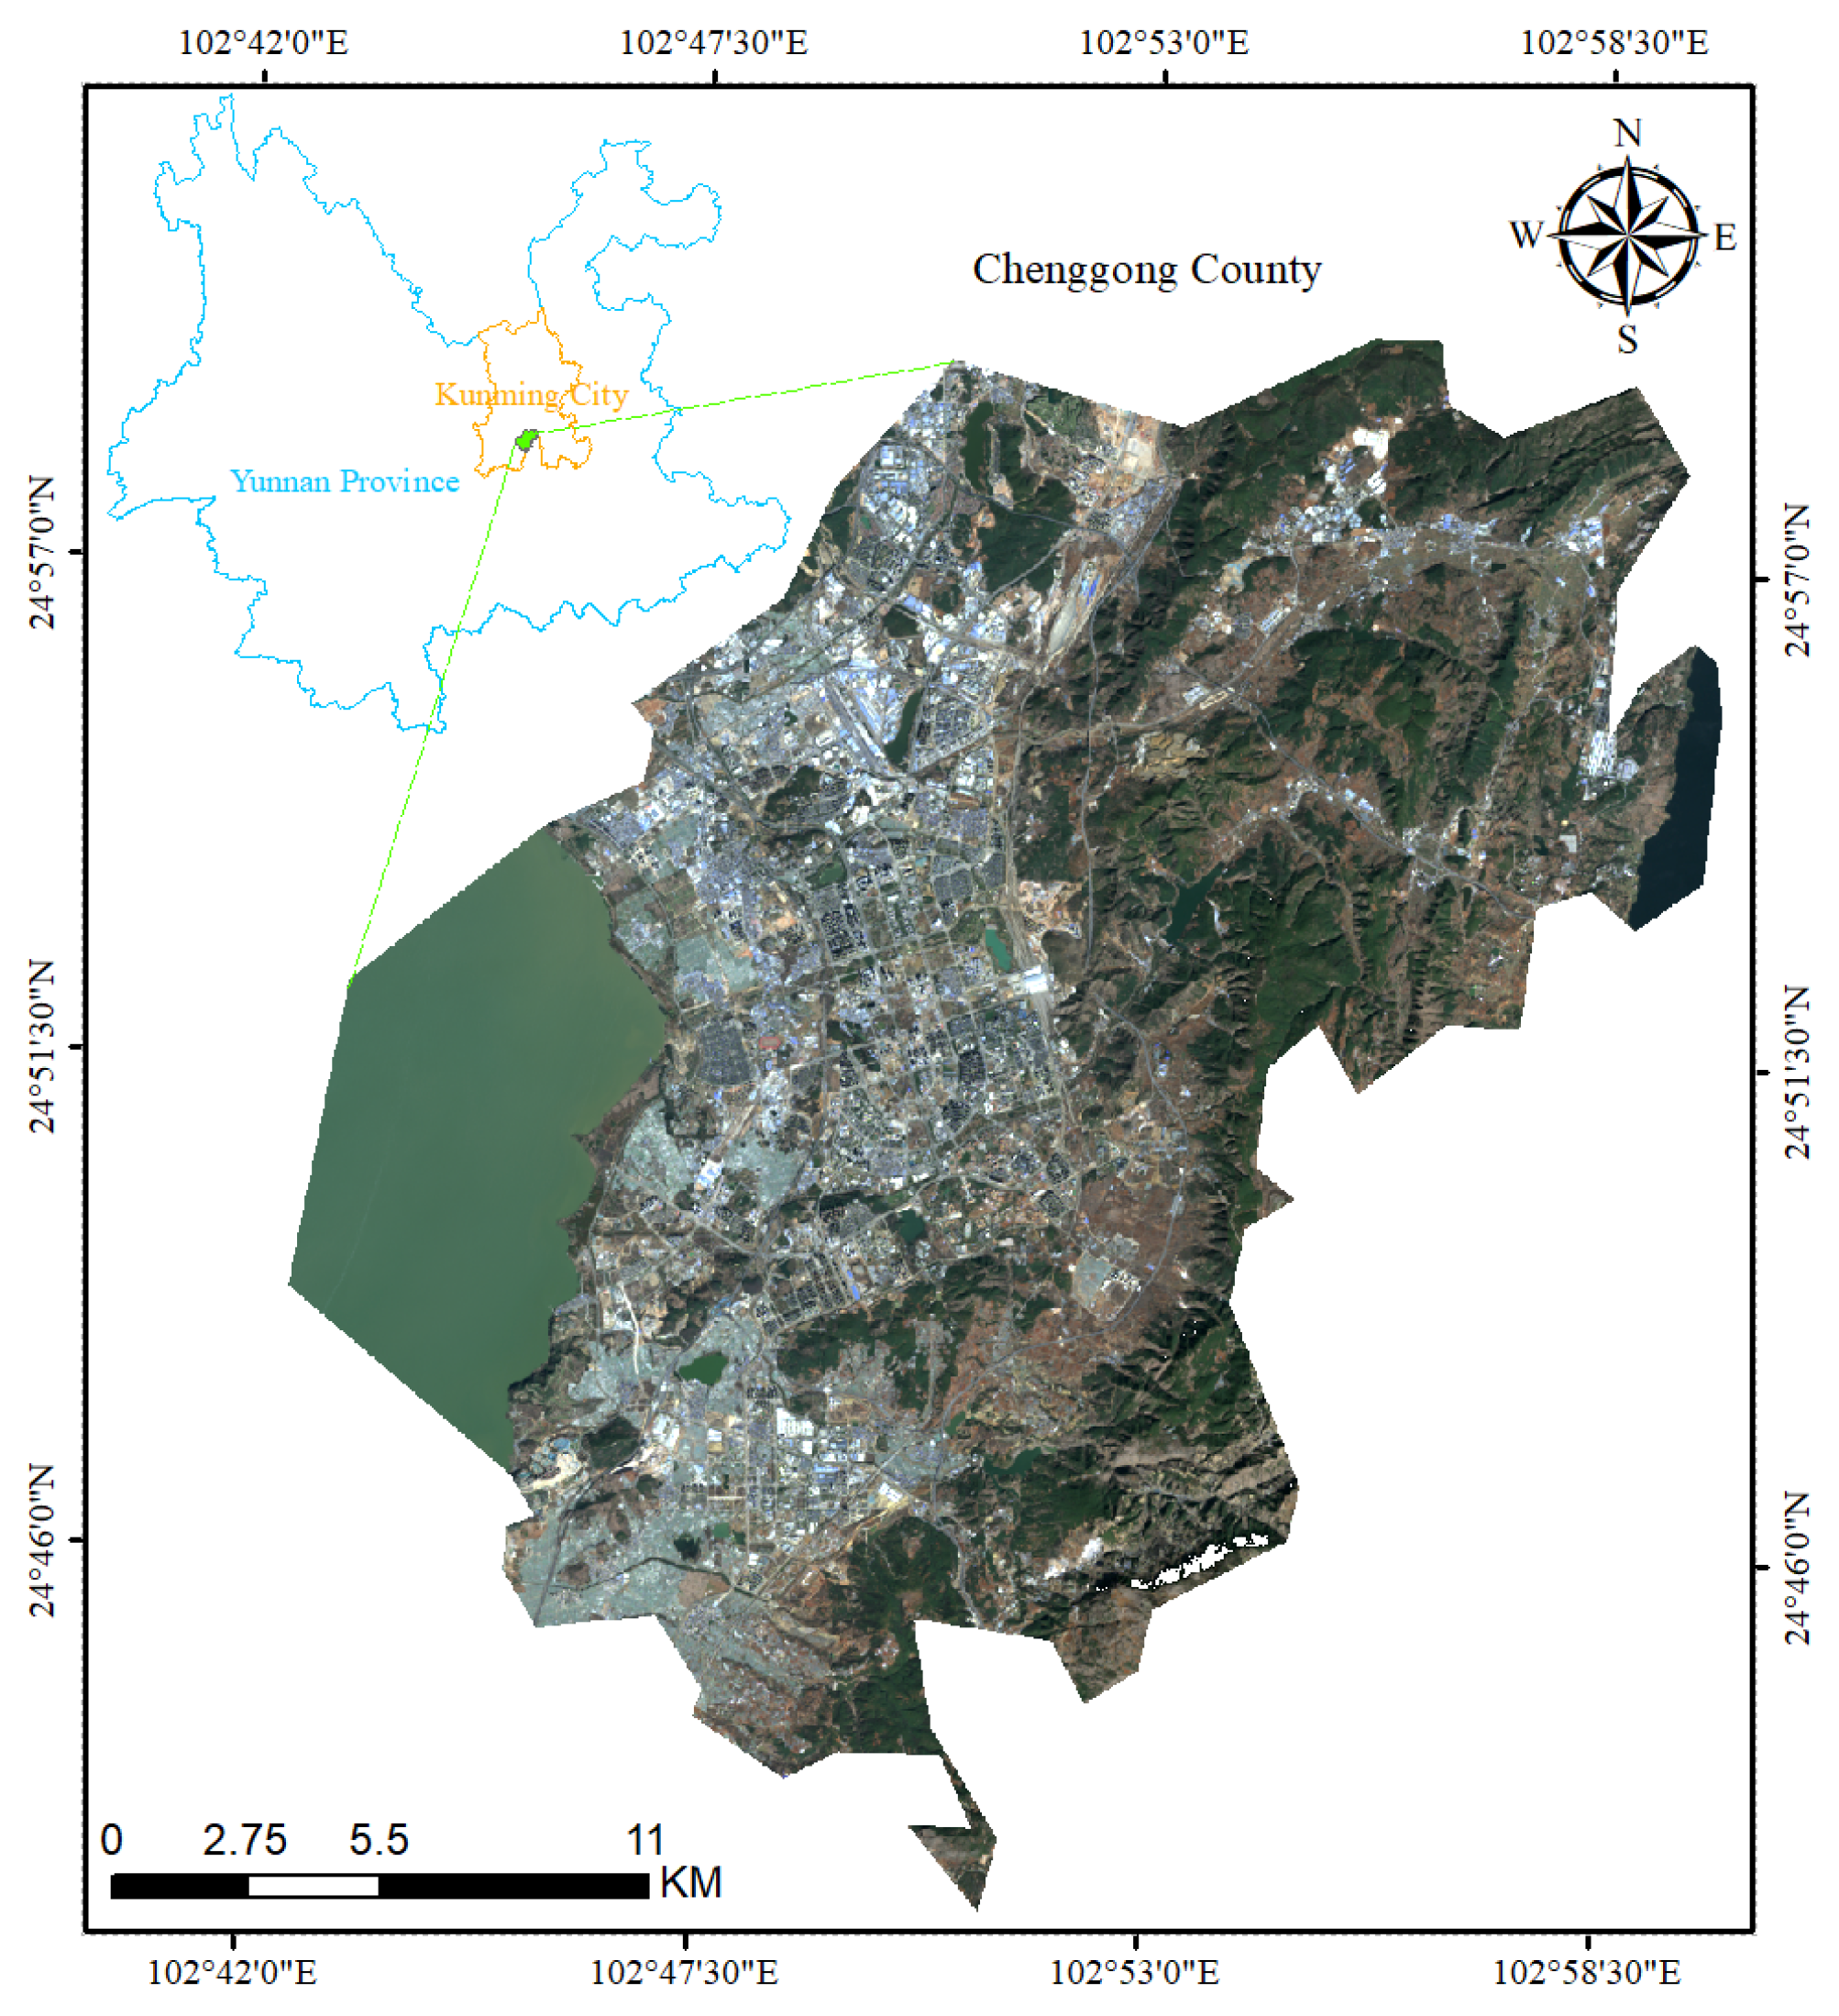
2.1. Description of the Study Area

In this study, Chenggong District (102.75°~103.00° E, 24.70°~25.00° N) in Kunming City, Yunnan Province, was selected as a typical experimental area (Figure 1). The study area comprises 62.41 km2 of open farmland, which is characterized by multiple significant geographic features: topographically, it is situated in the transition zone between the alluvial plains on the east bank of Dianchi Pond to the plateau terraces (elevation 1886–2517 m), forming a unique three-dimensional terrace landscape; climatologically, it belongs to the subtropical plateau monsoon climate, with an average annual temperature of 14.8 °C, annual precipitation of 850 mm, and a precipitation ratio of 1:4.5 in the dry and wet seasons, driving significant climatic changes in cultivated land; the soil types are dominated by plateau red soil and rice soil, with a pH value of 5.8–6.5 and organic matter content of 2.3–3.8%, which possess the standard conditions for the classical type of highland speciality agriculture. The agricultural landscape in the study area exhibits typical multi-scale spatial heterogeneity manifested in three-dimensional structural differentiation: (1) The morphological fragmentation index (a core indicator quantifying the spatial dispersion of cultivated land), calculated based on GF-2 remote sensing images with a resolution of 1 m, reached 0.43; small fragmented plots < 0.5 hm2 account for 38.7% of the total area, forming a 2:3 patch ratio with contiguous farmland ≥ 5 hm2, indicating that the study area exhibits significant spatial fragmentation. (2) The density of artificial structures within the area reaches 4.2 km/km2, including linear features such as stepped field ridges, with widths ranging from 0.3 to 1.2 m, and irrigation ditches. These sub-pixel-level linear features manifest as complex noise interference in the images. (3) The curvature distribution of cultivated land boundaries exhibits a double-peak pattern, with the main peak of 0.12 m⁻1 corresponding to regular plots and the secondary peak of 0.38 m⁻1 corresponding to complex shapes. The multi-scale spatial heterogeneity of cultivated land in the study area imposes higher requirements on the multi-scale feature fusion and model generalization capabilities of deep learning networks, which can better validate network performance.

2.2. Test Data

This study employs the 2022 Gaofen-2 (GF-2) panchromatic remote sensing image as its baseline dataset, with a spatial resolution of 0.8 m. During the sample labelling stage, a stratified random sampling strategy was employed, leveraging field survey data (GPS sample points collected in April–June 2022, n = 127) and visual interpretation methods. We then obtained a random sample of high-resolution GF-2 satellite imagery and converted it into RGB format. These image patches were then uploaded to the Roboflow online annotation platform, where three researchers manually labelled cultivated (value = 1) and non-cultivated land (value = 0). The final constructed dataset contains 2664 sample images of 224 × 224 pixels.
The dataset was divided according to the principle of spatial independence, with a ratio of 7:2:1, into a training set (1858 images), a validation set (560 images), and a test set (246 images). In order to address the current issues of incomplete extraction of fragmented farmland information, broken field boundary identification, and the inability to identify mixed areas, this experiment also includes sample points for farmland edge detection, fragmented farmland sample points, and farmland confusion area sample points. The specific farmland sample points are delineated in Figure 2.
Figure 1. Study area. The blue area in the figure corresponds to Yunnan Province, the orange area designates Kunming City, and the green area signifies Chenggong District.
Agriculture 15 01152 g001

3. Research Methodology

3.1. MAMNet Network Architecture

The present study is predicated on the attention mechanism theory proposed by Guo et al. [28] as well as on the analysis of the spatial heterogeneity characteristics of the farmland system in the high-resolution remote sensing images of the study area (fragmentation index of 0.43, artificial facility density of 4.2 km/km2, and bimodal distribution of boundary curvature). The proposed methodology combines multiple attention modules to create a multi-module attention modulation network, MAMNet (as shown in Figure 3). MAMNet adopts the encoding–decoding structure, and MAMNet effectively solves the problems of gradient dispersion and feature confusion in fine-grained cropland information extraction by establishing a dynamic interaction model of cross-hierarchical features and a heterogeneous attention synergistic mechanism. In the encoding stage, ResNet18 [27] is utilized as the backbone network (11.7 M parametric quantities, 1.8 GFLOPs), and the computational cost is reduced by 37% through the introduction of depth-separable convolutions to enhance the 3 × 3 convolutional layers in the original structure. The GLTB module [29] is introduced in the decoding stage to capture global and local information. Each jump connection between encoding and decoding is enhanced with feature information through the PAM module [30], which has been newly introduced. The PAM outputs are processed by a mixture of CEM (Context Enhancement Module) and DIM (detail improvement module) to achieve contextual aggregation through spatial attention to avoid the ploughing of the land target obfuscation. Local features are learned by employing channel attention-guided enhancement of small target features at a 0.5–2 m scale.

3.2. Attention Mechanism Module

3.2.1. Detail Improvement Module

The MAMNet proposed in this study innovatively constructs a four-input and three-output detail improvement module (DIM), whose core idea is to realize the high-fidelity reconstruction of cultivated ridge features through the cross-layer feature dynamic interaction mechanism. As illustrated in Figure 4, the module employs a three-stage architectural design of “compression–excitation–fusion”, which substantially enhances the extraction accuracy of the sub-meter cultivated field boundary while preserving computational efficiency. The deeper features in the input source are used as the source of detail features, and the detail attention mechanism extracts the detail feature representation. The remaining three shallower features are used to improve the detailed information. The detail attention mechanism consists of a Downsample as the initial stage of the attention mechanism, two fully connected layers in the middle, and finally, output through an Upsample. Specifically, Downsample employs global average pooling on the size of the deeper features of the size pooling to 1 × 1, a process that reduces the number of parameters of the module. It is performed to avoid the subsequent steps of the computational cost and to retain the channel detail information, discarding the redundant spatial information (see Equation (1) for details). The two fully connected layers serve distinct purposes. The first layer reduces the channel dimension, avoiding overfitting and reducing the computational effort. The second layer reverts to the shallow features channel dimension to enhance the nonlinear representation of the model. Please refer to Equation (2) for a comprehensive overview. Finally, the bilinear interpolation is employed as an upsampling technique for subsequent shallow features element-by-element multiplication to enhance shallow detail features (see Equation (3) for details). The feature representation is further enhanced by using a 1 × 1 convolution.
Figure 4. Structure of the detail improvement module (DIM).
Agriculture 15 01152 g004
Z C = 1 H W i = 1 H j = 1 W X C ( i , j )
A i = σ { H e δ [ B N ( H r Z i ) ] }
where X C is a pixel of the C-channel; H and W are the height and width of the feature size, respectively; and   Z C denotes the descriptor that generates the H × W of the C-channel. Z i denotes a descriptor for channel i ; Z i R C × 1 × 1 ; B N represents the Batch Norm layer; δ and σ are the ReLU6 function and the Sigmoid activation function, respectively; ReLU6 is mainly more lightweight. H r and H e denote the downscaled and upscaled fully connected layers with r-ratio downscaling and e-ratio upscaling, respectively. The output learned attention weights,   A i R C × 1 × 1 , C denote the channel dimensions of shallow features.
F o u t = B i l i n e a r I n t e r p ( F i n , s )
where BilinearInterp denotes bilinear interpolation upsampling, and the parameters F i n and s denote the multiplicity of the input vectors used, respectively. Specifically, they are set according to the size of shallow features, s = 8, s = 4, and s = 2 from the top to bottom branch.

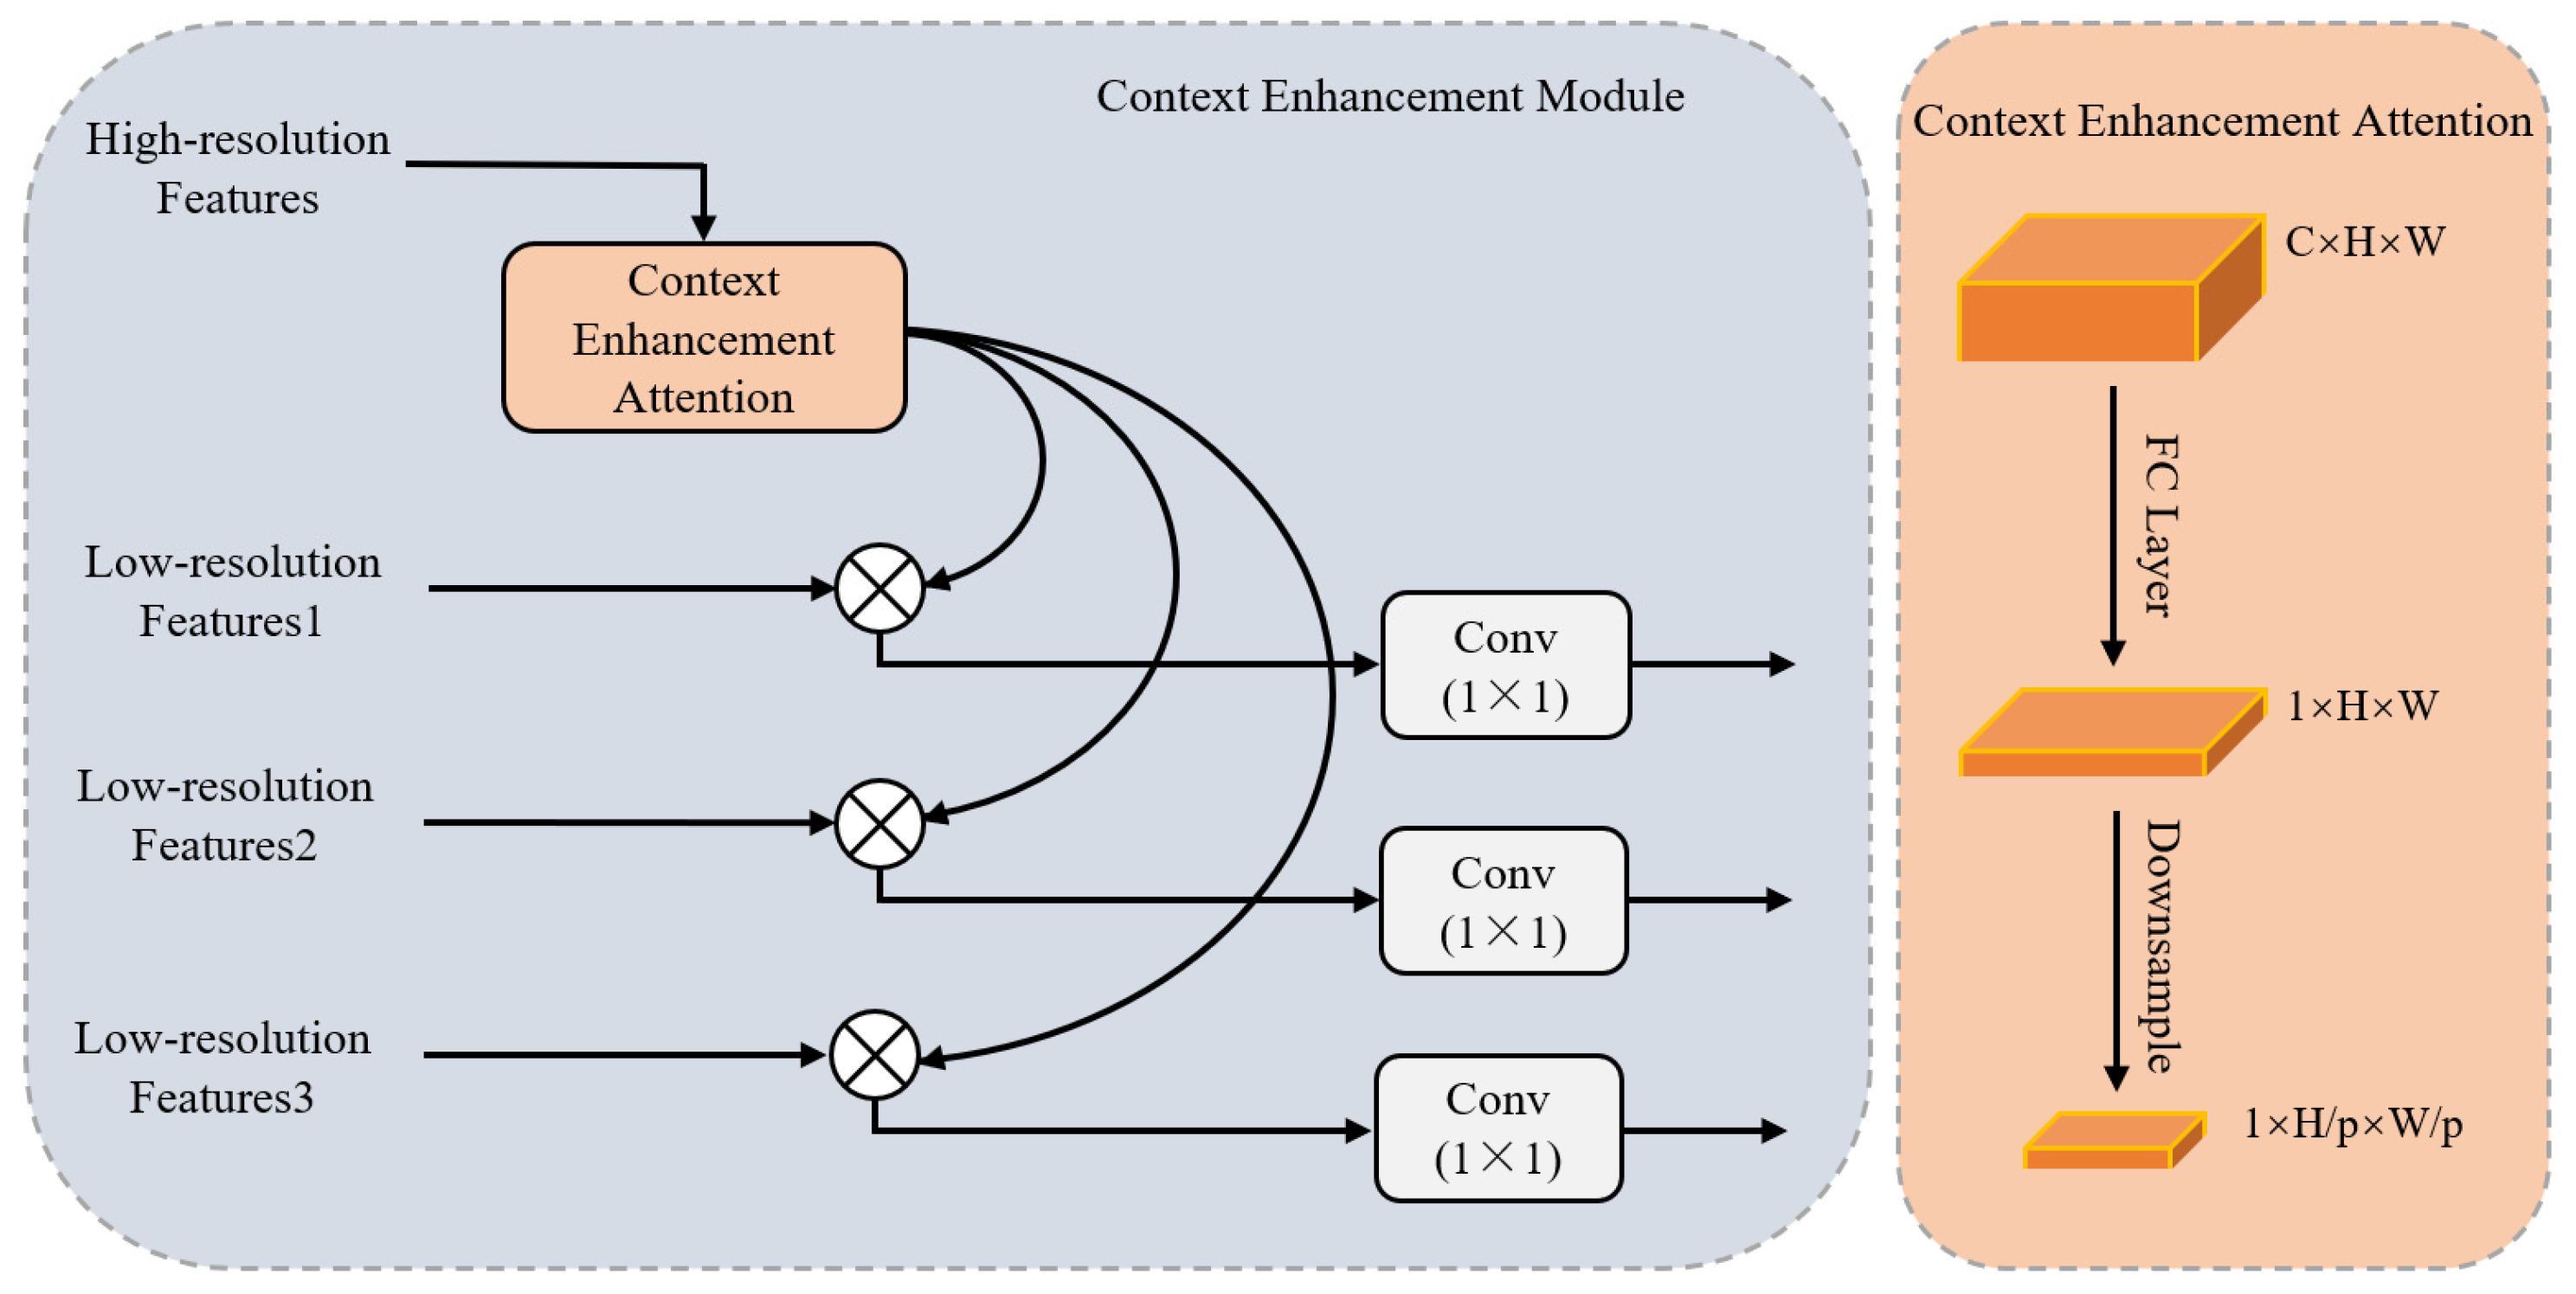
3.2.2. Contextual Information Enhancement Module

In this study, a four-input and three-output Context Enhancement Module (CEM) is innovatively constructed, and its core breakthrough lies in the establishment of a spatial–semantic dynamic coupling mechanism, which effectively solves the problem of heterogeneous feature interference and multi-scale contextual fragmentation of cropland parcels in high-resolution remote sensing images. As illustrated in Figure 5, the module employs a collaborative optimization architecture of “global guidance–local enhancement”, and the detailed framework is as follows: The first branch of high-resolution features derives the spatial attention weights from the contextual attention, which primarily learns the detailed features in the global, and then embeds them into the three low-resolution features to enhance the global features. The specific contextual attention mechanism consists of a fully connected layer that compresses the channel to 1 dimension, reduces the overhead, learns the contextual information weights, and accesses the Sigmoid activation function to generate the attention weights to highlight the important regions and suppress the irrelevant backgrounds (see Equation (4) for details). The subsequent Downsample layer embeds spatial weights into the low-level spatial feature information, as shown in Equation (5). Finally, a 1 × 1 convolution is used for further feature blending to enhance the feature representation.
Figure 5. Structure of Contextual Information Enhancement Module (CEM).
Agriculture 15 01152 g005
A = σ [ C o n v 1 × 1 ( X ) ]
where X denotes the vector of input features utilizing the C o n v 1 × 1 aggregation channel dimension of 1, and σ denotes the Sigmoid activation function. Generate A R 1 × H × W to learn the attention weights.
F o u t ( k , l ) = 1 h p × w p i = k h p ( k + 1 ) h p j = k w p ( l + 1 ) w p F i n ( i , j )
where h p = H p , w p = W p , and the feature map is divided into p × p grids, each of size h p × w p . All the pixels in the grid are averaged to obtain the output of p × p . Generate the weighted feature map F o u t R 1 × H × W . The specific size of each branch varies, resulting in different downsampling ratios, from top to bottom being p = 2, p = 4, and p = 8, respectively.

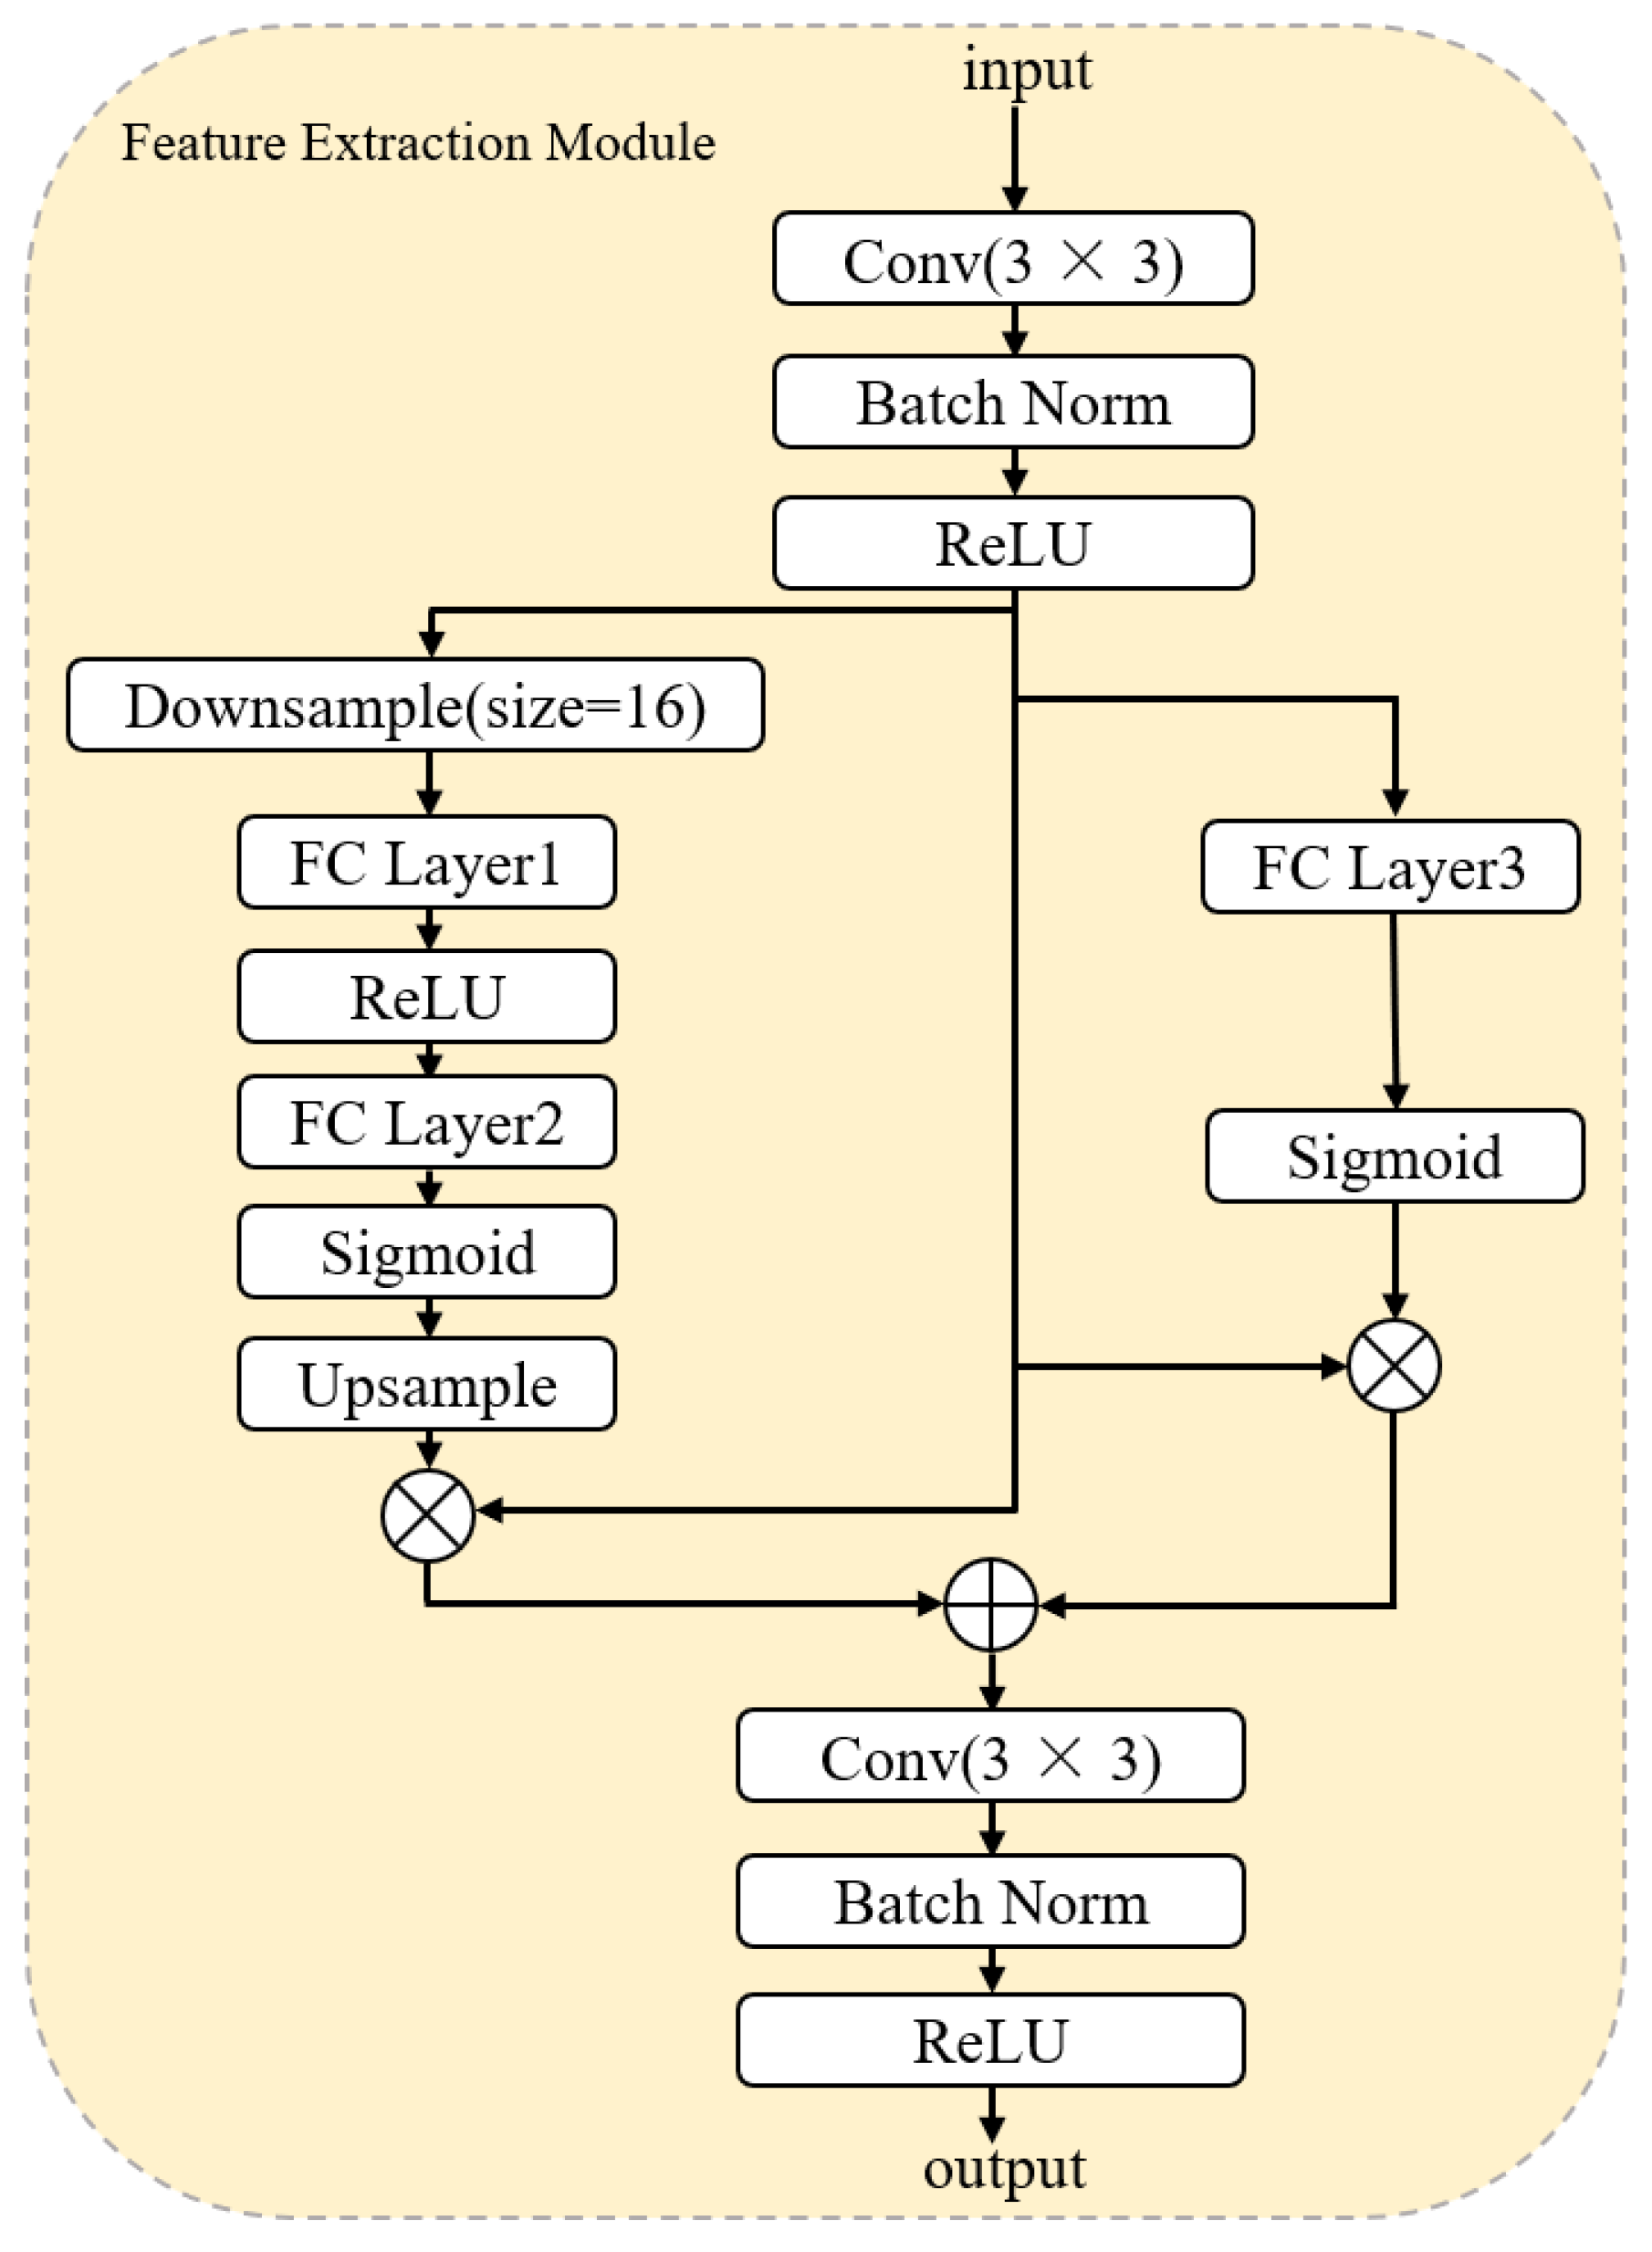
3.2.3. Feature Extraction Module

This study proposes a novel architecture, namely, an intensely supervised cross-layer feature fusion architecture, which represents a significant advancement in the field. This architecture effectively overcomes the information bottleneck constraints of the conventional U-Net in fine information extraction for arable land. The proposed architecture incorporates an additional jump connection on top of the four skip connections in the conventional Unit model. This novel approach bypasses the network backbone and directly transfers the underlying pixel information, compensating for the loss of spatial information in the deep network. It is advantageous for the high-precision extraction of information edges and fine ridge recognition. As demonstrated in Figure 6, the FEM module initially undergoes a convolution operation with a convolution kernel size of 3 × 3 and a step size of 2, intending to reduce the feature resolution and lower the computational and parametric quantities. This process enables the capture of the low-level features of the initial image, as illustrated in Equation (6). Secondly, the spatial and channel attention mechanisms are incorporated to strengthen the initial feature information. In parallel and quickly, the spatial attention mechanism adopts Downsample to reduce the spatial resolution of the feature to 16 × 16 dimensions, and FC Layer1 and FC Layer2 are used to strengthen the nonlinear expression of the feature. Finally, bilinear interpolation upsampling takes up fewer resources while restoring the original feature size. The specific spatial aspects of feature extraction are shown in Equations (7) and (8). The channel extraction features are contingent on the implementation of Equation (4) to reach a state of completion. The channel space outputs two enhanced feature elements by element, which are then optimized for feature expression through a convolution operation with a 3 × 3 convolution kernel.
Figure 6. Structure of FEM module.
Agriculture 15 01152 g006
Y = δ { B N [ C o n v 3 × 3 ( X ) ] }
where X R 3 × H × W denotes the input feature vector; C o n v 3 × 3 denotes the convolution of 3 × 3 convolution kernel size; B N and δ are the Batch Norm layer and the ReLU function, respectively; and, in order to reduce the number of parameters, ReLU is replaced by ReLU6. Y R C × H × W denotes the extracted preliminary features.
Z c = 1 16 × 16 i = 1 16 j = 1 16 Y i , j , c
A i = σ [ H e δ ( H r Z i ) ]
where Y i , j , c represents the feature vector of the Y feature at the position of c channel i and j , and Z c represents the feature descriptor of c channel 16 × 16 resolution. Z i represents the feature descriptor of i channel; H r and H e represent the two fully connected layers, decreasing the channel dimension (scale r ) and increasing the channel dimension (scale e ), respectively; δ and σ represent the ReLU6 and Sigmoid activation functions, respectively; A i represents the learning weight feature information, and A i R C × 16 × 16 . The last step of upsampling utilizes Equation (3) to recover the feature dimensions as H 2 × W 2 .

3.2.4. Feature Reconstruction Head

The significant discrepancy between the low-level features obtained through the FEM module and the feature information output from the final decoder necessitates the development of a methodology to address the challenges posed by the semantic divide between high- and low-level features as well as the asynchronous fusion of spatial–semantic information. To this end, this study proposes an enhanced feature reconstruction head (FRH) to facilitate the integration of the input two features, thereby mitigating the fusion process and ensuring the refinement of the features. As illustrated in Figure 7, the FRH module’s input features are the weighted summation of low-level and high-level features. The shallow features are reduced by 1 × 1 convolution, and the starting dimensions are restored by 3 × 3 convolution. It reduces the computational cost and enhances the nonlinear expression of the features, thereby mitigating the differences with the deep features. The employment of weighted summation facilitates the learning process of the dynamic integration of shallow and deep feature ratios. The fused features are fed into the global local attention mechanism, where the left part refines the fused spatial information. Downsampling uses adaptive average pooling and downsampling to 16 × 16 dimensions, allowing attention to retain more spatial details and improving the accuracy of cropland information extraction. The right part of this attention is the refinement step of the semantic local information by reducing the dimensionality of the channel and learning a more representative feature information representation. Following refinement, spatial and semantic features are integrated, with residual connections introduced to prevent modular network degradation. The aggregation of information features is then performed through the convolution of 3 × 3, and a Dropout layer is employed to prevent network overfitting. Ultimately, the extraction of final cropland information is achieved through upsampling.

3.3. Loss Function

This study addresses the problem of extreme imbalance between classes and fuzzy boundaries coexisting in high-resolution remote sensing cropland information extraction. To construct the loss function, L m a i n and L a u x are utilized. L m a i n is composed of the joint loss (see Equation (9) for details), in which one of the joint losses applies a kind of improved cross-entropy loss ( L S o f t C E ), which serves to supervise the prediction value and the real, labelled value of the model for the classification of the model on a pixel-by-pixel basis. The parameter of the improved cross-entropy loss function increases relative to the original one. The smoothing factor is employed to alleviate the issue of imbalanced categories in image data, particularly in remote-sensing applications where extracting information from imbalanced image categories is a concern. The calculation formula for L S o f t C E is outlined in Equation (10). The primary loss function is known as the joint loss. The secondary loss function is the Dice coefficient, also called the F1-Score. This coefficient is utilized to quantify the extent of overlap between the segmentation results predicted by the model and the actual labels. It also incorporates a smoothing factor to circumvent the denominator being zero. The formula for this is presented in Equation (11). L a u x also adopts L S o f t C E (see Equation (12) for details), which can play a role in optimizing the intermediate layer features, alleviating the gradient disappearance, improving the stability of the model training, and strengthening the shallow network’s ability to capture the edges of the cultivated land. L t o t a l is the primary loss and auxiliary loss working in conjunction, with a weighting of 6:4, as demonstrated in Equation (13).
L m a i n = α L S o f t C E + β L D i c e
where α and β are the weighting parameters; in this experiment, α = 1.0 and β = 1.0. The training of the model is fully supervised by combining the advantages of different loss functions by combining the weighted summation of multiple loss functions at L S o f t C E and L D i c e .
L SoftCE = 1 N i = 1 N j = 1 M y i , j s o f t log ( p i , j )
where y i , j s o f t is the smoothed distribution of the true label, indicating the probability that the i th pixel of the label belongs to the category j , and p i , j is the probability distribution of the model prediction, which is output by SoftMax, indicating the probability that the i th pixel of the model prediction belongs to the category j .
L D i c e = 1 2 i = 1 N p i y i + s m o o t h i = 1 N p i + i = 1 N y i + s m o o t h
where p i is the probability predicted by the model, specifying the probability that the i th pixel predicted by the model belongs to the foreground, y i is the value of the i th pixel of the real label, and s m o o t h is the smoothing factor, which is typically 1 × 10⁻⁵.
L a u x = L SoftCE
L t o t a l = L m a i n + γ L a u x

3.4. Test Environment and Parameter Setting

The present experiment was conducted on a high-performance computing server with NVIDIA RTX A4000 GPUs (16 GB graphics memory), manufactured by NVIDIA Corporation, Santa Clara, CA, USA, running on Ubuntu 20.04.6 LTS operating system. The deep learning framework utilized was PyTorch version 2.5.1. In order to enhance the model’s capacity for generalization, a series of modifications were implemented. These modifications included random scaling of size proportion (size proportion ranging from 0.5 to 2.0 with random probability p = 1); random cropping (cropping size = 224 × 224 with probability p = 0.75); random flipping (including horizontal and vertical flipping, two flips with probability p = 0.5 and guaranteeing that at least one of the flips is executed); random adjustment of brightness and contrast (brightness range [−0.2, 0.2], contrast range [−0.2, 0.2], p = 0.5); randomly adjusting the hue, saturation, and luminance of the image (p = 0.5); and randomly applying gamma correction to the image (p = 0.5). Maximum–minimum normalization operations are the data enhancement strategies applied to the training dataset, applying the randomly scaled size ratio (size ratio range from 0.5 to 1.75, with random probability p = 1), random flipping (including horizontal and vertical flipping, with two flipping probabilities p = 0.5 and guaranteeing that at least one of the flips is executed), and maximum–minimum normalization operations were used as data enhancement strategies for the validation dataset. For the test dataset, random flip enhancement was utilized. An Adam optimizer expedited the converged model’s training with an initial learning rate of lr = 6 × 10⁻⁵. A cosine annealing strategy was implemented to adjust the learning rate dynamically. The batch size was set to 8 for training and validation, and the total number of iterations was set to 100 epochs.

3.5. Evaluation Indicators

In order to analyse the model performance more reasonably and quantitatively, the evaluation indexes utilized in this experiment are divided into two categories: model accuracy evaluation and model scale evaluation. Initially, the accuracy evaluation utilizes the following four representative accuracy indexes: (1) Intersection and merger ratio (IoU) quantifies the degree of overlap between the predicted segmentation results and the actual labels. This index is pivotal to the segmentation task, and values closer to 1 indicate more accurate segmentation. (2) Mean IoU considers foreground and background segmentation accuracy to avoid model bias towards a particular class (e.g., ignoring small targets). (3) The third metric is the F1-Score, which combines the model’s check accuracy and completeness for positive categories, making it suitable for scenarios with category imbalance. (4) The overall accuracy (OA) metric, which intuitively reflects the overall classification correctness of the model, should be interpreted with caution in scenarios where categories are severely imbalanced (e.g., where there are far more background pixels than foreground). For example, when the background accounts for 90% of the total, the model will predict the background 90% of the time, achieving an OA of 90%. The metrics are detailed in Equations (14)–(17).
F 1 Score = 2 TP 2 TP + FP + FN
IOU = TP TP + FP + FN
mIoU = TP TP + FP + FN
OA = TP + TN TP + TN + FP + FN
where TP (True Positive) is the number of pixels whose true label is positive, which the model also correctly predicts as positive. TN (True Negative) is the number of pixels whose true label is negative, which the model also correctly predicts as negative. FP (False Positive) is the number of pixels whose true label is negative but which the model incorrectly predicts as positive. FN (False Negative) is the number of pixels whose true label is positive but which the model incorrectly predicts as negative.
Secondly, four scale metrics are employed for model scale evaluation: (1) Floating-point operations (Flops) evaluate the computational complexity (Complexity) of the network and are utilized to measure the computational resources required to run the network in GFlops. (2) Frames per second (FPS) evaluate the speed of the network operation and are commonly measured by the number of samples processed per second. (3) Memory footprint (MB) evaluates the memory resources required for network operation and measures the memory efficiency of the network. (4) The number of model parameters (M) is used to evaluate the network model size and measure the network’s storage and computational efficiency.

4. Result

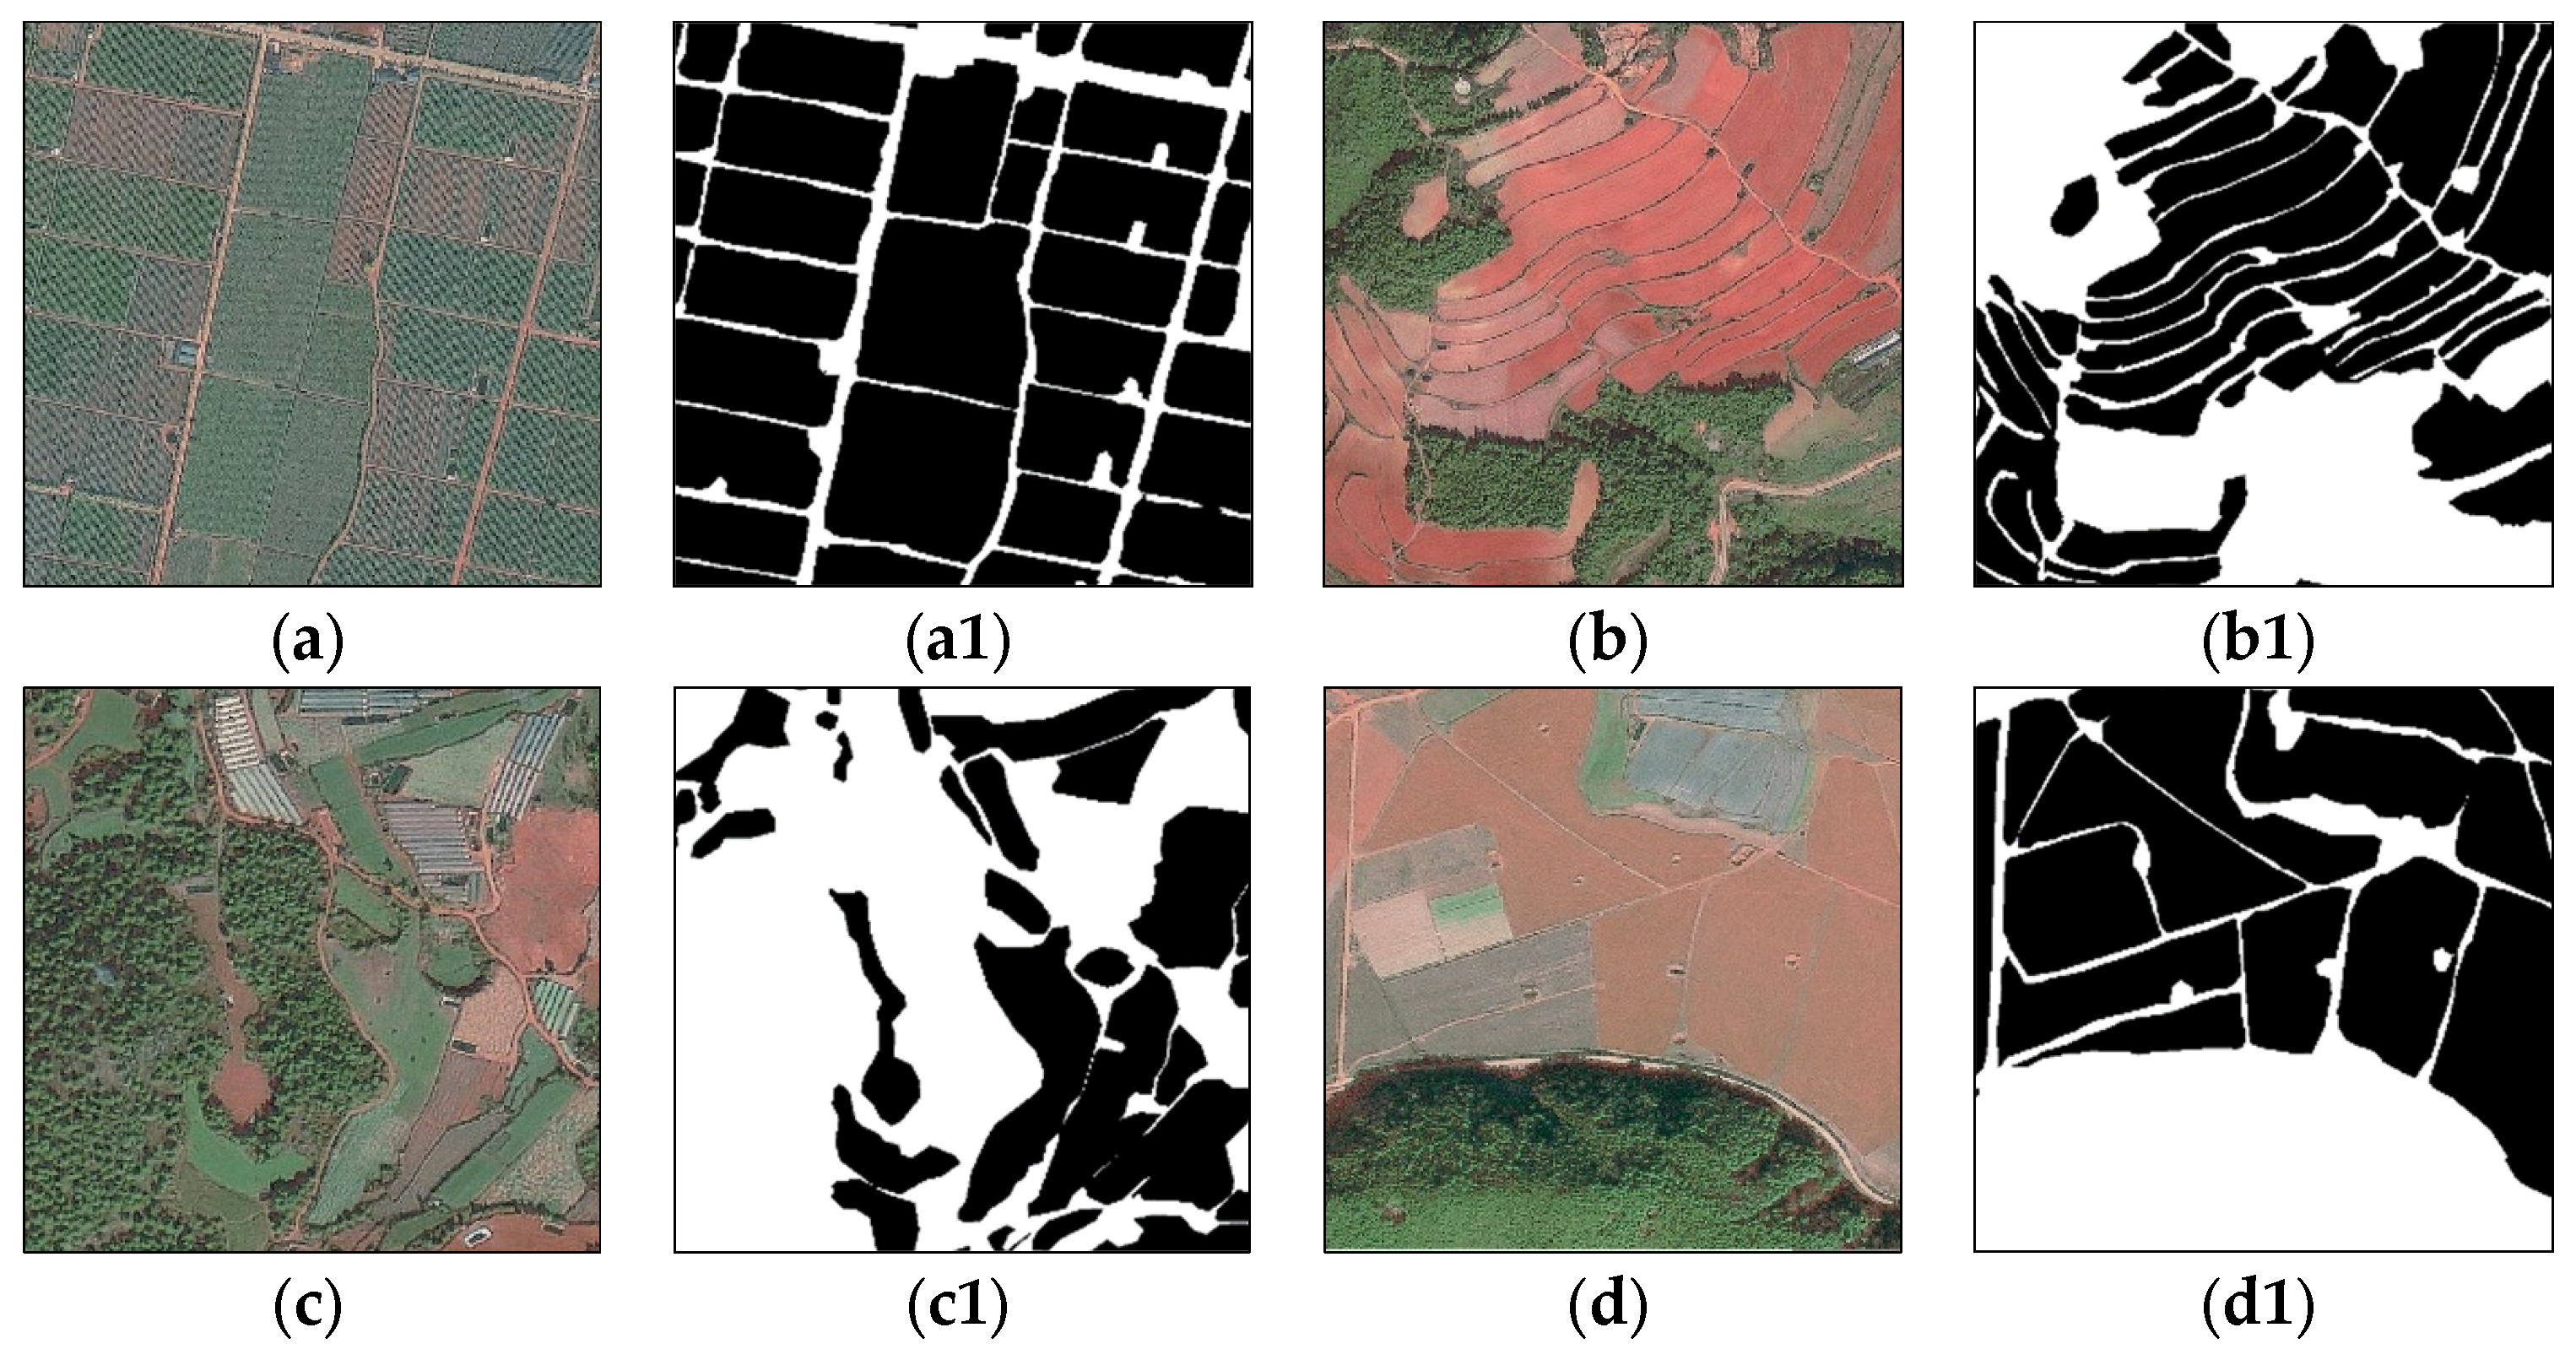
4.1. Test Results and Analysis

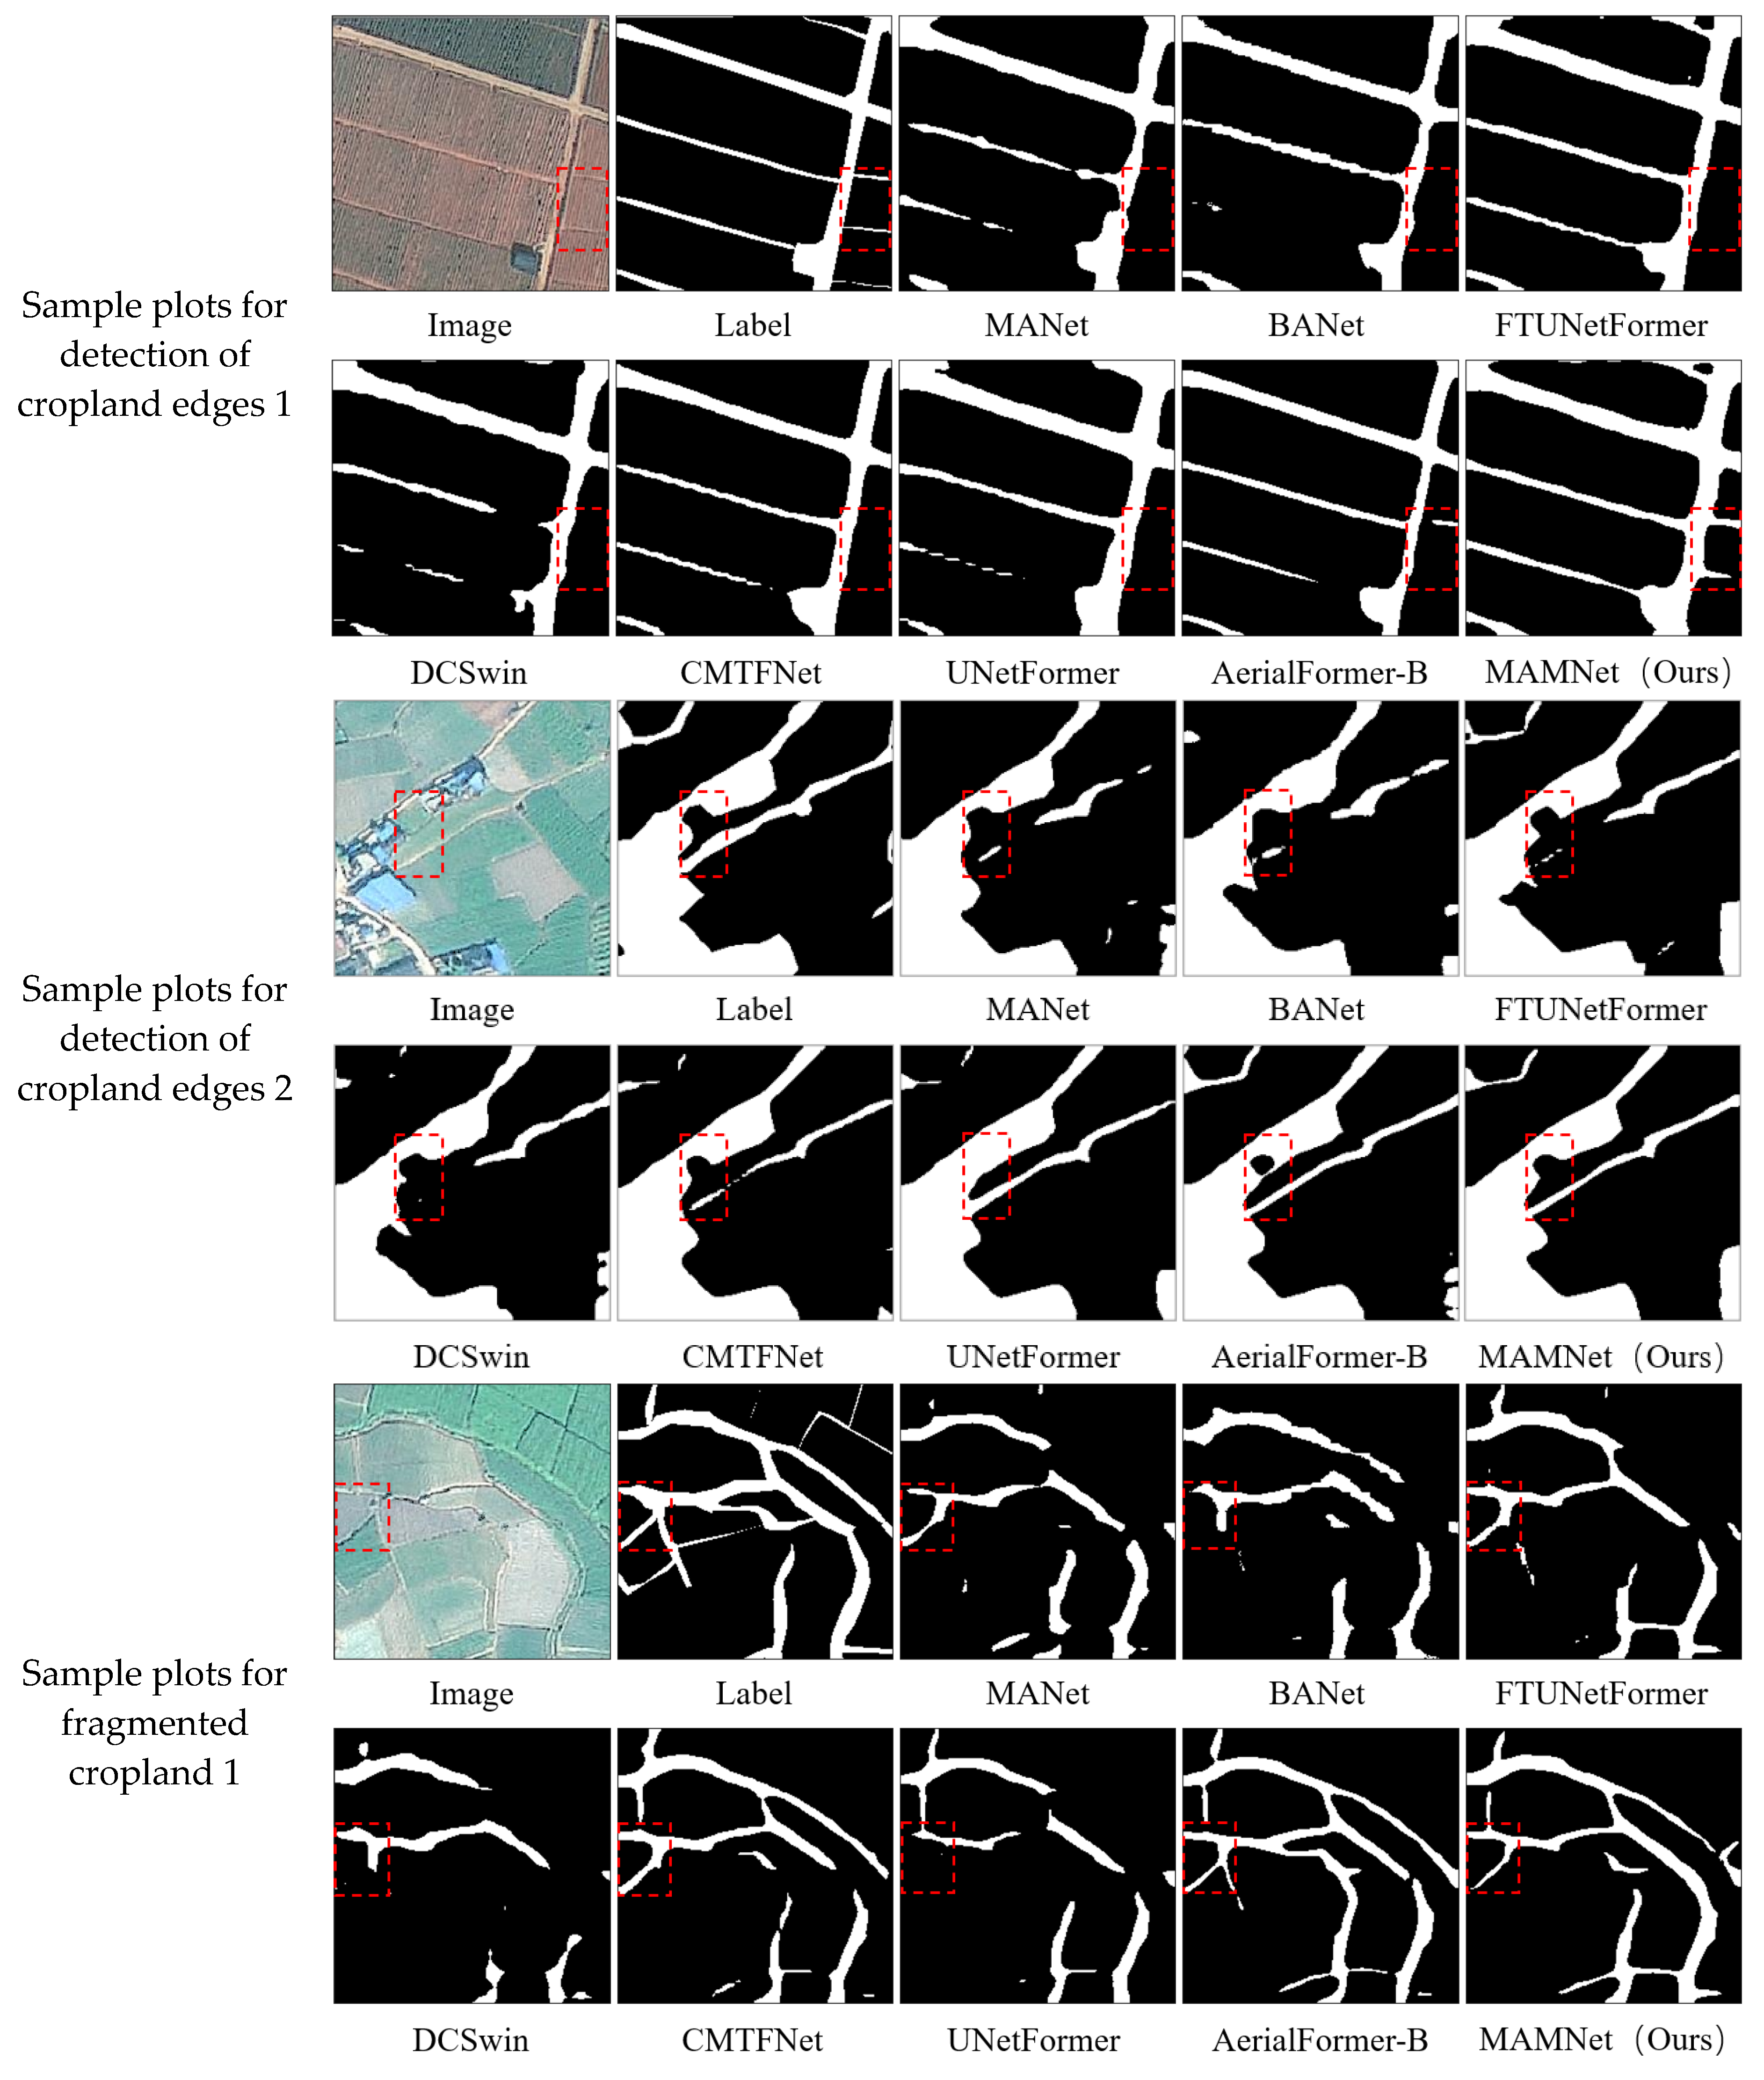
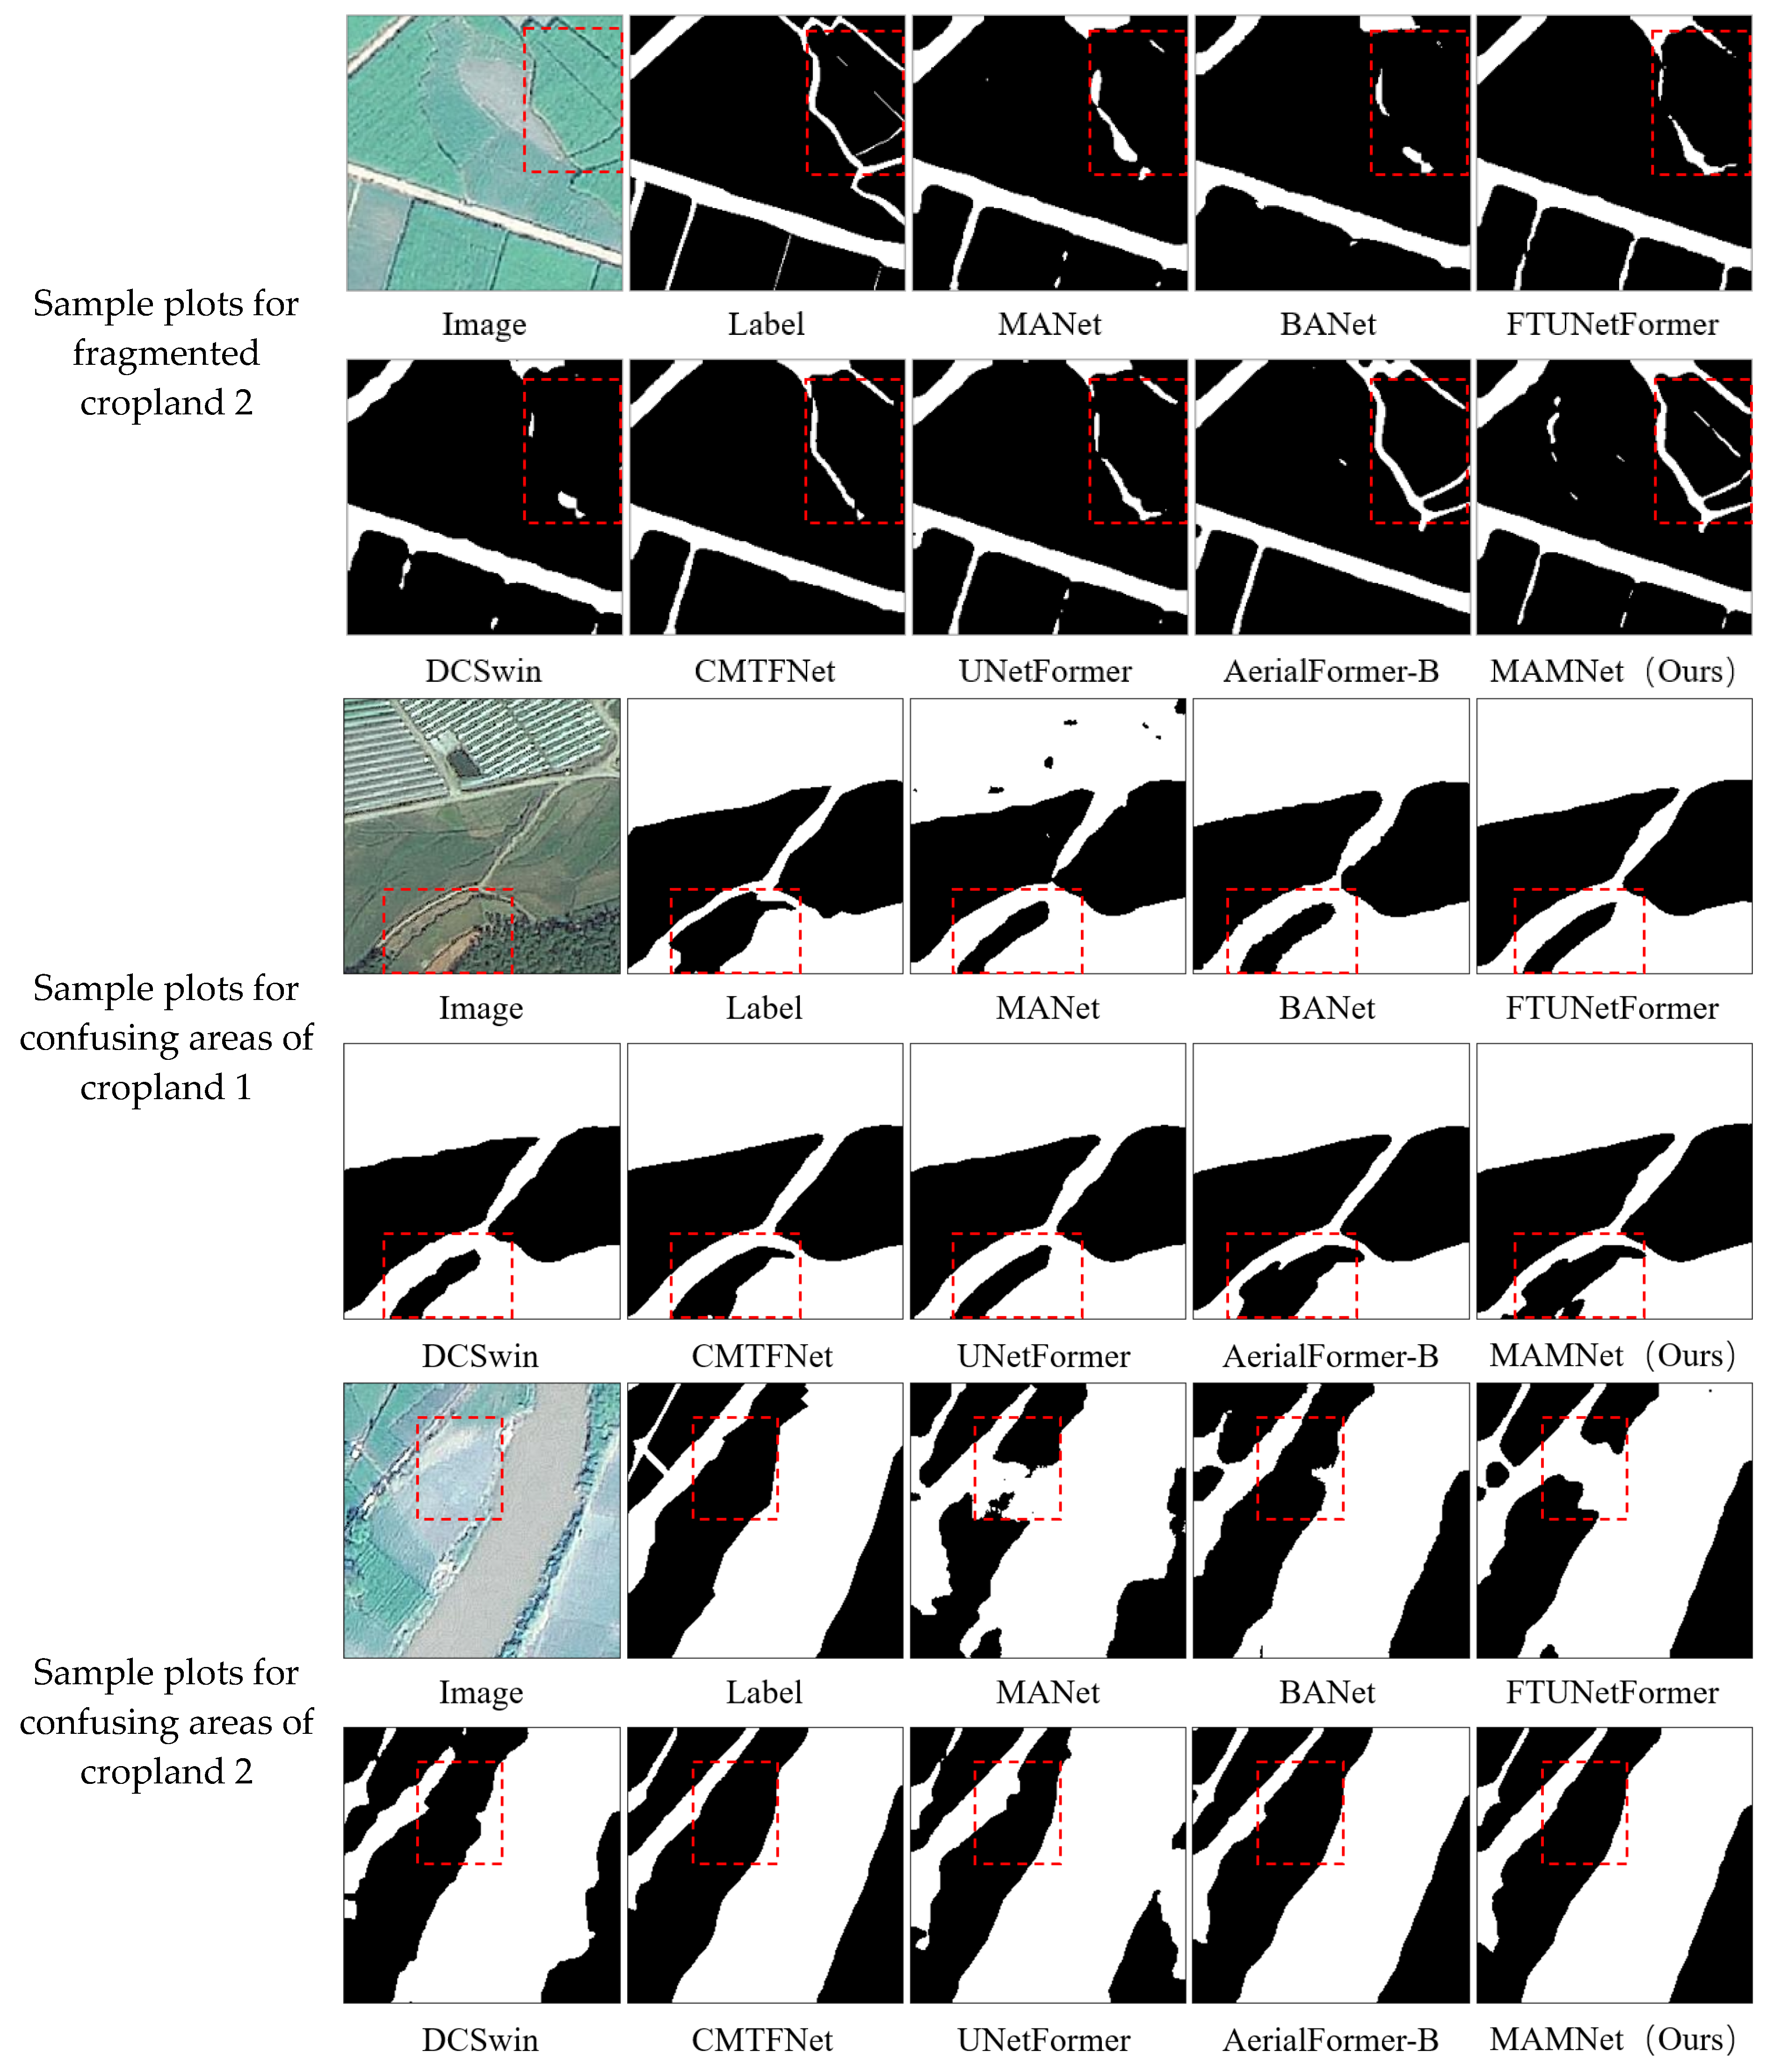
4.1.1. Comparative Test Results and Analysis

In order to comprehensively evaluate the performance advantages of MAMNet in cropland information extraction, seven representative hybrid architecture models were selected as benchmarks for comparison experiments in this study, among which the lightweight models are BANet [31], MANet [32], and DCSwin [33]. The high-accuracy models are AerialFormer-B [34], FTUNetFormer [29], UNetFormer [29], and CMTFNet [35]. As shown in Table 1, from the comparison of accuracy indexes, MAMNet shows significant performance advantages in cropland information extraction. Compared with AerialFormer-B, a SOTA model in remote sensing, MAMNet performs better in mIoU (+0.89%), F1-Score (+0.76%), and cropland IoU (+1.30%) metrics, and there is only a tiny gap of 0.32% in OA metrics. Compared with the suboptimal model UNetFormer, MAMNet achieved significant improvement in mIoU (+2.19%), F1 (+1.27%), and OA (+1.06%) indicators (p < 0.05, t-test).
As shown in Table 2, from the comparison of computational efficiency indexes, MAMNet occupies hardware resources in achieving the highest index of accuracy mIoU, the number of references is 12.0 M, which is close to BANet and UNetFormer; the complexity of 3.64 G belongs to the middle-weight and lightweight network; the memory share during training is 202.54 MB, which is a low occupancy and is suitable for the deployment of edge devices; and the number of samples per second processing is 41.52, which is in the range of real-time reasoning (>30 FPS). MAMNet extracts information with slightly lower overall accuracy in the cultivated land extraction task than the AerialFormer-B network. MAMNet is also higher than AerialFormer-B in the evaluation indexes of mIoU and F1. However, the high accuracy achieved by AerialFormer-B is accompanied by the vast complexity of the model parameters and model. For the computer consumption share compared with the UNetFormer model, the number of parameters (Parameters) is 0.3 M higher, and the memory share during training is 4.62 MB more. At the same time, the accuracy mIoU increases by 2.90%. Overall, MAMNet performs optimally in the task of extracting cropland information.
As shown in Figure 8, from the comparison results of each network visualization, (1) the sample points of cropland edge detection, the first cultivated land information, presents a complex network. FTUNetFormer, CMTFNet, and AerialFormer-B can extract continuous ridge information, and of the lightweight models, only MAMNet can extract complete ridge information. Moreover, for the red-boxed area, only the AerialFormer-B network model extracts part of the finer ridge information, and the MAMNet model extracts the finer ridges better. In the red boxed region of the second figure, MANet, BANet, FTUnetFormer, DCSwin, and CMTFNet all exhibit field ridge information extracted, and UNetFormer does not extract complete information on cultivated land in the box. (2) Fragmented cropland: Relative to most comparison networks, the AerialFormer-B and MAMNet models can roughly extract cropland areas. In the second fragmented cropland, only MAMNet completely extracted the characteristics of the finely fragmented cropland information. (3) Sample points of cropland confusion area: In the red boxed area, both MAMNet and AerialFormer can extract complete cropland information. At the same time, the rest of the high-performance models show partial loss of cropland information.

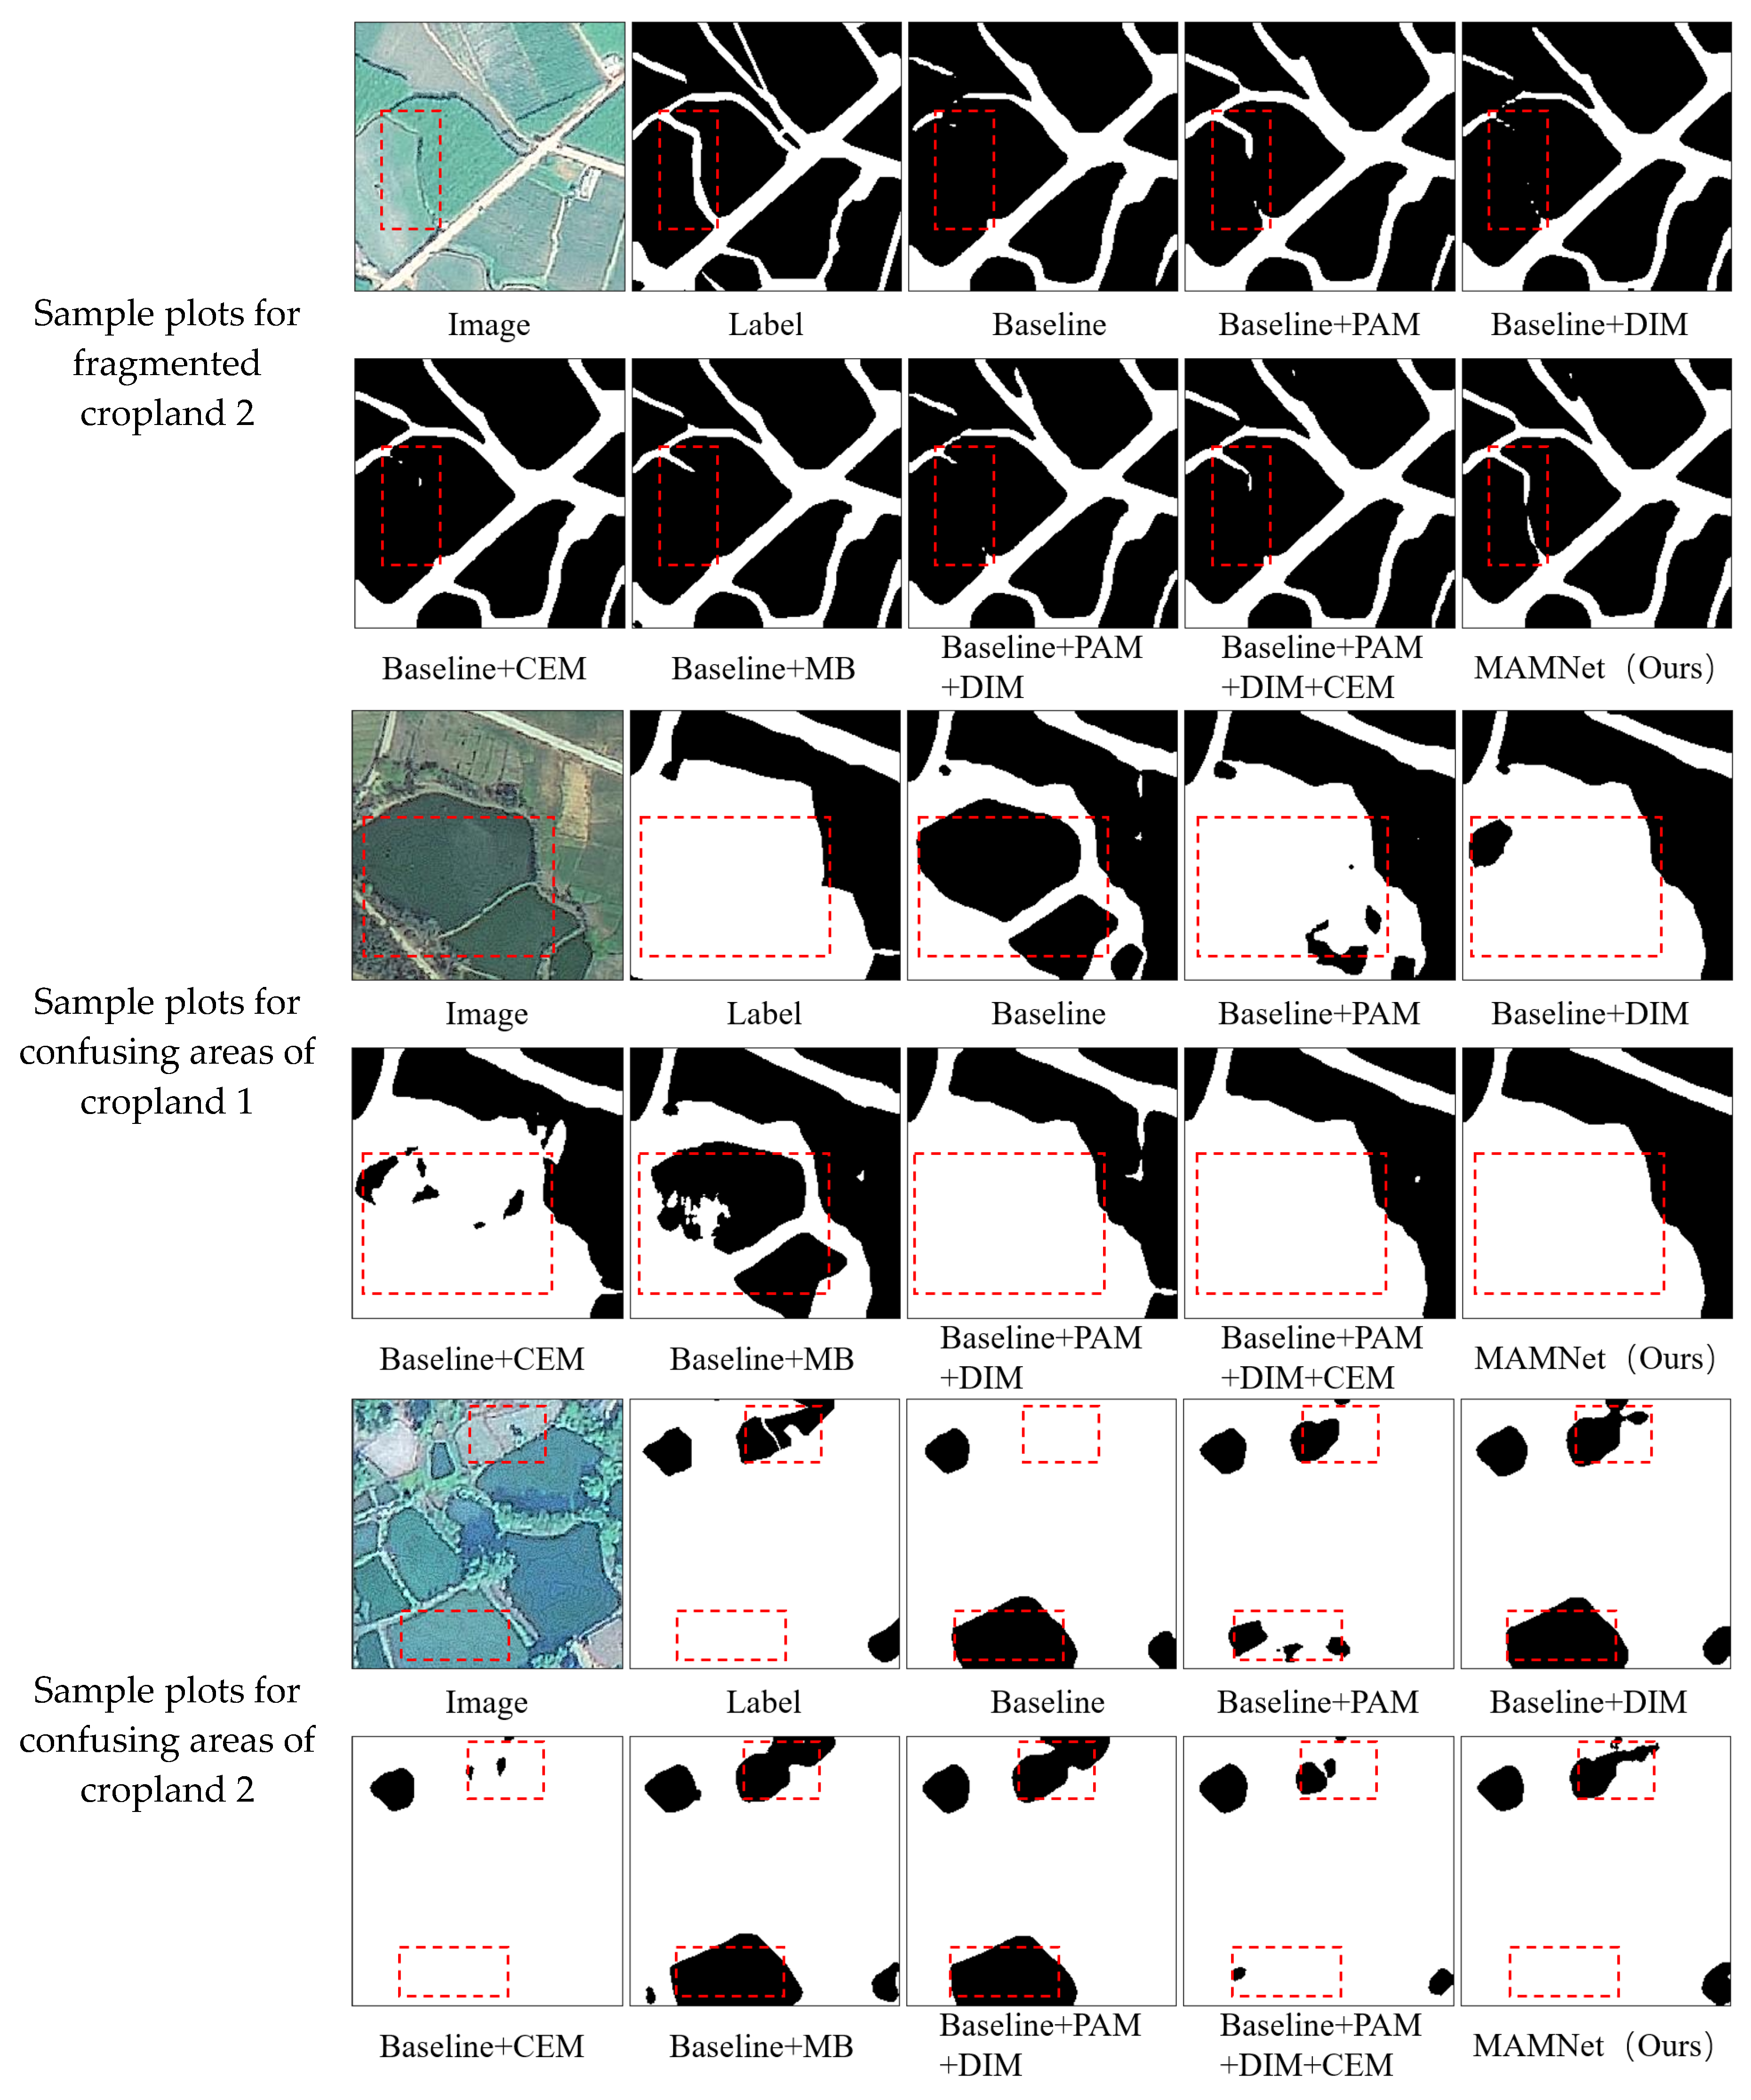
4.1.2. Ablation Test Results and Analysis

In order to verify the validity of each module of MAMNet, this study uses UNetFormer as the baseline model. It adopts the control variable method to conduct systematic ablation experiments using PAM: Position-Aware Module, DIM: detail improvement module, CEM: Context Enhancement Module, and MB: Multi-Branch Structure (Multi-Branch), respectively, for systematic ablation experiments, as shown in Table 3. With the addition of the PAM module, the mIoU is improved by +1.62% (85.40%), and the F1-Score is improved by +0.96% (92.13%), which indicates that the module effectively enhances the feature extraction ability of the cultivated land boundary and only increases the parameters by 0.1 M. The results show that the mIoU is improved by +1.62% (85.40%), and the F1-Score is improved by +0.96% (92.13%). Adding the DIM and CEM modules individually improves the mIoU by +0.84% (84.62%) and +1.12% (84.90%), respectively, indicating that the DIM module is helpful for multilevel feature fusion. The CEM module positively affects detail capture in small-scale cultivated areas, but the two individually have a limited effect. The PAM + DIM combination of mIoU reaches 85.50%, which is better than PAM or DIM alone, demonstrating the synergistic effect of the two in feature extraction and interaction. The PAM + DIM + CEM combination further improves the mIoU to 85.84%, suggesting that CEM can complement the insufficiency of boundary and deep features. When integrating the whole module, the model performance is optimized, and compared with the performance of baseline, the mIoU reaches 86.68% (+2.90%), F1 reaches 92.86% (+1.69%), and OA reaches 92.20% (+1.66%). The number of references increases by only 0.3 M (12.0 M), and the memory occupation increases by 4.62 MB (202.54 MB), which remains efficient with limited computational resources. The experimental results show that MAMNet achieves an optimal balance of performance and efficiency through modularized design, providing a new architectural design paradigm for high-resolution cropland information extraction.
The visualization of the ablation results is shown in Figure 9. (1) Sample plots for detection of cropland: In two different pictures of the red boxed map, Baseline appeared to be the phenomenon of the field ridge. The introduction of the PAM module solved the problem of the broken field ridge but produced a new problem of confusing the background misidentified as cultivated land, with the introduction of DIM and CEM to correct the misrecognized area, and finally adding MB to enhance the information extraction of cultivated land further. The addition of DIM, CEM, or MB alone is not as practical as PAM, and it is in line with the above table that adding PAM alone has the best accuracy. (2) Fragmented cropland sample sites: Baseline shows that the extraction of fragmented cropland is incomplete; adding PAM will optimize the extraction effect, and then DIM will refine the extraction effect, and with the addition of CEM and MB to improve the global details, complete extraction of fragmented cropland information is achieved. (3) Cultivated land confusing area sample points: Baseline cannot recognize the confusing area in the cultivated land, and the introduction of each module alone cannot wholly improve the problem. In the gradual addition of PAM, DIM, CEM, and MB, the accuracy of the classification of cultivated land and the background is improved, and the degree of confusing of the cultivated land and the background is reduced, and ultimately, more complete cultivated land information can be extracted.

5. Discussion

The MAMNet proposed in this study achieves an optimized balance between lightweight and high accuracy through multi-module collaborative design. The following list enumerates the primary innovations: Multi-scale feature enhancement improves the quality of visual content by enhancing its visual elements across multiple scales, ranging from the finest to the coarsest. The proposed DIM module employs an innovative integration of the global expression features of PAM through detail feature enhancement, addressing confusion and misidentification in specific regions and enhancing the representation of partial detail areas. This approach effectively addresses the problem of incomplete extraction of fragmented farmland information. The subsequent section addresses the concept of context modelling optimization. The Context Enhancement Module (CEM) fuses high-resolution and deep low-resolution features, working with the PAM and DIM modules to improve inter-class confusion in complex scenes. From a global detail perspective, it enhances the overall extraction of farmland information, enabling the model to exhibit higher robustness. Cascaded feature reconstruction system: The Feature Extraction Module (FEM) and the enhanced feature reconstruction head (FRH) are hereby proposed. Adopting an additional skip connection from the Swin SMT [36] network enables the system to aggregate shallow and deep features effectively. The FEM is designed to preserve the complexity of the model and its parameters while extracting initial feature information from both global and local perspectives. The FRH integrates shallow and deep features and dynamically assigns feature weights based on global and local attention to refine the aggregated features. The multi-branch structure demonstrates a 0.84% enhancement in mIoU with a marginal increase of only 0.3 million parameters, thereby substantiating the efficacy of its design. A breakthrough has been achieved in the field of lightweight architecture. The model parameter count (12.0 M) is a mere 10.53% of AerialFormer-B [34] and 39.87% of CMTFNet [35], with a model complexity of 3.64 GFPS and memory usage of 202.54 MB, thus meeting real-time processing requirements. In the context of farmland information extraction, the accuracy metrics demonstrate a higher level of performance than the prevailing mainstream models.
A systematic experiment was conducted on the farmland dataset in Chenggong District, Kunming City, Yunnan Province, China, to demonstrate the advantages of MAMNet. The experiment revealed several notable advantages, including an accuracy advantage, as evidenced by mIoU reaching 86.68% and the F1-Score reaching 92.86%. Compared with the next best model, this represents improvements of 2.19% and 1.27%, respectively. About OA metrics, the system exhibits a slight variation of 0.45% compared with AerialFormer-B. Secondly, the ability to adapt to particular circumstances is essential. MAMNet has achieved accuracy comparable to contemporary mainstream models in extracting large-scale regular farmland information. Furthermore, the identification of fragmented plots is enhanced, reducing the false negative rate for farmland patches smaller than 0.1 mu. It, in turn, enables the accurate identification of complete fragmented small-scale farmland information.
The present study is currently subject to two significant limitations: (1) at the data level, the single GF-2 optical data source suffers from severe temporal discontinuity issues under the monsoon climate of the Yunnan Plateau (where cloud coverage typically exceeds 60% from June to September), leading to spectral features being disrupted by terrain shadow coupling effects. It aligns with the challenges highlighted by Li et al. [37] regarding optical remote sensing monitoring in monsoon regions. (2) At the model level, although the MAMNet network achieved an OA accuracy of 92.20% in Chenggong District, its cross-regional generalization has not been verified, particularly lacking tests on its adaptability to complex mountainous environments with terraced fields of varying elevations.

6. Conclusions

The present paper addresses the issues of incomplete extraction of information about fragmented farmland, blurred edges, and identification of field boundary breaks. The proposed solution is a lightweight network designated as MAMNet, which integrates CNN and Transformer technologies. The primary contributions and conclusions are as follows:
(1) The implementation of the cascaded design of the detail improvement module (DIM) and the Context Enhancement Module (CEM) has led to a substantial enhancement in the overall accuracy (OA) of fragmented farmland, with a minimum size of 15 pixels, achieving a remarkable 92.20% accuracy. This enhancement is further substantiated by a boundary localization accuracy (F1-Score) of 92.86%, underscoring the efficacy of the proposed methodology.
(2) The model’s multi-scale feature adaptive aggregation, facilitated by the feature reconstruction head (FRH) and the Jump-type Feature Extraction Mechanism (FEM), maintains a lightweight architecture (12.0 M parameters) while enhancing model accuracy, as evidenced by an increase in mIoU of 0.84%, substantiating the efficacy of its design.
(3) Experimental findings demonstrate that the MAMNet network attains considerably higher information extraction accuracy than conventional models in the complex farmland scenes of Kunming Chenggong District. The system’s modular design approach is scalable to other land-cover monitoring domains such as forest and wetland areas. However, its cross-regional model generalization capability requires further validation and improvement to meet the assessment criteria for sustainable farmland use under the United Nations Sustainable Development Goal (SDG 2.4).

Author Contributions

Conceptualization, J.W. (Jiayong Wu); methodology, J.W. (Jiayong Wu); software, J.W. (Jiayong Wu); validation, J.W. (Jiayong Wu), X.D., J.W. (Jinliang Wang) and J.P.; formal analysis, J.W. (Jiayong Wu); investigation, J.W. (Jiayong Wu); resources, J.W. (Jiayong Wu); data curation, J.W. (Jiayong Wu); writing—original draft preparation, J.W. (Jiayong Wu); writing—review and editing, X.D., J.W. (Jinliang Wang) and J.P.; visualization, J.W. (Jiayong Wu); supervision, X.D., J.W. (Jinliang Wang) and J.P.; project administration, J.W. (Jiayong Wu); funding acquisition, X.D., J.W. (Jinliang Wang) and J.P. All authors have read and agreed to the published version of the manuscript.

Funding

This research was funded by the Yunnan Provincial Science and Technology Major Project (Southwest Joint Graduate School of Science and Technology Special Project—Major Project on Basic and Applied Basic Research): Multimodal Remote Sensing-Based Monitoring of Vegetation Changes in Mining Areas of the Jinsha River Basin in Yunnan and Ecological Rehabilitation Modelling (Grant No. 202302AO370003); Yunnan Provincial Basic Research Program, Project Title: Remote sensing estimation of above-ground carbon sinks in vegetation of urban agglomerations in central Yunnan and its response to climate change and human activities (Grant No. 202401AT070103); and Estimation of forest aboveground biomass carbon in typical mountainous and plateau areas based on ICESat-2/ATLAS data (Grant No. 202501AT070008).

Institutional Review Board Statement

Not applicable.

Data Availability Statement

The data supporting this study are not publicly available due to the extensive processing efforts required to generate the final dataset. However, anonymized or processed data subsets may be shared upon reasonable request to the corresponding author for academic purposes.

Conflicts of Interest

The authors declare no conflicts of interest.

References

  1. Weiss, M.; Jacob, F.; Duveiller, G. Remote sensing for agricultural applications: A meta-review. Remote Sens. Environ. 2020, 236, 111402. [Google Scholar] [CrossRef]
  2. Xie, D.; Xu, H.; Xiong, X.; Liu, M.; Hu, H.; Xiong, M.; Liu, L. Cropland Extraction in Southern China from Very High-Resolution Images Based on Deep Learning. Remote Sens. 2023, 15, 2231. [Google Scholar] [CrossRef]
  3. Li, S.; Li, X. Global understanding of farmland abandonment: A review and prospects. J. Geogr. Sci. 2017, 27, 1123–1150. [Google Scholar] [CrossRef]
  4. Persello, C.; Tolpekin, V.A.; Bergado, J.R.; de By, R.A. Delineation of agricultural fields in smallholder farms from satellite images using fully convolutional networks and combinatorial grouping. Remote Sens. Environ. 2019, 231, 111253. [Google Scholar] [CrossRef]
  5. Wang, J.; Zhang, S.; Lizaga, I.; Zhang, Y.; Ge, X.; Zhang, Z.; Zhang, W.; Huang, Q.; Hu, Z. UAS-based remote sensing for agricultural Monitoring: Current status and perspectives. Comput. Electron. Agric. 2024, 227, 109501. [Google Scholar] [CrossRef]
  6. Shi, C.; Zhang, X.; Wang, L.; Jin, Z. A lightweight convolution neural network based on joint features for Remote Sensing scene image classification. Int. J. Remote Sens. 2023, 44, 6615–6641. [Google Scholar] [CrossRef]
  7. Long, J.; Shelhamer, E.; Darrell, T. Fully convolutional networks for semantic segmentation. In Proceedings of the IEEE Conference on Computer Vision and Pattern Recognition, Boston, MA, USA, 7–12 June 2015; pp. 3431–3440. [Google Scholar]
  8. Ronneberger, O.; Fischer, P.B.T. U-Net: Convolutional Networks for Biomedical Image Segmentation. In Proceedings of the Medical Image Computing and Computer-Assisted Intervention–MICCAI, Munich, Germany, 5–9 October 2015; pp. 234–241. [Google Scholar]
  9. Zhao, H.; Shi, J.; Qi, X.; Wang, X.; Jia, J. Pyramid scene parsing network. In Proceedings of the IEEE Conference on Computer Vision and Pattern Recognition, Honolulu, HI, USA, 21–26 July 2017; pp. 2881–2890. [Google Scholar]
  10. Chen, L.C.; Papandreou, G.; Kokkinos, I.; Murphy, K.; Yuille, A.L. DeepLab: Semantic Image Segmentation with Deep Convolutional Nets, Atrous Convolution, and Fully Connected CRFs. IEEE Trans. Pattern Anal. Mach. Intell. 2018, 40, 834–848. [Google Scholar] [CrossRef]
  11. Zhang, D.; Pan, Y.; Zhang, J.; Hu, T.; Zhao, J.; Li, N.; Chen, Q. A generalized approach based on convolutional neural networks for large area cropland mapping at very high resolution. Remote Sens. Environ. 2020, 247, 111912. [Google Scholar] [CrossRef]
  12. Qi, W.; Wei, M.; Yang, W.; Xu, C.; Ma, C. Automatic Mapping of Landslides by the ResU-Net. Remote Sens. 2020, 12, 2487. [Google Scholar] [CrossRef]
  13. Liu, G.; Bai, L.; Zhao, M.; Zang, H.; Zheng, G. Segmentation of wheat farmland with improved U-Net on drone images. J. Appl. Remote Sens. 2022, 16, 034511. [Google Scholar] [CrossRef]
  14. Dosovitskiy, A.; Beyer, L.; Kolesnikov, A.; Weissenborn, D.; Zhai, X.; Unterthiner, T.; Dehghani, M.; Minderer, M.; Heigold, G.; Gelly, S.; et al. An image is worth 16 × 16 words: Transformers for image recognition at scale. arXiv 2020, arXiv:2010.11929. [Google Scholar]
  15. Xu, H.; Song, J.; Zhu, Y. Evaluation and Comparison of Semantic Segmentation Networks for Rice Identification Based on Sentinel-2 Imagery. Remote Sens. 2023, 15, 1499. [Google Scholar] [CrossRef]
  16. Liu, Z.; Lin, Y.; Cao, Y.; Guo, H.; Wei, Y. Swin transformer: Hierarchical vision transformer using shifted windows. In Proceedings of the IEEE/CVF Conference on Computer Vision and Pattern Recognition, Nashville, TN, USA, 20–25 June 2021; pp. 10012–10022. [Google Scholar]
  17. Zhong, B.; Wei, T.; Luo, X.; Du, B.; Hu, L.; Ao, K.; Yang, A.; Wu, J. Multi-Swin Mask Transformer for Instance Segmentation of Agricultural Field Extraction. Remote Sens. 2023, 15, 549. [Google Scholar] [CrossRef]
  18. Xie, W.; Zhao, M.; Liu, Y.; Yang, D.; Huang, K.; Fan, C.; Wang, Z. Recent advances in Transformer technology for agriculture: A comprehensive survey. Eng. Appl. Artif. Intell. 2024, 138, 109412. [Google Scholar] [CrossRef]
  19. Liu, Y.; Zhang, T.; Huang, Y.; Shi, F. An Edge-Aware Multitask Network Based on CNN and Transformer Backbone for Farmland Instance Segmentation. IEEE J. Sel. Top. Appl. Earth Obs. Remote Sens. 2024, 17, 13765–13779. [Google Scholar] [CrossRef]
  20. Dheeraj, A.; Chand, S. Deep learning based weed classification in corn using improved attention mechanism empowered by Explainable AI techniques. Crop Prot. 2025, 190, 107058. [Google Scholar] [CrossRef]
  21. Woo, S.; Park, J.; Lee, J.-Y.; Kweon, I.S. Cbam: Convolutional block attention module. In Proceedings of the European Con-ference on Computer Vision (ECCV), Munich, Germany, 8–14 September 2018; pp. 3–19. [Google Scholar]
  22. Tan, M.; Le, Q. Efficientnet: Rethinking model scaling for convolutional neural networks. In Proceedings of the International Conference on Machine Learning, PMLR 2019, Long Beach, CA, USA, 9–15 June 2019; pp. 6105–6114. [Google Scholar]
  23. Miao, L.; Li, X.; Zhou, X.; Yao, L.; Deng, Y.; Hang, T.; Zhou, Y.; Yang, H. SNUNet3+: A Full-Scale Connected Siamese Network and a Dataset for Cultivated Land Change Detection in High-Resolution Remote-Sensing Images. IEEE Trans. Geosci. Remote Sens. 2024, 62, 4400818. [Google Scholar] [CrossRef]
  24. Roy, A.G.; Navab, N.; Wachinger, C. Concurrent spatial and channel squeeze & excitation in fully convolutional networks. In Proceedings of the International Conference on Medical Image Computing and Computer-Assisted Intervention, Granada, Spain, 16–20 September 2018; pp. 421–429. [Google Scholar]
  25. Li, H.; Lin, H.; Luo, J.; Wang, T.; Chen, H.; Xu, Q.; Zhang, X. Fine-Grained Abandoned Cropland Mapping in Southern China Using Pixel Attention Contrastive Learning. IEEE J. Sel. Top. Appl. Earth Obs. Remote Sens. 2024, 17, 2283–2295. [Google Scholar] [CrossRef]
  26. Xiao, J.; Zhang, D.; Li, J.; Liu, J. A study on the classification of complexly shaped cultivated land considering multi-scale features and edge priors. Environ. Monit. Assess. 2024, 196, 816. [Google Scholar] [CrossRef]
  27. He, K.; Zhang, X.; Ren, S.; Sun, J. Deep residual learning for image recognition. In Proceedings of the IEEE Conference on Computer Vision and Pattern Recognition, Las Vegas, NV, USA, 27–30 June 2016; pp. 770–778. [Google Scholar]
  28. Guo, M.H.; Xu, T.X.; Liu, J.J.; Liu, Z.N.; Jiang, P.T.; Mu, T.J.; Zhang, S.-H.; Martin, R.R.; Cheng, M.M.; Hu, S.M. Attention mechanisms in computer vision: A survey. Comput. Vis. Media 2022, 8, 331–368. [Google Scholar] [CrossRef]
  29. Wang, L.; Li, R.; Zhang, C.; Fang, S.; Duan, C.; Meng, X.; Atkinson, P.M. UNetFormer: A UNet-like transformer for efficient semantic segmentation of remote sensing urban scene imagery. ISPRS J. Photogramm. Remote Sens. 2022, 190, 196–214. [Google Scholar] [CrossRef]
  30. Ding, L.; Tang, H.; Bruzzone, L. LANet: Local Attention Embedding to Improve the Semantic Segmentation of Remote Sensing Images. IEEE Trans. Geosci. Remote Sens. 2021, 59, 426–435. [Google Scholar] [CrossRef]
  31. Wang, L.; Li, R.; Wang, D.; Duan, C.; Wang, T.; Meng, X. Transformer Meets Convolution: A Bilateral Awareness Network for Semantic Segmentation of Very Fine Resolution Urban Scene Images. Remote Sens. 2021, 13, 3065. [Google Scholar] [CrossRef]
  32. Li, R.; Zheng, S.; Zhang, C.; Duan, C.; Su, J.; Wang, L.; Atkinson, P.M. Multiattention Network for Semantic Segmentation of Fine-Resolution Remote Sensing Images. IEEE Trans. Geosci. Remote Sens. 2022, 60, 5607713. [Google Scholar] [CrossRef]
  33. Wang, L.; Li, R.; Duan, C.; Zhang, C.; Meng, X.; Fang, S. A Novel Transformer Based Semantic Segmentation Scheme for Fine-Resolution Remote Sensing Images. IEEE Geosci. Remote Sens. Lett. 2022, 19, 6506105. [Google Scholar] [CrossRef]
  34. Hanyu, T.; Yamazaki, K.; Tran, M.; McCann, R.A.; Liao, H.; Rainwater, C.; Adkins, M.; Cothren, J.; Le, N. AerialFormer: Multi-Resolution Transformer for Aerial Image Segmentation. Remote Sens. 2024, 16, 2930. [Google Scholar] [CrossRef]
  35. Wu, H.; Huang, P.; Zhang, M.; Tang, W.; Yu, X. CMTFNet: CNN and Multiscale Transformer Fusion Network for Remote-Sensing Image Semantic Segmentation. IEEE Trans. Geosci. Remote Sens. 2023, 61, 2004612. [Google Scholar] [CrossRef]
  36. Płotka, S.; Chrabaszcz, M.; Biecek, P. Swin SMT: Global Sequential Modeling for Enhancing 3D Medical Image Segmentation. In Proceedings of the Medical Image Computing and Computer Assisted Intervention—MICCAI, Marrakesh, Morocco, 6–10 October 2024; pp. 689–698. [Google Scholar]
  37. Li, Z.; Shen, H.; Weng, Q.; Zhang, Y.; Dou, P.; Zhang, L. Cloud and cloud shadow detection for optical satellite imagery: Features, algorithms, validation, and prospects. ISPRS J. Photogramm. Remote Sens. 2022, 188, 89–108. [Google Scholar] [CrossRef]
Figure 2. Typical sample plots: sample plots for detection of cropland edges (a,a1,b,b1), sample plots for fragmented cropland (c,c1), sample plots for confusing areas of cropland (d,d1).
Agriculture 15 01152 g002
Figure 3. Structure of the MAMNet model framework.
Agriculture 15 01152 g003
Figure 7. Structure of FRH module.
Agriculture 15 01152 g007
Figure 8. Comparison of visualization results of different networks for extracting cropland information. The red rectangles in the figure highlight the differences between the experimental model and other comparison models.
Agriculture 15 01152 g008aAgriculture 15 01152 g008b
Figure 9. Comparative visualization of ablation tests. The red rectangles in the figure highlight the differences between the experimental model and other comparison models.
Agriculture 15 01152 g009aAgriculture 15 01152 g009b
Table 1. Comparison test accuracy index. Boldface is used in the table to indicate the highest value within each column.
MethodIoU (%)mIoU (%)F1 (%)OA (%)
MANet81.1583.6591.0790.40
BANet80.7282.0890.1689.76
DCSwin80.2981.8990.0489.58
UNetFormer81.5083.7891.1790.54
FTUNetFormer81.2183.2790.8790.29
AerialFormer-B84.4186.2092.5892.65
CMTFNet82.8784.4991.5991.14
MAMNet84.1786.6892.8692.20
Table 2. Comparison test consumption hardware indicators.
MethodBackboneParameters
(M)
Complexity
(G)
Memory
(MB)
Speed (Number of Samples/Second)mIoU
(%)
MANetResNet5035.914.88572.2527.4483.65
BANetRest-Lite12.72.49212.2539.6782.08
DCSwinSwin-small66.98.611058.2521.3781.89
UNetFormerResNet1811.72.25197.9246.5983.78
FTUNetFormerSwin-base96.023.101503.6812.7183.27
AerialFormer-BSwin-base114.033.041587.4310.5486.20
CMTFNetResNet5030.16.66486.6629.0284.49
MAMNetResNet1812.03.64202.5441.5286.68
Table 3. Module ablation test. Boldface is used in the table to indicate the highest value within each column.
MouldModulemIoU
(%)
F1
(%)
OA
(%)
Parameter
(M)
Memory
(MB)
PAMDIMCEMMB
Baseline 83.7891.1790.5411.7197.92
Baseline + PAM 85.4092.1391.5511.8199.21
Baseline + DIM 84.6291.6791.1211.8198.39
Baseline + CEM 84.9091.8491.0111.7196.69
Backline + MB 85.3792.1191.6411.9201.94
Baseline + PAM + DIM 85.5092.1891.6011.8199.09
Baseline + PAM + DIM + CEM 85.8492.3891.8311.8200.39
MAMNet86.6892.8692.2012.0202.54
Disclaimer/Publisher’s Note: The statements, opinions and data contained in all publications are solely those of the individual author(s) and contributor(s) and not of MDPI and/or the editor(s). MDPI and/or the editor(s) disclaim responsibility for any injury to people or property resulting from any ideas, methods, instructions or products referred to in the content.

