This section outlines the dataset employed, the algorithms configurations, and the metrics utilized for evaluation.
3.1. Dataset
In order to train and test the algorithms, we developed a labeled dataset of vineyard images [
21]. The images were taken in the southwest of the province of Badajoz in Spain, where the pardina variety and the Royat hedge arrangement style are the most common. In this article, we worked with pardina vineyards pruned in the double Royat style, in which the shoots are vertically trellised on wires.
Images were taken using two different cameras: Canon EOS 2000D and Samsung SM-A715F (smartphone) (Suwon, Republic of Kore). The image collection began in 2021 and was repeated annually, though the 2023 images were not used in the current research. The prototype set and its ground truth (GT) were built using the VGG Image Annotator (VIA) software [
22]. During the label creation process, the three classes
shoot,
pruned shoot, and
trunk were registered. Each image always contains at least one
trunk object, along with objects from the other two classes. The
pruned shoot class was added to assist the system in developing generalizable solutions. However, it is not guaranteed that all three categories are present in every image.
The addition of the
pruned shoot class to our work is the result of a previous study using Mask R-CNN on an initial set of images. Early models tended to segment pruned shoots as shoots to be pruned. Labeling examples of this new class improved the performance in detecting shoots that actually need to be pruned.
Figure 2 illustrates an example of a partially pruned vine plant labeled through the VIA software. As we can see, for the
shoot class, only the initial portion of the shoot is considered, as previously stated.
Table 1 presents the dataset containing 536 images with different resolutions. They were taken from different positions and distances, looking for the robustness of the system. After the annotation process, as presented in
Table 2, we obtained 5329 objects of the class
shoot, 887 for
pruned shoot, and 752 for
trunk. This dataset [
21] is available to the research community as detailed in the Data Availability Statement section.
As we can see in
Table 1, the dataset is clearly imbalanced, maintaining a 6-to-1 ratio between the number of prototypes of the shoot and pruned shoot classes. This is because the pruned shoot class was not included at the beginning of our work. It is well known that machine learning models struggle to differentiate minority classes and tend to treat them as noise with respect to majority classes [
23]. In [
23,
24], the authors showed different strategies to mitigate the class imbalanced data. In this work, we balanced the dataset by applying data augmentation on the images where objects of the
pruned shoot class are in the majority. In this way, when data augmentation generates a new image, the number of prototypes of the majority class is increased. However, it also increases, albeit to a lesser extent, those of the other classes present in the image.
Figure 3 shows examples of the generated images.
Table 2 summarizes the new dataset distribution. Unfortunately, it is impossible to balance the instances of the trunk class, since each trunk instance is present once or, at most, twice in each image, making it impossible to augment its instances without further augmenting the other classes.
3.2. Algorithm Configurations
In [
15], we already studied the performance of a Mask R-CNN model on a preliminary dataset, and we obtained the optimized configuration parameters that we use in this work. We trained our Mask R-CNN-FPN networks by applying the transfer learning technique, using a ResNet50 backbone provided by the Detectron2 project as baseline model id
137849600. We trained our networks using data augmentation, enabling the algorithms specified in
Table 3. The optimized
anchor sizes were 16, 32, 64, 128, and 256 and the
anchor aspect ratios were 0.2, 0.3, 0.5, 0.7, and 1. These values were chosen to favor the segmentation of unpruned shoots, which generally have a narrow and elongated shape. We performed a set of training experiments to empirically find the best learning rate for this model and found a value of 0.0001.
In YOLOv8, the configuration was simplified by the Ultralytics framework, which provides an automatic optimizer that not only selects the type of optimizer to use from those available, but also automatically sets the learning rate, dynamics, and batch size.
To determine the appropriate batch size, YOLOv8 evaluates GPU memory availability. The framework executes a preliminary test to identify the largest batch size that utilizes approximately 60% of the available CUDA memory (
https://docs.ultralytics.com/modes/train/#train-settings (accessed on 20 May 2025)). This strategy balances memory efficiency with training throughput and reduces the risk of out-of-memory errors.
Optimizer and learning rate selection are handled adaptively. In the initial training phase (first 10,000 iterations), YOLOv8 defaults to the AdamW optimizer, due to its ability to achieve faster convergence at early stages [
25]. After surpassing the 10,000-iteration threshold, the optimizer automatically switches to Stochastic Gradient Descent (SGD), which generally exhibits better generalization performance in deep learning tasks.
In our specific training scenario, the dataset comprises 1288 images, partitioned into 10 folds for cross-validation (k = 10). With a batch size of 5, each fold processes approximately 1159 images, yielding around 232 iterations per epoch. Over the full training cycle, the total number of iterations exceeds 10,000, thus activating the optimizer transition mechanism. As a result, training begins with AdamW, using a learning rate of 0.001429 and momentum of 0.9, and subsequently, transitions to SGD, by YOLOv8’s internal optimization logic (
https://docs.ultralytics.com/reference/engine/trainer/#ultralytics.engine.trainer.BaseTrainer.build_optimizer (accessed on 20 May 2025).
Again, transfer learning was applied from the image segmentation model provided by Ultralytics pretrained on the Microsoft Common Objects in Context (COCO) dataset. Only the final layers of the network are trained, freezing the first 22 layers and training the head only. In this second group of experiments, data augmentation was also used with the operations listed in
Table 4.
Among the different versions of YOLO, we chose version 8 in the sizes nano (N), small (S), medium (M), large (L), and extra large (X).
Table 5 reflects the number of trainable parameters of each of the models used, according to the specifications of their developers.
For both models, we used fixed size images of 1024 pixels width. Both models were trained on 1000 epochs using early stopping as the regularization technique with a patience of 100 epochs.
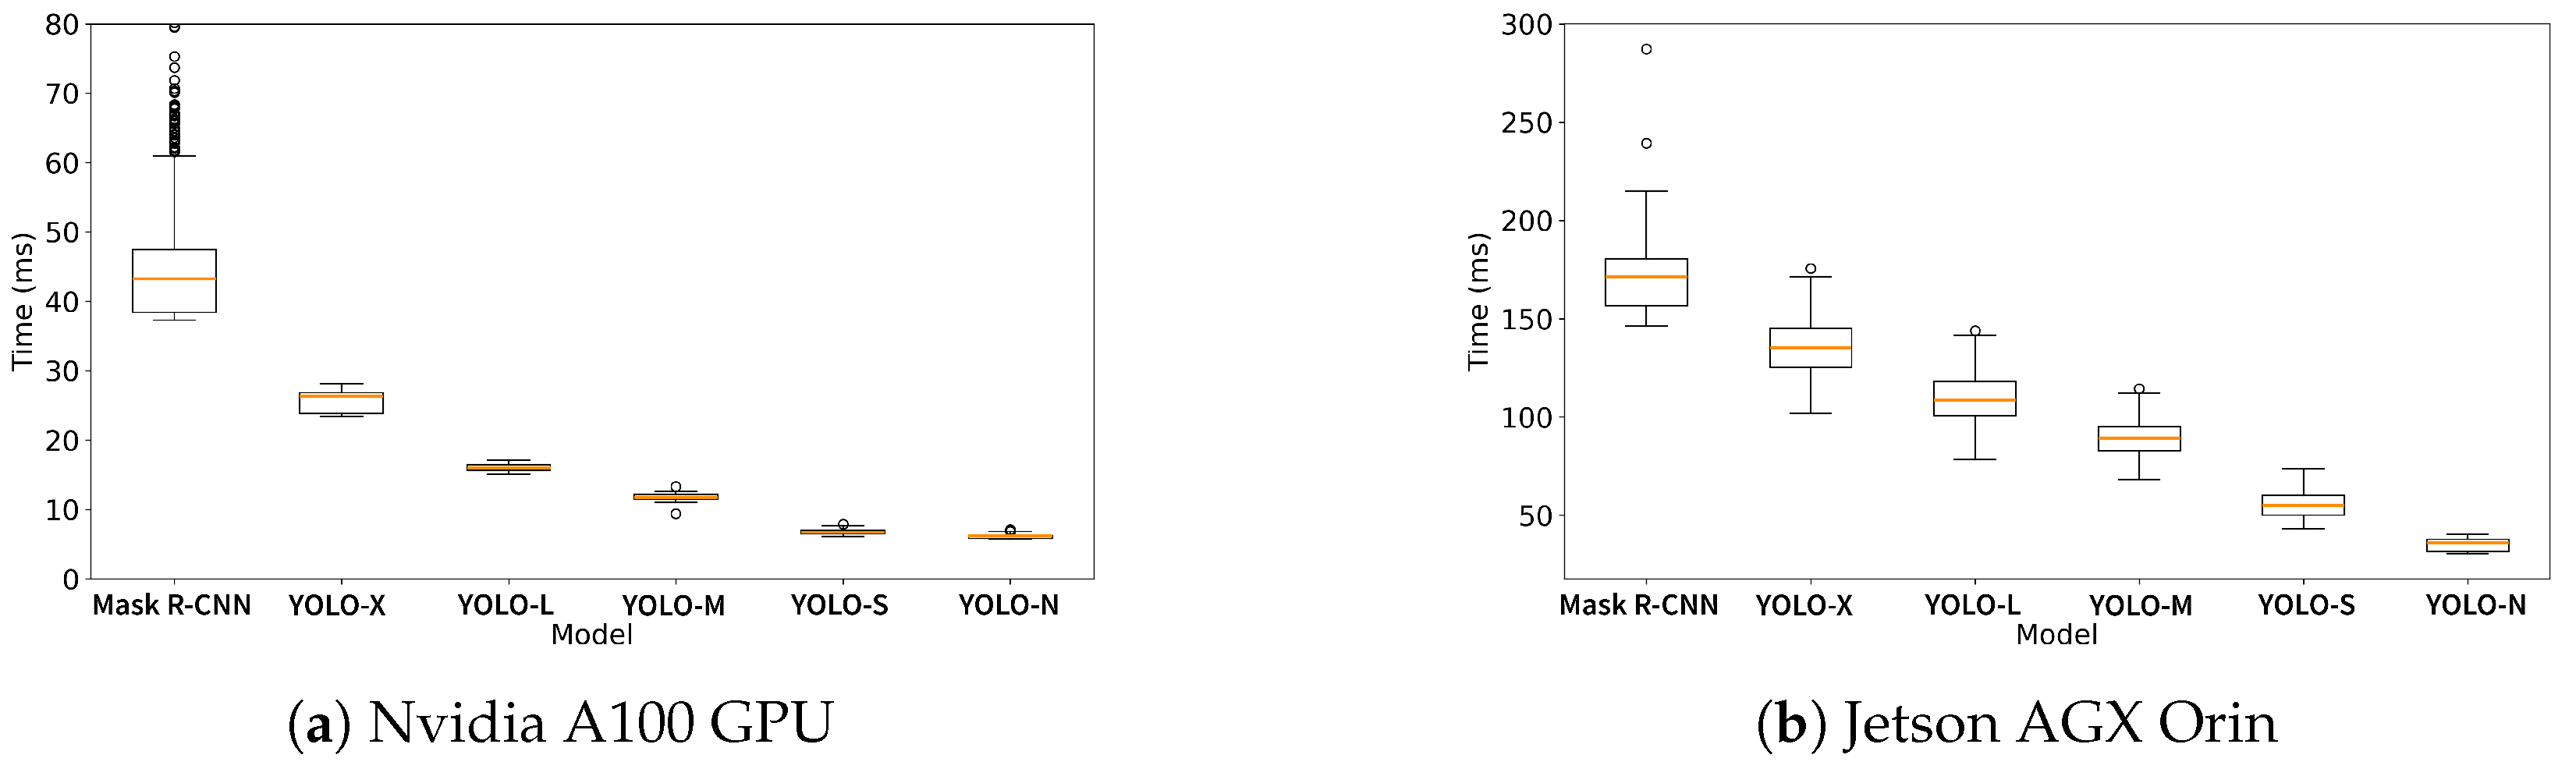
To guarantee the statistical reliability of the results, a 10-fold cross-validation scheme was employed. The 10-fold results are illustrated using box plots, which facilitate the visual evaluation of the segmentation performance for each experiment.
All training experiments were run on a dedicated machine with Ubuntu 20.04 operating system, 2 Intel Xeon Silver 4310 CPU, 512 GB RAM (Intel, Santa Clara, CA, USA), and four Nvidia A100 PCIe 40 GB (Nvidia, Santa Clara, CA, USA).
3.3. Metrics
COCOEvaluator [
26] was employed to compute segmentation metrics. We considered Precision (P), Recall (R), mean Average Precision (mAP), and Average Precision (AP) by category to measure the system performance.
Precision, as illustrated by Equation (
1), is the fraction of relevant objects among the ones that were predicted. Recall, as given by Equation (
2), is the fraction of relevant objects that were predicted. Precision is crucial when the cost of false positives is high and Recall is vital when the cost of false negatives is high.
Finally, the area under the precision–recall curve (AP) can be used as a single metric to summarize the performance of the object segmentation model. The rate of TP, FP, and FN, and hence, the values of P, R, and AP, depend on the Intersection over the Union (IoU) which establishes when a detected object overlaps sufficiently with a real object. Thus, the AP50 measures the AP of the model by setting the IoU threshold at 0.5. In a multi-class object detection or segmentation task, the mAP is used, where individual AP is averaged over all classes.
The detection of the initial part of the shoots will be used to calculate the cut-off points at a later stage. These cut-off points are valid as long as they are at any position between the second and third buds. Hence, we use an IoU value of 0.5 which provides a good tradeoff between localization accuracy and robustness to small variations [
27]. This ensures reliable detection of shoot segments for automated pruning.


 ,
, 


