
Analysis of Irrigation, Crop Growth and Physiological Information in Substrate Cultivation Using an Intelligent Weighing System

Abstract
1. Introduction
2. Materials and Methods
2.1. Weighing System
2.2. Parameter Analysis Using the Weighing System
2.2.1. Data Acquisition and Processing for Noise Reduction
2.2.2. Analysis of Irrigation Start -Stop Times and Number of Irrigations
2.2.3. Analysis of Irrigation Volume, Drainage Volume and Drainage Rate
2.2.4. Analysis of Physiological Indicators of the Plant (Transpiration, Transpiration Rate, and Stomatal Conductance)
2.2.5. Analysis of Changes in Plant Weight
2.3. Substrate Cultivation and Management of the Tomatoes
2.4. Measurement and Calculation of Indicators
2.5. Evaluation of Indicators
2.6. Data Analysis
3. Results
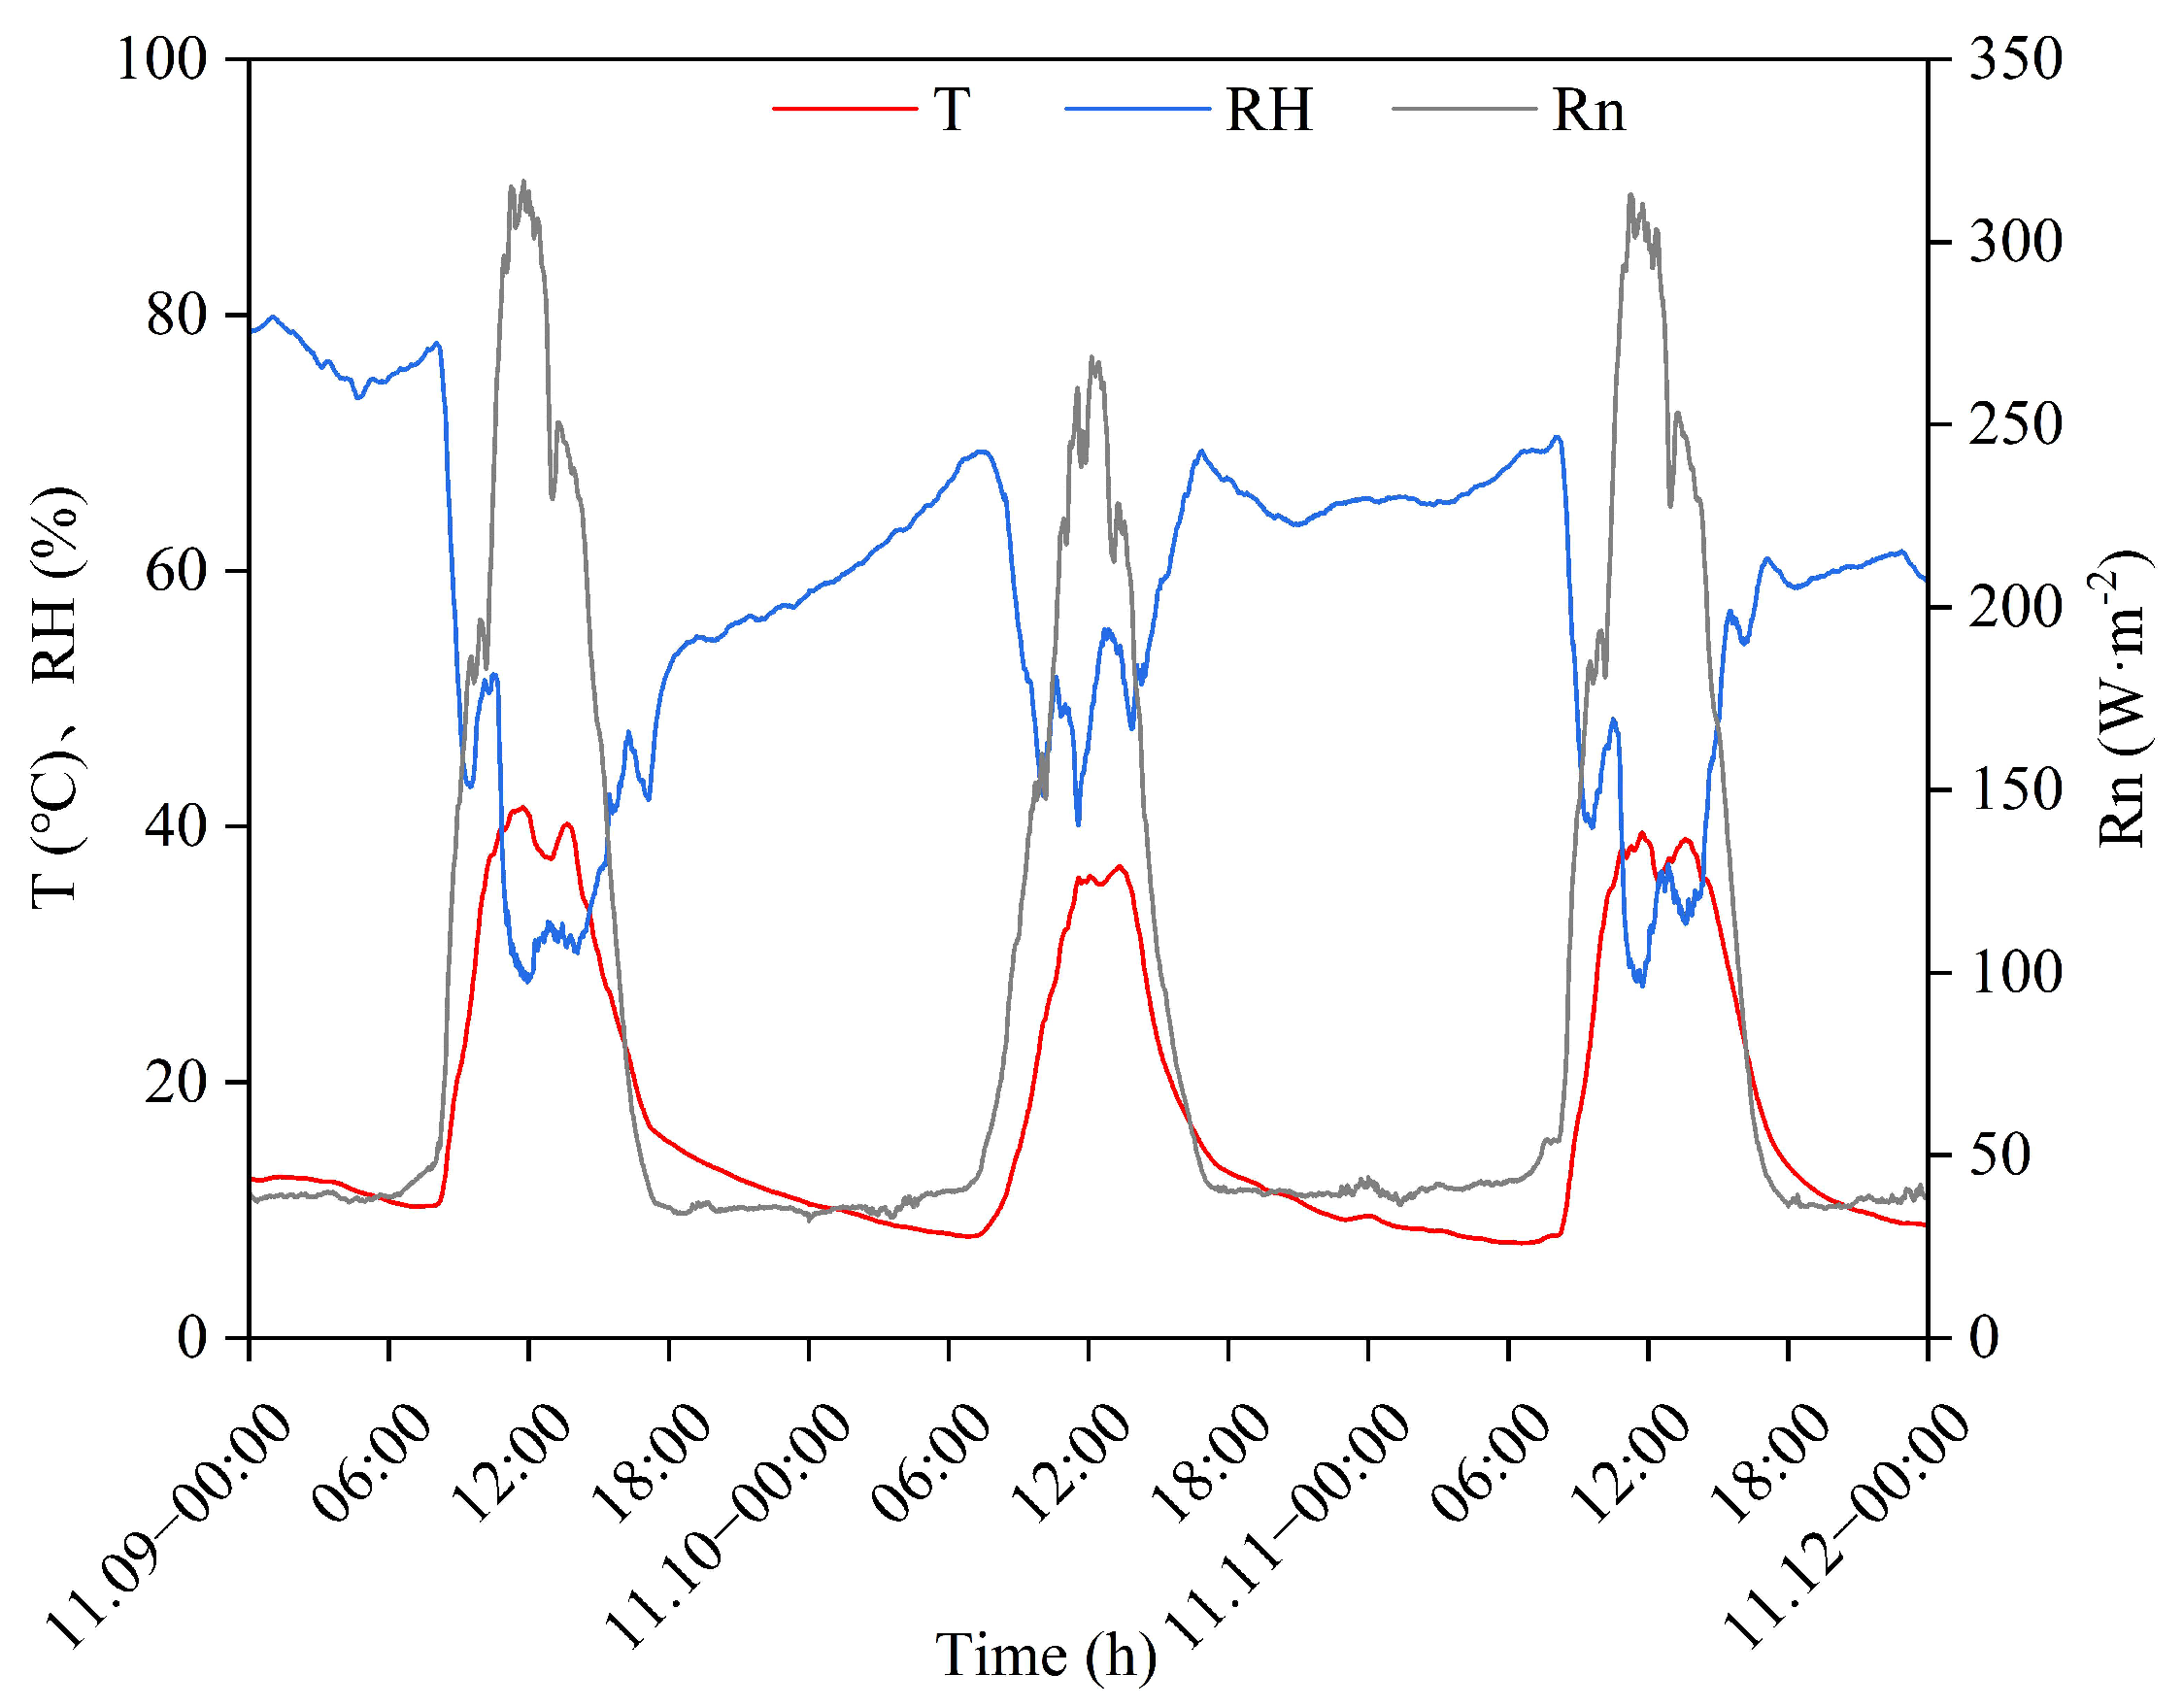
3.1. Meteorology
3.2. Analysis of Irrigation Information
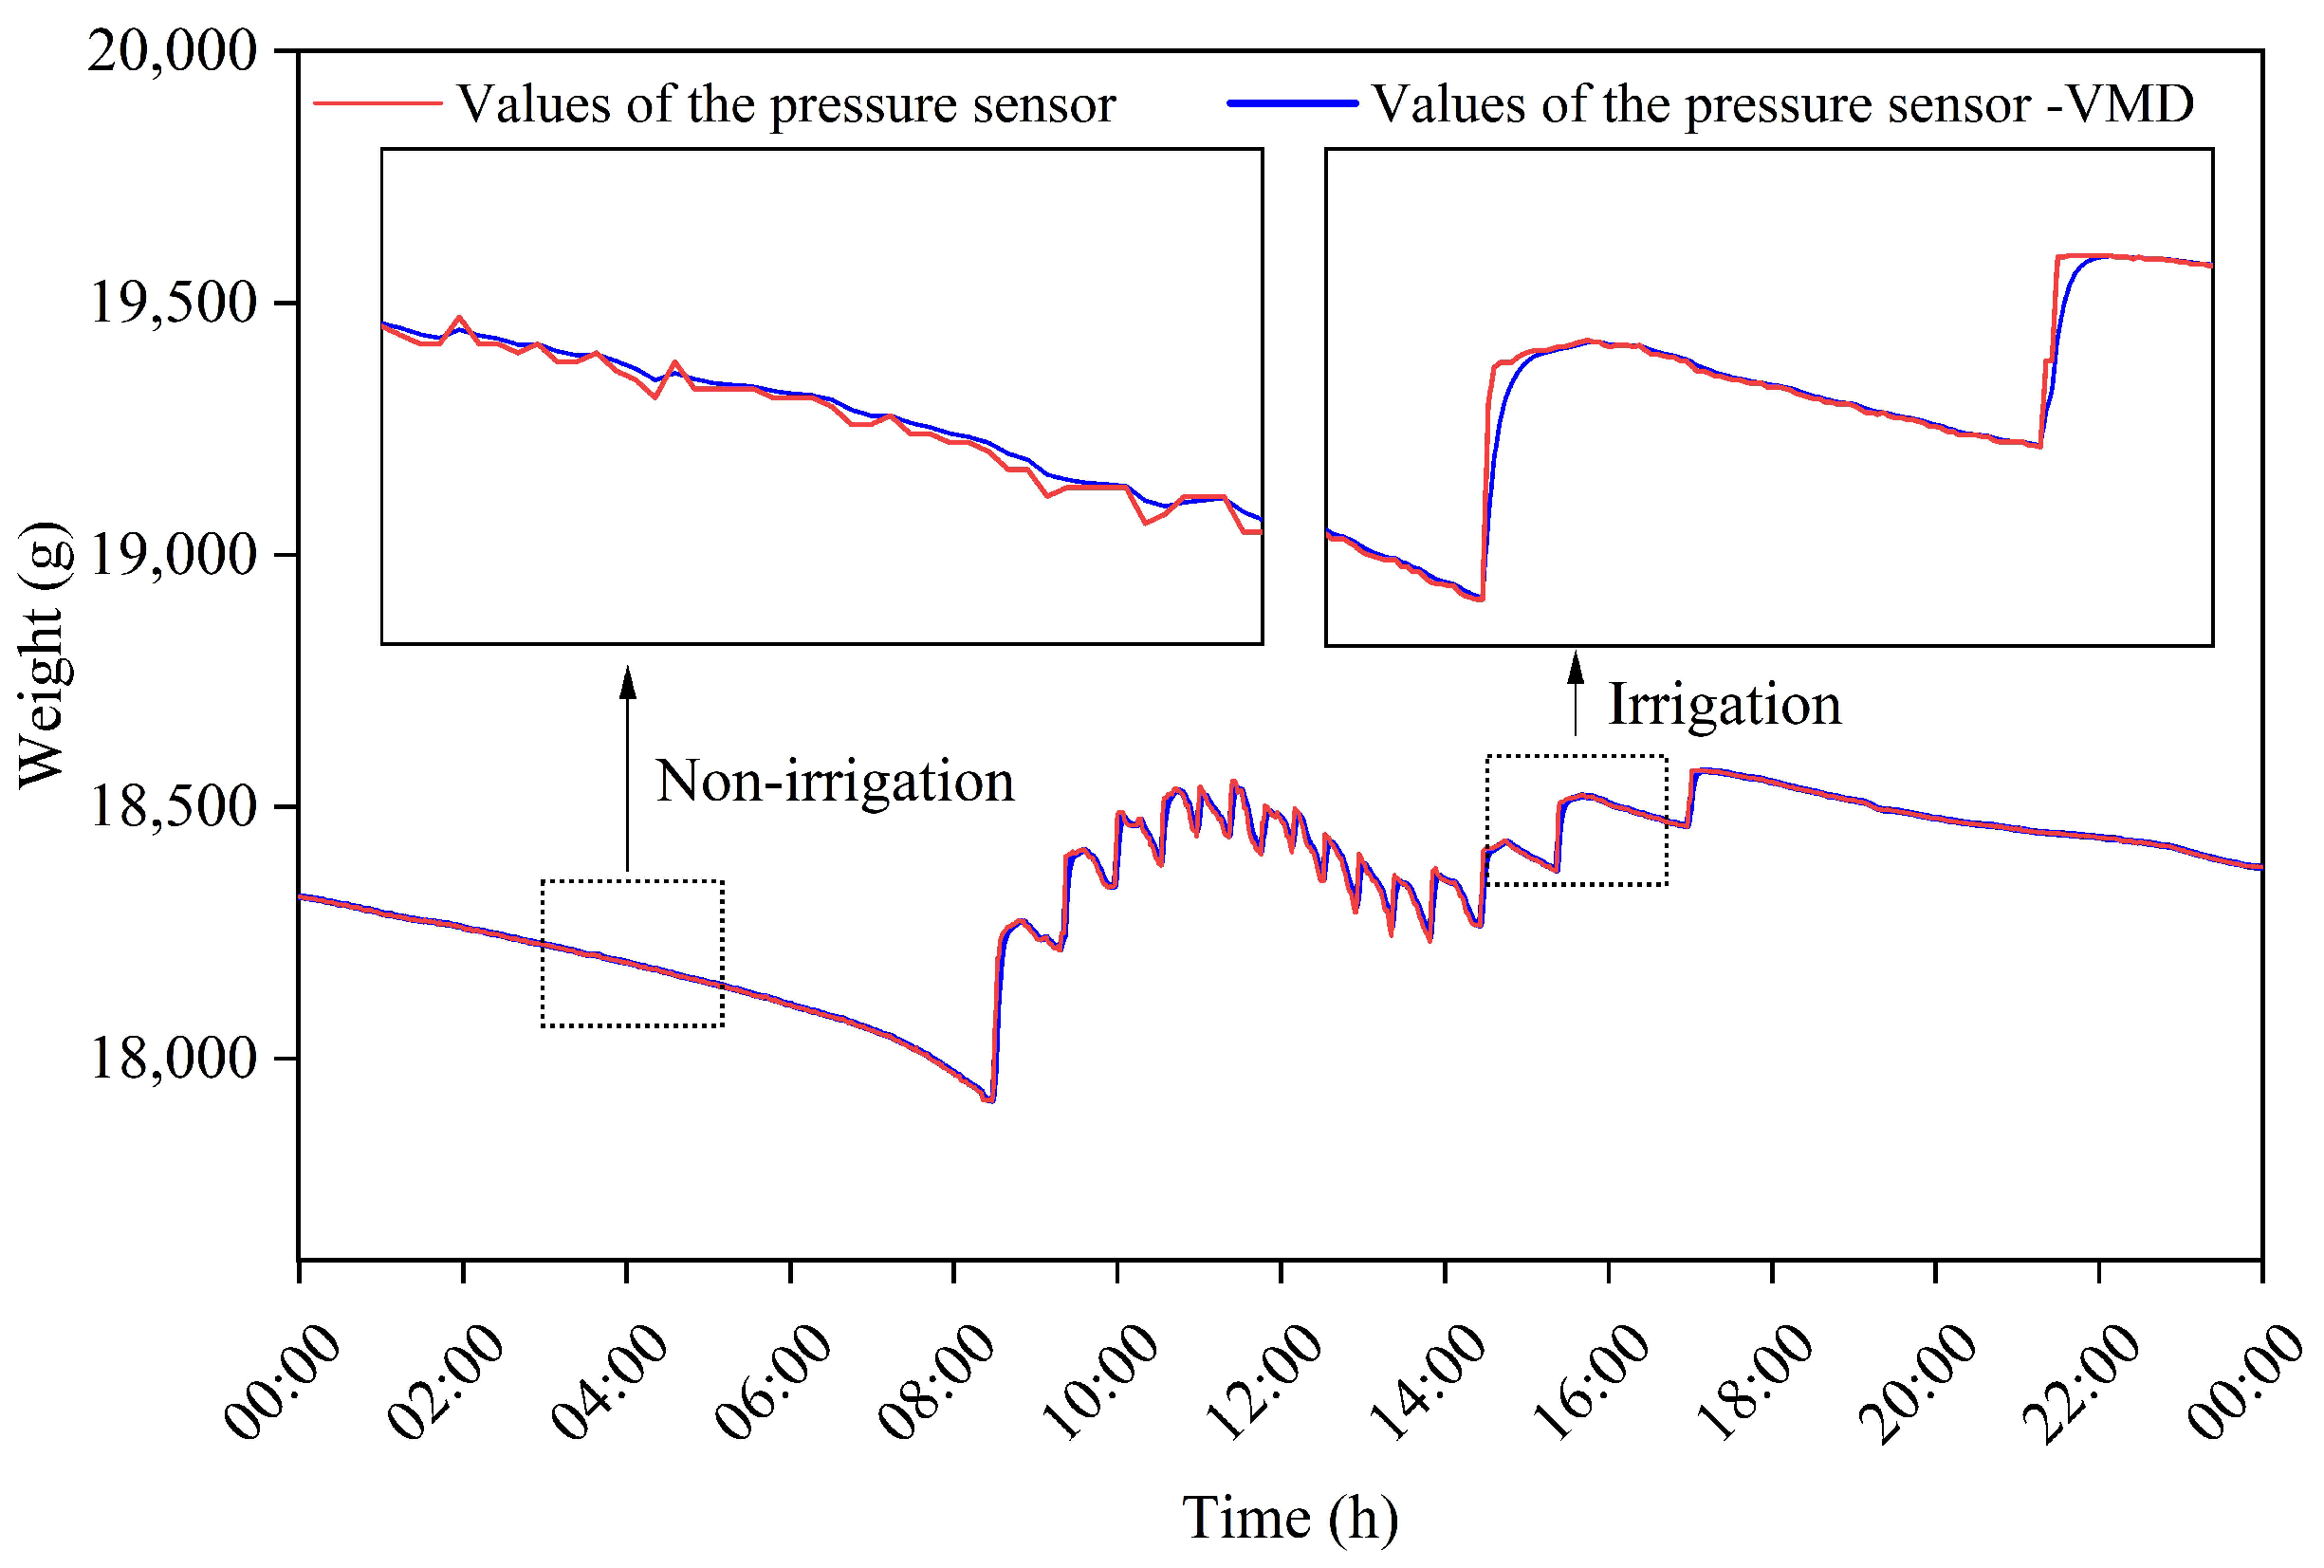
3.2.1. Processing for Noise Reduction
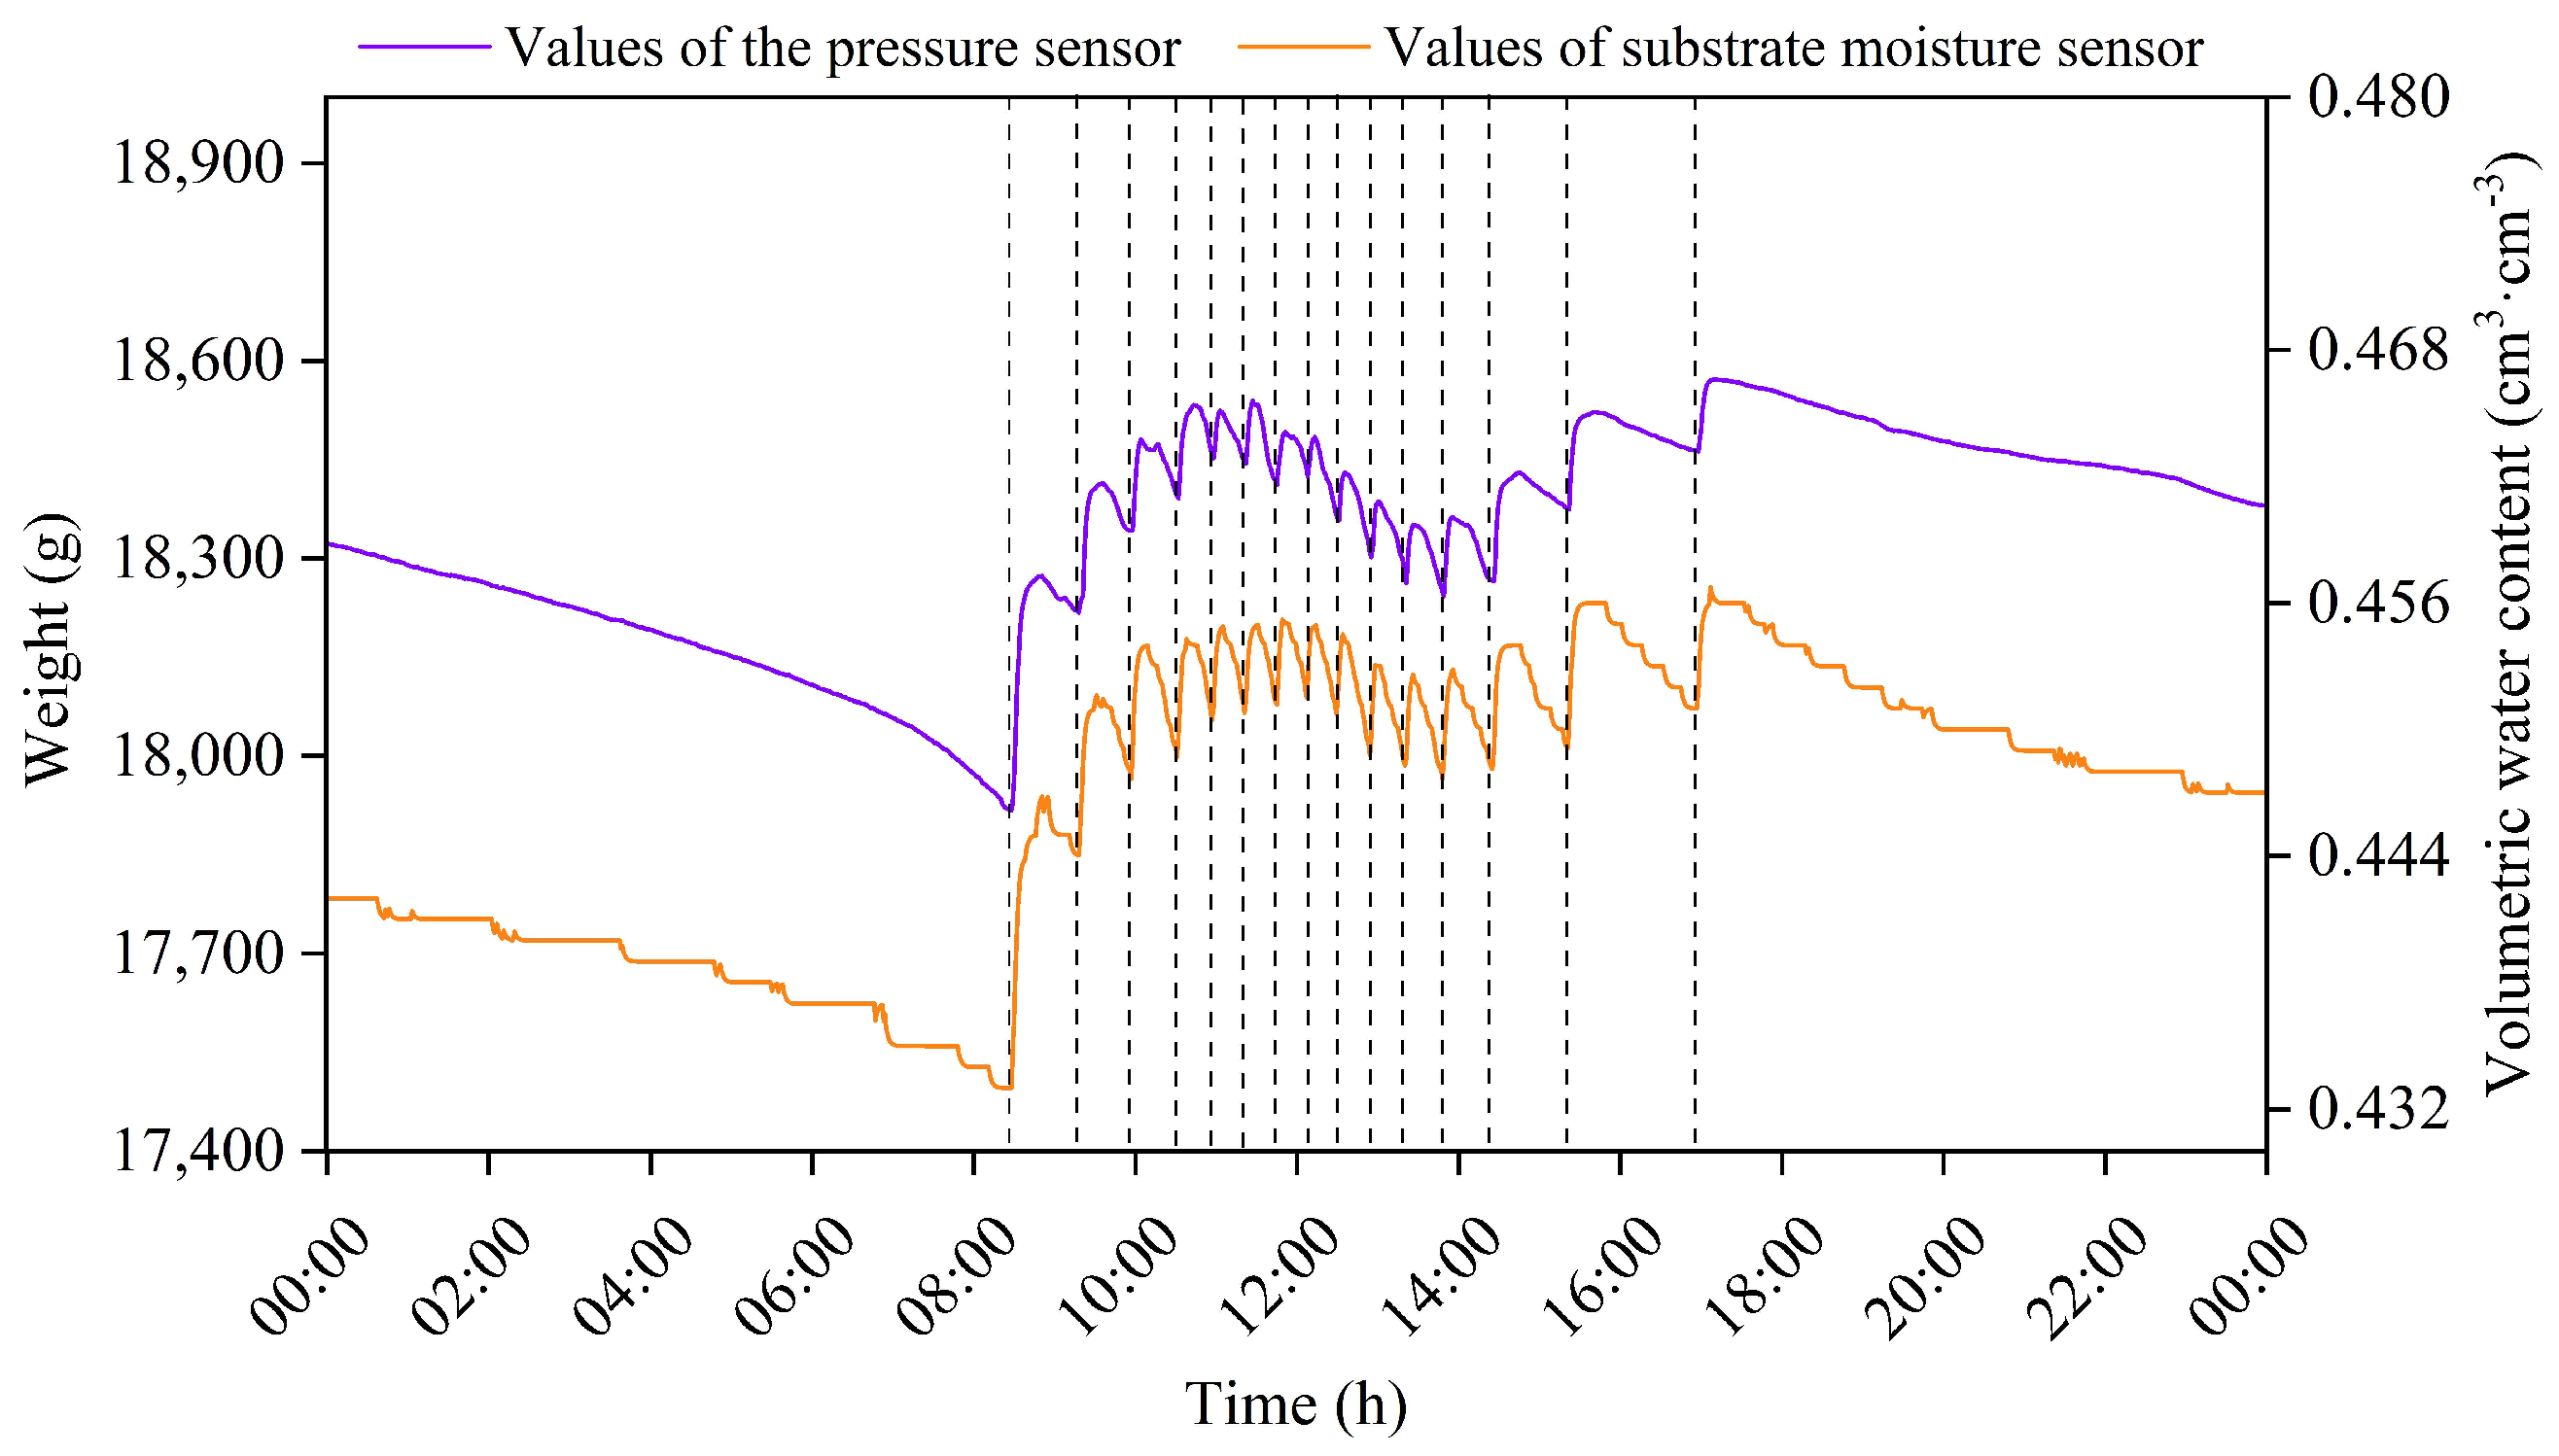
3.2.2. Irrigation Scheduling Parameters: Timing and Frequency
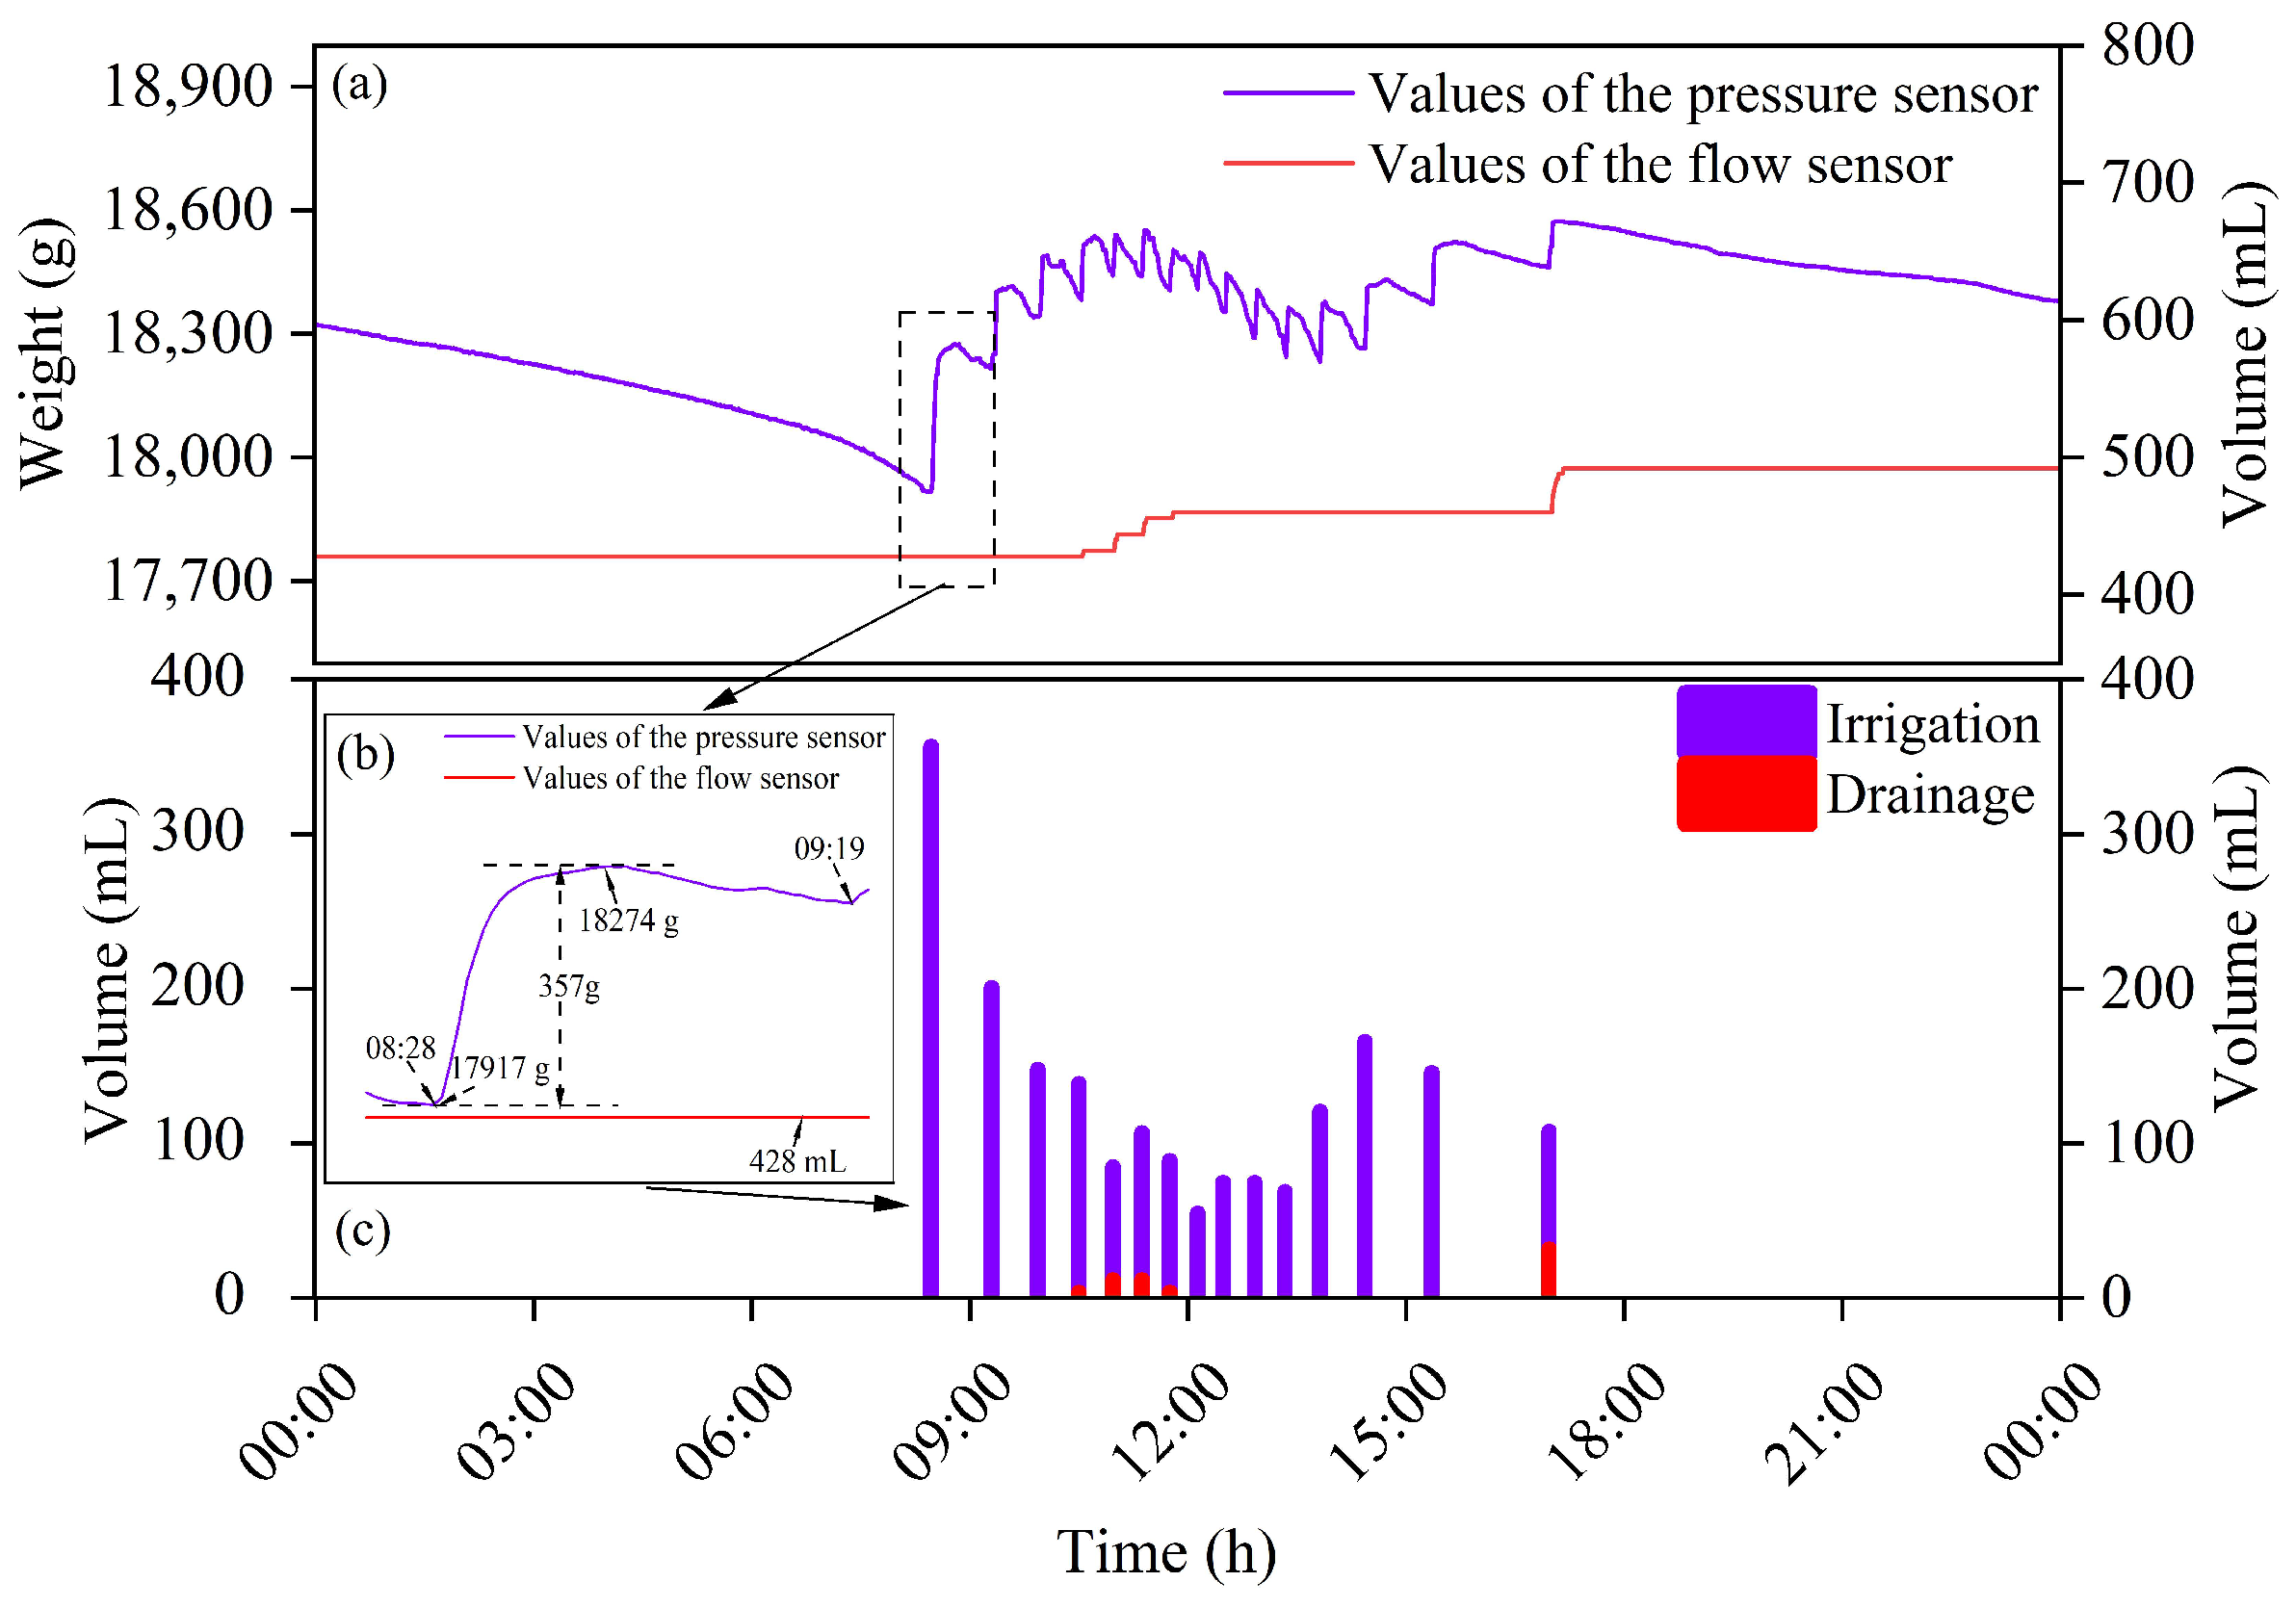
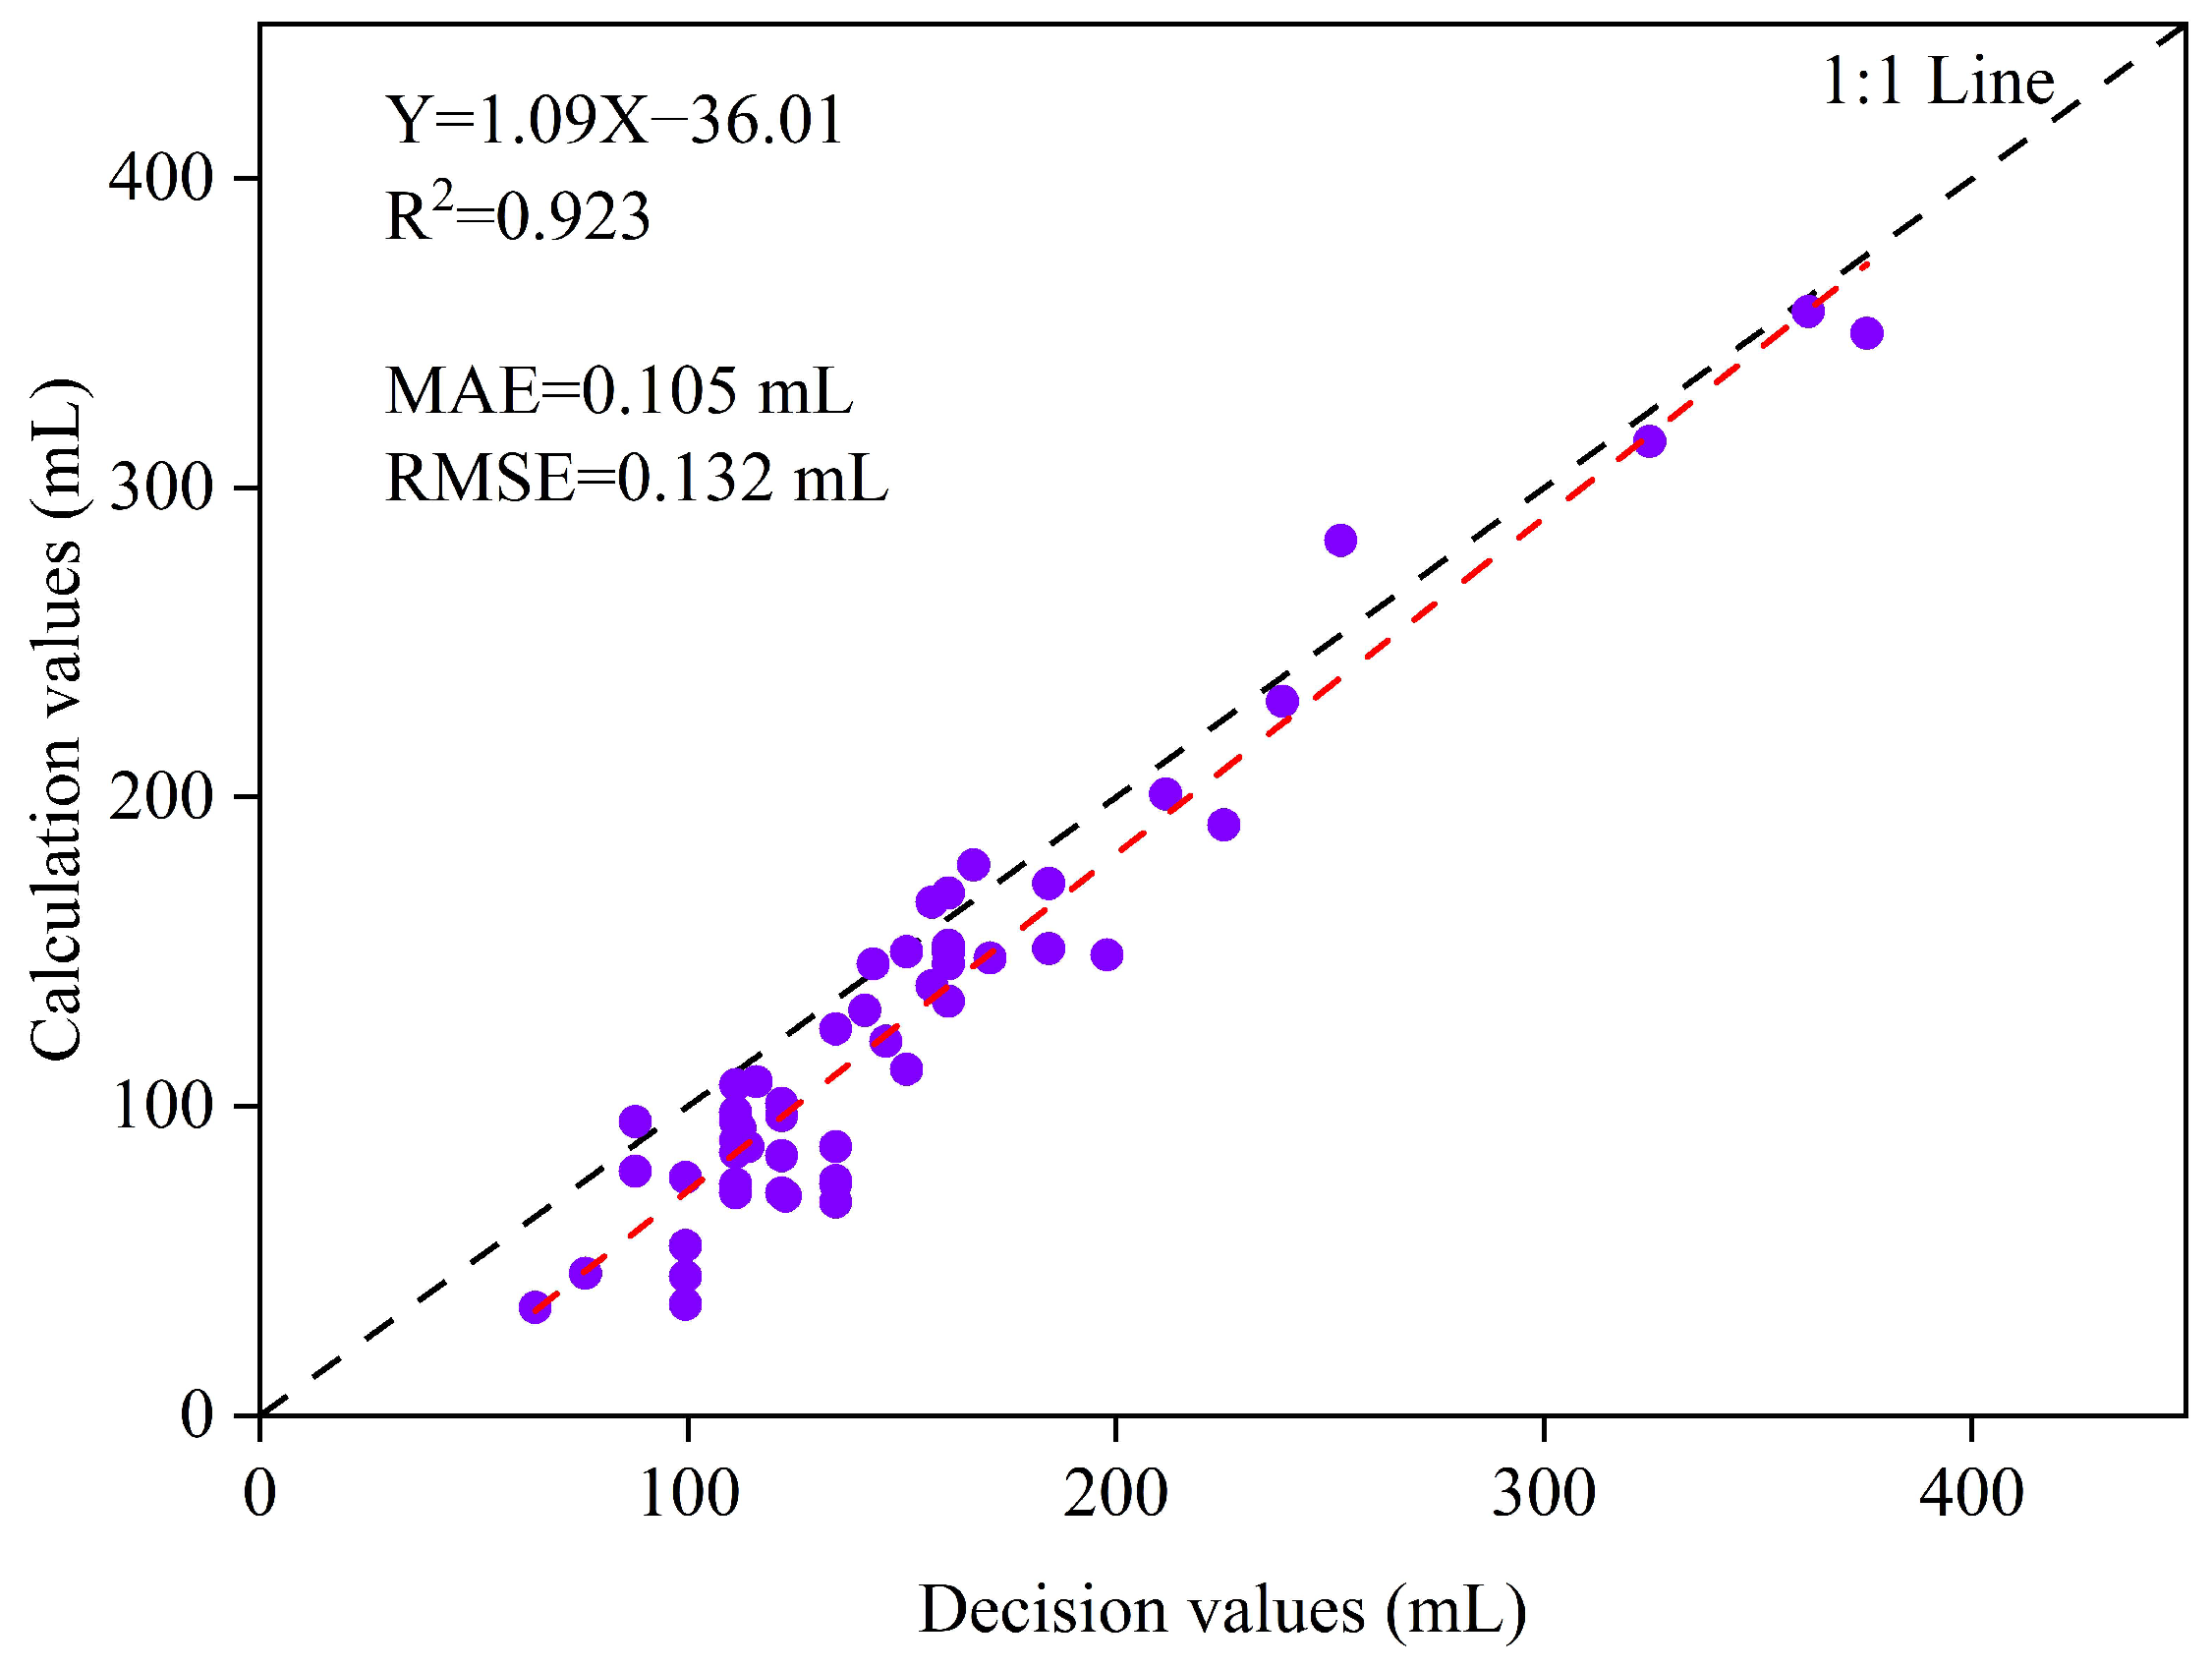
3.2.3. Irrigation Water Fluxes: Irrigation Volumes and Drainage Characteristics
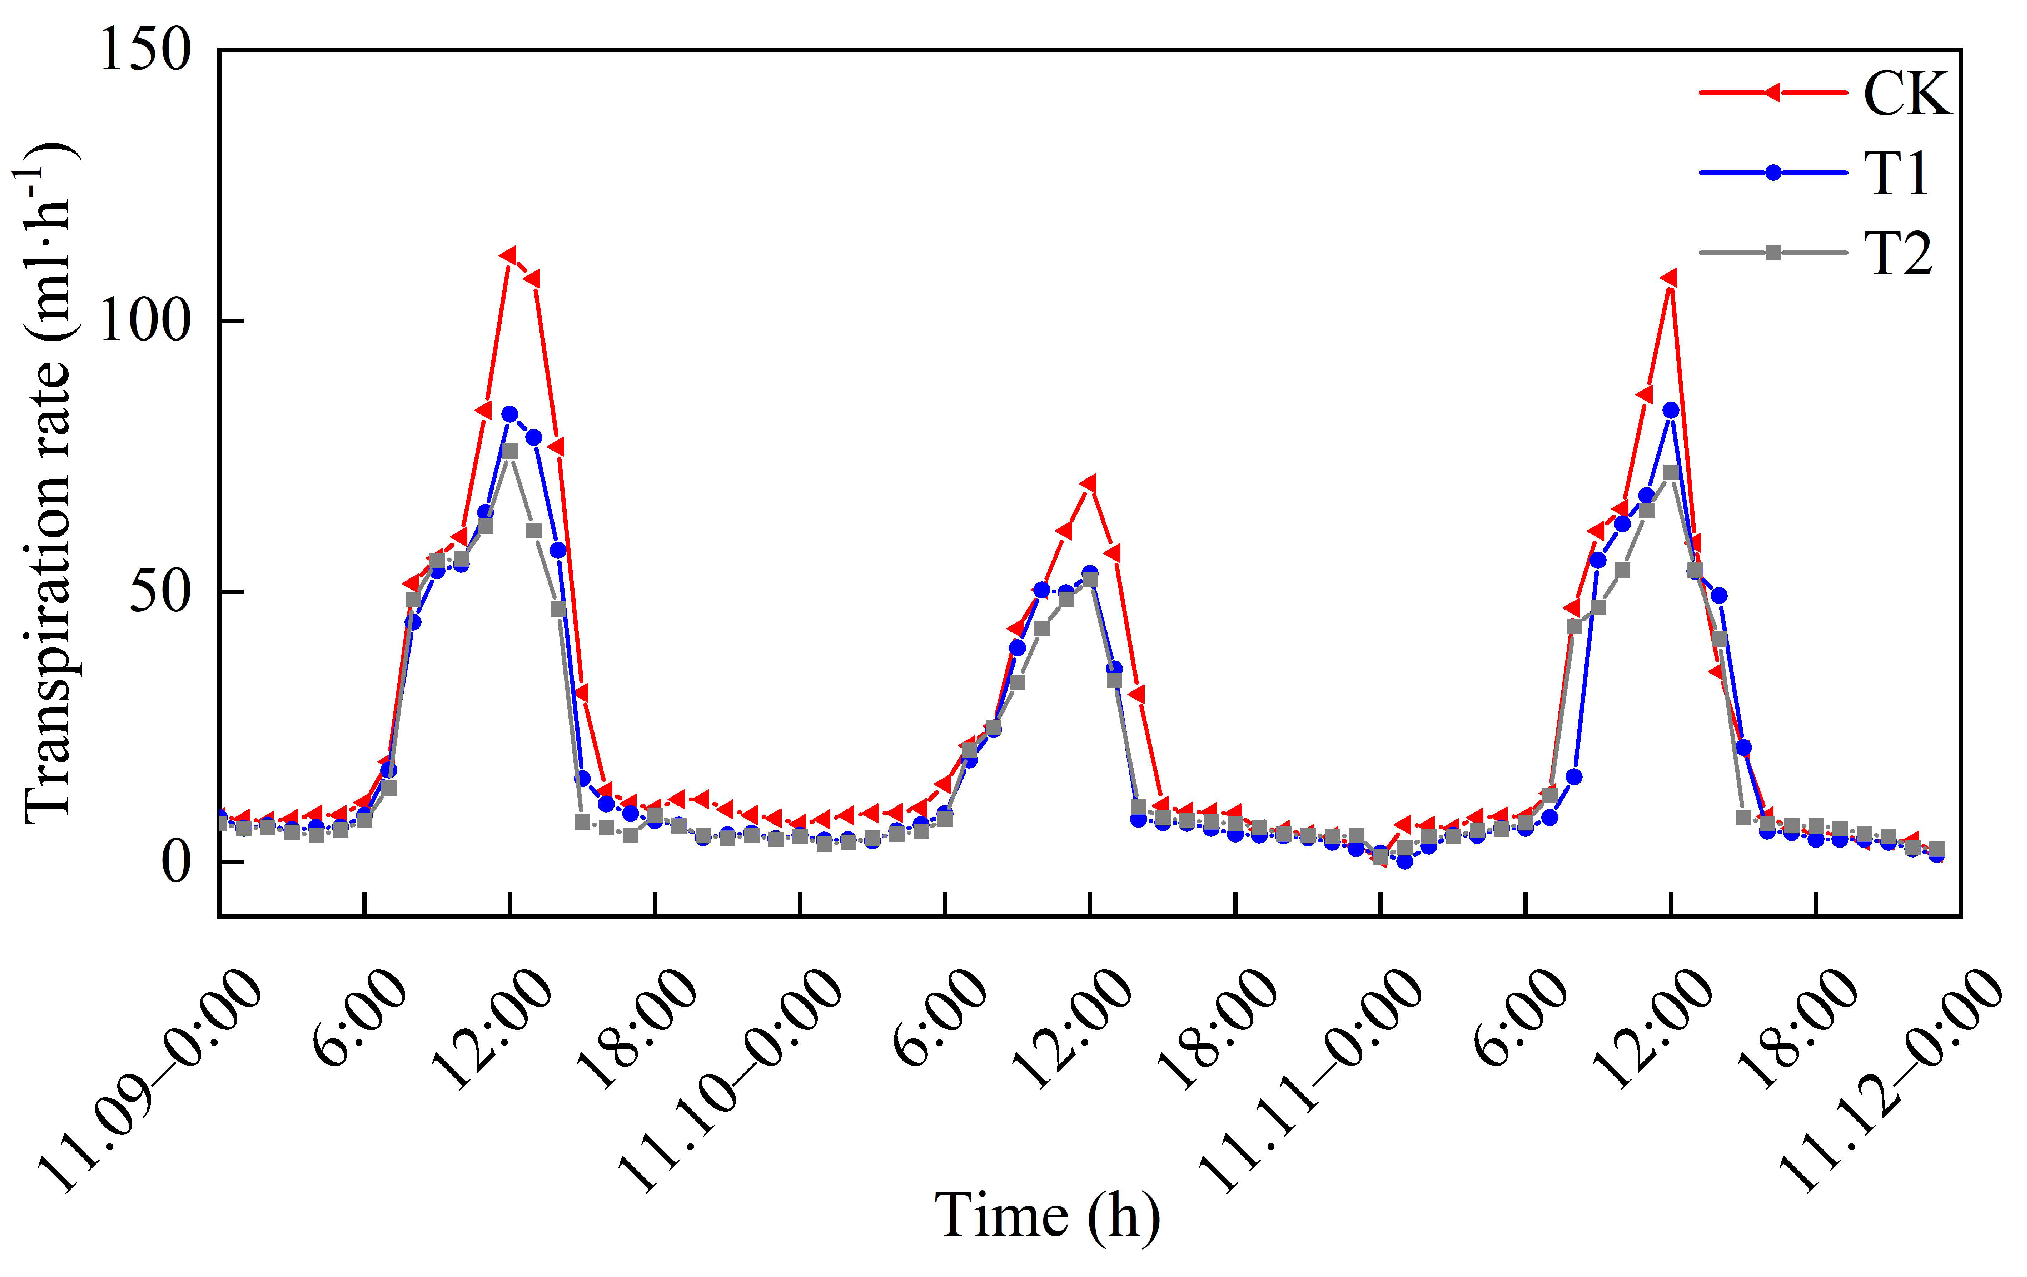
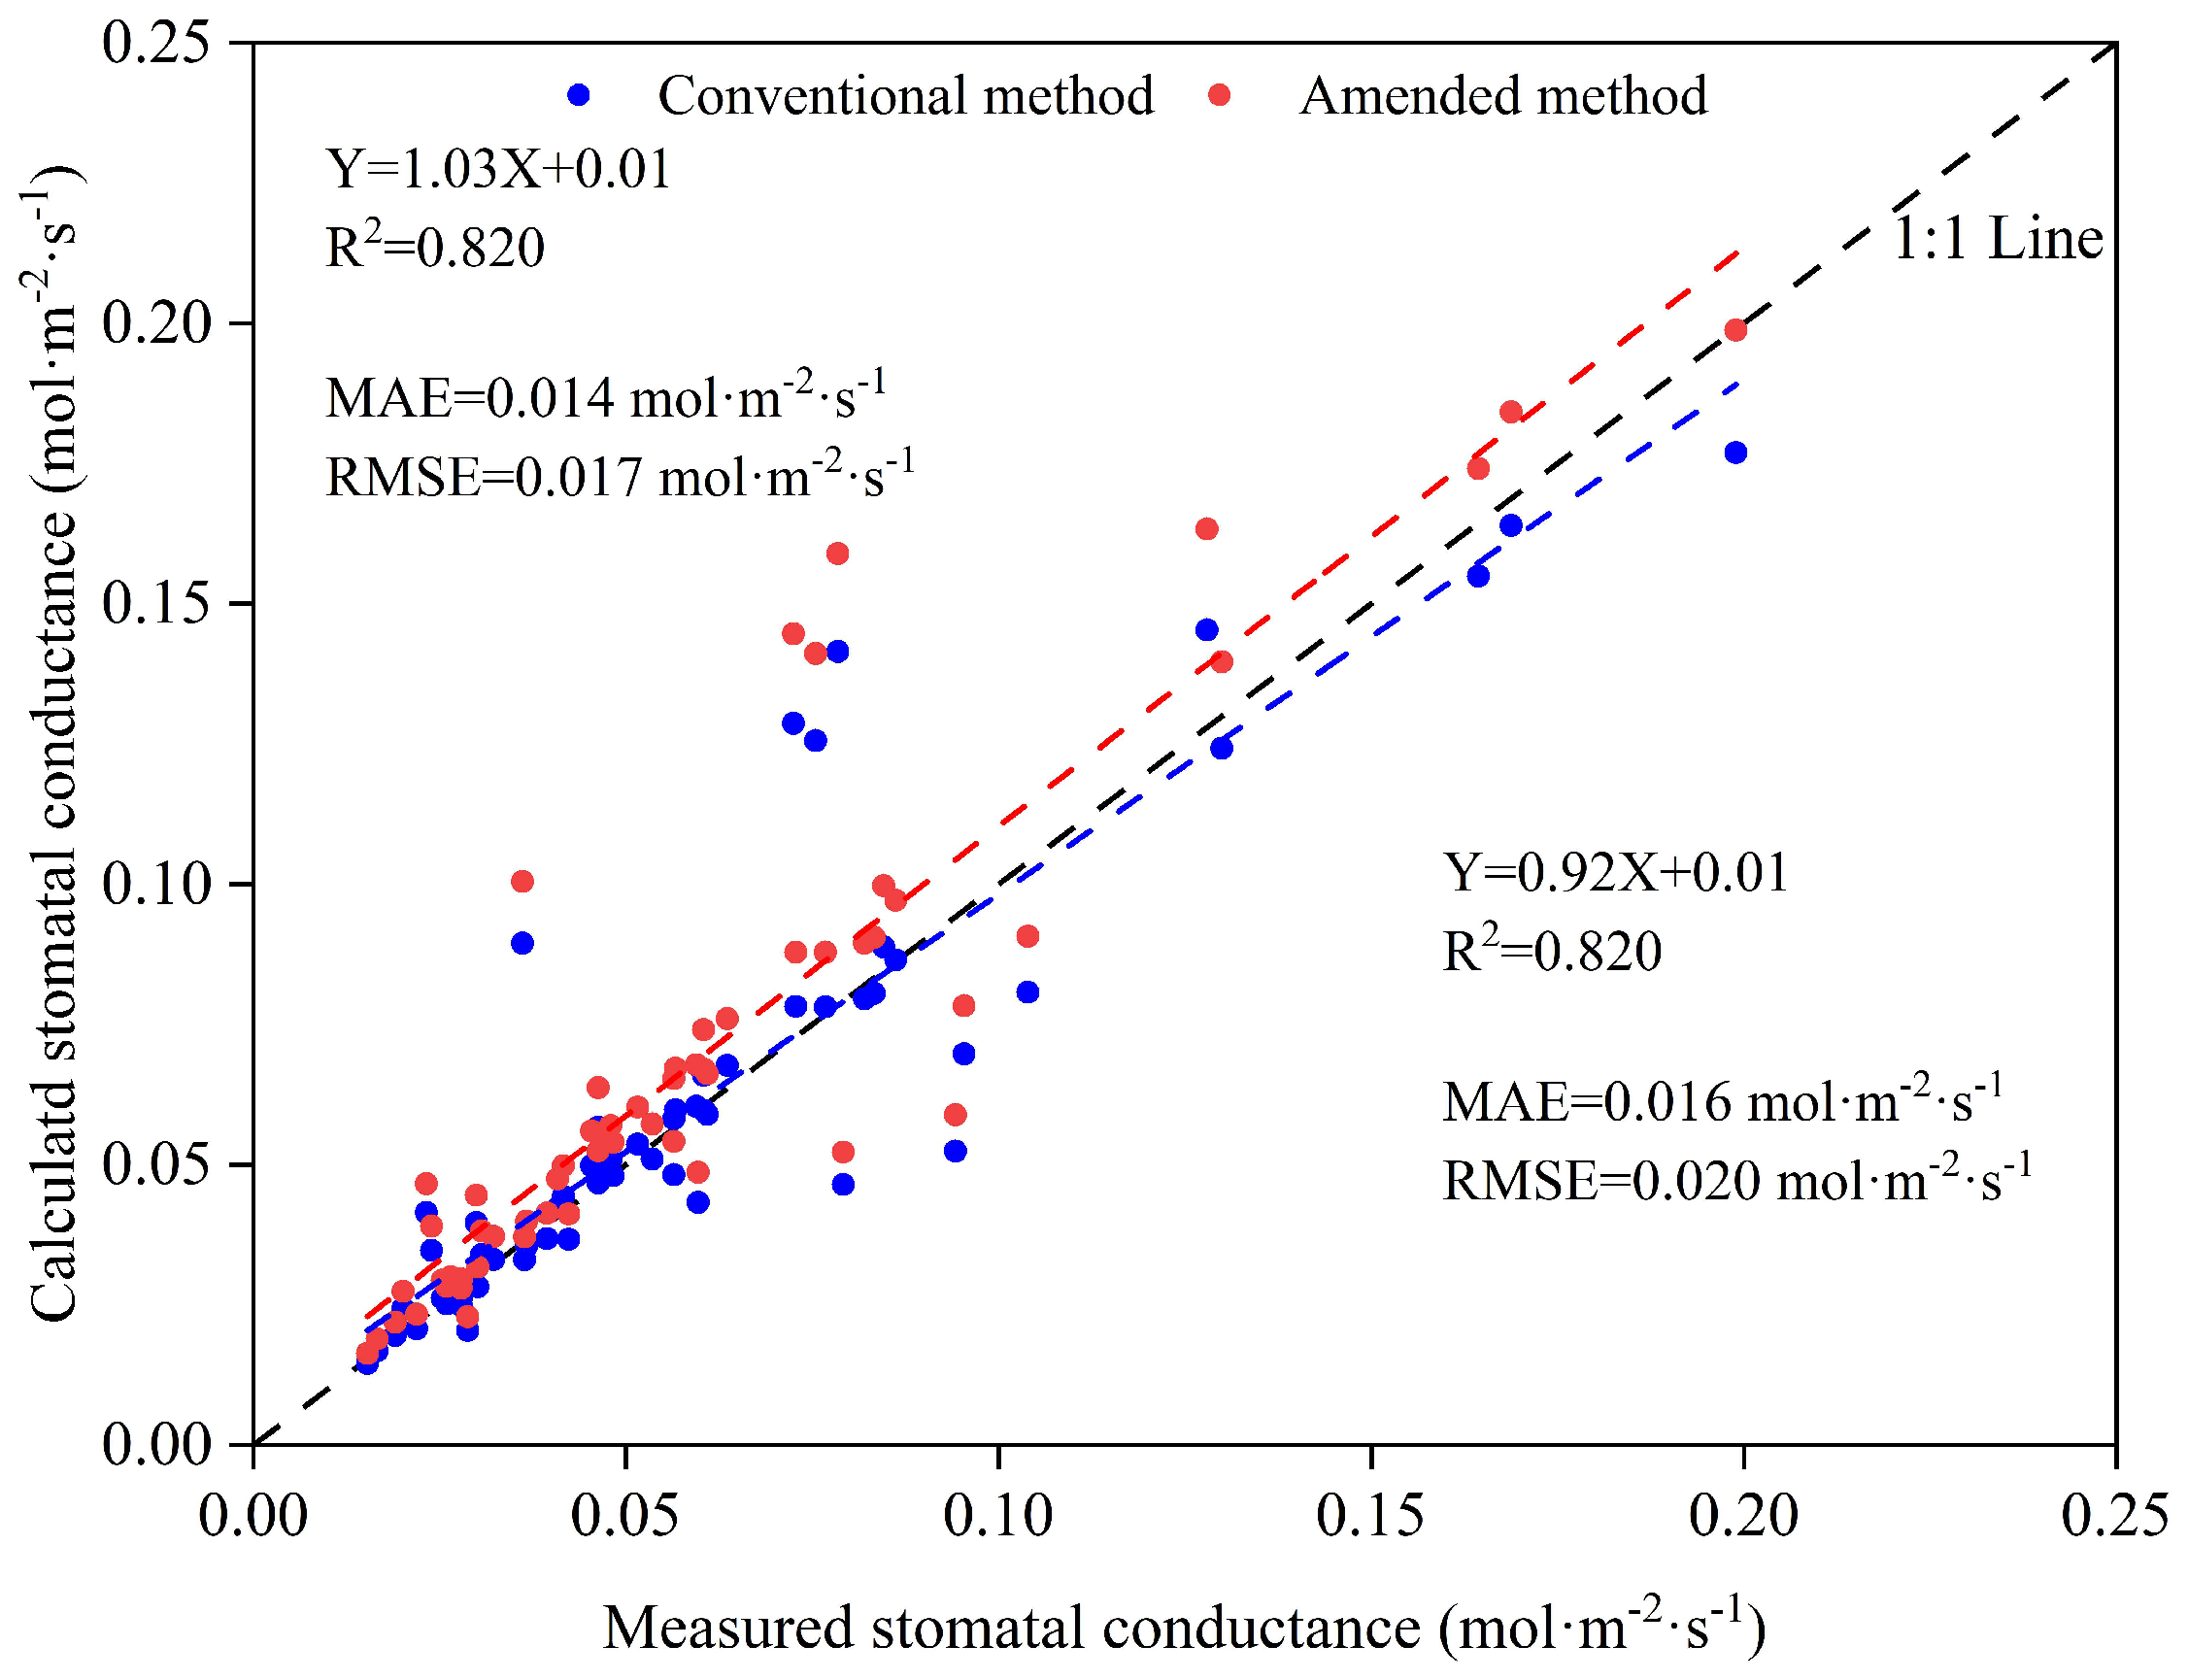
3.3. Plant Physiological Characteristics: Transpiration Rate and Stomatal Conductance of the Leaves
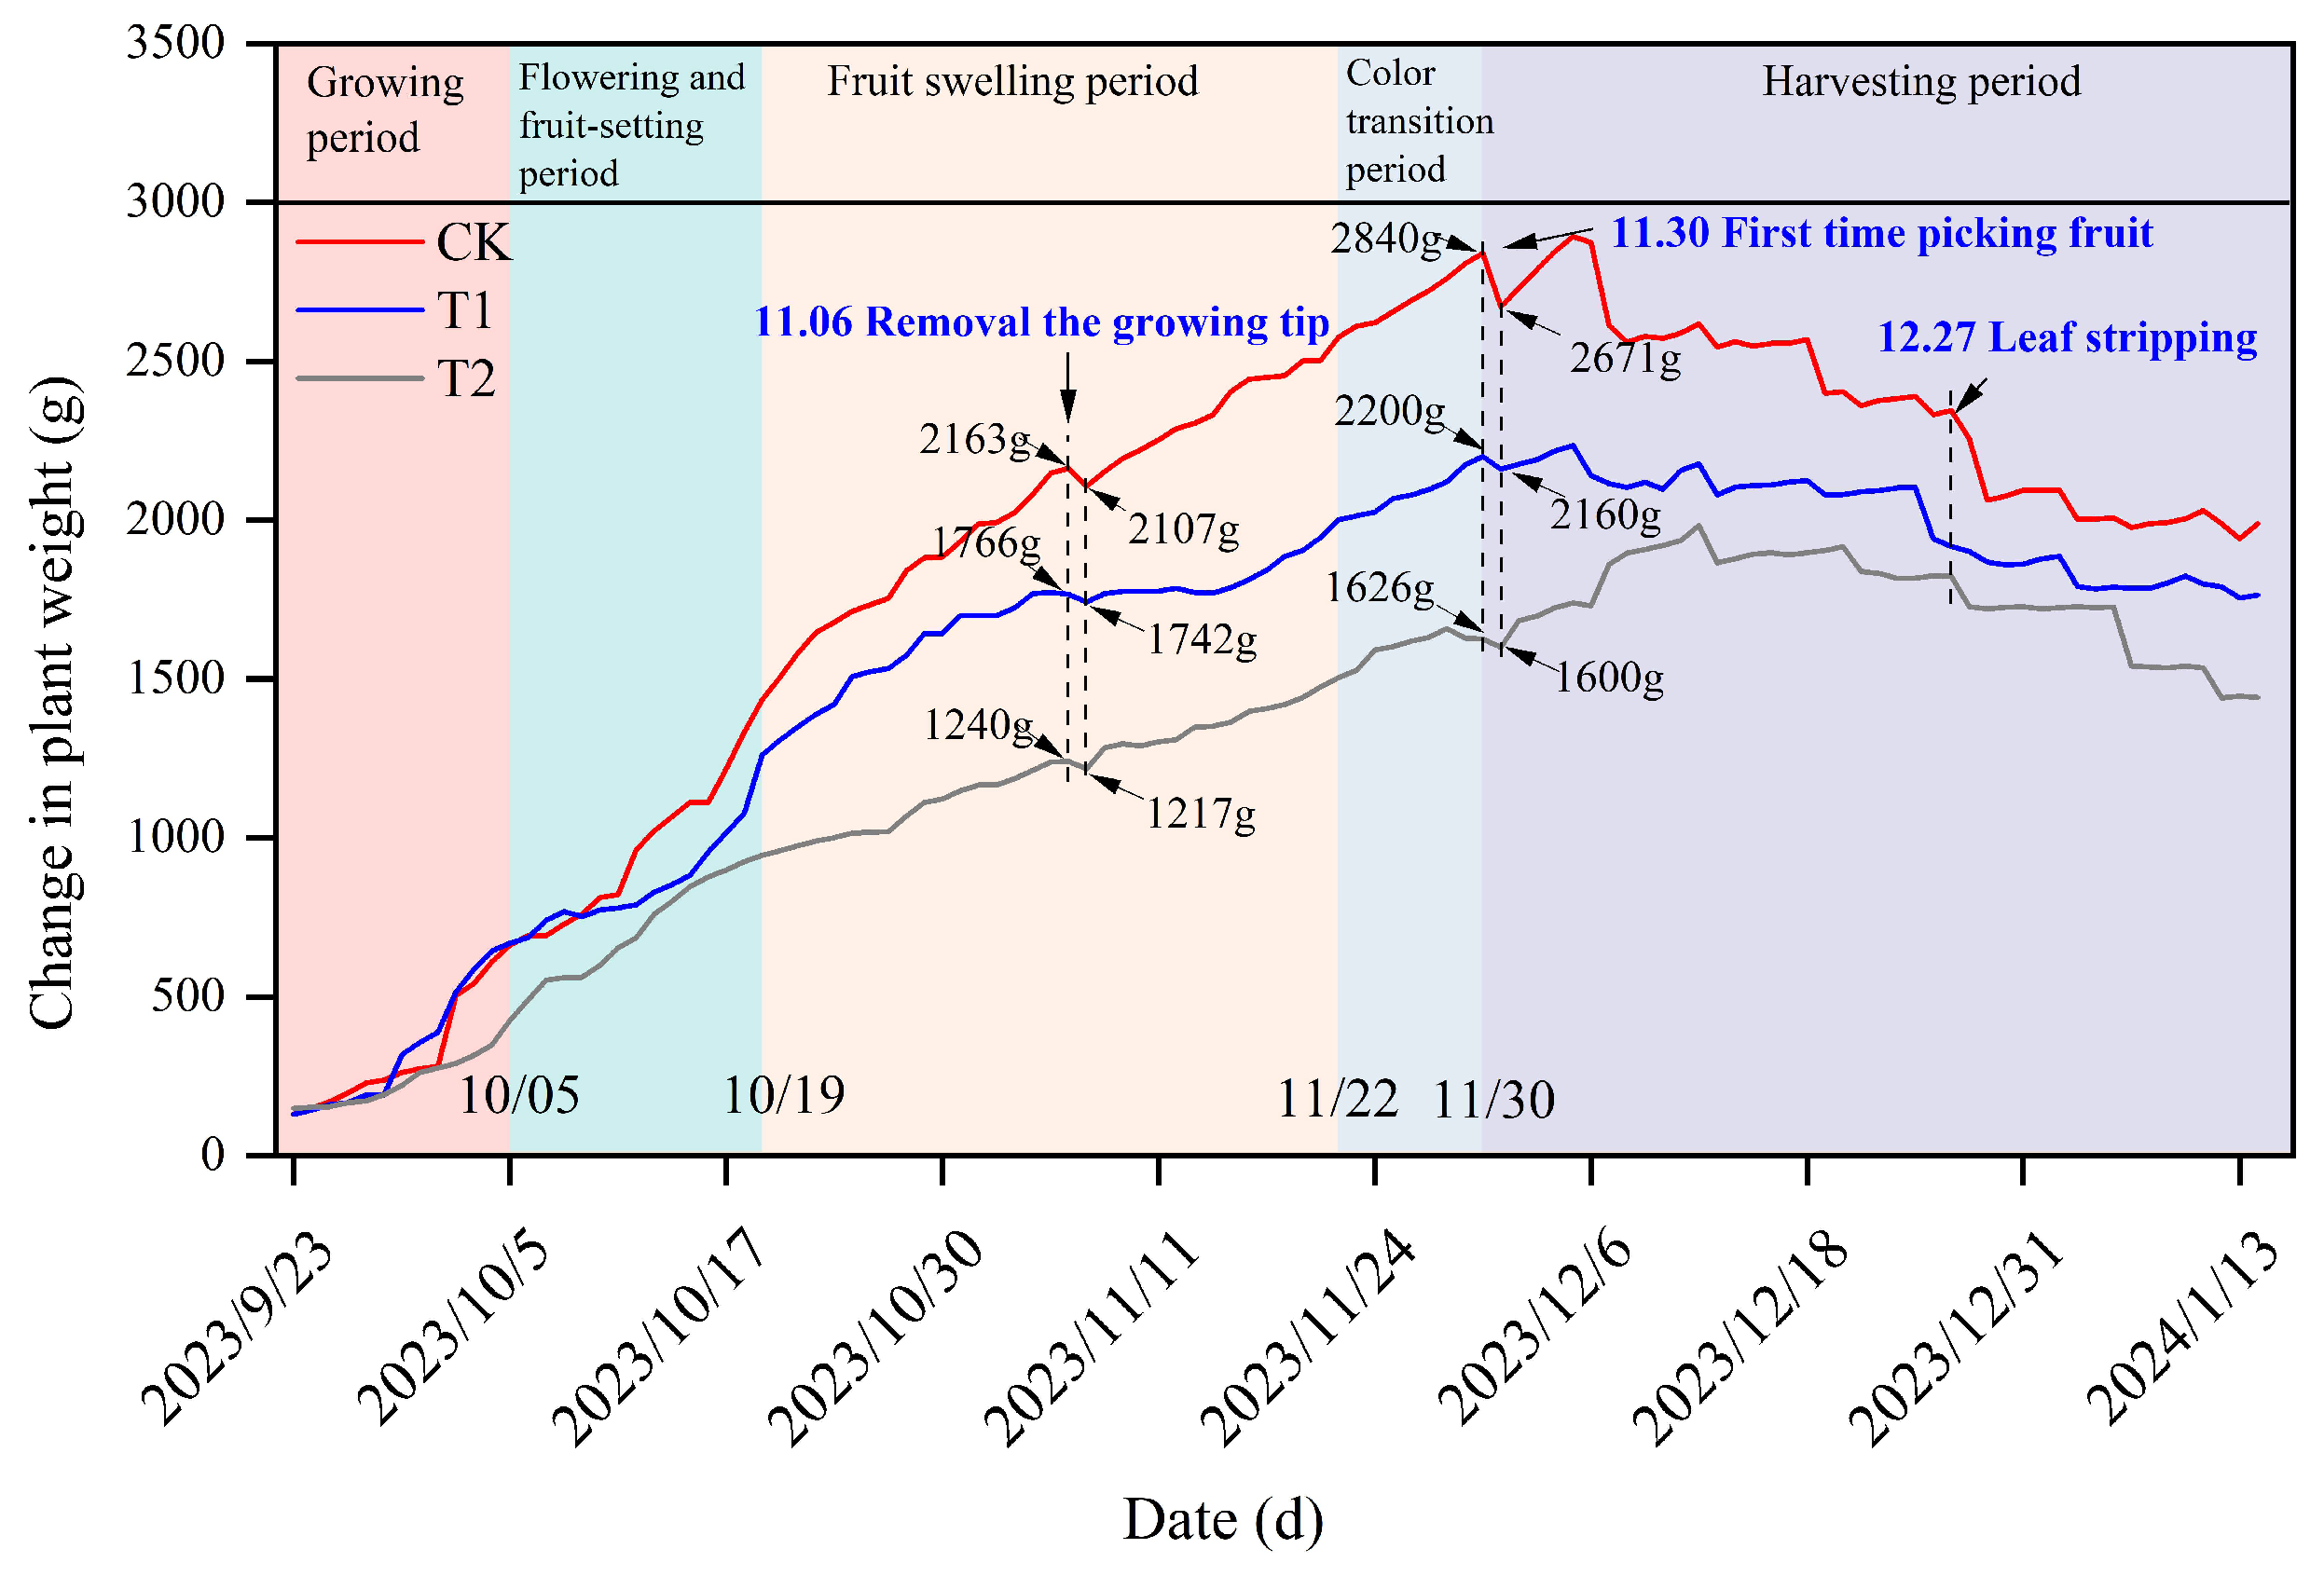
3.4. Change in Plant Weight
4. Discussion
4.1. Effect on Irrigation Data Processing Accuracy of Noise Reduction
4.2. Analysis of Plant Physiological and Ecological Information
4.3. Analysis of Growth Information
5. Conclusions
Author Contributions
Funding
Institutional Review Board Statement
Informed Consent Statement
Data Availability Statement
Conflicts of Interest
References
- Wang, Y.; Xu, J.; Pan, Y.; Zhao, D.; Yang, D.; Ju, S.; Min, J.; Shi, W. Effects of Fertigation on Nitrogen Use Efficiency and Ammonia Volatilization in Greenhouse Tomato Cultivation in Lower Reaches of the Yangtze River. J. Soil Sci. 2022, 59, 776–785. [Google Scholar]
- Nikolov, V.N.; Atanasov, Z.A.; Evstatiev, I.B.; Vladut, N.V.; Biris, S.S. Design of a Small-Scale Hydroponic System for Indoor Farming of Leafy Vegetables. Agriculture 2023, 13, 1191. [Google Scholar] [CrossRef]
- Zha, L.; Wang, Z.; Huang, C.; Duan, Y.; Tian, Y.; Wang, H.; Zhang, J. Comparative Analysis of Leaf Vegetable Productivity, Quality, and Profitability among Different Cultivation Modes: A Case Study. Agronomy 2023, 14, 76. [Google Scholar] [CrossRef]
- Zheng, Z.; Zhou, W.; Yang, Q.; Jiang, J.; Miao, M. Effect of Furrow Straw Mulching and Straw Decomposer Application on Celery (Apium graveolens L.) Production and Soil Improvement. Agronomy 2023, 13, 2774. [Google Scholar] [CrossRef]
- Van Delden, S.H.; SharathKumar, M.; Butturini, M.; Graamans, L.J.A.; Heuvelink, E.; Kacira, M.; Klamer, R.S.; Klerkx, L.; Kootstra, G.; Loeber, A.; et al. Current status and future challenges in implementing and upscaling vertical farming systems. Nat. Food 2021, 2, 944–956. [Google Scholar] [CrossRef]
- Ali, A.; Niu, G.; Masabni, J.; Ferrante, A.; Cocetta, G. Integrated Nutrient Management of Fruits, Vegetables and Crops through the Use of Biostimulants, Soilless Cultivation, and Traditional and Modern Approaches—A Mini Review. Agriculture 2024, 14, 1330. [Google Scholar] [CrossRef]
- Dong, J.; Nazim, G.; Li, X.; Cai, Z.; Zhang, L.; Duan, Z. Global vegetable supply towards sustainable food production and a healthy diet. J. Clean. Prod. 2022, 369, 133212. [Google Scholar] [CrossRef]
- Andre, F.; Jutta, P. An Overview of Soil and Soilless Cultivation Techniques—Chances, Challenges and the Neglected Question of Sustainability. Plants 2022, 11, 1153. [Google Scholar] [CrossRef] [PubMed]
- Khateeb, A.A.S.; Zeineldin, I.F.; Elmulthum, A.N.; Barrak, A.M.K.; Sattar, N.M.; Mohammad, A.T.; Mohmand, S.A. Assessment of Water Productivity and Economic Viability of Greenhouse-Grown Tomatoes under Soilless and Soil-Based Cultivations. Water 2024, 16, 987. [Google Scholar] [CrossRef]
- Garcia, D.L.; Lozoya, C.; Contreras, F.A.; Giorgi, E. A Comparative Analysis between Heuristic and Data-Driven Water Management Control for Precision Agriculture Irrigation. Sustainability 2023, 15, 11337. [Google Scholar] [CrossRef]
- Jacek, D.; Magdalena, S.; Stanisław, K.; Waldemar, K. Parameters of Drainage Waters Collected during Soilless Tomato Cultivation in Mineral and Organic Substrates. Agronomy 2020, 10, 2009. [Google Scholar] [CrossRef]
- Liu, Z.; Xu, Q. Precision Irrigation Scheduling Using ECH2O Moisture Sensors for Lettuce Cultivated in a Soilless Substrate Culture. Water 2018, 10, 549. [Google Scholar] [CrossRef]
- Bañón, S.; Ochoa, J.; Bañón, D.; Ortuño, F.M.; Sánchez-Blanco, J.M. Controlling salt flushing using a salinity index obtained by soil dielectric sensors improves the physiological status and quality of potted hydrangea plant. Sci. Hortic. 2019, 247, 335–343. [Google Scholar] [CrossRef]
- Teruel, G.D.J.; Sánchez, T.R.; Ros, B.J.P.; Moreo, T.B.A.; Buendía, J.M.; Valles, S.F. Design and Calibration of a Low-Cost SDI-12 Soil Moisture Sensor. Sensors 2019, 19, 491. [Google Scholar] [CrossRef]
- Deng, X.; Gu, H.; Yang, L.; Lyu, H.; Cheng, Y.; Pan, L.; Fu, Z.; Cui, L.; Zhang, L. A method of electrical conductivity compensation in a low-cost soil moisture sensing measurement based on capacitance. Measurement 2020, 150, 107052. [Google Scholar] [CrossRef]
- Adeyemi, O.; Grove, I.; Peets, S.; Domun, Y.; Norton, T. Dynamic modelling of lettuce transpiration for water status monitoring. Comput. Electron. Agric. 2018, 155, 50–57. [Google Scholar] [CrossRef]
- Dong, H.; Dong, J.; Sun, S.; Bai, T.; Zhao, D.; Yin, Y.; Shen, X.; Wang, Y.; Zhang, Z.; Wang, Y. Crop water stress detection based on UAV remote sensing systems. Agric. Water Manag. 2024, 303, 109059. [Google Scholar] [CrossRef]
- Nguyen, D.D.H.; Pan, V.; Pham, C.; Valdez, R.; Doan, K.; Nansen, C. Night-based hyperspectral imaging to study association of horticultural crop leaf reflectance and nutrient status. Comput. Electron. Agric. 2020, 173, 105458. [Google Scholar] [CrossRef]
- Choi, B.Y.; Shin, H.J. Development of a transpiration model for precise irrigation control in tomato cultivation. Sci. Hortic. 2020, 267, 109358. [Google Scholar] [CrossRef]
- Jun, W.J.; Hwa, J.S. Development of a Transpiration Model for Precise Tomato (Solanum lycopersicum L.) Irrigation Control under Various Environmental Conditions in Greenhouse. Plant Physiol. Biochem. 2021, 162, 388–394. [Google Scholar]
- Ruiz-Peñalver, L.; Vera-Repullo, A.J.; Jiménez-Buendía, M.; Guzmán, I.; Molina-Martínez, M.J. Development of an innovative low cost weighing lysimeter for potted plants: Application in lysimetric stations. Agric. Water Manag. 2015, 151, 103–113. [Google Scholar] [CrossRef]
- Ofer, H.; Alem, G.; Rony, W.; Menachem, M. High-throughput physiological phenotyping and screening system for the characterization of plant-environment interactions. Plant J. Cell Mol. Biol. 2017, 89, 839–850. [Google Scholar]
- Li, Y.; Zhao, Q.; Dai, Y.; Li, Y.; Zeng, Y.; Guo, W. Effects of Automatic Management in Integration of Water and Fertilizer on Lettuce growth and production efficiency of irrigation water. China Veg. 2018, 8, 44–50. [Google Scholar]
- Liu, S.; Zhao, R.; Yu, K.; Zheng, B.; Liao, B. Output-only modal identification based on the variational mode decomposition (VMD) framework. J. Sound Vib. 2021, 522, 116668. [Google Scholar] [CrossRef]
- Qu, J. Radiation Characteristic and Simulation Model for Tomato Canopy Photosynthesis in Solar-Greenhouse Long-Season Cultivation. Ph.D. Thesis, Shenyang Agriculture University, Shenyang, China, 2011. [Google Scholar]
- Li, Y.; Guo, W.; Zhao, Q.; Li, Y.; Yang, Z.; Xue, X. Irrigation scheduling based on moisture and electric conducyivity sensors in organic culture of cucmber. J. Agric. Mach. 2017, 48, 263–270. [Google Scholar]
- Li, Y.; Han, X.; Li, S.; Shi, R.; Xu, J.; Zhao, Q.; Liu, T.; Guo, W. Improving Tomato Fruit Volatiles through Organic Instead of Inorganic Nutrient Solution by Precision Fertilization. Appl. Sci. 2024, 14, 4584. [Google Scholar] [CrossRef]
- Li, S.; Wang, G.; Chai, Y.; Miao, L.; Daniel, H.T.F.; Sun, S.; Huang, J.; Su, B.; Jiang, T.; Chen, T.; et al. Increasing vapor pressure deficit accelerates land drying. J. Hydrol. 2023, 625, 130062. [Google Scholar] [CrossRef]
- Vaughan, J.P.; Ayars, E.J. Noise Reduction Methods for Weighing Lysimeters. J. Irrig. Drain. Eng. 2009, 135, 235–240. [Google Scholar] [CrossRef]
- Cheng, S.; Liu, S.; Guo, J.; Luo, K.; Zhang, L.; Tang, X. Data Processing and Interpretation of Antarctic Ice-Penetrating Radar Based on Variational Mode Decomposition. Remote Sens. 2019, 11, 1253. [Google Scholar] [CrossRef]
- Huang, W.; Zhang, C.; Xue, X.; Chen, P. A Data Acquisition System Based on Outlier Detection Method for Weighing Lysimeters. In International Conference on Computer and Computing Technologies in Agriculture, Proceedings of the 5th IFIP TC 5, SIG 5.1 International Conference, CCTA 2011, Beijing, China, 29–31 October 2011; Springer: Berlin/Heidelberg, Germany, 2011; pp. 496–503. [Google Scholar]
- Jiménez-Carvajal, C.; Ruiz-Peñalver, L.; Vera-Repullo, J.; Jiménez-Buendía, M.; Antolino-Merino, A.; Molina-Martínez, M.J. Weighing lysimetric system for the determination of the water balance during irrigation in potted plants. Agric. Water Manag. 2016, 183, 78–85. [Google Scholar] [CrossRef]
- Ballester, C.; Castel, J.; Intrigliolo, D.; Castel, R.J. Response of Clementina de Nules citrus trees to summer deficit irrigation. Yield components and fruit composition. Agric. Water Manag. 2011, 98, 1027–1032. [Google Scholar] [CrossRef]
- Hairong, G.; Rui, G.; Kaili, S.; Yue, H.; Zu, S.; Li, Z.; Zhang, X. Effect of Different Water Treatments in Soil-Plant-Atmosphere Continuum Based on Intelligent Weighing Systems. Water 2022, 14, 673. [Google Scholar]
- Wang, X.; Han, H.; Cao, H. Effect of water and Nitrogen coupling on photosynthetic rate and transpiration rate of greenhouse tomato under furrow irrigation. Water Sav. Irrig. 2018, 2, 26–28+33. [Google Scholar]
- Gonzalez-Dugo, V.; Ruz, C.; Testi, L.; Orgaz, F.; Fereres, E. The impact of deficit irrigation on transpiration and yield of mandarin and late oranges. Irrig. Sci. 2018, 36, 227–239. [Google Scholar] [CrossRef]
- Patanè, C.; Corinzia, A.S.; Testa, G.; Scordia, D.; Cosentino, L.S. Physiological and Agronomic Responses of Processing Tomatoes to Deficit Irrigation at Critical Stages in a Semi-Arid Environment. Agronomy 2020, 10, 800. [Google Scholar] [CrossRef]
- Xun, W.; Yanqi, X.; Jianchu, S.; Zuo, Q.; Zhang, T.; Wang, L.; Xue, X.; Alon, G.B. Estimating stomatal conductance and evapotranspiration of winter wheat using a soil-plant water relations-based stress index. Agric. For. Meteorol. 2021, 303, 108393. [Google Scholar]
- Cen, H.; Wan, L.; Zhu, J.; Li, Y.; Li, X.; Zhu, Y.; Weng, H.; Wu, W.; Yin, W.; Xu, C.; et al. Dynamic monitoring of biomass of rice under different nitrogen treatments using a lightweight UAV with dual image-frame snapshot cameras. Plant Methods 2019, 15, 32. [Google Scholar] [CrossRef]
- Zhang, H.; Li, X.; Han, T.; Qin, H.; Liu, J.; Tian, A.; Liu, L.; Sun, G.; Ling, D.; Wang, H.; et al. Effects of Light Quality and Photoperiod on Growth, Dry Matter Production and Yield of Ginger. Plants 2025, 14, 953. [Google Scholar] [CrossRef] [PubMed]
- Li, Y.L.; Zhang, S.Q.; Guo, W.Z.; Zheng, W.G.; Zhao, Q.; Wen, Y.Y.; Li, J. Effects of irrigation scheduling on the yield and irrigation water productivity of cucumber in coconut coir culture. Sci. Rep. 2024, 14, 2944. [Google Scholar] [CrossRef]
- Liu, S.; Qiang, X.; Liu, H.; Han, Q.; Ping, Y.; Ning, H.; Li, H.; Wang, C.; Zhang, X. Effects of Nutrient Solution Application Rates on Yield, Quality, and Water–Fertilizer Use Efficiency on Greenhouse Tomatoes Using Grown-in Coir. Plants 2024, 13, 893. [Google Scholar] [CrossRef]


| Irrigation Recognition a | Solenoid Valve b | |||
|---|---|---|---|---|
| Start Time | Stop Time | Open Time | Close Time | |
| 1 | 8:28:00 | 8:40:00 | 8:27:43 | 8:33:36 |
| 2 | 9:19:00 | 9:21:00 | 9:18:11 | 9:20:27 |
| 3 | 9:57:00 | 10:05:00 | 9:56:52 | 9:58:42 |
| 4 | 10:32:00 | 10:39:00 | 10:30:59 | 10:32:40 |
| 5 | 10:58:00 | 11:03:00 | 10:57:14 | 10:58:37 |
| 6 | 11:22:00 | 11:28:00 | 11:21:21 | 11:22:44 |
| 7 | 11:45:00 | 11:51:00 | 11:44:40 | 11:46:03 |
| 8 | 12:08:00 | 12:13:00 | 12:07:08 | 12:08:23 |
| 9 | 12:30:00 | 12:36:00 | 12:29:13 | 12:30:36 |
| 10 | 12:54:00 | 13:00:00 | 12:53:54 | 12:55:35 |
| 11 | 13:21:00 | 13:26:00 | 13:20:20 | 13:22:01 |
| 12 | 13:49:00 | 13:55:00 | 13:47:59 | 13:49:49 |
| 13 | 14:26:00 | 14:33:00 | 14:25:05 | 14:26:46 |
| 14 | 15:21:00 | 15:29:00 | 15:20:52 | 15:22:24 |
| 15 | 16:58:00 | 17:05:00 | 16:57:14 | 16:58:29 |
Disclaimer/Publisher’s Note: The statements, opinions and data contained in all publications are solely those of the individual author(s) and contributor(s) and not of MDPI and/or the editor(s). MDPI and/or the editor(s) disclaim responsibility for any injury to people or property resulting from any ideas, methods, instructions or products referred to in the content. |
© 2025 by the authors. Licensee MDPI, Basel, Switzerland. This article is an open access article distributed under the terms and conditions of the Creative Commons Attribution (CC BY) license (https://creativecommons.org/licenses/by/4.0/).
Share and Cite
Xu, J.; Zhangzhong, L.; Lu, P.; Wang, Y.; Zhao, Q.; Li, Y.; Wang, L. Analysis of Irrigation, Crop Growth and Physiological Information in Substrate Cultivation Using an Intelligent Weighing System. Agriculture 2025, 15, 1113. https://doi.org/10.3390/agriculture15101113
Xu J, Zhangzhong L, Lu P, Wang Y, Zhao Q, Li Y, Wang L. Analysis of Irrigation, Crop Growth and Physiological Information in Substrate Cultivation Using an Intelligent Weighing System. Agriculture. 2025; 15(10):1113. https://doi.org/10.3390/agriculture15101113
Chicago/Turabian StyleXu, Jiu, Lili Zhangzhong, Peng Lu, Yihan Wang, Qian Zhao, Youli Li, and Lichun Wang. 2025. "Analysis of Irrigation, Crop Growth and Physiological Information in Substrate Cultivation Using an Intelligent Weighing System" Agriculture 15, no. 10: 1113. https://doi.org/10.3390/agriculture15101113
APA StyleXu, J., Zhangzhong, L., Lu, P., Wang, Y., Zhao, Q., Li, Y., & Wang, L. (2025). Analysis of Irrigation, Crop Growth and Physiological Information in Substrate Cultivation Using an Intelligent Weighing System. Agriculture, 15(10), 1113. https://doi.org/10.3390/agriculture15101113