Article

The Rapid Detection of Foreign Fibers in Seed Cotton Based on Hyperspectral Band Selection and a Lightweight Neural Network

by
Yeqi Fei
1,2,
Zhenye Li
1,
Dongyi Wang
3 and
Chao Ni
1,*
1
College of Mechanical and Electronic Engineering, Nanjing Forestry University, Nanjing 210037, China
2
School of Intelligent Manufacturing, Nanjing University of Science and Technology Zijin College, Nanjing 210023, China
3
Smart Food and Agricultural Engineering Lab, Biological and Agricultural Engineering Department, University of Arkansas, 221 Engineering Hall, Fayetteville, AR 72701, USA
*
Author to whom correspondence should be addressed.
Agriculture 2025, 15(10), 1088; https://doi.org/10.3390/agriculture15101088
Submission received: 14 April 2025 / Revised: 5 May 2025 / Accepted: 16 May 2025 / Published: 18 May 2025
(This article belongs to the Section Digital Agriculture)

Abstract

:
Contamination with foreign fibers—such as mulch films and polypropylene strands—during cotton harvesting and processing severely compromises fiber quality. The traditional detection methods often fail to identify fine impurities under visible light, while full-spectrum hyperspectral imaging (HSI) techniques—despite their effectiveness—tend to be prohibitively expensive and computationally intensive. Specifically, the vast amount of redundant spectral information in full-spectrum HSI escalates both the system’s costs and processing challenges. To address these challenges, this study presents an intelligent detection framework that integrates optimized spectral band selection with a lightweight neural network. A novel hybrid Harris Hawks–Whale Optimization Operator (HWOO) is employed to isolate 12 discriminative bands from the original 288 channels, effectively eliminating redundant spectral data. Additionally, a lightweight attention mechanism, combined with a depthwise convolution module, enables real-time inference for online production. The proposed attention-enhanced CNN architecture achieves a 99.75% classification accuracy with real-time processing at 12.201 μs per pixel, surpassing the full-spectrum models by 11.57% in its accuracy while drastically reducing the processing time from 370.1 μs per pixel. This approach not only enables the high-speed removal of impurities in harvested seed cotton production lines but also offers a cost-effective pathway to practical multispectral solutions. Moreover, this methodology demonstrates broad applicability for quality control in agricultural product processing.

1. Introduction

The presence of mulch films [1] and polypropylene fibers in seed cotton presents significant challenges for the Xinjiang Uyghur Autonomous Region, China, as one of the world’s major cotton-producing regions. These issues arise from using film mulching technology, drip irrigation, and polypropylene packaging materials throughout cultivation and harvesting. Residual foreign fibers severely impact subsequent cotton spinning and dyeing processes [2], ultimately affecting cotton grades and market prices.
In traditional seed cotton sorting processes, the coexistence of mechanical and manual methods has led to high labor costs and low efficiency. In recent years, machine vision technology combined with machine learning and deep learning algorithms has become a critical tool in the cotton impurity removal process. Li et al. [3] combined machine vision with a Support Vector Machine (SVM) to classify foreign fibers in cotton lint, which included hair, plastic film, hemp rope, cloth, feathers, and polypropylene twine, achieving a classification accuracy of 93.57%. Zhang et al. [4] improved the detection algorithm for impurity identification in images of machine-harvested seed cotton by integrating a Genetic Algorithm (GA) with an SVM. Impurities including cotton branches, leaves, boll shells, hardened petals, and dust were identified with a classification accuracy of 92.6%. Wang et al. [5] utilized area- and line-scan cameras to capture images of seed cotton containing mulch film. Partial Least Squares (PLS) was applied to extracting features from the area-scan images, followed by the extraction of texture features from the line-scan images. The extracted features were then fused and classified using an SVM algorithm, achieving a detection accuracy of 83%. Wang et al. [6] used an improved YOLO V5 algorithm in combination with polarization imaging technology to detect various hard-to-identify white and transparent foreign fibers in cotton, significantly enhancing the foreign fiber detection capabilities, achieving a detection accuracy of 96.9%. Although machine vision technology based on RGB images can detect impurities in cotton to some extent, this approach largely depends on the impurities being visible under visible light. For foreign fibers that are not visually distinctive, such as those of a similar color to cotton or transparent fibers, the detection performance in RGB imaging is inadequate and fails to achieve the precision and stability required by production lines.
The application of Near-Infrared (NIR) spectroscopy to the detection of foreign fibers in seed cotton is attracting increasing attention. For nearly visually indistinguishable white foreign fibers in seed cotton, Wei et al. [7] applied Minimum Noise Fraction (MNF) transformation to reduce the noise and dimensionality in hyperspectral data. Median filtering and grayscale variation were used for data segmentation and classification, achieving an approximately 90% detection accuracy. However, these studies mainly focused on data processing, with limited discussions concerning specific detection methods. Jin et al. [8] studied common impurities in seed cotton, including cotton leaves, cotton branches, mulch films, and boll shells. By collecting hyperspectral data on seed cotton and applying basic parameter optimization to models such as Linear Discriminant Analysis (LDA), Artificial Neural Networks (ANNs), and SVMs, this study achieved classification accuracies exceeding 80%. By extracting features from hyperspectral data on seed cotton containing residual mulch and using an optimized Extreme Learning Machine (ELM) classifier, Ni et al. [9] achieved a 95% detection rate.
However, NIR spectroscopy generates a substantial volume of data, which increases exponentially with rising data dimensionality. This growth in the volume of data not only reduces the computational efficiency of the model but also heightens the risk of overfitting, potentially leading to the Hughes phenomenon [10]. In hyperspectral image processing, the effective selection of the bands to reduce the data dimensions while extracting and retaining key information has become critical to improving the accuracy, speed, and stability of the detection models [11]. In early studies, the exhaustive search method was used for global search [12]. However, as the data scale increases, the computational complexity of this method grows exponentially. To overcome this weakness, heuristic and intelligent optimization algorithms have gradually become the mainstream methods for band selection, balancing the computational efficiency with selection accuracy. Common heuristic algorithms for spectral band selection include GAs [13,14], Particle Swarm Optimization (PSO) [15,16], Ant Colony Optimization (ACO) [17,18], and the Firefly Algorithm (FA) [19,20], among others. These algorithms and their improved versions have been widely applied in the band selection for hyperspectral datasets, yielding promising results. However, most heuristic algorithms still need to balance between global and local searches, particularly in an attempt to avoid local optima. This remains a key obstacle for optimization algorithms and an important research direction in hyperspectral band selection.
Although previous studies have applied RGB imaging, polarization techniques, and hyperspectral analysis to detecting impurities in cotton, they still face limitations in either the feature distinguishability, the model complexity, or adaptability to real-time production. Most of the existing works have relied on full-spectrum hyperspectral data without band optimization, leading to increased computational costs and potential overfitting. Moreover, limited attention has been paid to designing lightweight models tailored to deployment on actual production lines. These limitations highlight the necessity of an efficient and scalable method that can balance the classification accuracy, computational efficiency, and hardware applicability.
In this study, an innovative band optimization algorithm is proposed. This algorithm, coupled with a lightweight Convolutional Neural Network (CNN), enables the efficient and rapid detection of foreign fibers in seed cotton. The system ensures high accuracy and robustness even when deployed at production terminals with limited computational resources. Additionally, after band optimization, with a limited number of selected bands, it is possible to achieve sorting goals using a multispectral camera [21].
The main contributions and innovations of this work are summarized below:
(1) Information on foreign fibers is captured through hyperspectral imaging (HSI) technology, addressing the limitations of the traditional methods in foreign fiber detection;
(2) A feature optimization algorithm that balances local and global search advantages is proposed, which effectively extracts the most representative spectral bands and significantly reduces the data dimensionality and processing complexity;
(3) Based on the selected feature bands, a lightweight CNN detection algorithm incorporating attention mechanisms for the extracted features is designed and optimized to enhance the feature recognition capabilities;
(4) This approach is designed to operate on hardware with limited resources, meeting the real-time requirements of industrial production lines.
The rest of this paper is organized as follows: Section 2 introduces the materials and methods, including detailed descriptions of the sample acquisition, preprocessing, and experimental scheme. Section 3 presents the experimental results of band selection and the proposed model. Finally, Section 4 summarizes the key conclusions.

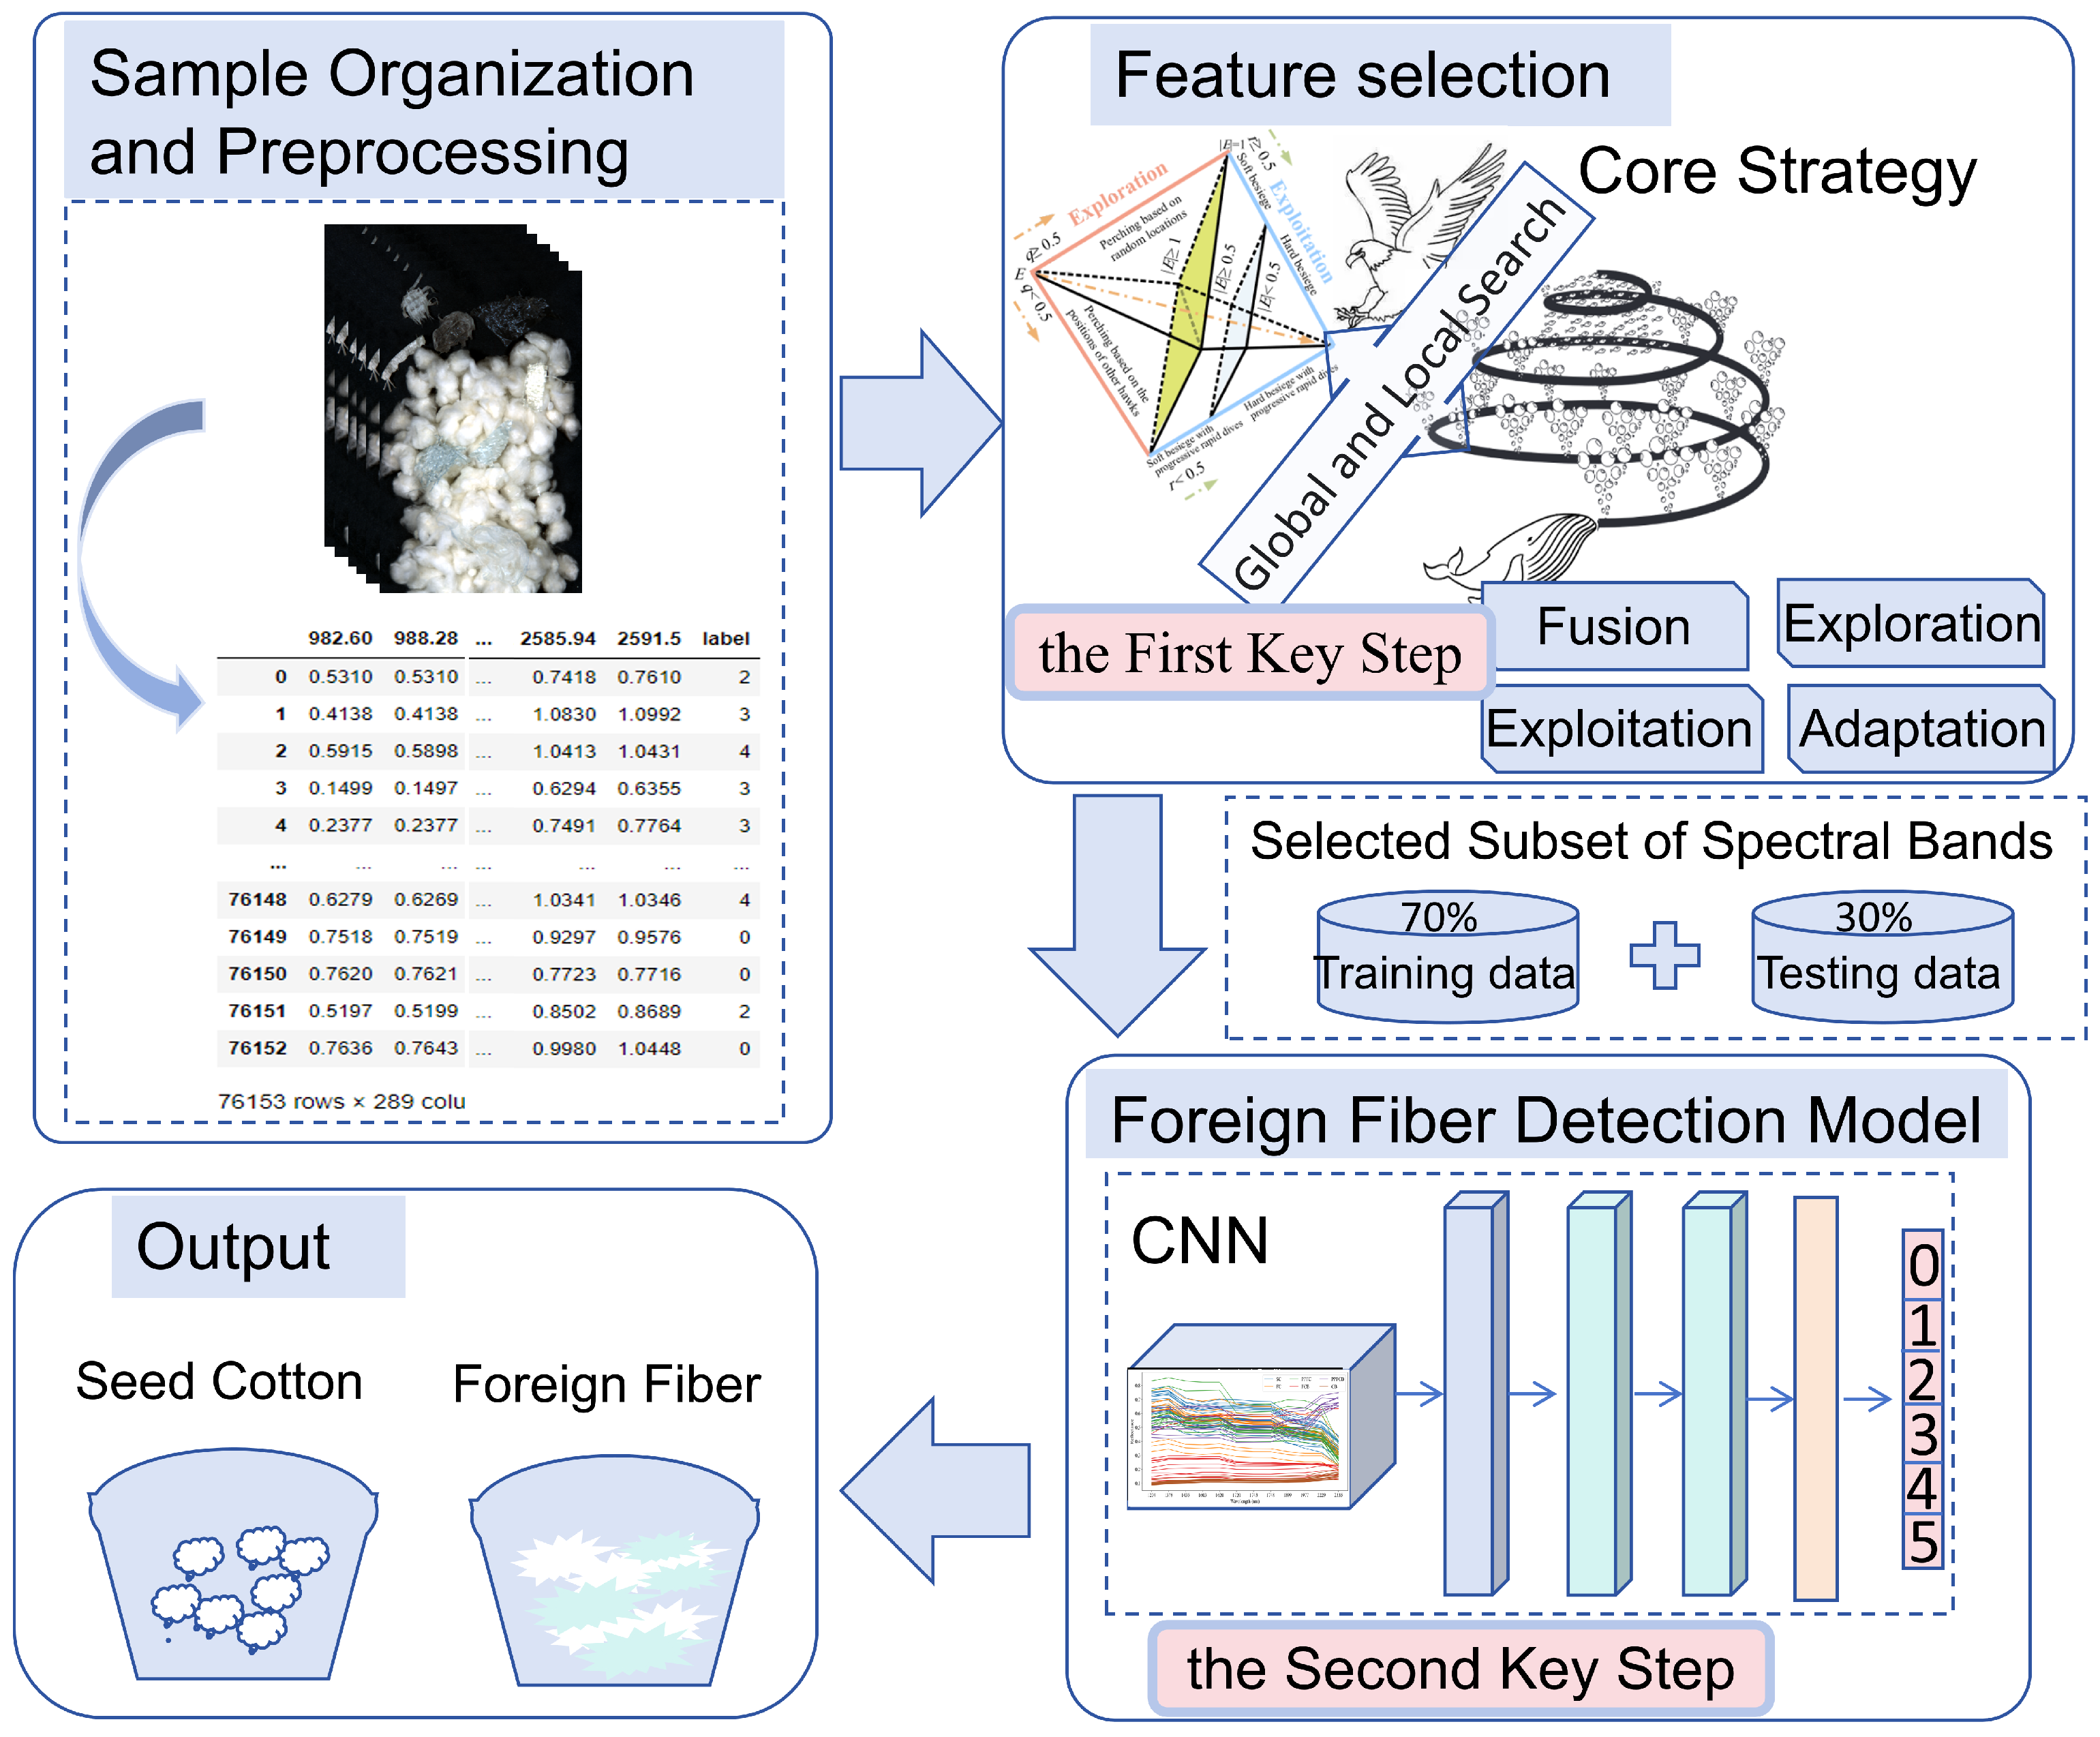
2. Materials and Methods

2.1. Cotton Sample Acquisition

The fiber samples in this study were systematically collected from cotton farms located in Ili Prefecture, Xinjiang, using random sampling. To ensure sample diversity, factors arising from cotton cultivation and transportation, such as variations in the color of seed cotton, new and weathered mulch films, and polypropylene fibers of different colors and under different ageing conditions, were all taken into the consideration. Following the image acquisition process, the pixels were classified into the following six categories: Seed Cotton (SC), Film on Cotton (FC), Polypropylene Fibers on Cotton (PPFC), Film on the Conveyor Belt (FCB), Polypropylene Fibers on the Conveyor Belt (PPFCB), and Conveyor Belt (CB). Figure 1 presents representative images of each sample type captured under visible light.
The sample collection was conducted using a hyperspectral data acquisition system, which comprised a conveyor belt, a hyperspectral camera, an illumination system, and a computer. The system incorporates the SPECIM Spectral Camera from Finland, which operates across a spectral range of 1000–2500 nm. The camera provides 288 continuous spectral bands with a high resolution, enabling the precise differentiation of material. The imaging system also includes a halogen-based illumination source and a conveyor belt scanning platform to simulate the movement of production lines. Black-and-white calibration was performed during the data acquisition process to ensure data consistency and spectral fidelity [22], effectively minimizing the interference of noise following Equations (1) and (2).
B l a c k C o r r e c t i o n : D corrected = D raw D dark
where D corrected represents the data subsequent to black correction, D raw denotes the raw data, and D dark corresponds to the data obtained under dark conditions.
W h i t e C o r r e c t i o n : R = D corrected / ( D white D dark )
R represents the corrected reflectance data, D corrected signifies the data after black correction, and D white refers to the data obtained using a white reference panel.
The acquired hyperspectral data were stored in a raw format, with dimensions of 674 × 384 × 288 (rows × columns × bands), facilitating the efficient organization and extraction of foreign fiber data from the seed cotton. The sample acquisition process is depicted in Figure 2.

2.2. Sample Preprocessing

The main steps of data preprocessing in this study are as follows.
Step 1: The regions of interest (ROIs), containing foreign fibers such as mulch films and polypropylene filaments, were carefully delineated and labeled manually. To ensure that the collected data reflected the diversity and complexity of actual production environments, the manual selection of the sample regions was guided by both visual inspections and domain expertise. The selected regions aimed to cover a wide range of appearances and embedding conditions of foreign fibers, such as partially occluded, aged, or color-faded films and polypropylene. This deliberate sampling strategy enhanced the variability within each class and increased the robustness of model training.
Step 2: The labels of the ROIs were divided based on sample categories before being converted into a one-dimensional CSV format pixel label table. The label definitions and the number of samples for each category were as follows: SC (label 0) with 20,224 pixels, FC (label 1) with 12,713 pixels, PPFC (label 2) with 11,046 pixels, FCB (label 3) with 1061 pixels, PPFCB (label 4) with 8130 pixels, and CB (label 5) with 135,794 pixels, totaling 76,153 pixels. Detailed information is shown in Table 1.
Step 3: Due to the imaging characteristics of hyperspectral cameras, hyperspectral data exhibit a high spatial correlation between neighboring pixels [23]. If neighboring pixels are included in both the training and testing sets, the model might learn specific spatial relationships rather than generalizing effectively, which could lead to overestimated performance metrics. Therefore, strict separation between the training and testing pixels was employed, with the training and testing sets sampled from different hyperspectral image datasets containing seed cotton with foreign fibers, maintaining an approximate ratio of 7:3, to ensure the robust evaluation of the model. Additionally, the proportion of foreign fibers in seed cotton varies due to different cultivation techniques and production regions. In actual production, the distribution of the foreign fibers in seed cotton also fluctuates randomly. Therefore, the foreign fibers were randomly collected in the samples, and this distribution reflected a realistic scenario.
Step 4: To eliminate the impact of dimensionality, improve the algorithm’s performance, and reduce differences between data [24], all feature values were scaled to a uniform range, and the training and test sets were processed using min–max normalization to achieve equidistant scaling of the feature values (Equation (3)).
x 1 = ( x x min ) / ( x max x min )
x 1 represents the normalized data value, x refers to the original spectral data that require normalization, x min is the minimum spectral data value in the sample, and x max is the maximum spectral data value in the sample.

2.3. Primary Theories

This work presents an optimized detection method for hyperspectral data on seed cotton containing multiple foreign fibers. The process, illustrated in Figure 3, comprises two key steps. The first key step focuses on the development of an optimized feature selection algorithm to eliminate noise and redundant information from the 288-band hyperspectral data. The second key step constructs an accurate, efficient, and lightweight CNN model, aiming to effectively sort the seed cotton and foreign fibers. This design ensures a robust detection performance while maintaining its cost-effectiveness. The feature selection is closely linked to the CNN model; specifically, the band selection process significantly reduces the high dimensionality of the hyperspectral data, allowing the CNN model to focus on the most informative spectral features and avoiding the inclusion of redundant or less informative spectral bands. The selected subset of spectral bands is used as the input for the CNN, which makes the model more computationally efficient. This reduction in dimensionality facilitates a faster performance during both the training and inference phases.
The experiments and algorithms in this study were performed on a computer with an Intel® Core™ i9-12900K processor, 64 GB of RAM, and a GeForce RTX 3080 Ti graphics card.

2.3.1. Hyperspectral Data Analysis Methods

The 288-hyperspectral-band data for seed cotton containing foreign fibers collected in this study contain abundant spectral information, which helps capture subtle differences between foreign fibers and seed cotton. However, the high-dimensional data also introduce significant amounts of redundant information and noise. Therefore, by extracting key bands that are highly relevant to the classification task and removing irrelevant or redundant features, the data dimensionality can be effectively reduced, the risk of overfitting can be minimized, and the model’s computational efficiency and performance can also be enhanced [25].
This study proposes an efficient optimization strategy aiming to enhance the band selection and feature detection capabilities for hyperspectral data. This strategy integrates the advantages of Harris Hawks Optimization (HHO) [26] and the Whale Optimization Algorithm (WOA) [27], where HHO excels in global searches and leapfrogging exploration, while the WOA excels in local fine searches and iterative approximation. By merging the core strategies of these two algorithms, the synergy between global searching and local fine searching is enhanced, enabling dynamic adjustments and multidimensional updates during the optimization process, thereby effectively approaching the optimal band subset. Furthermore, this strategy employs a fitness function during the iterative process to accurately evaluate the performance of the subsets, thereby addressing the dimensionality reduction and feature selection issues for seed cotton–foreign fiber hyperspectral data. In this study, this strategy is named the Harris Hawks and Whale Optimization Operator (HWOO). A flowchart of the HWOO’s implementation is shown in Figure 4, with the main processes described as follows.
Step 1: Data input and initialization: The parameters of the model were initialized, and data on seed cotton containing foreign fibers with 288 hyperspectral bands, along with the corresponding labels, were fed into the model.
The parameters include N, m a x _ i t e r , and d i m , among others. N represents the number of spectral subsets used in each iteration for band selection, with each subset representing a possible spectral combination. A larger value for N allows for broader coverage of the search scope, increasing the probability of finding the optimal band subset, but it also increases the computational complexity. Therefore, it is crucial to balance exploration and computational efficiency when determining the value of N. m a x _ i t e r denotes the maximum number of iterations. An appropriate value for m a x _ i t e r helps reduce the computational burden and the total runtime while ensuring algorithm convergence. More iterations provide a more comprehensive search, increasing the chances of finding effective spectral combinations for classification, which in turn improves the detection accuracy. However, increasing the number of iterations also increases the computation time. dim represents the number of bands in the hyperspectral data, which is equal to 288 in this study.
The initial positions are calculated using Equation (4).
X i j = l b j + ( u b j l b j ) × rand ( 0 , 1 ) i = 1 , 2 , , N j = 1 , 2 , , d i m
X i j represents the initial position of the spectral subset, indicating whether the j-th band of the i-th subset is selected during initialization. For the 288 hyperspectral bands in this study, each subset position represents a specific band selection scheme. The boundaries l b j and u b j represent the lower and upper bounds for the j-th band, respectively. In the experiment, these boundaries are set to 0 and 1. The initial position values X i j are generated within the continuous range [0, 1], representing the probability of selecting a particular spectral band. These values are subsequently converted into binary form through a thresholding process, where a value greater than a given threshold is assigned as 1 (indicating the band is selected) and a value less than or equal to the threshold is assigned as 0 (indicating the band is not selected). This two-step process ensures that the final band selection is represented as binary, thereby facilitating effective feature selection while maintaining diversity in the initialization phase. r a n d ( 0 , 1 ) is used to randomly initialize the band positions within the interval [0, 1], ensuring a uniform probability distribution for the band selection. This guarantees diversity in initialization, allowing for a more comprehensive search of potential band combinations, thereby increasing the chance of finding the optimal subset and reducing the risk of becoming stuck in the local optimum.
Step 2: Evaluating the initial fitness: The fitness function Fun (Equation (5)) is used to evaluate the classification performance of the current band subset. A smaller fitness value indicates a stronger ability of the subset to distinguish between foreign fibers and seed cotton. In the experiment, the initial fitness F i t n e s s ( X i ) is calculated using the fitness function Fun to evaluate the quality of the selected band subset in terms of the classification performance. The aim of this process is to select the most representative band subset from the 288 hyperspectral bands in order to effectively differentiate between foreign fibers and seed cotton.
Fitness ( X i ) = Fun ( x train , y train , X i , opts )
X i represents the current band subset, X i = [ x i , 1 , x i , 2 , , x i , dim ] , where each x i , j indicates the selection state of the j-th band in the subset (0 means not selected, 1 means selected). x train and y train refer to the input data features and corresponding labels, respectively. opts represents the set of option parameters, including the specific configurations required for running the algorithm, such as N, m a x _ i t e r , and other hyperparameters related to the optimization algorithm.
Step 3: Iterative loop: This step involves the HHO core strategy and the WOA core strategy for continuously optimizing the band subset by updating the position, boundary, and fitness, eventually obtaining the optimal band combination.
(1) The HHO Core Strategy
The HHO core strategy updates the position of the band subset by switching between global search and local search to select the optimal band combination. In this strategy, the parameter E controls whether the algorithm executes a global or a local search strategy.
Global search ( | E | 1 ): In the global search phase, a broad exploration is conducted across all possible combinations of the 288 bands to avoid being trapped in local optima and to increase the chances of finding a globally optimal band subset (Equation (6)).
X i , d ( new ) = X k , d r 1 × X k , d 2 r 2 × X i , d ( current )
X i , d ( new ) represents the new position of the i-th band subset in the dimension d, reflecting the selection state of the new band combination. X i , d ( current ) represents the position before the update. X k , d represents the position of the k-th randomly chosen band subset in the current set in dimension d, enhancing the diversity in exploration. r 1 and r 2 are uniformly distributed random numbers in the range [0, 1] used to control the relative difference in the position between band subsets, ensuring randomness in the selection process and increasing the chances of discovering different band combinations.
Local search ( | E | < 1 ): The local search involves making fine adjustments to the currently superior band subset to optimize the band selection further and find a better local solution (band subset) (Equation (7)).
Y = X gb E × J × X gb X i
Y represents the band subset generated through local search. X gb refers to the current global best position, which is the band subset with the best fitness among all candidate subsets. J = 2 ( 1 rand ( 0 , 1 ) ) : J is a random search factor that helps the algorithm explore more untried combinations within the band space.
After completing the HHO core strategy, the current optimal position of the band subset is obtained, referred to as Position P1.
(2) The WOA Core Strategy
After completing the HHO strategy update, based on P1, the WOA core strategy is used to optimize the selection of each band among the 288 hyperspectral bands further. This optimization is performed through both global and local searches to improve the fitness of the band subset. A is used to determine whether the current band subset will undergo global or local searching.
Global search (( | A | 1 ): The global search conducts a broad exploration across all of the bands to find new band combinations with a higher information content, thus avoiding becoming stuck in local optima (Equation (8)).
X i ( new ) = X k A × | C × X k X i ( current ) |
X k represents one of the band subsets randomly selected from the current set of bands. C = 2 × rand ( 0 , 1 ) : C is a random coefficient that controls the distance between the current band subset and the target, ensuring diversity in the search process. This comprehensive search helps identify more representative band subsets.
Local search ( | A | < 1 ): In the local search phase, fine adjustments are made to the current high-information-content band subset to identify more representative band combinations (Equation (9)).
X i ( new ) = | X gb X i ( current ) | × e b l × cos ( 2 π l ) + X gb
e is Euler’s number, with a value of 2.71828. b is a parameter that adjusts the intensity of the search, controlling the spiral shape of the search path. l is a parameter used to control the spiral attack trajectory.
In Equations (8) and (9), X i ( current ) represents the position of the band subset before the update, while X i ( new ) represents the position after the update step.
After completing the WOA position update, the improved band subset is obtained, referred to as Position P2.
(3) Position Update, Boundary Check, and Fitness Evaluation
In this step, boundary checks are conducted on the updated band subsets to ensure that the value for each band’s selection remains within the predetermined upper and lower bounds (Equation (10)).
X i j = boundary ( X i j , l b j , u b j )
After the boundary check, the fitness value of each band combination is recalculated to determine whether the current global best solution, X gb , needs updating. This ensures that each updated band combination improves the fitness of the model, ultimately finding the optimal band subset to enhance the detection performance for foreign fibers in seed cotton.
Step 4: Termination and output of the optimal results: When the maximum number of iterations is reached, the algorithm stops and outputs the final result. The output includes the global optimal band subset X gb extracted from the 288-band dataset, along with its corresponding fitness value. This optimal band subset will be used for subsequent model construction to enhance the classification performance for foreign fibers in seed cotton.

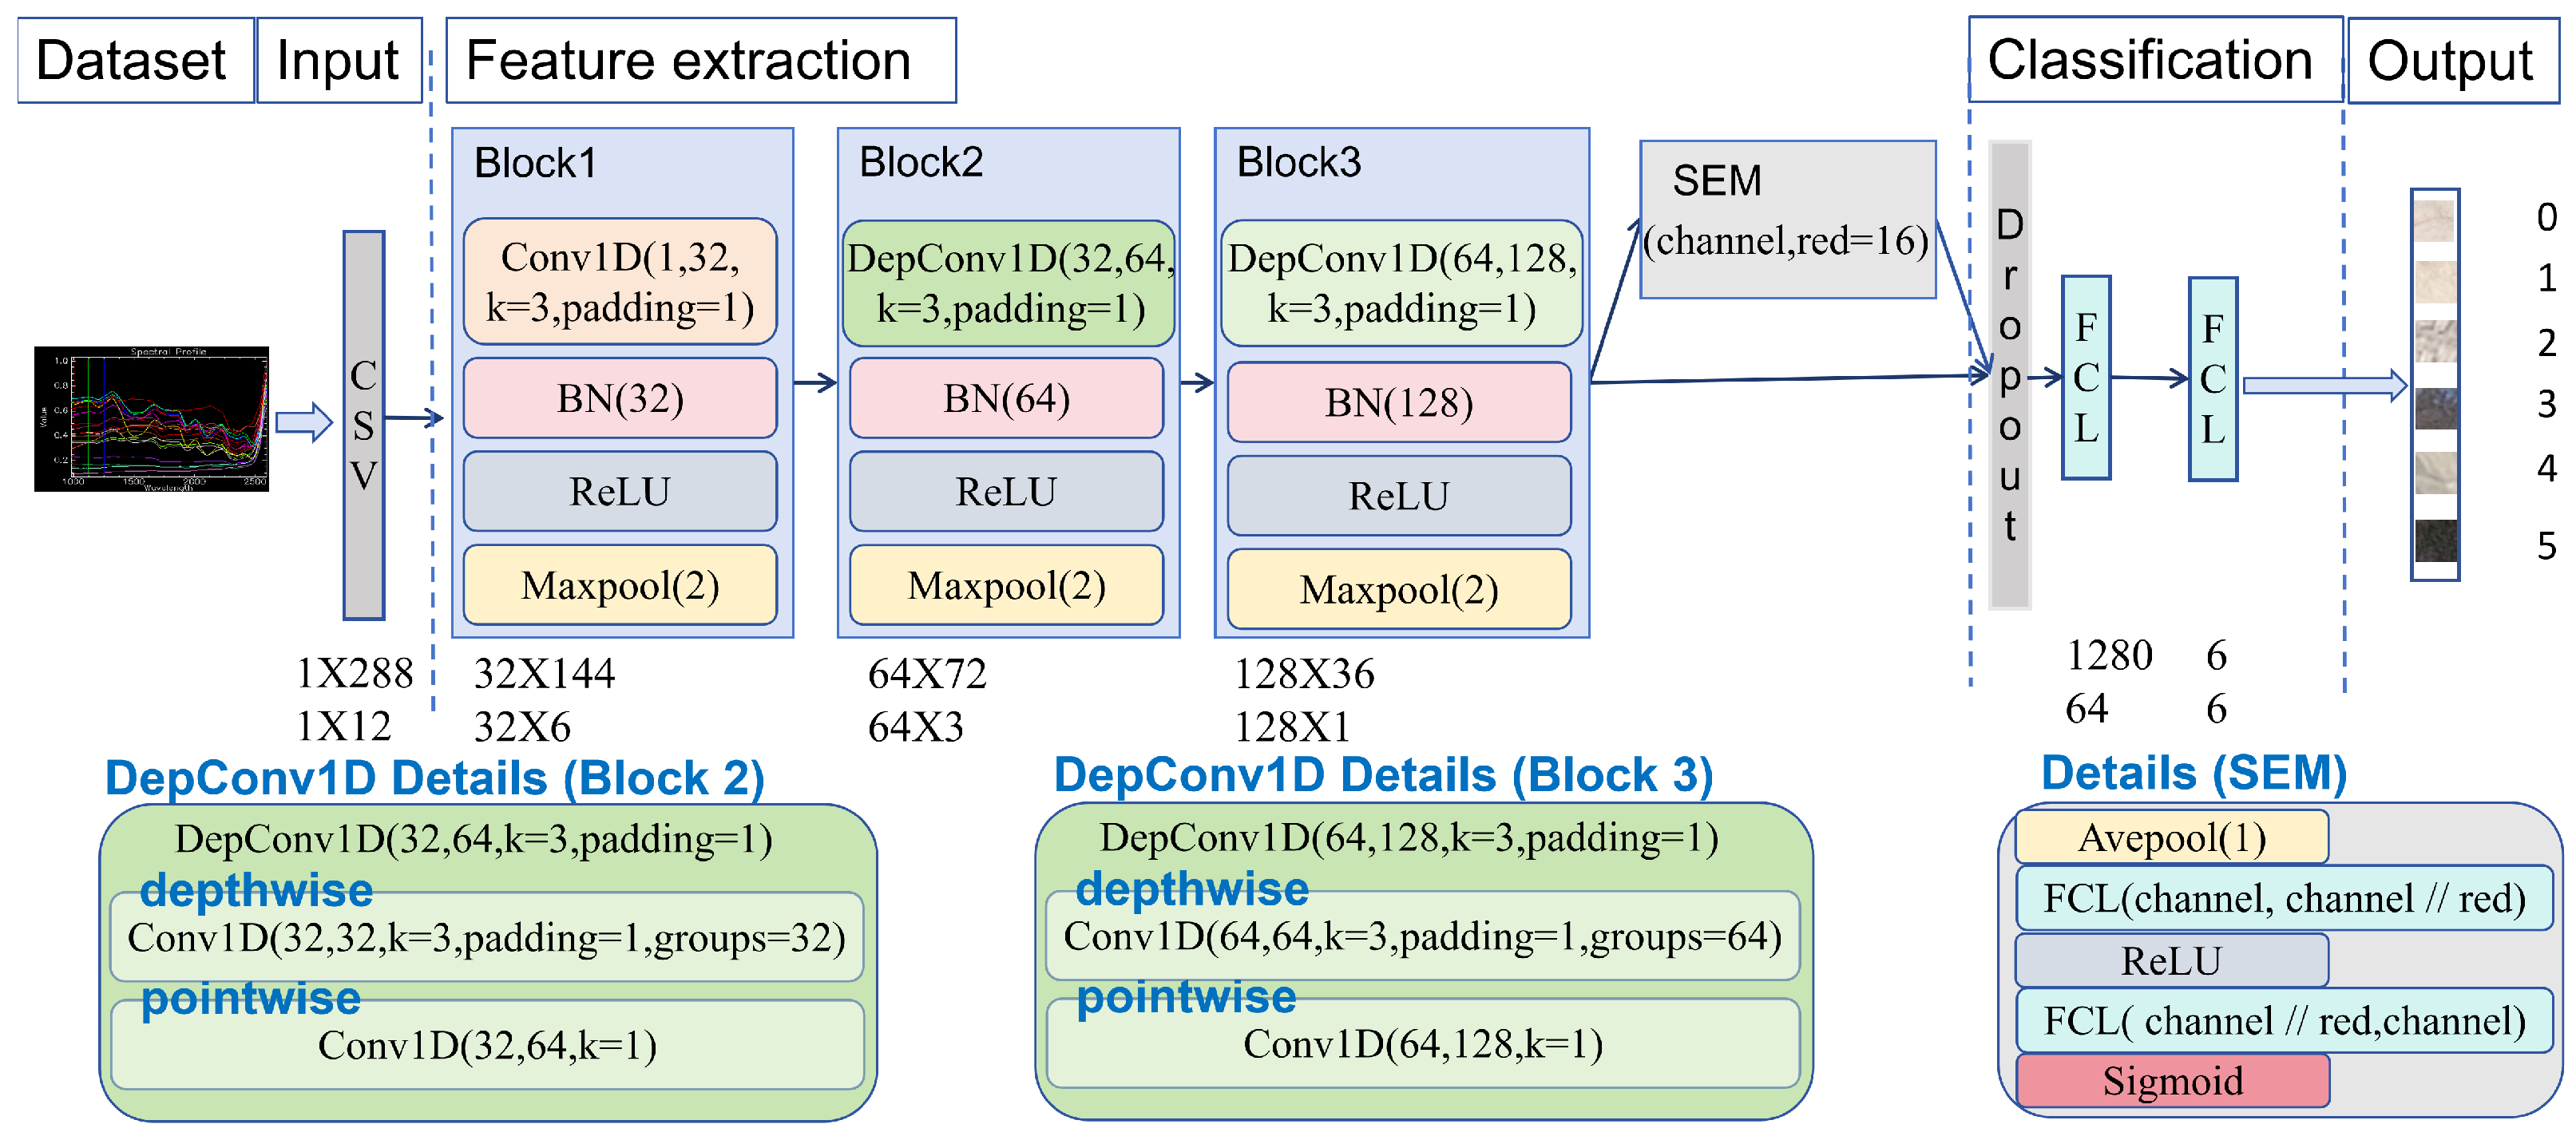
2.3.2. The Classification Model

To detect foreign fibers quickly and accurately while conserving the limited computational power on production line sorting systems, this work designed a One-Dimensional CNN (1DCNN) architecture that combined a lightweight module and an attention mechanism. The model is named ’DepSE-CNN’. Specifically, depthwise separable convolution from MobileNet [28] is used to significantly reduce the number of parameters and the amount of computation in the convolutional layers, thereby making the network more lightweight. In addition, the Squeeze-and-Excitation Module (SE module (SEM)) in SENet [29] further improves the classification performance of the network by adaptively adjusting the attention to the important features in each channel through ’squeeze’ and ’excitation’. With this design, the model achieves a high accuracy and fast operation in resource-limited equipment and becomes more applicable to real-time tasks of sorting foreign fibers in seed cotton production.
In this work, the extracted spectral data on seed cotton containing foreign fibers were normalized and then fed into the model in one-dimensional CSV format for iterative learning. In the model architecture, Block1 consists of convolution (Conv1D), batch normalization (BN) [30], a nonlinear activation function (ReLU), and the max pooling layer (MaxPool). This combination allows for the extraction of fundamental local features while stabilizing training and accelerating the convergence. Blocks 2 and 3 introduce depthwise separable convolution (DepConv1D), which decomposes the convolution operation into depthwise and pointwise components. This significantly reduces the number of parameters and the amount of computation, making the model more lightweight and faster without compromising accuracy. By integrating BN, ReLU, and MaxPool, these blocks enhance the network’s ability to capture discriminative spectral patterns from the reduced input space. In the process of feature extraction and classification, the SEM is added to enhance the attention towards effective features by adaptively adjusting the feature weights of each channel to extract more useful information, thus improving the classification performance. Before the Fully Connected Layers (FCLs), dropout [31] is used to randomly discard some neurons to prevent overfitting in the neural network while speeding up the training process. Eventually, the network accomplishes the classification task through two FCLs, which output the data as corresponding categories. The model incorporates regularization techniques such as dropout and batch normalization, as well as attention mechanisms (the SE module), to enhance robustness and reduce overfitting, thereby improving its generalization ability across diverse spectral and spatial variations. The overall framework and parameter settings of the proposed architecture are illustrated in Figure 5.

3. Results and Discussion

In this work, firstly, comparing multiple mainstream optimization algorithms to assess their performance for band selection, the effectiveness of the band feature selection method in seed cotton–foreign fiber hyperspectral data under limited conditions was verified. Secondly, to improve the performance in classification and detection, the hyperparameters of the proposed model were fine-tuned. Finally, a comprehensive comparison experiment was conducted using several 1DCNN algorithm architectures from the literature. The proposed DepSE-CNN model incorporates a lightweight architecture with a Squeeze-and-Excitation attention mechanism, which optimizes the feature selection and minimizes the computation requirements. These design innovations make DepSE-CNN highly suitable for deployment in real-time sorting tasks on resource-constrained devices, effectively balancing high accuracy with computational efficiency.
In the experiments, classification analyses were conducted using hyperspectral data to comprehensively evaluate the performance of the model in the detection of foreign fibers in seed cotton. To quantitatively evaluate the proposed feature selection algorithm and classification model, various performance metrics were employed, including the overall accuracy (Acc), the Area Under the ROC Curve (AUC), the mean accuracy (AA), the Kappa coefficient, and the confusion matrix.

3.1. Feature Selection

In this experiment, five optimization algorithms, the GA [32], PSO [33], HHO, WOA, and HWOO, were applied to the 288-band seed cotton–foreign fiber hyperspectral data. The spectral data were processed using 20 iterations for each algorithm to extract the minimum number of effective bands. Based on the number of bands selected by each algorithm, corresponding datasets were constructed. These datasets, along with the original band data, were fed into the K-Nearest Neighbors (KNN) classification model [34] for a performance evaluation. As shown in Table 2, the performance evaluation metrics include the classification accuracy, the AUC value, and the overall runtime of the KNN model. These metrics demonstrate the effectiveness of the different optimization algorithms in feature selection and their impacts on the classification performance.
A comparative analysis of Table 2 indicates that all of the optimization algorithms effectively reduce the number of bands and the redundant information in the hyperspectral data, improving the classification accuracy of the KNN model. The HHO and the HWOO perform particularly well in band reduction, with the HWOO achieving the highest classification accuracy using only 12 bands extracted from the 288-band hyperspectral dataset. Both algorithms achieve high AUC values, particularly for the Label 1 category, where the HWOO reaches 83.92% and the HHO reaches 84.04%. This displays only minimal differences in their performance in distinguishing category samples. The HWOO achieves an overall classification accuracy of 93.05%, surpassing the accuracy of the HHO (92.45%), and this difference may be attributed to the varying proportions of different categories in the dataset. The AUC primarily measures a model’s ability to differentiate between categories, while the accuracy emphasizes the overall performance across the majority of categories. In terms of the runtime, the feature selection not only improves the classification performance but also significantly reduces the model runtime. In particular, the HWOO demonstrates an excellent computational efficiency by taking only 1.68 s to achieve the highest classification accuracy, which is only one-fifth of the time required for the original 288-band dataset. By comparison, inferring the entire dataset from the original full-spectrum images takes 8.47 s, equivalent to 370.1 μs per pixel.
To demonstrate the performance of the proposed HWOO algorithm further, an in-depth comparative analysis is performed with the HHO and the WOA on the KNN classifier. Out of 20 iterations, the results with the fewest selected bands from 5 iterations are chosen for further study, allowing for a more comprehensive evaluation of these algorithms in terms of the feature selection and classification performance.
Table 3 shows that the number of selected bands varies across different iterations under the same algorithm, due to the randomness of the algorithm. Taking the HWOO algorithm as an example, both iterations extract 12 optimal bands, but their subsets of band numbers differ. The band subsets are [‘999.64’, ‘1016.68’, ‘1197.90’, ‘1473.84’, ‘1597.25’, ‘1608.45’, ‘1714.83’, ‘1943.95’, ‘2027.68’, ‘2200.65’, ‘2345.73’, ‘2490.92’] (unit: nm) and [‘1203.55’, ‘1378.29’, ‘1434.52’, ‘1602.85’, ‘1619.66’, ‘1720.42’, ‘1742.80’, ‘1748.39’, ‘1899.28’, ‘1977.44’, ‘2228.54’, ‘2334.57’] (unit: nm). Since each subset contains different information, their mutual influence also differs, which in turn affects the classification performance metrics, such as Acc, AA, Kappa, and algorithm the runtime, to various degrees.
Similarly, different algorithms extracting the same number of bands show different performance. For example, the HHO, WOA, and HWOO both extract 19 bands, but their band number subsets are [‘1039.38’, ‘1056.40’, ‘1113.07’, ‘1118.73’, ‘1226.14’, ‘1288.19’, ‘1327.63’, ‘1630.86’, ‘1826.65’, ‘1910.44’, ‘1921.61’, ‘2055.58’, ‘2156.01’, ‘2250.86’, ‘2301.08’, ‘2328.99’, ‘2356.90’, ‘2412.72’, ‘2502.09’] (unit: nm); [‘1180.95’, ‘1243.07’, ‘1490.68’, ‘1563.62’, ‘1591.64’, ‘1647.66’, ‘1726.02’, ‘1821.06’, ‘1921.61’, ‘1943.95’, ‘1988.61’, ‘2033.26’, ‘2077.90’, ‘2083.48’, ‘2144.85’, ‘2317.83’, ‘2334.57’, ‘2351.31’, ‘2490.92’] (unit: nm); and [‘1135.71’, ‘1192.25’, ‘1243.07’, ‘1271.28’, ‘1288.19’, ‘1400.79’, ‘1614.06’, ‘1619.66’, ‘1737.20’, ‘1821.06’, ‘1921.61’, ‘2050.00’, ‘2072.32’, ‘2211.81’, ‘2256.44’, ‘2317.83’, ‘2334.57’, ‘2345.73’, ‘2490.92’] (unit: nm), respectively. Although the number of bands is the same, the classification performance differs, with Acc values of 93.13%, 93.04%, and 92.77%. This indicates that the information contained in different subsets significantly impacts the classification results. Moreover, a higher number of bands does not necessarily lead to a better classification performance. The key lies in the amount of useful information contained in the selected bands. When the HWOO extracts the minimum number of bands (12 bands) from a 288-band hyperspectral dataset, its classification performance (in terms of Acc, AA, Kappa, and Time) generally outperforms other band subsets.
In this work, the selection of the best subset is determined based on the overall classification performance. For instance, if multiple iterations of the algorithm generate different subsets, the subset with the highest classification accuracy is chosen while also considering metrics such as Acc, Kappa, and runtime efficiency. This approach ensures that the selected band combination not only maximizes the model performance but also maintains computational efficiency, which is essential for real-time applications in production line sorting systems. Furthermore, cross-validation is employed to mitigate the risk of overfitting and ensure that the selected band subset generalizes well across different data samples. This systematic methodology aids in identifying the most informative bands under given conditions, striking a balance between computational efficiency and accuracy. Therefore, the HWOO demonstrates its advantage in feature selection by precisely selecting effective bands, improving the classification performance while reducing the number of bands. Besides extracting bands containing useful information, the algorithm also maintains a stable and excellent classification performance across multiple iterations. Ultimately, the optimal band subset extracted using the HWOO during iterations is selected as the band dataset for subsequent testing, and this band subset is [‘1203.55’, ‘1378.29’, ‘1434.52’, ‘1602.85’, ‘1619.66’, ‘1720.42’, ‘1742.80’, ‘1748.39’, ‘1899.28’, ‘1977.44’, ‘2228.54’, ‘2334.57’] (unit: nm). The raw hyperspectral seed cotton–foreign fiber data and the spectral data after HWOO feature selection are displayed in Figure 6a,b.

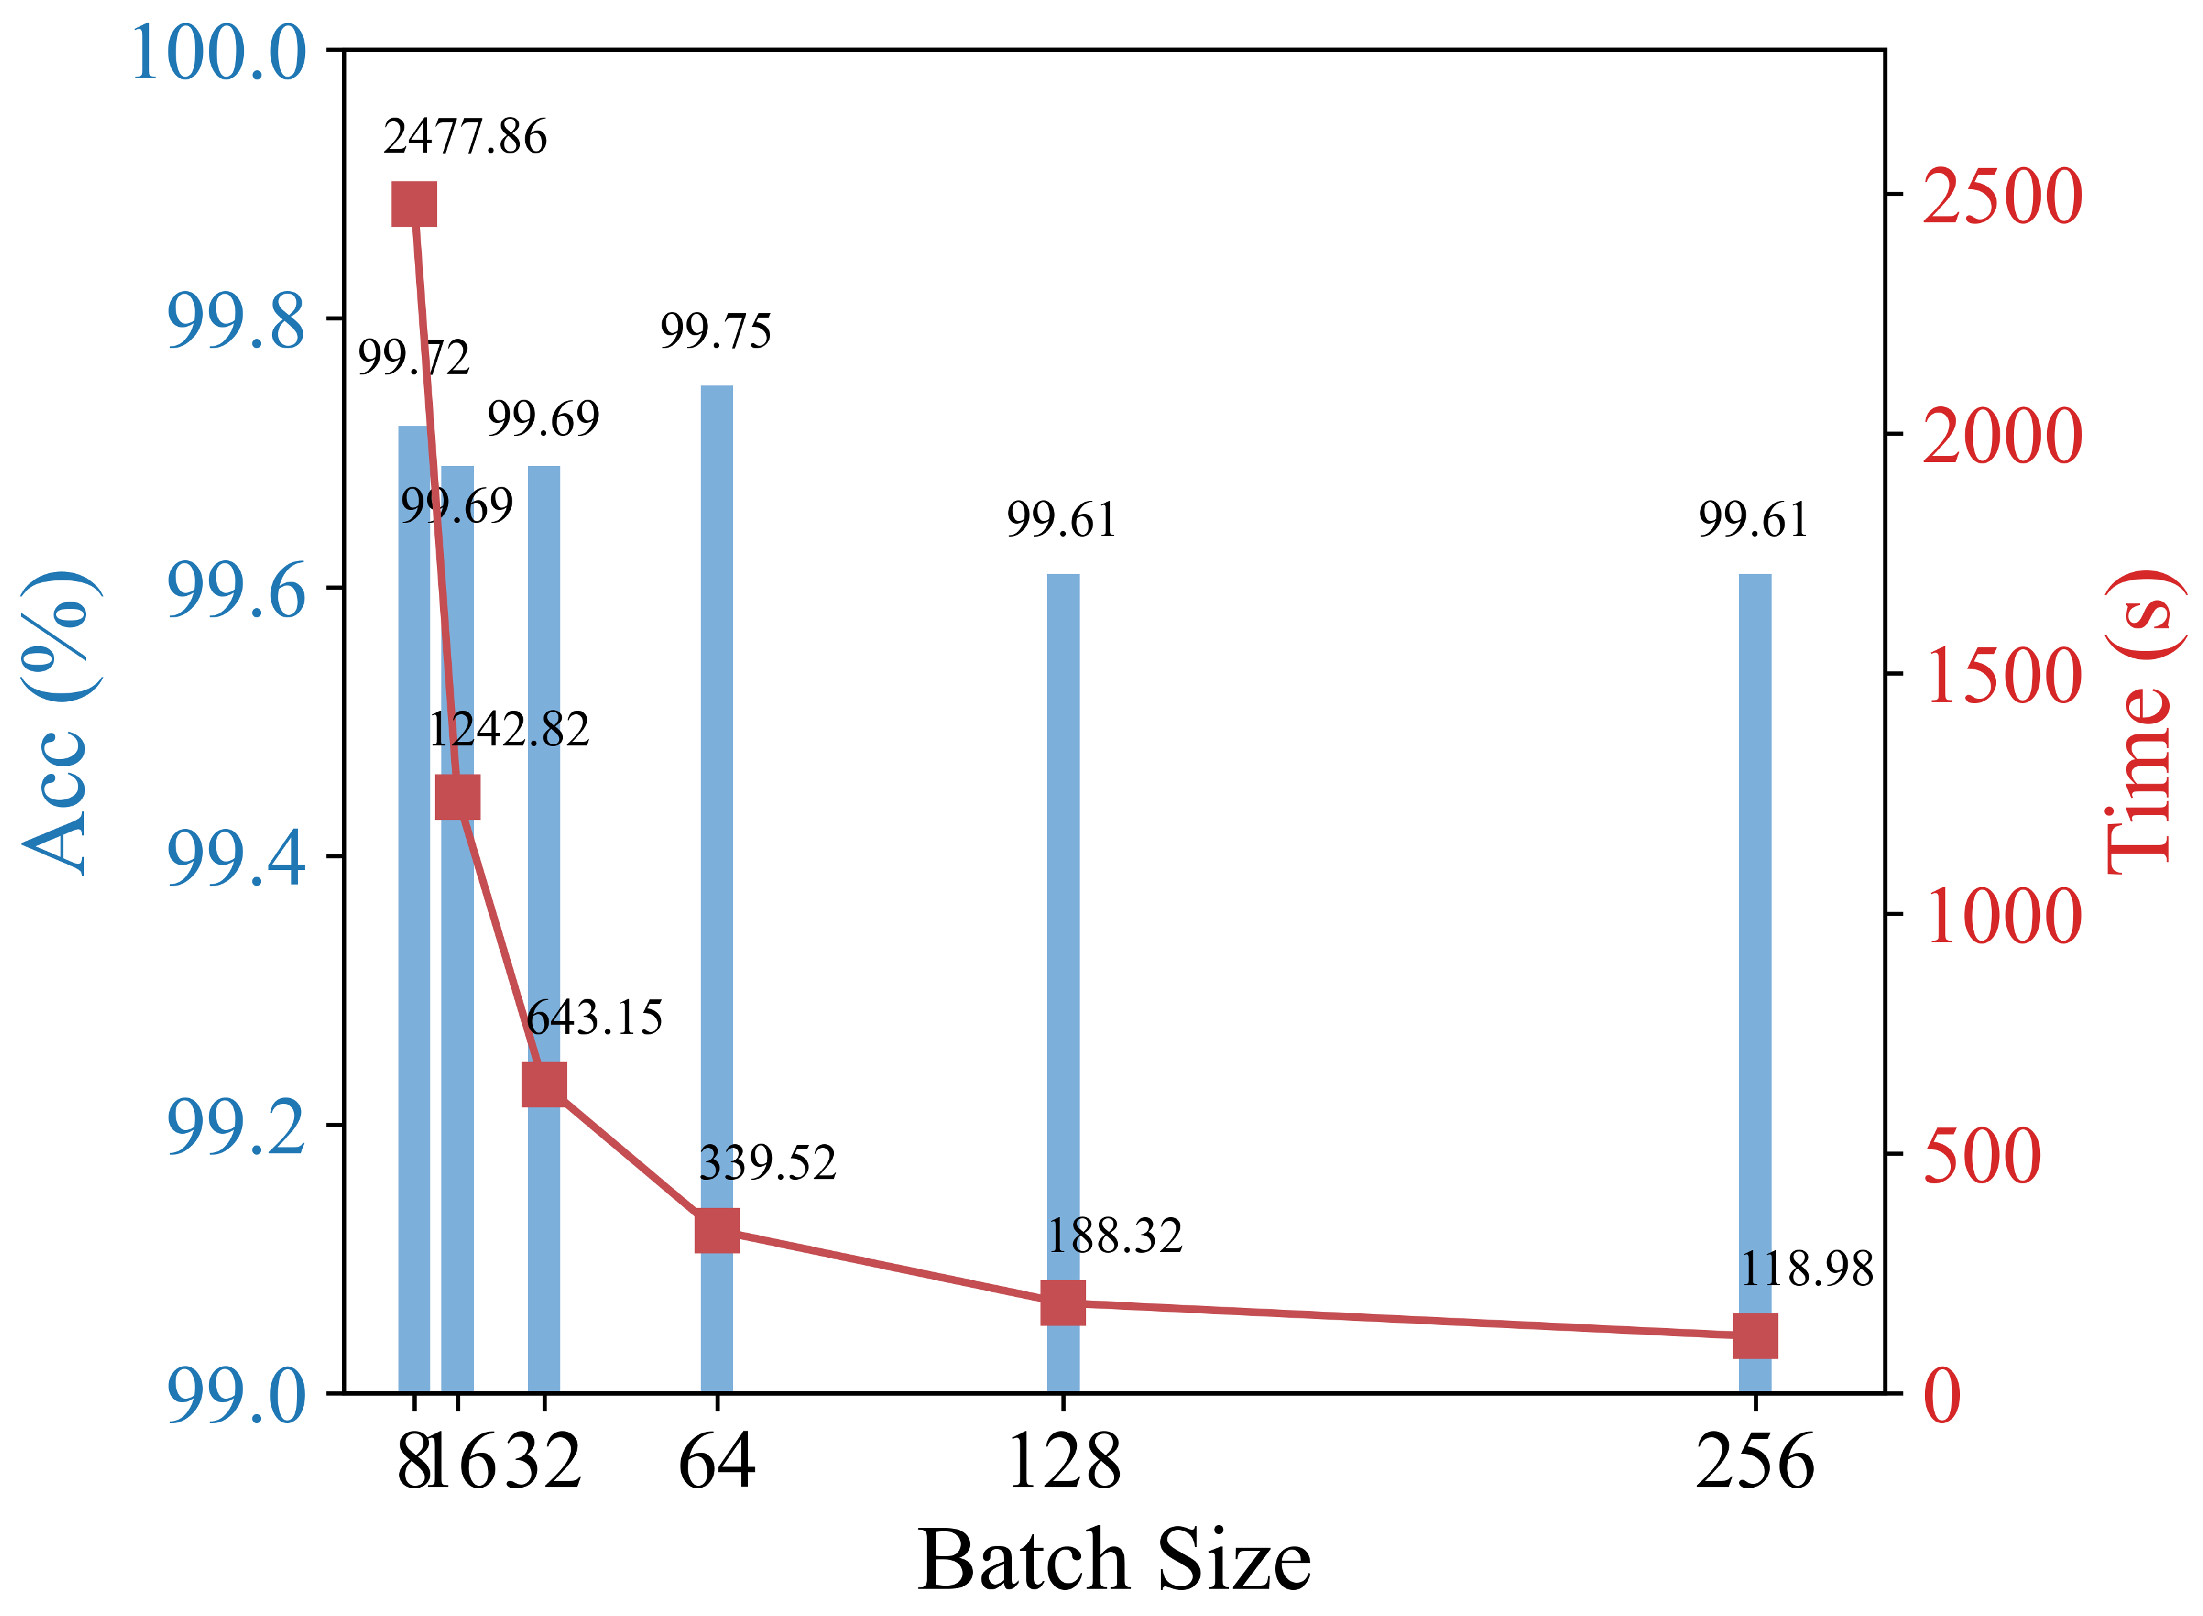
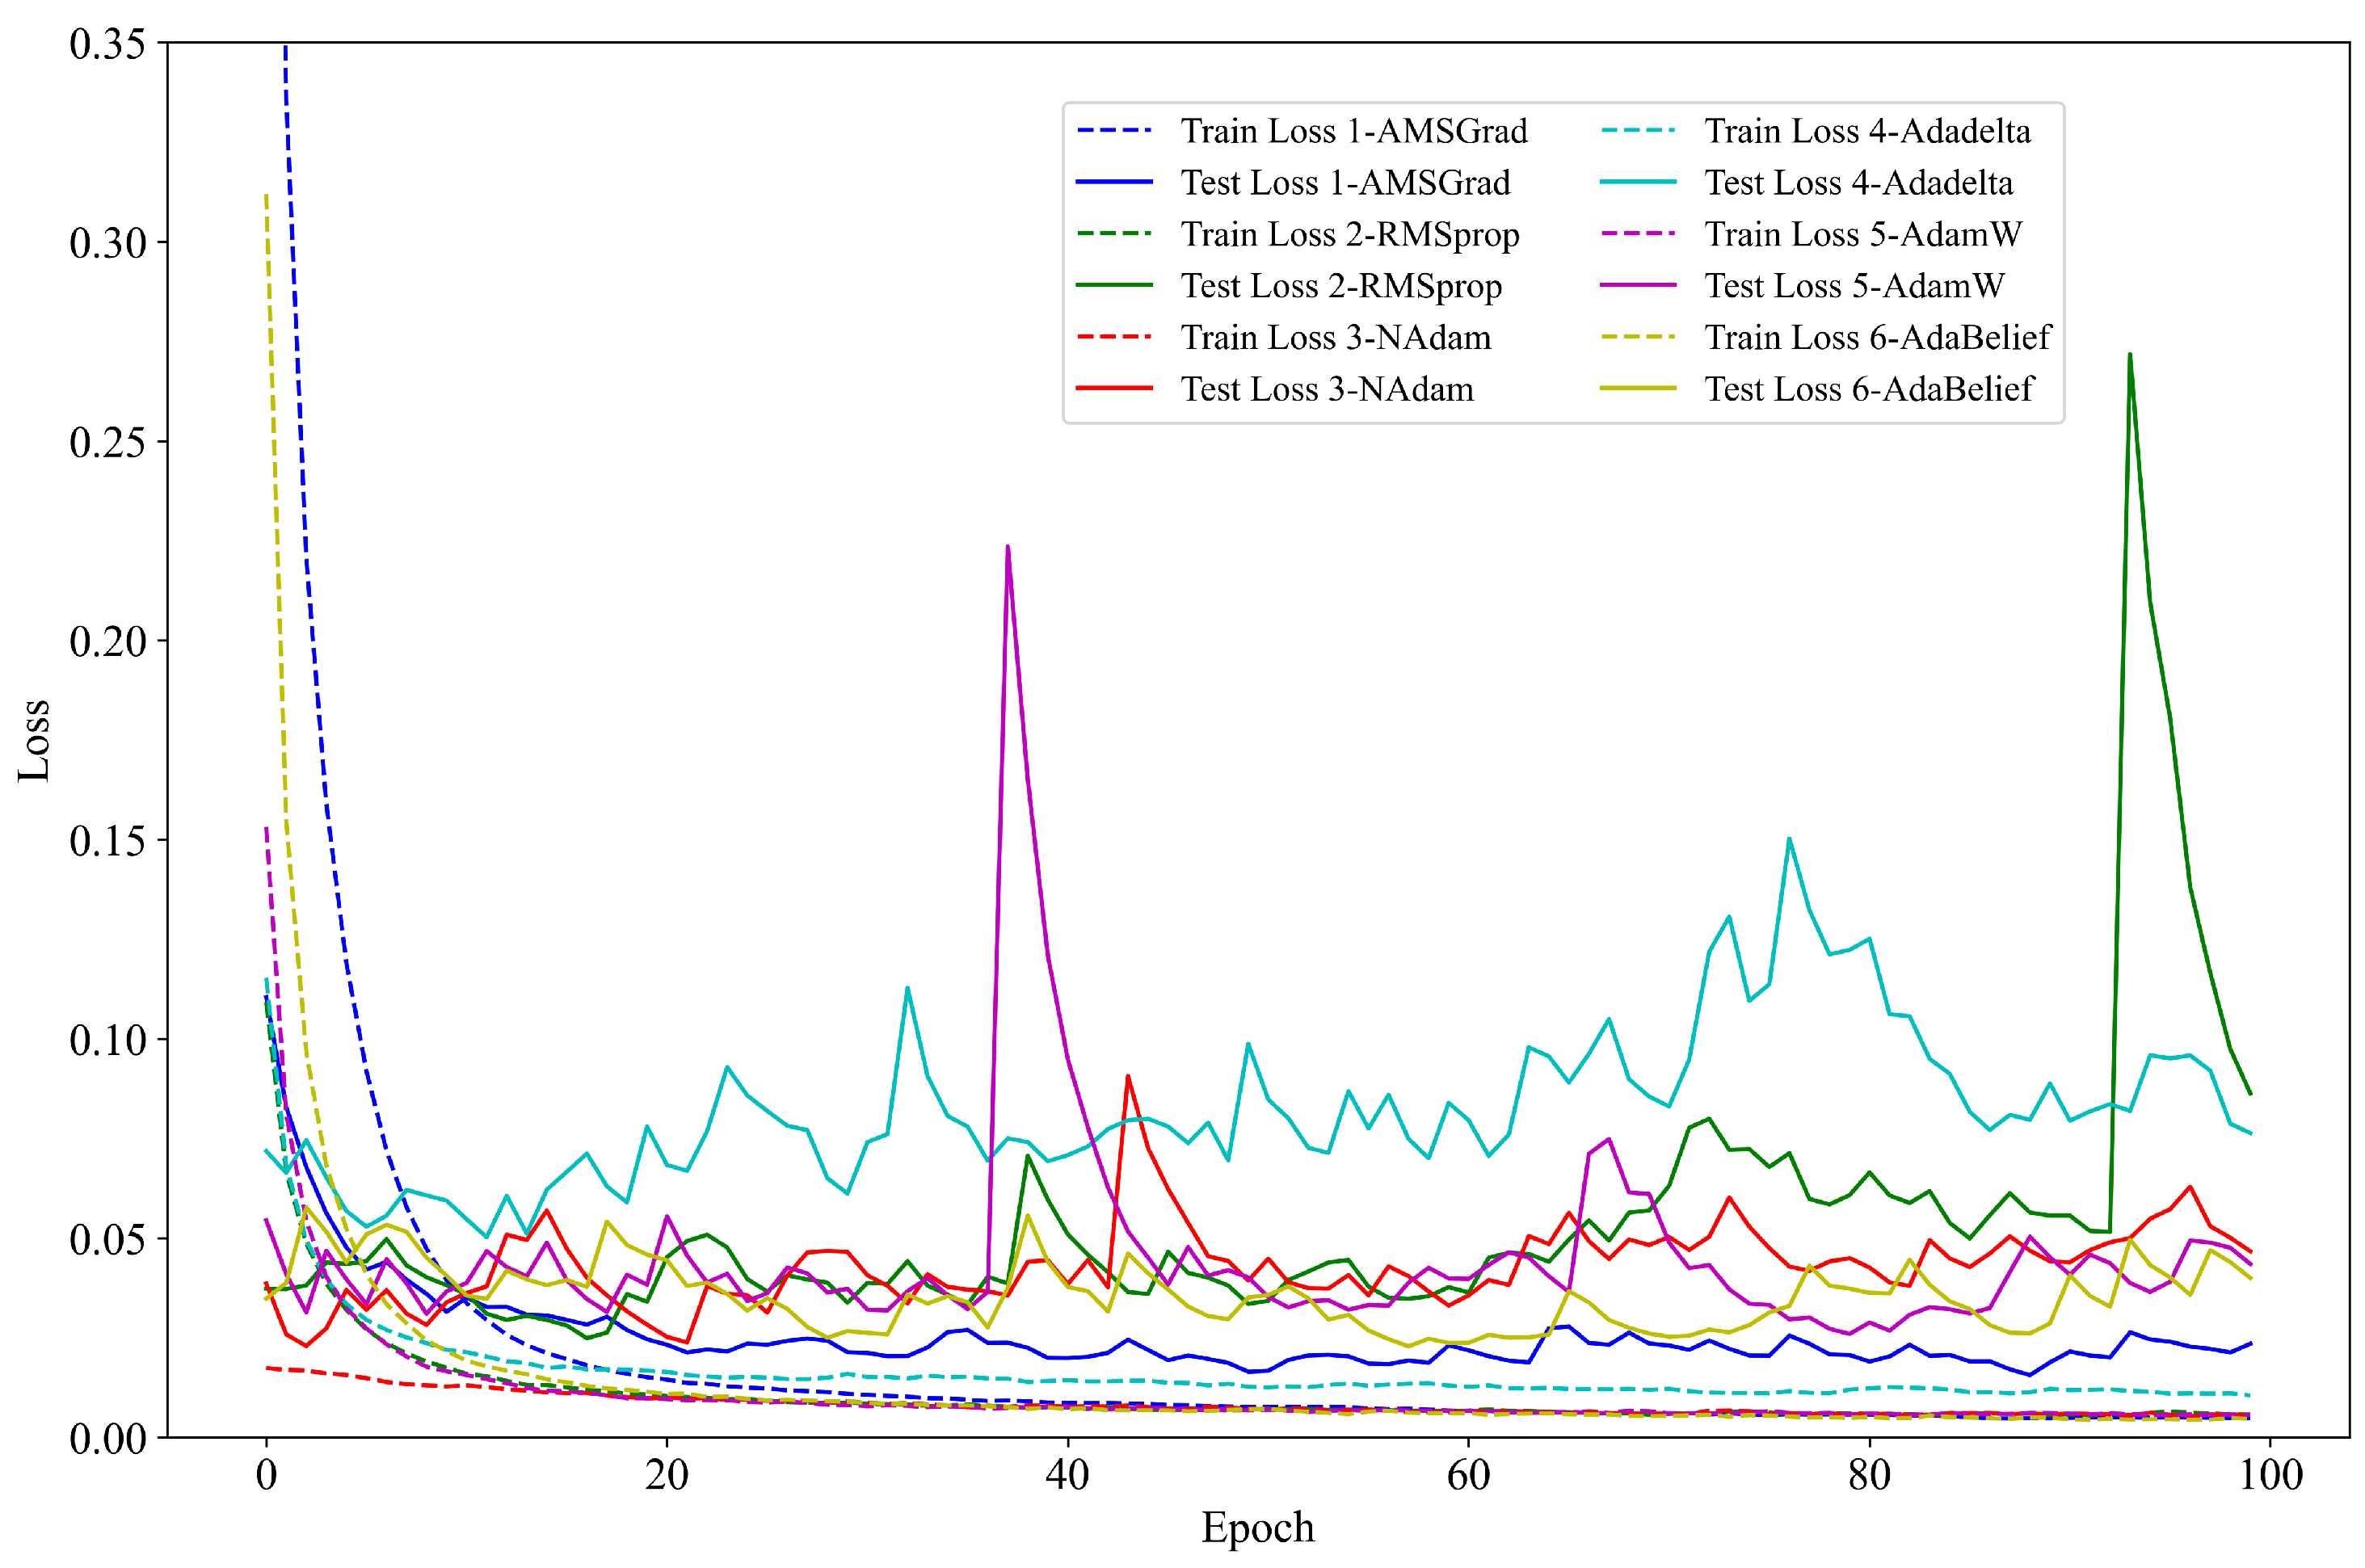
3.2. Model Optimization and Performance Analysis

To ensure the efficiency, accuracy, and stability of the model in practical applications, experiments were conducted using selected 12-band seed cotton–foreign fiber data. This research systematically explored the effects of three key hyperparameters—the batch size, dropout rate, and optimizer—on the model training outcomes.
As shown in Figure 7, the classification accuracy and the training time of the model vary significantly under different dropout rates. Under the conditions where the optimizer is AMSGrad [35], the number of training epochs is 100, and the batch size is 64, the test accuracy reaches the highest value of 99.75% when the dropout rate is set to 0.7. In addition, compared to the configuration with the shortest training time, the total training time increases by only about 2 s when the dropout rate is 0.7. The difference in the training time is negligible.
This experiment tested the model performance under different batch sizes (Figure 8). The results show that when the batch size is set to 64, the model achieves the highest classification accuracy of 99.75%, with a training time of 339.52 s, which is relatively fast.
To determine the most suitable gradient descent optimizer for the seed cotton–foreign fiber detection task, the performance of six mainstream optimization algorithms, including AMSGrad, RMSprop [36], NAdam [37], Adadelta [38], AdamW [39], and AdaBelief [40], was compared. Since each optimizer differs in its gradient update methods and convergence speeds, they directly influence both the training efficiency and final model performance. To illustrate these differences better, the experimental data were smoothed using the Exponentially Weighted Moving Average (EWMA), and the specific details in Figure 9 are enlarged to provide a clearer comparison of each optimizer’s performance.
Figure 9 demonstrates that AMSGrad does not initially have a distinct advantage during the early phases of training and testing. However, as the iterations progress, particularly after 10 epochs, the training and testing accuracy of AMSGrad quickly stabilizes above 98%. Notably, AMSGrad reaches a steady state at around 20 epochs, indicating a faster convergence rate. In contrast, AdaBelief also achieves high accuracy, with both optimizers reaching a maximum accuracy of 99.75%. Upon examining the zoomed-in details, it is evident that AMSGrad exhibits less fluctuations during the entire training process, demonstrating superior stability compared to that of other optimizers.
Figure 10 illustrates the loss value changes for each optimizer throughout the training. AMSGrad not only shows consistently lower loss values but also maintains excellent stability over extended training periods. This further confirms its effectiveness for this specific task. Conversely, optimizers like RMSprop and AdamW show considerable fluctuations at particular iterations, accompanied by sharp increases in the loss values, which suggests that they might be more susceptible to local minima or changes in gradient directions.
In addition to accuracy and loss performance, the potential risk of overfitting was carefully examined. As shown in Figure 9, AMSGrad and AdaBelief exhibit minimal divergence between their training and testing accuracy, indicating their strong generalization capability.
In summary, AMSGrad achieves the best overall performance among the six evaluated optimizers in terms of the classification accuracy, training stability, convergence speed, and generalization ability, making it the most suitable choice for seed cotton–foreign fiber detection. Although AdaBelief also delivers competitive accuracy, its slightly greater fluctuations indicate a lower degree of stability compared to that of AMSGrad. These findings suggest that AMSGrad strikes an optimal balance between performance and robustness and is particularly well suited to real-time sorting systems in production environments requiring both high precision and reliability.
Based on the above analysis, the main hyperparameter settings for DepSE-CNN and the models in the literature are as follows: AMSGrad as the optimizer, 100 training epochs, a batch size of 64, and a dropout rate of 0.7.

3.3. A Comparison of the Proposed Model with Other Algorithms

In the experiment, DepSE-CNN and the models from the literature were tested on the same seed cotton–foreign fiber dataset using 12 selected bands, and DepSE-CNN was additionally tested on 288 bands. The primary focus is on the accuracy, testing time per pixel, Total Params, and Total Mult-Adds. To distinguish between the different models, DepSE-CNN using 12 and 288 bands is named DepSE-CNN-12 and DepSE-CNN-288, respectively. To evaluate the performance of DepSE-CNN and the HWOO, experimental tests were conducted on DepSE-CNN-12, DepSE-CNN-288, and models from the literature using the 12 selected bands.
The four comparative models in Table 4 represent typical 1D-CNN-based approaches applied to hyperspectral tasks. Li et al. [41] and Huang et al. [42] employed full-spectrum inputs without band selection, resulting in higher computational loads. The model by Melit et al. [43] was designed for strawberry classification using sugar content under controlled laboratory conditions. It employed a conventional 1D-CNN architecture with shallow convolutional and dense layers, optimized via hyperparameter tuning, without consideration of the real-time deployment constraints. Guo et al. [44] proposed a 1D-CNN regression model with multiple convolutional layers and full-spectrum hyperspectral data to predict the Fv/Fm index for drought tolerance in cotton, focusing on physiological regression rather than categorical impurity detection. In contrast, the proposed method integrates an effective band selection algorithm (HWOO) with a lightweight attention-based CNN (DepSE-CNN), achieving high accuracy while significantly reducing the feature dimensionality and computational costs, making it well suited to real-time foreign fiber detection in seed cotton production lines. The results are shown in Table 4.
Table 4 shows that the test accuracy of DepSE-CNN-12 reaches 99.75%, outperforming both DepSE-CNN-288 and the other comparative models. This indicates that selecting 12 spectral band features is an effective approach that significantly enhances the model’s classification accuracy. Generally speaking, DepSE-CNN-12 not only surpasses the full-bandwidth DepSE-CNN-288 architecture but also exceeds the performance of the other models evaluated. In practical production environments, the speed of a production line conveyor belt is set at 0.7 m/s, and the models must attain both high accuracy and computational efficiency to meet these high-speed processing demands. To ensure effective foreign fiber detection under these conditions, the processing time per pixel must be under 19.345 μs. With a per-pixel processing time of 12.201 μs, DepSE-CNN-12 not only meets but far exceeds the production line requirements, thus remaining well below the threshold for real-time detection. Compared to the original full-spectrum inference time of 370.1 μs per pixel, this represents a significant improvement, greatly enhancing the feasibility of industrial deployment. The model’s performance is second only to that of the model developed by [44]. Through a lightweight architectural design, DepSE-CNN-12 reduces the total number of parameters to 22,086 and the total number of multiply-add (Total mult-adds) operations to 0.52 M. Among all of the evaluated models, this count is relatively low, second only to the model from the literature [44]. The combination of a lightweight architecture with an attention mechanism substantially reduces the model’s complexity while maintaining its accuracy, making it especially suitable for deployment on resource-limited devices, such as mobile or embedded systems. On account of the application needs in actual production lines, DepSE-CNN-12 possesses significant advantages, especially on edge devices where the accuracy, inference time, and computational resources need to be balanced.
In a real production environment, the key to sorting foreign fibers in seed cotton is to accurately classify seed cotton (label 0) and all non-seed-cotton foreign fibers (label 1–5) as what they are, as shown in Figure 3. The classification performance of each model is evaluated on a test set of 22,846 seed cotton–foreign fiber pixel samples, with a further evaluation using a confusion matrix, as presented in Figure 11. Both DepSE-CNN-12 and DepSE-CNN-288 demonstrate an outstanding performance on label 0 (seed cotton), correctly classifying all 6067 seed cotton samples without any misclassification. This result confirms that the proposed model is capable of reliable and accurate seed cotton detection, avoiding the incorrect classification of seed cotton as foreign fibers. By contrast, the other models from the literature demonstrate a marginally poorer performance on label 0, with minor misclassifications. DepSE-CNN-288 has numerous misclassifications for label 1, incorrectly labeling 876 foreign fiber samples as seed cotton, which seriously impairs its sorting accuracy. DepSE-CNN-12, however, outperforms in this regard, with only 37 foreign fiber samples being misclassified as seed cotton, the lowest figure among all models and 17, 36, 48, and 88 fewer misclassifications than those by the models in the literature [41,42,43,44], respectively. This strong performance is further supported by Figure 11a, where the proposed model maintains a high classification accuracy across all six classes despite the variability in the spectral signatures and potential environmental noise, clearly demonstrating its excellent generalization ability and robustness to the industrial complexity encountered in real-world seed cotton sorting lines. Finally, due to the diversified physical properties of mulch films, such as their adhesion and light refraction, their close contact with cotton and the conveyor belt may result in difficulty in detection, leading to misclassification for label 1 and label 3 across all models. Nonetheless, DepSE-CNN-12 has the fewest misclassifications in these cases. Overall, DepSE-CNN-12 demonstrates a superior performance in meeting the sorting requirements of the production line.
The proposed model was implemented in a foreign fiber detection and sorting production line in Xinjiang, operating stably and efficiently (Figure 12).

4. Conclusions

In this paper, a band selection algorithm based on hyperspectral seed cotton–foreign fiber data is proposed, focusing on the computational power and hardware costs. Additionally, a lightweight CNN sorting architecture that incorporates an attention mechanism is introduced. For the feature selection, the HWOO algorithm is employed as a feature optimization tool, successfully identifying 12 of the most representative and informative bands. A comparison with other common optimization algorithms, such as the GA, PSO, HHO, and WOA, further validates the HWOO’s superiority in feature selection. The selected band subset was then evaluated using KNN classification to demonstrate the effectiveness of classification using the feature selection approach. With regards to detection, the hyperparameter-optimized DepSE-CNN serves as the classifier for the sorting task on the selected 12-band hyperspectral data. Compared with the other CNN architectures in the literature, this proposed architecture demonstrates a higher efficiency, stability, and feasibility. The experimental results confirm that the combination of the HWOO and DepSE-CNN with the optimal parameters achieves a test accuracy of 99.75% and a test time of 12.201 μs per pixel, effectively meeting the sorting requirements for foreign fibers in seed cotton on a production line.
Future work will focus on expanding the high-quality dataset of seed cotton–foreign fibers by incorporating more diverse samples collected under varying environmental and operational conditions. This will enable the construction of a comprehensive, labeled spectral–spatial database. Furthermore, efforts will be directed towards integrating multimodal sensing data (e.g., hyperspectral, polarimetric, and RGB) to develop a fusion-based lightweight detection framework. This approach is expected to improve the classification robustness and real-time performance in foreign fiber sorting lines for seed cotton.

Author Contributions

Y.F.: Data curation; writing—original draft; writing—review and editing; software; methodology; conceptualization; validation; formal analysis. Z.L.: Validation; supervision; project administration. D.W.: Supervision. C.N.: Resources; funding acquisition. All authors have read and agreed to the published version of the manuscript.

Funding

This work was funded by the Xinjiang Autonomous Region Major Science and Technology Project of China (Grant No. 2022A01009).

Institutional Review Board Statement

Not applicable.

Informed Consent Statement

Informed consent was obtained from all of the subjects involved in this study.

Data Availability Statement

The data presented in this study are available on request from the corresponding author.

Acknowledgments

The authors gratefully acknowledge the editors and anonymous reviewers for their constructive comments on our manuscript.

Conflicts of Interest

The authors declare no conflicts of interest.

Abbreviations

The following abbreviations are used in this manuscript:
1DCNNOne-Dimensional CNN
AAMean Accuracy
AccOverall Accuracy
ACOAnt Colony Optimization
ANNArtificial Neural Network
AUCArea Under the ROC Curve
CBConveyor Belt
CNNConvolutional Neural Network
ELMExtreme Learning Machine
EWMAExponentially Weighted Moving Average
FAFirefly Algorithm
FCFilm on Cotton
FCBFilm on the Conveyor Belt
FCLsFully Connected Layers
GAGenetic Algorithm
HHOHarris Hawks Optimization
HSIHyperspectral Imaging
HWOOHarris Hawks and Whale Optimisation Operator
KNNK-Nearest Neighbors
LDALinear Discriminant Analysis
MNFMinimum Noise Fraction
NIRNear-Infrared
PLSPartial Least Squares
PPFCPolypropylene Fibers on Cotton
PPFCBPolypropylene Fibers on the Conveyor Belt
PSOParticle Swarm Optimization
ROIRegion of Interest
SCSeed Cotton
SEM SEModule
SVMSupport Vector Machine
Total mult-addsThe Total Number of Multiply-Adds
WOAWhale Optimization Algorithm

References

  1. Liang, R.; Zhang, L.; Jia, R.; Meng, H.; Kan, Z.; Zhang, B.; Li, Y. Study on friction characteristics between cotton stalk-residual film-external contact materials. Ind. Crop. Prod. 2024, 209, 118022. [Google Scholar] [CrossRef]
  2. Dong, C.; Du, Y.; Ren, W.; Zhao, C. Research progress in optical imaging technology for detecting foreign fibers in cotton. J. Text. Res. 2020, 41, 183–189. [Google Scholar] [CrossRef]
  3. Li, D.; Yang, W.; Wang, S. Classification of foreign fibers in cotton lint using machine vision and multi-class support vector machine. Comput. Electron. Agric. 2010, 74, 274–279. [Google Scholar] [CrossRef]
  4. Zhang, C.; Li, L.; Dong, Q.; Ge, R. Recognition for machine picking seed cotton impurities based on ga-svm model. Trans. Chin. Soc. Agric. Eng. 2016, 32, 189–196. [Google Scholar] [CrossRef]
  5. Wang, S.; Zhang, M.; Wen, Z.; Zhao, Z.; Zhang, R. Residual mulching film detection in seed cotton using line laser imaging. Agronomy 2024, 14, 1481. [Google Scholar] [CrossRef]
  6. Wang, R.; Zhang, Z.-F.; Yang, B.; Xi, H.-Q.; Zhai, Y.-S.; Zhang, R.-L.; Geng, L.-J.; Chen, Z.-Y.; Yan, K.G. Detection and classification of cotton foreign fibers based on polarization imaging and improved yolov5. Sensors 2023, 23, 4415. [Google Scholar] [CrossRef]
  7. Wei, X.; Wu, S.; Xu, L.; Shen, B.; Li, M. Identification of foreign fibers of seed cotton using hyper-spectral images based on minimum noise fraction. Trans. Chin. Soc. Agric. Eng. 2014, 30, 243–248. [Google Scholar] [CrossRef]
  8. Chang, J.; Zhang, R.; Pang, Y.; Zhang, M.; Zha, Y. Classification of impurities in machine-harvested seed cotton using hyperspectral imaging. Spectrosc. Spectr. Anal. 2021, 41, 3552–3558. [Google Scholar] [CrossRef]
  9. Ni, C.; Li, Z.; Zhang, X.; Sun, X.; Huang, Y.; Zhao, L.; Zhu, T.; Wang, D. Online sorting of the film on cotton based on deep learning and hyperspectral imaging. IEEE Access 2020, 8, 93028–93038. [Google Scholar] [CrossRef]
  10. Pal, M.; Foody, G.M. Feature selection for classification of hyperspectral data by svm. IEEE Trans. Geosci. Remote Sens. 2010, 48, 2297–2307. [Google Scholar] [CrossRef]
  11. He, X.; Liu, L.; Liu, C.; Li, W.; Sun, J.; Li, H.; He, Y.; Yang, L.; Zhang, D.; Cui, T.; et al. Discriminant analysis of maize haploid seeds using near-infrared hyperspectral imaging integrated with multivariate methods. Biosyst. Eng. 2022, 222, 142–155. [Google Scholar] [CrossRef]
  12. Hongjun, S. Dimensionality reduction for hyperspectral remote sensing: Advances, challenges, and prospects. Natl. Remote Sens. Bull. 2022, 26, 1504–1529. [Google Scholar] [CrossRef]
  13. Ma, J.-P.; Zheng, Z.-B.; Tong, Q.-X.; Zheng, L.-F. An application of genetic algorithms on band selection for hyperspectral image classification. In Proceedings of the 2003 International Conference on Machine Learning and Cybernetics (IEEE Cat. No. 03EX693), Xi’an, China, 2–5 November 2023; IEEE: New York, NY, USA, 2003; Volume 5, pp. 2810–2813. [Google Scholar] [CrossRef]
  14. Li, S.; Wu, H.; Wan, D.; Zhu, J. An effective feature selection method for hyperspectral image classification based on genetic algorithm and support vector machine. Knowl.-Based Syst. 2011, 24, 40–48. [Google Scholar] [CrossRef]
  15. Su, H.; Du, Q.; Chen, G.; Du, P. Optimized hyperspectral band selection using particle swarm optimization. IEEE J. Sel. Top. Appl. Earth Obs. Remote. Sens. 2014, 7, 2659–2670. [Google Scholar] [CrossRef]
  16. Xu, M.; Shi, J.; Chen, W.; Shen, J.; Gao, H.; Zhao, J. A band selection method for hyperspectral image based on particle swarm optimization algorithm with dynamic sub-swarms. J. Signal Process. Syst. 2018, 90, 1269–1279. [Google Scholar] [CrossRef]
  17. Allegrini, F.; Olivieri, A.C. A new and efficient variable selection algorithm based on ant colony optimization. applications to near infrared spectroscopy/partial least-squares analysis. Anal. Chim. Acta 2011, 699, 18–25. [Google Scholar] [CrossRef]
  18. Zhang, Y.; Li, M.; Zheng, L.; Qin, Q.; Lee, W.S. Spectral features extraction for estimation of soil total nitrogen content based on modified ant colony optimization algorithm. Geoderma 2019, 333, 23–34. [Google Scholar] [CrossRef]
  19. Goodarzi, M.; Coelho, L.d.S. Firefly as a novel swarm intelligence variable selection method in spectroscopy. Anal. Chim. Acta 2014, 852, 20–27. [Google Scholar] [CrossRef]
  20. Su, H.; Yong, B.; Du, Q. Hyperspectral band selection using improved firefly algorithm. IEEE Geosci. Remote Sens. Lett. 2015, 13, 68–72. [Google Scholar] [CrossRef]
  21. Wang, D.; Vinson, R.; Holmes, M.; Seibel, G.; Bechar, A.; Nof, S.; Tao, Y. Early detection of tomato spotted wilt virus by hyperspectral imaging and outlier removal auxiliary classifier generative adversarial nets (or-ac-gan). Sci. Rep. 2019, 9, 4377. [Google Scholar] [CrossRef]
  22. Wang, Z.; Fan, S.; An, T.; Zhang, C.; Chen, L.; Huang, W. Detection of insect-damaged maize seed using hyperspectral imaging and hybrid 1d-cnn-bilstm model. Infrared Phys. Technol. 2024, 137, 105208. [Google Scholar] [CrossRef]
  23. Zhang, B.; Chen, Y.; Rong, Y.; Xiong, S.; Lu, X. Matnet: A combining multi-attention and transformer network for hyperspectral image classification. IEEE Trans. Geosci. Remote Sens. 2023, 61, 1–15. [Google Scholar] [CrossRef]
  24. Chen, T.; Wang, M.; Jiang, Y.; Yao, J.; Li, M. A lightweight diagnosis method for gear fault based on multi-path convolutional neural networks with attention mechanism. Appl. Intell. 2025, 55, 114. [Google Scholar] [CrossRef]
  25. Zhao, Y.; Dong, J.; Li, X.; Chen, H.; Li, S. A binary dandelion algorithm using seeding and chaos population strategies for feature selection. Appl. Soft Comput. 2022, 125, 109166. [Google Scholar] [CrossRef]
  26. Heidari, A.A.; Mirjalili, S.; Faris, H.; Aljarah, I.; Mafarja, M.; Chen, H. Harris hawks optimization: Algorithm and applications. Future Gener. Comput. Syst. 2019, 97, 849–872. [Google Scholar] [CrossRef]
  27. Mirjalili, S.; Lewis, A. The whale optimization algorithm. Adv. Eng. Softw. 2016, 95, 51–67. [Google Scholar] [CrossRef]
  28. Chollet, F. Xception: Deep learning with depthwise separable convolutions. In Proceedings of the IEEE Conference on Computer Vision and Pattern Recognition (CVPR), Honolulu, HI, USA, 21–26 July 2017; pp. 1251–1258. [Google Scholar]
  29. Hu, J.; Shen, L.; Sun, G. Squeeze-and-excitation networks. In Proceedings of the IEEE Conference on Computer Vision and Pattern Recognition (CVPR), Salt Lake City, UT, USA, 18–22 June 2018; pp. 7132–7141. [Google Scholar] [CrossRef]
  30. Ioffe, S.; Szegedy, C. Batch normalization: Accelerating deep network training by reducing internal covariate shift. arXiv 2015, arXiv:1502.03167. [Google Scholar]
  31. Srivastava, N.; Hinton, G.; Krizhevsky, A.; Sutskever, I.; Salakhutdinov, R. Dropout: A simple way to prevent neural networks from overfitting. J. Mach. Learn. Res. 2014, 15, 1929–1958. [Google Scholar]
  32. Holland, J.H. Adaptation in Natural and Artificial Systems: An Introductory Analysis with Applications to Biology, Control, and Artificial Intelligence; no. 53; MIT Press: Cambridge, MA, USA, 1992. [Google Scholar]
  33. Kennedy, J.; Eberhart, R. Particle swarm optimization. In Proceedings of the ICNN’95-International Conference on Neural Networks, Perth, WA, Australia, 27 Novembe–1 December 1995; Volume 4, pp. 1942–1948. [Google Scholar] [CrossRef]
  34. Chi, J.; Bu, X.; Zhang, X.; Wang, L.; Zhang, N. Insights into cottonseed cultivar identification using raman spectroscopy and explainable machine learning. Agriculture 2023, 13, 768. [Google Scholar] [CrossRef]
  35. Reddi, S.J.; Kale, S.; Kumar, S. On the convergence of adam and beyond. arXiv 2019, arXiv:1904.09237. [Google Scholar]
  36. Hinton, G.; Srivastava, N.; Swersky, K. Neural Networks for Machine Learning, Coursera, Video Lectures; University of Toronto: Toronto, ON, Canada, 2012; Volume 264, pp. 2146–2153. Available online: https://www.cs.toronto.edu/~hinton/coursera_lectures.html (accessed on 4 May 2025).
  37. Dozat, T. Incorporating nesterov momentum into adam. In Proceedings of the 4th International Conference on Learning Representations (ICLR), San Juan, Puerto Rico, 2–4 May 2016; Available online: https://openreview.net/forum?id=OM0jvwB8jIp57ZJjtNEZ (accessed on 4 May 2025).
  38. Zeiler, M.D. Adadelta: An adaptive learning rate method. arXiv 2012, arXiv:1212.5701. [Google Scholar]
  39. Loshchilov, I.; Hutter, F. Decoupled weight decay regularization. arXiv 2017, arXiv:1711.05101. [Google Scholar]
  40. Zhuang, J.; Tang, T.; Ding, Y.; Tatikonda, S.C.; Dvornek, N.; Papademetris, X.; Duncan, J. Adabelief optimizer: Adapting stepsizes by the belief in observed gradients. Adv. Neural Inf. Process. Syst. 2020, 33, 18795–18806. [Google Scholar]
  41. Li, X.; Jiang, H.; Jiang, X.; Shi, M. Identification of geographical origin of chinese chestnuts using hyperspectral imaging with 1d-cnn algorithm. Agriculture 2021, 11, 1274. [Google Scholar] [CrossRef]
  42. Huang, J.; He, H.; Lv, R.; Zhang, G.; Zhou, Z.; Wang, X. Non-destructive detection and classification of textile fibres based on hyperspectral imaging and 1d-cnn. Anal. Chim. Acta 2022, 1224, 340238. [Google Scholar] [CrossRef]
  43. Devassy, B.M.; George, S. Contactless classification of strawberry using hyperspectral imaging. In Proceedings of the CEUR Workshop Proceedings, Luxembourg, 3–4 December 2020; Volume 2688, p. 9. Available online: https://ceur-ws.org/Vol-2688/paper9.pdf (accessed on 4 May 2025).
  44. Guo, C.; Liu, L.; Sun, H.; Wang, N.; Zhang, K.; Zhang, Y.; Zhu, J.; Li, A.; Bai, Z.; Liu, X.; et al. Predicting f v/f m and evaluating cotton drought tolerance using hyperspectral and 1d-cnn. Front. Plant Sci. 2022, 13, 1007150. [Google Scholar] [CrossRef]
Figure 1. Representative images of each sample under visible light.
Agriculture 15 01088 g001
Figure 2. Sample acquisition process.
Agriculture 15 01088 g002
Figure 3. Overall experiment workflow diagram.
Agriculture 15 01088 g003
Figure 4. A flowchart for HWOO.
Agriculture 15 01088 g004
Figure 5. DepSE-CNN architecture.
Agriculture 15 01088 g005
Figure 6. Comparison of raw and HWOO feature-selected seed cotton–foreign fiber spectral data. (a) Raw spectra of seed cotton–foreign fiber spectral data samples. (b) Seed cotton–foreign fiber spectral data samples after HWOO feature selection.
Agriculture 15 01088 g006
Figure 7. Model performance under different dropout rates.
Agriculture 15 01088 g007
Figure 8. Impacts of different batch sizes on the classification accuracy and training time.
Agriculture 15 01088 g008
Figure 9. Accuracy performance of six optimizers.
Agriculture 15 01088 g009
Figure 10. Loss performance of six optimizers.
Agriculture 15 01088 g010
Figure 11. Confusion matrix comparison of different models. (a) DepSE-CNN-12. (b) [41]. (c) [42]. (d) [43]. (e) [44]. (f) DepSE-CNN-288.
Agriculture 15 01088 g011
Figure 12. Foreign fiber detection and removal in a seed cotton processing line. (a) The foreign fiber detection process. (b) The automated removal of foreign fibers.
Agriculture 15 01088 g012
Table 1. Details of seed cotton samples with multiple foreign fibers.
Sample ClassClass LabelTraining Set (Pixels)Testing Set (Pixels)
SC014,1576067
FC188993814
PPFC277323314
FCB373233138
PPFCB456912439
CB595054074
Table 2. Comparison of KNN classification performance after feature selection of each optimization algorithm.
AlgorithmBandsAcc (%)AUC (%)Time (s)
Label0 1Label1 2Label2 3Label3 4Label4 5Label5 6
Original28881.1894.7357.8698.6294.1199.9699.158.47
GA10786.4397.5471.7397.7399.0099.9799.944.39
PSO10886.4697.2373.5798.0098.8899.9399.884.39
HHO1692.4598.5684.0499.0698.8999.9699.842.82
WOA1791.8797.9083.4099.4498.8399.9799.562.86
HWOO1293.0598.3183.9298.7998.7499.9699.811.68
1 Label0 represents SC. 2 Label1 represents FC. 3 Label2 represents PPFC. 4 Label3 represents FCB. 5 Label4 represents PPFCB. 6 Label5 represents CB.
Table 3. Band selection and classification performance analysis of HWOO, HHO, and WOA algorithms on KNN models.
AlgorithmBandsAcc (%)AA (%)KappaTime (s)
HHO1692.4593.8090.752.82
3292.0893.6690.273.12
2992.4593.4290.753.32
1992.1393.0690.363.03
2292.5293.6490.823.00
WOA2790.9592.4188.883.09
3091.8493.0789.983.12
2392.8493.9591.233.03
1791.8793.7790.023.07
1993.0494.5191.462.80
HWOO1292.6493.5890.981.85
1391.5493.7189.591.87
2692.6593.6990.993.20
1992.7793.8391.132.99
1293.0594.2791.481.76
Table 4. Comparison of performance and architecture metrics of different models.
ModelAcc (%)Per-Pixel Test Time (µs)Model Architecture Metrics
Total ParametersTotal Mult-Adds (M)
DepSE-CNN-1299.7512.20122,0860.52
[41]84.7514.04941,1901.12
[42]99.3019.73497,7341.80
[43]98.6812.82728,7100.64
[44]97.6510.26532170.38
DepSE-CNN-28892.2523.5815,920,64668.87
Disclaimer/Publisher’s Note: The statements, opinions and data contained in all publications are solely those of the individual author(s) and contributor(s) and not of MDPI and/or the editor(s). MDPI and/or the editor(s) disclaim responsibility for any injury to people or property resulting from any ideas, methods, instructions or products referred to in the content.

