Article

Biomass, Physiological, and Antioxidant Activity Responses of Wheat Plants After Selenium Foliar Spray Under Water Deficit

1
Centre for the Research and Technology of Agro-Environmental and Biological Sciences (CITAB), University of Trás-os-Montes and Alto Douro, Quinta de Prados, 5000-801 Vila Real, Portugal
2
MORE—Laboratório Colaborativo Montanhas de Investigação, Edificio do Brigantia Ecopark, Avª Cidade de Leon, 5300-358 Bragança, Portugal
3
CIMO—Mountain Research Center, LA SusTEC—Associated Laboratory for Sustainability and Technology in Inland Regions, Instituto Politécnico de Bragança, Campus de Santa Apolónia, 5300-253 Bragança, Portugal
4
Inov4Agro—Institute for Innovation, Capacity Building and Sustainability of Agri-Food Production, University of Trás-os-Montes and Alto Douro, 5000-801 Vila Real, Portugal
5
Chemistry Department, University of Trás-os-Montes and Alto Douro, 5000-801 Vila Real, Portugal
6
Plant Cytogenomics Laboratory, Department of Genetics and Biotechnology, University of Trás-os-Montes and Alto Douro, Quinta de Prados, 5000-801 Vila Real, Portugal
*
Author to whom correspondence should be addressed.
Agriculture 2025, 15(10), 1086; https://doi.org/10.3390/agriculture15101086
Submission received: 24 March 2025 / Revised: 6 May 2025 / Accepted: 13 May 2025 / Published: 17 May 2025
(This article belongs to the Section Crop Production)

Abstract

:
The ability of selenium (Se) to trigger modifications in plant metabolism, thereby triggering tolerance to abiotic stresses, is well established. This research aimed to understand the following: (1) how Se supplementation in wheat plants can lead to beneficial Se concentrations in grains and straw; (2) whether the applied Se concentrations have any negative impacts on plant performance; and (3) if Se can aid wheat development under water-limited conditions. To address this, we evaluated the physiological, biochemical, and morphological effects of foliar Se application on wheat plants subjected to well-watered (WW, full irrigation) and water-deficit (WD, 25% of full irrigation) regimes. Three foliar concentrations of sodium selenate (Se) solution (0, 16, and 160 g ha−1 Se) were tested. Under WW, treatment with 160 g/ha leads to the highest Se content in straw (4253 ± 171 µg plant−1), enhanced straw biomass accumulation, and increased total soluble sugar content. WW plants treated with 16 g/ha Se were found to have the highest amounts of photosynthetic pigments and total soluble proteins. Under WD, Se treatments increased spike length, total phenols, and ortho-diphenols when compared to Se-untreated plants. In general, Se treatments increased the Se contents in both straw and grains, but with a noticeably higher accumulation in straw. Altogether, the results suggest that foliar application of 160 g/ha Se, under irrigation, is a promissory approach to enhance Se content in bread wheat.

1. Introduction

Selenium (Se) is an important mineral for plants and a potent antioxidant for humans [1]. According to Jiang, et al. [2], 10–15% of people on the planet are estimated to be Se-deficient. This deficiency is caused by inadequate Se intake in the diet, which can lead to various health issues, including increased susceptibility to viral infections, thyroid dysfunction, cancer, and cardiovascular illnesses [1,3]. Low Se concentrations were found to be present in many agricultural soils worldwide, reducing its availability to plants [3]. Crop cultivation in soils with low Se levels often result in food with inadequate Se content. Previous studies have shown positive effects concerning the nutritional quality of food when plants were supplied with Se via agronomic biofortification [4]. Agronomic biofortification is considered an efficient, feasible, and economical approach for overcoming ‘hidden-hunger’, producing food (e.g., grains/seeds) and other co-products (e.g., straw) with an increased content of micronutrients, including Se [2,5,6,7].
Increasing the concentration of minerals in the edible parts of plants requires improved uptake from the soil, improved translocation from roots to the leaves and then to grains, and efficient sequestration into the endosperm [7]. The application method, fertilizer type, and mineral concentration are critical to guaranteeing the objectives of biofortification programs [8]. Nutrients and minerals can be applied to the seeds via soaking or priming treatments, soil and water fertilization, or applied exogenously onto leaves through foliar spraying. Over other types of applications, nutrient foliar application is a promissory approach for Se biofortification, with many advantages due to its rapid and direct delivery to specific parts of the plant or during specific growth stages, optimizing nutrient uptake and plant development [9]. However, a limited number of studies have addressed Se uptake and its content in plants and grains, an aspect known to be affected by Se application methods [10]. Importantly, the biochemical form of Se (e.g., sodium selenite or sodium selenate) to be used must be carefully selected, as factors such as pH, organic matter content, soil aeration and moisture, and interactions with other elements can affect Se uptake, mobility, and use by plants [11]. In some tropical soils, the availability of Se was found to be decreased by the adsorption of selenite onto iron and aluminum oxides [12]. Alternatively, if applied as selenate, it can also be adsorbed onto oxidic surfaces, which tend to be more available to plants [8,13,14]. Another aspect is the mobility within the plant, with selenate being readily translocated from roots to shoots; moreover, selenite is less movable, with significant accumulation in the roots [15].
The improved antioxidant activity triggered by Se was found to positively affect photosynthesis metabolism, photosynthetic pigments [16,17], stomatal conductance, intercellular CO2 concentration, and transpiration efficiency [18]. However, at high concentrations, Se can be toxic to certain plants, causing growth reduction, alteration in photosynthetic pigments, and the appearance of chlorosis [19]. On the other hand, low Se application increases the activities of antioxidant enzymes, reducing reactive oxygen species (ROS) and lipid peroxidation [20]. Although the benefits of Se are evident, studies on the enrichment of cultivated plants with Se in agroecosystems are still incipient, supporting the need of deploying of innovative strategies that would allow the increase in Se content in plants.
Given their widespread consumption, staple crops like rice, wheat, maize, sorghum, millet, sweet potato, and legumes are relevant targets for agronomic biofortification with Se to tackle dietary deficiency [11]. Bread wheat (Triticum aestivum L.) is one of the most cultivated crops globally, with a production area estimated at approximately 219 million hectares (~786 million tons) in the last four years [21]. The consumption of this staple food accounts for 19% of the calories in the global human diet, since the grain is rich in carbohydrates and has a higher protein content than other cereals such as rice, maize, and rye [22,23]. Current knowledge about the capability of wheat crop to uptake and incorporate Se into its tissues or organs, the plant’s availability and consumption, and effects of Se on plant development and growth remains scarce. This gap of knowledge limits the development of biofortification approaches. Many studies have tested using foliar spray and soil fertilization for Se crop supplementation during plant development. The concentrations tested were below 100 g Se ha−1, and, generally, a positive effect on plant growth and development was noticed [5,24,25]. Most studies focused more on the yield and seed Se content at the mature stage and less on germination, plant development, and morphologic or physiologic responses, which contribute to final agronomic traits [26,27,28]. Similarly to other plants, low water availability has been considered a major factor affecting grain yield and quality in wheat [29,30,31,32].
Little is known about the effects of Se in modulating plants’ response to abiotic stress as drought or water deficit. In a previous study conducted by our team, we investigated the effects of Se seed soaking as a pre-sowing seed treatment in bread wheat [33]. The effects of 0, 2.5, and 25 mM Se in 12 h seed soaking treatments were studied along the wheat crop cycle under water-deficit (WD) and well-watered (WW) conditions. The results suggested that 12 h soaking with 2.5 mM Se is a promissory pre-sowing approach to enhance bread wheat grain and straw biomass, particularly under water-limited conditions.
In view of our previous findings, this study addresses the suitability of Se foliar application as a strategy for Se biofortification of wheat. The main objective was to test the hypothesis that foliar Se application enriches grains of bread wheat cv “Jordão” with Se while improving its performance under water deficit. To address this hypothesis, a pot experiment was conducted to evaluate the effect of three selenium concentrations (0, 16, and 160 g ha−1) on wheat physiological, biochemical, morphological, and yield parameters under well-watered (WW) and water-deficit (WD) conditions. The accumulation of Se in vegetative and grain tissues was also assessed. At the end, we expect to provide an effective Se biofortification approach that would constitute a cost-effective, faster, and simple method for farmers to supplement Se for crop production in a limited-water environment.

2. Materials and Methods

2.1. Plant Material

The Triticum aestivum L. seeds of the cultivar “Jordão” used were provided by the Plant Breeding Station of Instituto Nacional de Investigação Agrária e Veterinária (Elvas, Portugal). The seeds were harvested in the summer, stored in standard seed bank conditions (−20 °C, relative humidity below 25%, and dark conditions), and sown in December. The cultivar “Jordão” was part of the Portuguese Catalogue of Varieties from 1996 to 2020 [34] and is one of the most representative varieties of bread wheat in the country [35]. Some characteristics, such as good adaptation to Mediterranean conditions, semi-precocious vegetative cycle, great tillering capacity, high productive performance, high baking potential, and high resistance against several wheat diseases [36], encourage the selection of this variety for laboratory and field experiments.

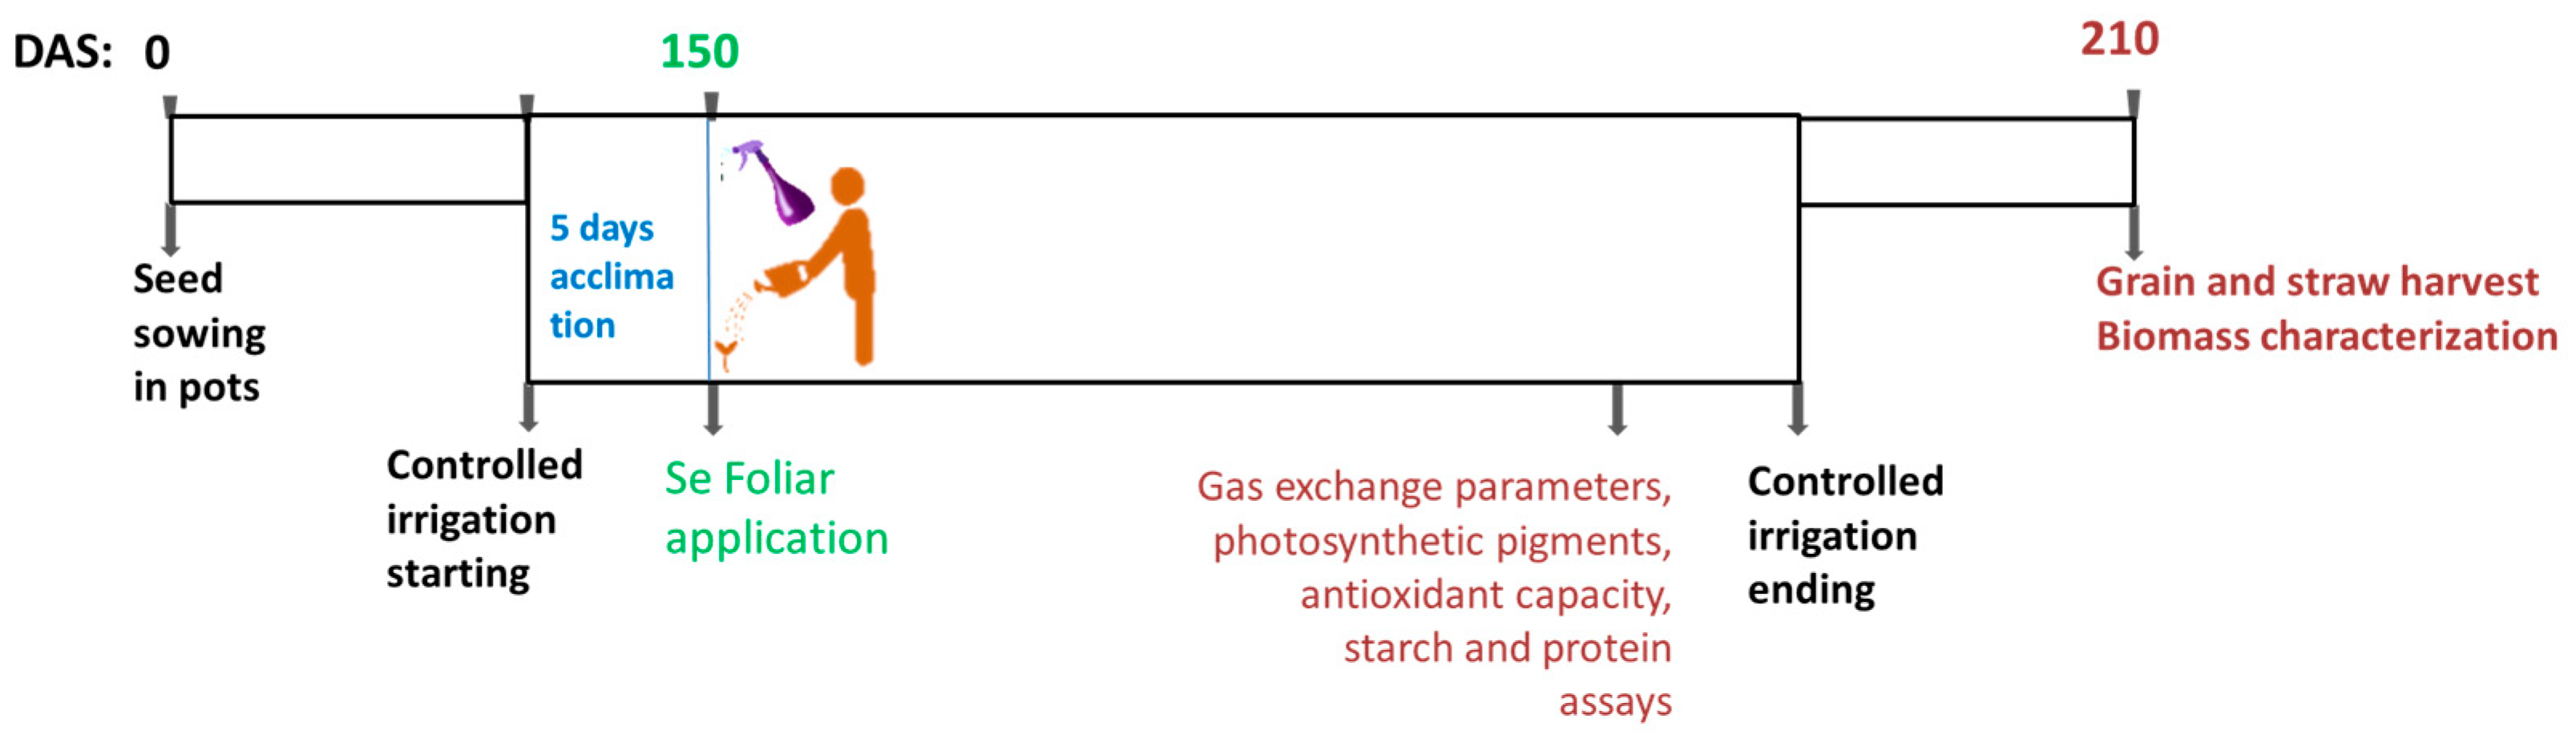
2.2. Pot Trial Description

A pot experiment was conducted to evaluate the effect of three selenium concentrations, 0, 16, and 160 g ha−1, on wheat physiological, biochemical, morphological, and yield parameters under well-watered (WW) and water-deficit (WD) conditions. For each experimental condition studied, 10 pots were used, with four seeds per pot sown evenly at 2–3 cm deep using a hand drill. The experiment was carried out at the University of Trás-os-Montes and Alto Douro in Vila Real, Northeast Portugal (41°17′07.0″ N, 7°44′23.5″ W, 465 m a.s.l.). The 6 L pots were filled with typical local soil mixed with peat in 3:1 (v/v) proportion. The soil is classified as acidic sandy loam Dystric Cambisol (68% sand, 22% silt, 10% clay), with a water pH of 5.2, 2.8% of organic matter, 48 mg kg−1 of available P (Egner–Riehm), and 130 mg kg−1 of available K (Egner–Riehm). The pots were maintained in rainfed conditions until the jointing phase of the wheat growth stage [37] (Figure 1). Then, the pots were moved to the inside of the greenhouse (145 Days After Sowing—DAS), and, after 5 days of acclimation period, differential irrigation was carried out (150 DAS) through two water regimes, as follows: well-watered (WW, irrigation at Field Capacity—FC) and water-deficit (WD, irrigation at 25% FC) conditions. For this purpose, a portable TDR miniTrase (Soil Moisture Equipment Corp., Goleta, CA, USA) was used to monitor water content in the soil to maintain the defined WW and WD conditions. The Se foliar treatments were applied by spraying leaves following excellent standard procedures and efficacy practices adjusted for agricultural experiments. The three Se solutions (0, 16, and 160 g ha−1 Se) were prepared with distilled water, sodium selenate (Na2SeO4·10H2O, Sigma Aldrich, St. Louis, MO, USA), and Tween 20 (0.1%). The solutions were freshly prepared, and 500 mL solution was homogeneously applied to each set of 10 pots using a hand sprayer during the mid-morning. Pots with the target plants were surrounded with plastic barriers to avoid spraying nearby plants. A total of 30 days after initiating controlled irrigation (150 DAS), the pots were left non-irrigated until harvest (210 DAS) in the greenhouse. This mimicked the natural reduction in precipitation and the increase in temperature characteristic of late spring and early summer that drives the final dehydration of the plant and maturation of the wheat grain. During all stages of wheat plant development, weeds were meticulously controlled to avoid nutrient and water competition.

2.3. Gas Exchange and Chlorophyll a Fluorescence Measurements

Leaf gas exchange and chlorophyll fluorescence measurements were performed 20 days after the beginning of the experiment (175 DAS). Measurements were conducted in the morning (10–13 h) in fully developed leaves without visible blemishes. For each experimental condition, two leaves from two plants per pot (in a total 12 measurements = 6 pots) were used to make this analysis.
Leaf gas exchange was measured with a portable infrared gas analyzer (LCpro+ ADC BioScientific Ltd., Hoddesdon, UK) under greenhouse conditions, operating in the open mode (1020 μmol m−2 s−1 PAR, 400 ppm CO2, 25 ± 2 °C, and 50–60% relative humidity). The net CO2 assimilation rate (A), stomatal conductance (gs), transpiration rate (E), and the ratio of intracellular to atmospheric CO2 concentration (Ci/Ca) were estimated according to von Caemmerer and Farquhar [38]. Intrinsic water use efficiency was calculated using the ratio of A/gs.
Chlorophyll a fluorescence was measured on the same leaves, and environmental conditions were used for gas exchange measurements with a pulse amplitude modulated FMS 2 fluorimeter (Hansatech Instruments, Norfolk, UK). Leaves were dark-adapted using leaf clips for 30 min before measurement. Minimum fluorescence (F0), maximum fluorescence (Fm), variable fluorescence (Fv), light-adapted steady-state fluorescence yield (Fs), maximum efficiency of PSII (Fv/Fm), the quantum yield of PSII (ΦPSII), photochemical quenching (qP), non-photochemical quenching (NPQ), non-photochemical energy dissipation (ΦNP), and apparent electron transport rate (ETR) were determined following the methodology described by Rocha, et al. [33].

2.4. Pigments, Protein, Sugars, and Antioxidant Measurements

After physiological measurements, 12 random fresh leaves were collected per treatment, frozen in liquid nitrogen, transported to the laboratory for grinding, and stored at −80 °C until use. Chlorophylls (Chl a and Chl b) and total carotenoids (Car) were extracted from the frozen material by homogenization with 80% (v/v) acetone following previously published methodologies [33].
Total soluble proteins (TSP) were quantified by the method of Bradford [39], using bovine serum albumin as a standard. Total soluble sugars (TSS) were quantified spectrophotometrically by the anthrone method, using glucose as a standard dilution curve. The extraction was performed according to Irigoyen, et al. [40] by heating the samples in ethanol/water (80/20, v/v) for 1 h at 80 °C.
The content of total phenolic compounds (TP), total flavonoids (TF), ortho-diphenols (OD), and ABTS+ radical was determined using a classical colorimetry procedure. Quantification procedures and the phenolic composition extraction method were carried out as described by Rocha, et al. [33].
A UV-Vis Spectrophotometer (Varian Cary 100 bio, Spectralab Scientific Inc., Markham, ON, Canada) was used to retrieve the absorbance values used for the calculation of pigments, TSP, and TSS. For quantifications of TP, TF, OD, and ABTS, a microplate reader (Multiskan™ GO Microplate Spectrophotometer, Thermo Scientific, Vantaa, Finland) was used.

2.5. Yield and Biomass Measurements

Twenty plants per experimental condition were randomly selected and harvested at the ripening stage (GS92, Zadoks Growth Stage). The stem length, spike length, number of tillers per plant, total grain number, thousand-grain weight, grain biomass, grain harvest index, straw biomass, and vegetative biomass parameters were determined at the maturity stage. The harvest index (HI = grain weight/total above-ground biomass at physiological maturity) was calculated.

2.6. Selenium Determination

Dried grain and straw samples were ground in a grain mill (Retsch Ultra Centrifugal Mill ZM 200, Retsch, Haan, Germany) using a 1.0 mm screen. After this, two hundred milligrams of the sample was weighed and transferred to a 160 mm × 16 mm acid-washed glass culture tube for digestion with the nitric acid procedure as described by Boldrin, et al. [41]. The detailed extraction method and quantification procedures were performed essentially according to Rocha, et al. [33].

2.7. Statistical Analysis

Data analysis was performed using the software JMP for Windows (v14.0). After testing ANOVA assumptions (homogeneity of variances and normality), statistical differences were evaluated by two-way analysis of variance (ANOVA), followed by the post hoc Tukey’s test (p < 0.05). Analysis was carried out by testing the effect of the water availability (W), Se treatment (S), and the interaction of both factors (W × S) on the evaluation of morphological, physiological, and biochemical parameters.

3. Results

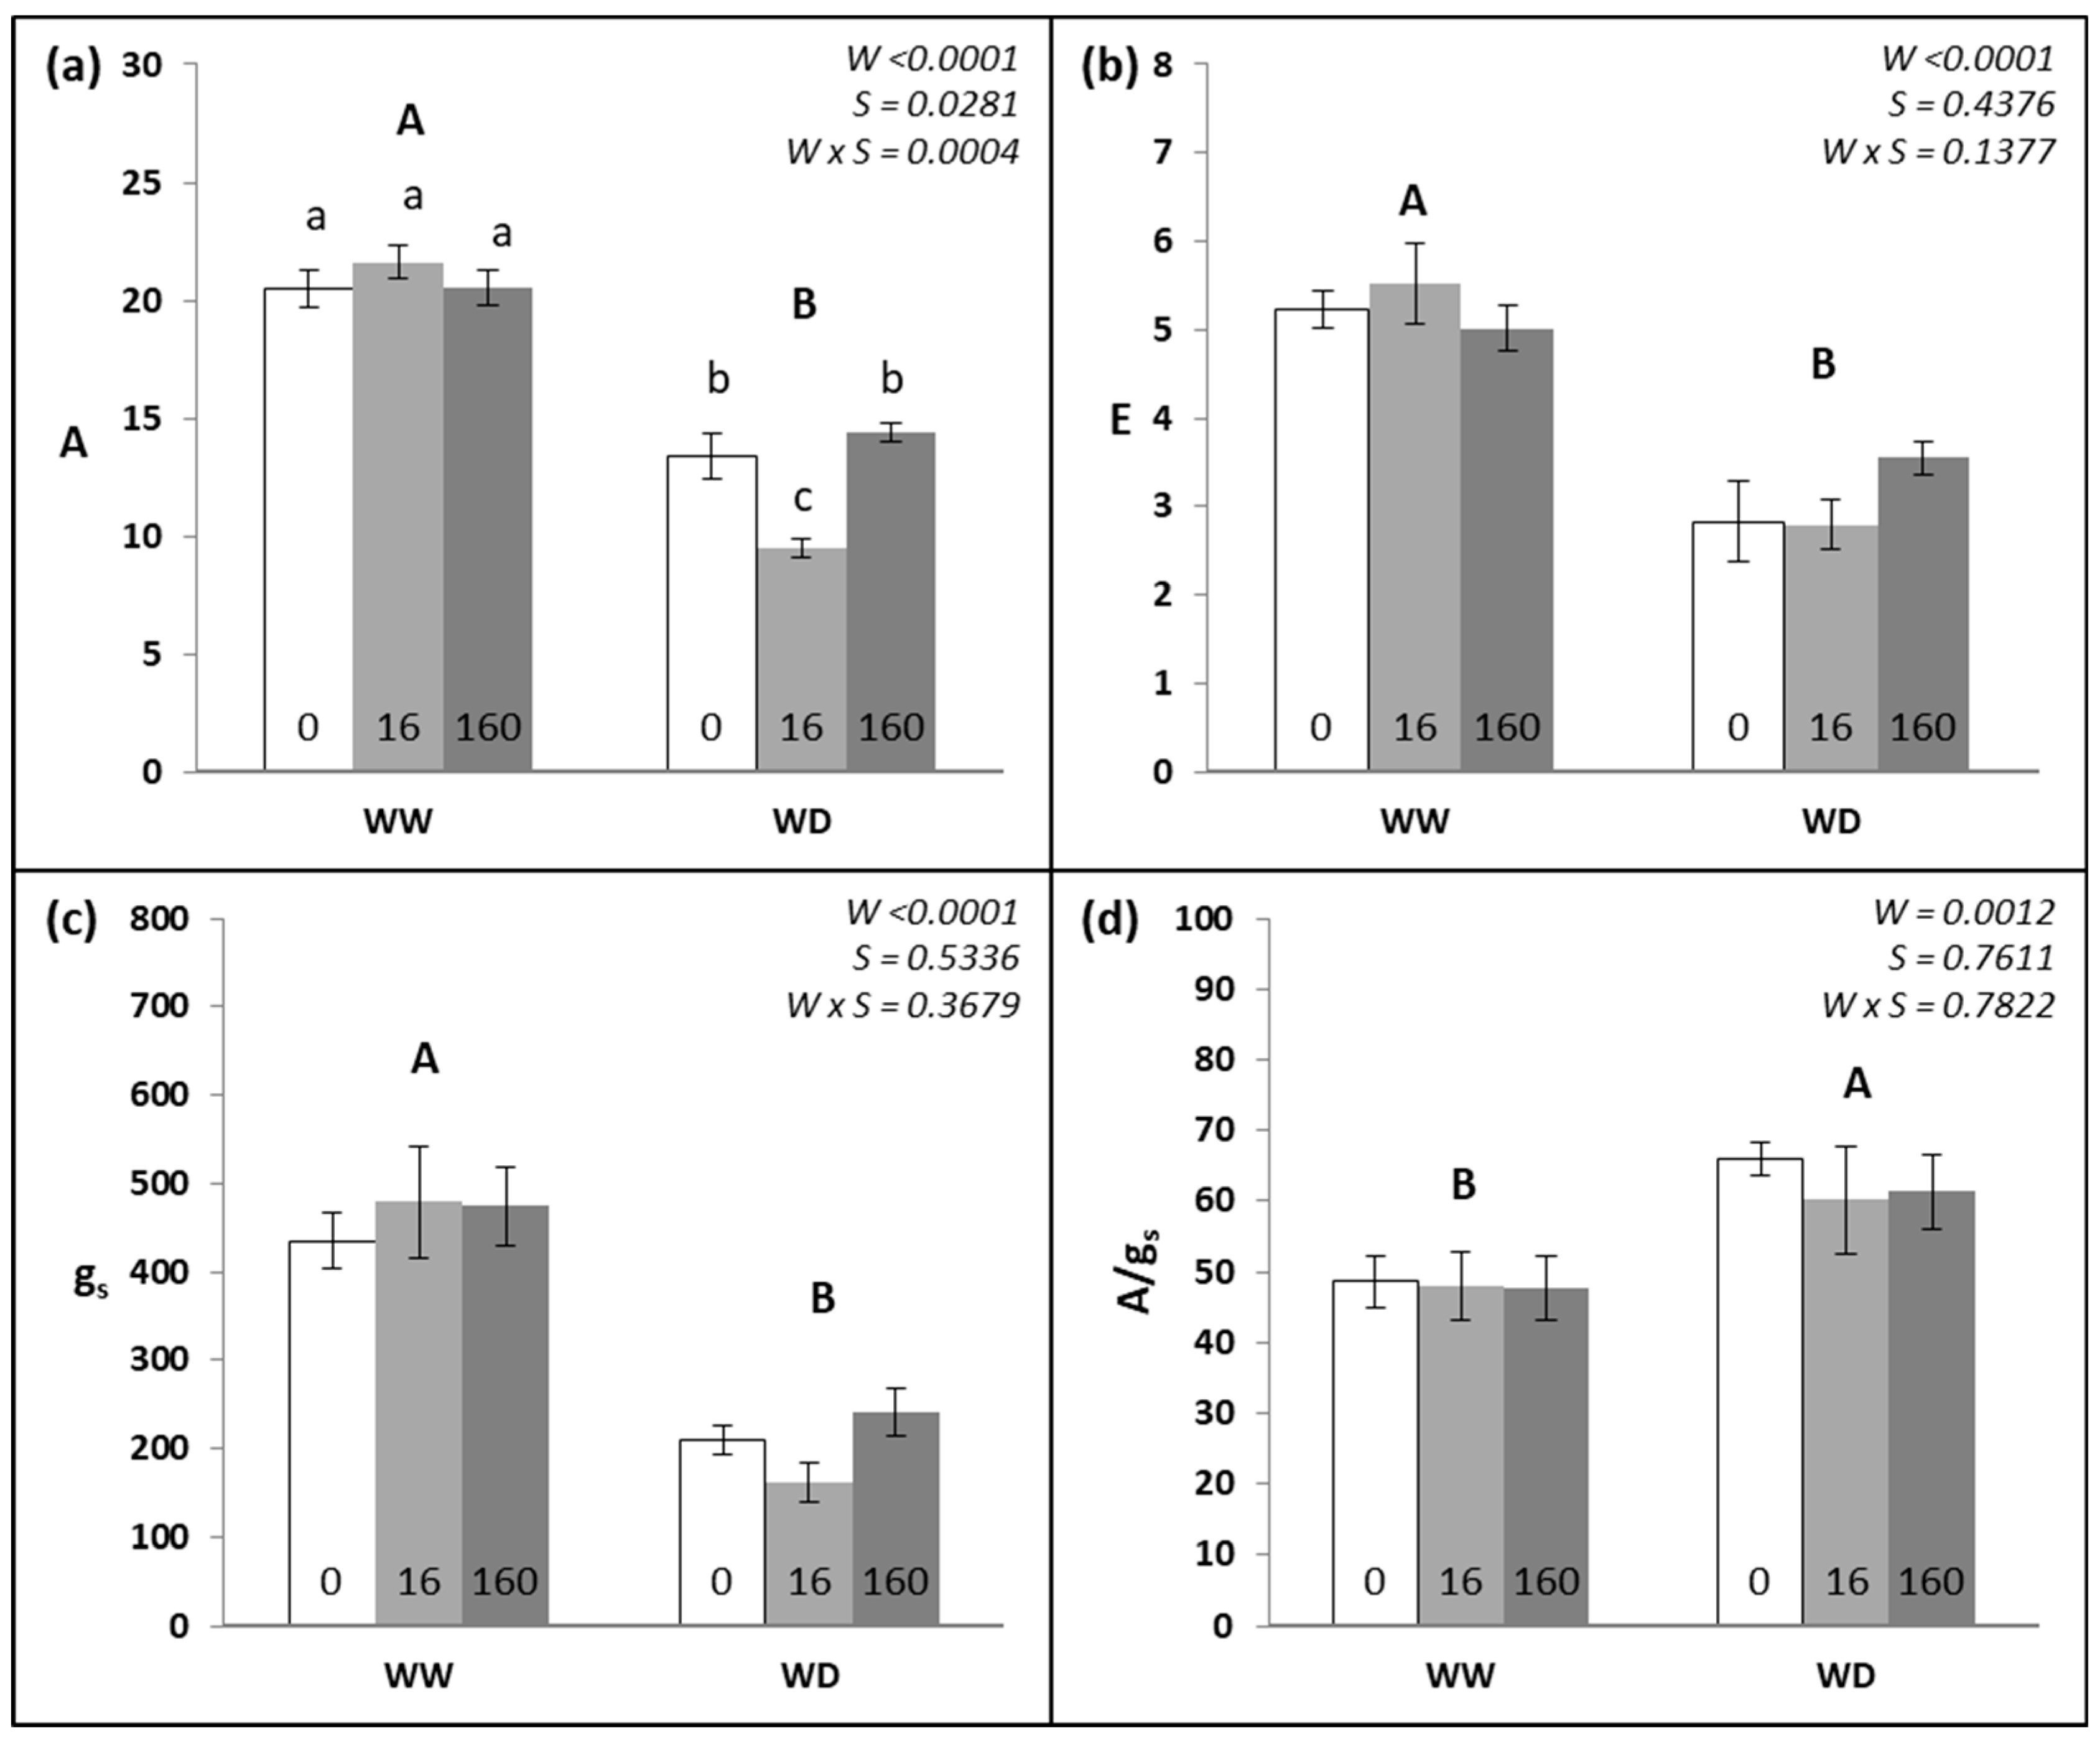
3.1. Leaf Gas Exchange and Chlorophyll a Fluorescence

The leaf gas exchange data are presented in Figure 2. Considering the irrigation treatments, the WD plants showed a statistically significant decrease (p < 0.0001) in A, E, and gs (−38%, −43%, and −55%, respectively), and A/gs presented an increase of 31% compared to that of WW plants. Regarding the effects of the Se treatments, only the 16 g ha−1 Se treatment caused a statistically significant reduction in A (−8%) compared to the 0 or 160 g ha−1 Se treatments. This reduction was promoted exclusively by the interaction of 16 g ha−1 Se application in WD irrigation, in which A decreased by 29%.
The analysis of the chlorophyll a fluorescence data (Table 1) revealed a significant decrease in Fv/Fm (p = 0.0049) and ETR (p = 0.0372) in the WD treatments, while no significant differences were observed for the other parameters. Furthermore, no significant differences (p > 0.05) were found among the Se treatments or their interaction with irrigation treatments.

3.2. Biochemical Analysis of Leaf Samples

The quantification of photosynthetic pigments, Chl a, Chl b, and Car, are presented in Table 2. The photosynthetic pigment contents were significantly (p < 0.0001) influenced by irrigation, selenium concentration, and the interaction of both factors. A significant reduction in photosynthetic pigments (15–16% of Chl a, Chl b, and Car) was observed under WD treatments. However, the effect of Se treatments significantly decreased the number of photosynthetic pigments in the leaves, mainly with higher Se concentrations (160 g ha−1). The interaction W × S data analysis revealed a decrease in photosynthetic pigments in Se treatments under WD conditions. However, in WW treatments, the Se application of 16 g ha−1 increases the content of Chl a (+8%), Car (+9%), and Chl a + b (+7%) compared to the control treatment (0 g ha−1). The Se application of 160 g ha−1 showed a decrease in all pigments (16–18%) compared to the control treatment.
Figure 3 shows the content of total phenolic compounds (TP), total flavonoids (TF), ortho-diphenols (OD), radical ABTS+, total soluble sugars (TSS), and total soluble proteins (TSP) quantified in the same leaves used for photosynthetic pigment quantification. The decrease in water availability significantly (p < 0.006) affected the TP (−5%), OD (+10%), TSS (−8%), and TSP (−13%) contents. Despite the water regime, applying Se significantly increased the TP (+8%) and the ABTS+ (+10%), compared to the 0 g ha−1 treatment. The TSS increased only with the 160 g ha−1 treatment (+4%), and TSP decreased (−11%) with both Se treatments (16 and 160 g ha−1). The interaction of W × S showed that Se application in the WW regime increased the TPC and TSP (+8 and +10%, respectively) at 16 g ha−1 and TSS (+20%) at 160 g ha−1. Considering the WD regime, the increase in Se concentration increased (p < 0.001) the TPC (7–17%) and OD (7–17%) but decreased the TSS (12–19%) and TSP (16–32%).

3.3. Yield and Growth Parameters

The measured parameters are shown in Table 3. Generally, WD reduced the parameters evaluated when compared to the WW treatments. The stem length and straw biomass presented a reduction of 7%, and the number of grains per plant and the weight of the total grains decreased by more than 30% compared to those of the WW plants (p < 0.0001). The harvest index, or the vegetative biomass, also diminished by around 17–19%.
When considering the effect of the Se treatment, the unique parameter that shows significant variation (p = 0.0028) among the tested Se concentrations is the thousand-grain weight. In this trait, Se treatments at 16 and 160 g ha−1 reduced the grain weight by around 10 to 13% compared to that of the untreated control.
Nevertheless, different responses are observed when the interaction of the variables was analyzed. While Se treatments were found to significantly increase the spike length in WD plants (+10%), when compared to Se-untreated plants, the same was not observed for plants kept under WW conditions. A decrease in thousand-grain weight and grain biomass per plant (13 and 19%, respectively) and an increase in straw biomass (+8%) when 160 g ha−1 Se was applied under WW conditions were observed. In contrast, under WD conditions, the same Se treatment resulted in an 8% reduction in straw biomass and a slight, though not statistically significant, increase in grain biomass (+12%). When the plants were well irrigated, those treated with 160 g ha−1 of Se presented a significant increase in weight of straw biomass (3131 ± 61 mg per plant), while the same Se treatment in the WD plants led to a statistically significant decrease in straw biomass (2165 ± 155 per plant).

3.4. Selenium Content

Table 4 presents the Se in the grain and straw of wheat plants. The interaction between Se application and water regime did not significantly affect the grain Se contents, although an increase in Se grain contents was noticed reflecting on the Se treatment applied. In the straw Se contents, an interaction between Se and water regime was noticed.
In plants kept untreated with Se (0 g/ha), WD strongly decreased (9.4-fold) the Se content in straw. In the control plants, higher amounts of Se were observed in straw samples when compared to those of the WD plants, irrespective of the Se condition tested. In WW plants treated with 160 g/ha Se, Se levels reached 4521 ± 89.9 µg plant−1—the highest straw biomass value measured. In WD plants, the same treatment led to values of 3751 ± 46.9 µg plant−1.

4. Discussion

In this study, we investigated the suitability of Se foliar application as a strategy for Se biofortification of wheat. The main objective was to test the hypothesis that foliar Se application enriches the grains of bread wheat cv “Jordão” with Se while improving its performance under water deficit. The pot experiment conducted allowed us to conclude the following: (i) Se levels were not lethal to wheat growth and development; and (ii) foliar application is an expeditious method to deliver Se contents capable of modulating wheat responses. The main findings of the studies are discussed in the next section.

4.1. Leaf Gas Exchange, Chlorophyll a Fluorescence Traits

Plants’ physiological, biochemical, and molecular mechanisms are strongly affected by drought [42]. It is known that water deficit leads to stomatal closure, photoinhibition, and a reduction in the quantum yield of PSII. Accumulated damages in the chlorophyll and chloroplast structures cause ROS production in response to these physiological alterations [43]. In line with this, in the present study, plants under WD showed significant decreases (p < 0.0001) in A, E, and gs (−38%, −43%, and −55%, respectively) and increased in A/gs (+31%) compared to WW treatments. The evaluated chlorophyll a fluorescence parameters, Fv/Fm and ETR, also decreased under WD conditions, indicating that, besides stomatal limitations (reduced gs), non-stomatal limitations (impairment in photochemical reactions) also occurred. Leaf photosynthesis declines under water shortage, initially due to decreased stomatal conductance (triggered by ABA production) and consequent CO2 uptake, and, as stress persists, metabolic impairments further inhibit CO2 fixation [44,45,46,47]. Moreover, diminishing soil moisture can increase xylem cavitation, gradually reducing hydraulic conductance and ultimately obstructing water movement within the plant [44].
Se accumulation is predominant in the shoots of the plants [44], however we cannot exclude that during spraying, a certain amount of the sprayed solution may have fallen to the soil. Several authors have suggested that the application of selenate can achieve the protection, functionality, and integrity of chloroplasts, which maintains the stability of electron transport during the photosynthetic process, preventing the accumulation of ROS [16,18,48]. A positive effect of Se spray application (50 and 150 g ha −1) in photosynthetic rate, stomatal conductance, and transpiration rate under normal conditions and water deficit of olive trees was reported by Proietti, et al. [49]. In the present study, Se foliar applications did not influence stomatal conductance, transpiration rate, or water use efficiency. Only the photosynthetic rate significantly decreased when 16 g ha−1 of Se was applied in WD conditions, whereas, at a higher concentration (160 g ha−1 Se), it remained like the control. The tested experimental conditions also did not impact the photochemical parameters based on Chl a fluorescence analysis. No differential responses were observed regarding the effects of the Se concentrations studied. Our results are similar to those of Canuto dos Santos et al. [50], who hypothesized that the reduction in the photosynthetic rate under water stress is related to chlorophyll degradation, stomatal closure, suppression, and fragmentation of RuBisCO, which results in substantial losses in CO2 assimilation by plants. They also concluded that the capability of Se to protect chloroplast structures and photosystem II reaction centers in plants under water stress could be compromised due to the phenological stage of the crop. Ferreira de Sousa et al. [51] also verified the negative effects of Se application under WD. In fact, they verified that the application under post-stress could impose an extra stress on plants, leading them to reduce their water potential. However, Hajiboland et al. [52] verified that Se alleviates drought stress in wheat plants, increasing the photosynthesis rate, accumulation of organic osmolytes, and improvement of water use efficiency.

4.2. Biochemical Analysis of Leaves

Foliar applications of selenate in maize enhance the content of the photosynthetic pigment in both WW and WD conditions [53]. Indeed, our results evidenced a lower content in Chl a, Chl b, and Car due to the WD treatment imposed, which agreed with the previous findings [54]. Regardless of the water treatments applied, the Se treatments led to a decrease in pigment contents. These decreases were higher when a superior concentration of Se was applied. However, the W × S interaction found (p< 0.0001) evidenced that the Se application of 16 g ha−1 Se in WW treatments significantly increased the photosynthetic pigments quantified when compared to WD plants. As mentioned in other studies, the form of Se provided, concentration, and method of application may affect the photosynthetic pigment content [55].
The Chl/Car ratio is a sensitive indicator of photo-oxidative damage, since chlorophylls are highly susceptible to environmental stresses [56]. To protect against stresses, plants increase the content of phenolic compounds. Phenolic compounds, such as TPC, TF, and OD, are secondary metabolites found in cereals, acting as antioxidant and pro-oxidant agents [57]. Phenolic compounds are expected to improve cellular homeostasis during drought stress [58]. No significant changes were observed for the TF or ABTS+ contents, suggesting that the accumulation of these metabolites is not triggered by the tested experimental conditions. A significant interaction between Se and the water treatment was found for TP, OD, TSS, and TSP. As one example, the treatments of 16 and 160 g ha−1 applied on WD plants lead to a significant increase in OD when compared to WW ones. For TSP, both Se treatments led to a significant decrease in its contents in WD plants, while in WW the 16 g/ha was found to increase significantly the amount of total soluble proteins. In response to water shortage, which strongly disrupts osmotic adjustment, leaf cells lower their osmotic potential through active accumulation of new osmolytes, such as sugars (e.g., mannitol, sorbitol, glucose, fructose, and sucrose), amino acid (e.g., proline), and quaternary compounds, etc. [59]. The several -OH group of osmolytes facilitate the attachment of water molecules by hydrogen bonding in the cytoplasm [60]. To counteract the stomata closure due to the lack of water, plants promote the accumulation of osmolytes in the leaf cells, generating a potential osmotic decrease. Therefore, the stomata remain open and preserved by the cell turgor, and photosynthesis is maintained [61]. These osmolytes also provide defenses from ROS, acting as antioxidant agents and stabilizing the cellular structure, proteins, and enzymes [62]. In our study, 160 g/ha Se applied to WW plants was found to significantly increase the amounts of TSS when compared to untreated plants (0 g/ha). In WD, the same Se treatment (160 g/ha) decreased the total soluble sugar content when compared to that of the untreated plants. This suggests that, under WD conditions, plants where Se was applied had fewer sugars, suggesting that their osmotic potential is regulated due to the increased phenolic compounds [63,64].
The TSP decreased with the application of 160 g ha−1 Se in WW and WDconditions, and with 16 g ha−1 Se in WD, increasing only with the application of 16 g ha−1 Se under WW conditions. Typically, antioxidant responses, like the synthesis of stress proteins, play an essential role in the drought tolerance of plants under stress conditions [56]. Some studies report increased TSP in response to drought The TSP decreases decreased with the application of 160 g ha−1 Se in WW and WD conditions, and with 16 g ha−1 Se in WD, increasing only, with the application of 16 g ha−1 Se under WW conditions. Typically, antioxidant responses, like the synthesis of stress proteins, play an essential role in the drought tolerance in of plants under stress conditions [56]. Some studies report increased TSP in response to drought [65,66]. Despite the slight increase in TSP in the control plants under WD compared to that of the control plants under WW, the TSP content decreased significantly in plants treated with Se. ROS production is driven by the severity of drought conditions that lead to the oxidation of amino acids and the disruption of protein structure [67]. Despite the slight increase in TSP in the control plants under WD compared to that of the control plants under WW, the TSP content decreased significantly in plants treated with Se. ROS production is driven by the severity of drought conditions that lead to the oxidation of amino acids and the disruption of protein structure [67].

4.3. Straw and Grain Biomass Parameters

A decrease in stem length, number, and weight of grain and a reduction in straw and vegetative biomass in the WD treatments, compared to WW treatments, were observed. Environmental stresses, particularly drought, are the most important abiotic factors limiting plant growth, leading to considerable yield loss. Over time, prolonged stress further leads to stunted growth, resulting in yield and biomass losses.
The accumulation of dry mass, often associated with an increased photosynthetic rate, was reported when a low concentration of Se (100 g ha−1) was applied to the plant growth media [68,69,70]. In our study, a differential response to Se treatments was observed according to the trait studied. One of the most relevant results is that the treatment with 160 g ha−1 Se promoted a significant increase in straw biomass when the plants were kept under WW conditions. However, the grain biomass decreased (160 g ha−1 in WW conditions) compared to the control. An increase in the number and area of leaves was reported when the plants were sprayed with 100 g ha−1 Se [71]. Considering that stem size and the number of tillers were not significantly different among the treatments, the observed difference in the straw biomass cannot be explained by the number of leaves, as all leaves were already present (though not fully developed) at the time of Se foliar application. It is more likely due to increased leaf area, size, and thickness. Se application under good water availability could stimulate leaf development, including the accumulation of reserves and photo-assimilates (e.g., TSS), increasing their final dry weight. In contrast, under low water availability, the opposite effect was verified. Another possible explanation could be that Se application in WW conditions promoted plant well-being and a delay in translocating assimilates from the leaves to the grains, resulting in greater straw biomass (+8%) but at expense of the grain biomass (−27%). Nevertheless, further analysis of grain and straw quality, including nutrient composition and fiber content, are crucial to fully assess Se’s potential in wheat production.

5. Conclusions

Selenium foliar applications constitute a fast and low-cost approach to improve Se contents in wheat for biofortification. Due to its potential to trigger toxicity in plants, studies are needed to select the best form and concentration, which depends on plant species or genotypes. Herein, we investigated the effects of Se foliar application treatments in bread wheat aerial traits under well-watered and water-deficit conditions. Three growing Se treatments were applied, and the effects of their application were studied in terms of the plants’ physiological and biochemical traits, including morphological and productive traits. As expected, water deficit predictably diminished wheat performance, evidenced by reduced photosynthetic activity, pigments, phenolics, sugars, and proteins, ultimately lowering straw and grain biomass and grain yield. Among others, Se foliar application triggered some beneficial responses in WW plants, which depended on the concentration used. The treatment with 160 g/ha led to the highest Se content in straw, enhanced straw biomass accumulation, and increased total soluble sugars content. On the other hand, well-irrigated plants treated with 16 g/ha Se were found to present the highest amounts of photosynthetic pigments and total soluble proteins. Under water deficit, Se treatments were found to increase spike length, total phenols, and ortho-diphenols when compared to Se-untreated plants. In general, Se treatments increased the Se contents in both straw and grains, but with a noticeably higher accumulation in straw. Altogether, these results suggest that foliar application of 160 g/ha Se under irrigation is a promissory approach to enhance Se contents in bread wheat, with still unexplored potential for integration in sustainable cultivation practices.

Author Contributions

Conceptualization, L.R., J.L.-B. and J.M.-P.; data curation, L.R., E.S. and H.F.; formal analysis, L.R.; investigation, L.R., E.S., C.B., A.G. and C.M.; methodology, L.R., J.L.-B. and J.M.-P.; resources, J.M.-P.; supervision, J.L.-B. and J.M.-P.; validation, J.L.-B. and J.M.-P.; writing—original draft, L.R.; writing—review and editing, S.A., C.B., A.C.M., J.L.-B. and J.M.-P. All authors have read and agreed to the published version of the manuscript.

Funding

Luis Rocha acknowledges the financial support provided by National Funds through FCT—Portuguese Foundation for Science and Technology (PD/BD/113612/2015)—under the Doctoral Programme “Agricultural Production Chains—from fork to farm” (PD/00122/2012), and from the European Social Funds and the Regional Operational Programme Norte 2020. This work is supported by National Funds from FCT—Portuguese Foundation for Science and Technology—under the projects UIDB/04033/2020 (https://doi.org/10.54499/UIDB/04033/2020) and LA/P/0126/2020 (https://doi.org/10.54499/LA/P/0126/2020. The authors from MORE and CIMO acknowledge the financial support received from PRR—Investimento RE-C05-i02: Missão Interface—CoLAB, National Funds through FCT/MCTES (PIDDAC), CIMO, UIDB/00690/2020 (DOI: 10.54499/UIDB/00690/2020) and UIDP/00690/2020 (DOI: 10.54499/UIDP/00690/2020), and SusTEC, LA/P/0007/2020 (DOI: 10.54499/LA/P/0007/2020).

Institutional Review Board Statement

Not applicable.

Informed Consent Statement

Not applicable.

Data Availability Statement

The data presented in this study are available upon request from the corresponding author.

Acknowledgments

We thank José Coutinho from INIAV—Plant Breeding Station (Elvas, Portugal)—for kindly providing the bread wheat seeds.

Conflicts of Interest

The authors declare no conflicts of interest.

References

  1. Roman, M.; Jitaru, P.; Barbante, C. Selenium biochemistry and its role for human health. Metallomics 2014, 6, 25–54. [Google Scholar] [CrossRef]
  2. Jiang, Y.; Zh, Z.; Bu, Y.; Cz, R.; Jz, L.; Jj, H.; Tao, C.; Zhang, K.; Xx, W.; Gx, L.; et al. Effects of selenium fertilizer on grain yield, Se uptake and distribution in common buckwheat (Fagopyrum esculentum Moench). Plant Soil Environ. 2016, 61, 371–377. [Google Scholar] [CrossRef]
  3. Fernandes, K.F.M.; Berton, R.; Coscione, A. Selenium biofortification of rice and radish: Effect of soil texture and efficiency of two extractants. Plant Soil Environ. 2014, 60, 105–110. [Google Scholar] [CrossRef]
  4. Graham, R.; Welch, R.; Saunders, D.; Ortiz-Monasterio, I.; Bouis, H.; Bonierbale, M.; Haan, S.; Burgos, G.; Thiele, G.; Liria, R.; et al. Nutritious Subsistence Food Systems. Adv. Agron. 2007, 92, 1–74. [Google Scholar]
  5. Puccinelli, M.; Pezzarossa, B.; Rosellini, I.; Malorgio, F. Selenium enrichment enhances the quality and shelf life of Basil leaves. Plants. 2020, 9, 801. [Google Scholar] [CrossRef]
  6. Mirlean, N.; Seus-Arrache, E.R.; Vlasova, O. Selenium deficiency in subtropical littoral pampas: Environmental and dietary aspects. Environ. Geochem. Health 2018, 40, 543–556. [Google Scholar] [CrossRef]
  7. Beyene, T.M. Application of Bio-fortification through Plant Breeding to Improve the Value of Staple Crops. J Biomed Biotechnol. 2015, 3, 11–19. [Google Scholar]
  8. da Silva, D.F.; Cipriano, P.E.; de Souza, R.R.; Siueia Júnior, M.; da Silva, R.F.; Faquin, V.; de Souza Silva, M.L.; Guimarães Guilherme, L.R. Anatomical and physiological characteristics of Raphanus sativus L. submitted to different selenium sources and forms application. Sci. Hortic. 2020, 260, 108839. [Google Scholar] [CrossRef]
  9. Shahrajabian, M.H.; Sun, W.; Cheng, Q. Foliar application of nutrients on medicinal and aromatic plants, the sustainable approaches for higher and better production. Beni-Suef Univ. J. Basic Appl. Sci. 2022, 11, 26. [Google Scholar] [CrossRef]
  10. Silva, M.A.; Sousa, G.F.; Van Opbergen, G.A.Z.; Van Opbergen, G.G.A.Z.; Corguinha, A.P.B.; Bueno, J.M.M.; Brunetto, G.; Leite, J.M.; Santos, A.A.; Lopes, G.; et al. Foliar Application of Selenium Associated with a Multi-Nutrient Fertilizer in Soybean: Yield, Grain Quality, and Critical Se Threshold. Plants 2023, 12, 2028. [Google Scholar] [CrossRef] [PubMed]
  11. Valença, A.W.; Bake, A.; Brouwer, I.D.; Giller, K.E. Agronomic biofortification of crops to fight hidden hunger in sub-Saharan Africa. Glob. Food Secur. 2017, 12, 8–14. [Google Scholar] [CrossRef]
  12. Mouta, E.R.; Melo, W.J.D.; Soares, M.R.; Alleoni, L.R.F.; Casagrande, J.C. Adsorção de selênio em latossolos. Rev. Bras. Ciência Solo 2008, 32, 1033–1041. [Google Scholar] [CrossRef]
  13. Araujo, A.M.; Lessa, J.H.D.L.; Ferreira, L.A.; Guilherme, L.R.G.; Lopes, G. Soil management and ionic strength on selenite retention in oxidic soils. Ciência e Agrotecnologia 2018, 42, 395–407. [Google Scholar] [CrossRef]
  14. Lessa, J.H.L.; Araujo, A.M.; Silva, G.N.T.; Guilherme, L.R.G.; Lopes, G. Adsorption-desorption reactions of selenium (VI) in tropical cultivated and uncultivated soils under Cerrado biome. Chemosphere 2016, 164, 271–277. [Google Scholar] [CrossRef]
  15. Zhang, Y.; Pan, G.; Chen, J.; Hu, Q. Uptake and transport of selenite and selenate by soybean seedlings of two genotypes. Plant Soil. 2003, 253, 437–443. [Google Scholar] [CrossRef]
  16. Jiang, C.; Zu, C.; Lu, D.; Zheng, Q.; Shen, J.; Wang, H.; Li, D. Effect of exogenous selenium supply on photosynthesis, Na+ accumulation and antioxidative capacity of maize (Zea mays L.) under salinity stress. Sci. Rep. 2017, 7, 42039. [Google Scholar] [CrossRef]
  17. Nawaz, F.; Ahmad, R.; Ashraf, M.Y.; Waraich, E.A.; Khan, S.Z. Effect of selenium foliar spray on physiological and biochemical processes and chemical constituents of wheat under drought stress. Ecotoxicol. Environ. Saf. 2015, 113, 191–200. [Google Scholar] [CrossRef]
  18. Zhang, M.; Tang, S.; Huang, X.; Zhang, F.; Pang, Y.; Huang, Q.; Yi, Q. Selenium uptake, dynamic changes in selenium content and its influence on photosynthesis and chlorophyll fluorescence in rice (Oryza sativa L.). Environ. Exp. Bot. 2014, 107, 39–45. [Google Scholar] [CrossRef]
  19. Hawrylak-Nowak, B. Comparative effects of selenite and selenate on growth and selenium accumulation in lettuce plants under hydroponic conditions. Plant Growth Regul. 2013, 70, 149–157. [Google Scholar] [CrossRef]
  20. Mostofa, M.G.; Hossain, M.A.; Siddiqui, M.N.; Fujita, M.; Tran, L.-S.P. Phenotypical, physiological and biochemical analyses provide insight into selenium-induced phytotoxicity in rice plants. Chemosphere 2017, 178, 212–223. [Google Scholar] [CrossRef]
  21. Food and Agriculture Organization of the United Nations, Statistical Database. Available online: http://www.fao.org/faostat/en/#data/ (accessed on 27 January 2025).
  22. Liu, J.; Feng, H.; He, J.; Chen, H.; Ding, D. The effects of nitrogen and water stresses on the nitrogen-to-protein conversion factor of winter wheat. Agric. Water Manag. 2018, 210, 217–223. [Google Scholar] [CrossRef]
  23. Zörb, C.; Ludewig, U.; Hawkesford, M.J. Perspective on wheat yield and quality with reduced nitrogen supply. Trends Plant Sci. 2018, 23, 1029–1037. [Google Scholar] [CrossRef]
  24. Ramkissoon, C.; Degryse, F.; da Silva, R.; Baird, R.; Young, S.; Bailey, E.; McLaughlin, M. Improving the efficacy of selenium fertilizers for wheat biofortification. Sci. Rep. 2019, 9, 19520. [Google Scholar] [CrossRef]
  25. Radawiec, A.; Szulc, W.; Rutkowska, B. Selenium biofortification of wheat as a strategy to improve Human nutrition. Agriculture 2021, 11, 144. [Google Scholar] [CrossRef]
  26. Galinha, C.; Pacheco, A.M.G.; Freitas, M.D.; Fikrle, M.; Kucera, J.; Coutinho, J.; Macas, B.; Almeida, A.S.; Wolterbeek, H.T. Selenium in bread and durum wheats grown under a soil-supplementation regime in actual field conditions, determined by cyclic and radiochemical neutron activation analysis. J. Radioanal. Nucl. Chem. 2015, 304, 139–143. [Google Scholar] [CrossRef]
  27. Manojlović, M.S.; Lončarić, Z.; Cabilovski, R.R.; Popović, B.; Karalić, K.; Ivezić, V.; Ademi, A.; Singh, B.R. Biofortification of wheat cultivars with selenium. Acta Agric. Scand. Sect. B-Soil Plant Sci. 2019, 69, 715–724. [Google Scholar] [CrossRef]
  28. Min, W.; Ali, F.; Wang, M.; Dinh, T.; Fei, Z.; Banuelos, G.; Liang, D. Understanding boosting selenium accumulation in wheat (Triticum aestivum L.) following foliar selenium application at different stages, forms, and doses. Environ. Sci. Pollut. Res. 2019, 27, 717–772. [Google Scholar]
  29. Ahmed, M.; Fayyaz ul, H. Response of spring wheat (Triticum aestivum L.) quality traits and yield to sowing date. PLoS ONE 2015, 10, e0126097. [Google Scholar] [CrossRef]
  30. Liu, X.; Pan, Y.; Zhu, X.; Yang, T.; Bai, J.; Sun, Z. Drought evolution and its impact on the crop yield in the North China Plain. J. Hydrol. 2018, 564, 984–996. [Google Scholar] [CrossRef]
  31. Kuwayama, Y.; Thompson, A.; Bernknopf, R.; Zaitchik, B.; Vail, P. Estimating the Impact of Drought on Agriculture Using the U.S. Drought Monitor. Am. J. Agric. Econ. 2019, 101, 193–210. [Google Scholar] [CrossRef]
  32. Sodani, R.; Singhal, R.K.; Gupta, S.; Gupta, N.; Chauhan, K.S.; Chauhan, J. Performance of Yield and Yield Attributes of Ten Indian Mustard (Brassica juncea L.) Genotypes under Drought Stress. Int. J. Pure Appl. Biosci. 2017, 5, 467–476. [Google Scholar]
  33. Rocha, L.; Silva, E.; Pavia, I.; Ferreira, H.; Matos, C.; Osca, J.M.; Moutinho-Pereira, J.; Lima-Brito, J. Seed Soaking with Sodium Selenate as a Biofortification Approach in Bread Wheat: Effects on Germination, Seedling Emergence, Biomass and Responses to Water Deficit. Agronomy 2022, 12, 1975. [Google Scholar] [CrossRef]
  34. DGAV. Catálogo nacional de variedades e espécies agrícolas e hortícolas 2020; Ministério da Agricultura, Florestas e Desenvolvimento Rural: Lisboa, Portugal, 2020; ISSN 0871-0295.
  35. Galinha, C.; Freitas, M.C.; Pacheco, A.M.G.; Coutinho, J.; Macas, B.; Almeida, A.S. Determination of selenium in bread-wheat samples grown under a Se-supplementation regime in actual field conditions. J. Radioanal. Nucl. Chem. 2012, 291, 231–235. [Google Scholar] [CrossRef]
  36. Almeida, A.; Maçãs, B.; Rodrigues, V.; Torrão, M. Wheat breeding: Country perspectives. In The History of Wheat Breeding in Portugal; Bonjean, A.P., Angus, W.J., Van Ginkel, M., Eds.; LAVOISIER S.A.S.: Lisbon, Portugal, 2016; pp. 93–125. [Google Scholar]
  37. Zadoks Growth Scale. 2025. Available online: https://www.agric.wa.gov.au/grains/zadoks-growth-scale (accessed on 22 February 2025).
  38. von Caemmerer, S.; Farquhar, G.D. Some relationships between the biochemistry of photosynthesis and the gas exchange of leaves. Planta 1981, 153, 376–387. [Google Scholar] [CrossRef]
  39. Bradford, M.M. A rapid and sensitive method for the quantitation of microgram quantities of protein utilizing the principle of protein-dye binding. Anal. Biochem. 1976, 72, 248–254. [Google Scholar] [CrossRef]
  40. Irigoyen, J.J.; Einerich, D.W.; Sánchez-Díaz, M. Water stress induced changes in concentrations of proline and total soluble sugars in nodulated alfalfa (Medicago sativd) plants. Physiol. Plant. 1992, 84, 55–60. [Google Scholar] [CrossRef]
  41. Boldrin, P.F.; Faquin, V.; Ramos, S.J.; Boldrin, K.V.F.; Ávila, F.W.; Guilherme, L.R.G. Soil and foliar application of selenium in rice biofortification. J. Food Compos. Anal. 2013, 31, 238–244. [Google Scholar] [CrossRef]
  42. Oguz, M.C.; Aycan, M.; Oguz, E.; Poyraz, I.; Yildiz, M. Drought Stress Tolerance in Plants: Interplay of Molecular, Biochemical and Physiological Responses in Important Development Stages. Physiologia 2022, 2, 180–197. [Google Scholar] [CrossRef]
  43. Dias, M.C.; Correia, S.; Serôdio, J.; Silva, A.M.S.; Freitas, H.; Santos, C. Chlorophyll fluorescence and oxidative stress endpoints to discriminate olive cultivars tolerance to drought and heat episodes. Sci. Hortic. 2018, 231, 31–35. [Google Scholar] [CrossRef]
  44. Saha, D.; Choyal, P.; Mishra, U.N.; Dey, P.; Bose, B.; Md, P.; Gupta, N.K.; Mehta, B.K.; Kumar, P.; Pandey, S.; et al. Drought stress responses and inducing tolerance by seed priming approach in plants. Plant Stress 2022, 4, 100066. [Google Scholar] [CrossRef]
  45. Moualeu-Ngangue, D.P.; Chen, T.W.; Stützel, H. A new method to estimate photosynthetic parameters through net assimilation rate−intercellular space CO2 concentration (ACi) curve and chlorophyll fluor. New Phytol. 2017, 213, 1543–1554. [Google Scholar] [CrossRef]
  46. Wang, M.; Dinh, T.; Qi, M.; Min, W.; Yang, W.; Fei, Z.; Liang, D. Radicular and foliar uptake, and xylem- and phloem-mediated transport of selenium in maize (Zea mays L.): A comparison of five Se exogenous species. Plant Soil 2019, 446, 111–123. [Google Scholar] [CrossRef]
  47. Zhang, A.-l.; Su, L.; Jiang, Z.-q.; Kang, Y.-t.; Qiu, P. Cyclic loading tests of earthquake-resilient prefabricated steel cross joints with different FCP connections. Structures 2021, 32, 1–14. [Google Scholar] [CrossRef]
  48. Diao, M.; Ma, L.; Wang, J.; Cui, J.; Fu, A.; Liu, H.-Y. Selenium Promotes the Growth and Photosynthesis of Tomato Seedlings Under Salt Stress by Enhancing Chloroplast Antioxidant Defense System. J. Plant Growth Regul. 2014, 33, 671–682. [Google Scholar] [CrossRef]
  49. Proietti, P.; Nasini, L.; Del Buono, D.; D’Amato, R.; Tedeschini, E.; Businelli, D. Selenium protects olive (Olea europaea L.) from drought stress. Sci. Hortic. 2013, 164, 165–171. [Google Scholar] [CrossRef]
  50. Santos, L.C.d.; Martins, G.S.; Benevenute, P.A.N.; de Sousa Lima, J.; Santos, F.R.d.; Andrade, O.V.S.; de Oliveira, I.P.; Bispo, F.H.A.; Botelho, L.; Rabêlo, F.H.S.; et al. Soil Application of Selenium in Wheat (Triticum aestivum L.) Under Water Stress Improves Grain Quality and Reduces Production Losses. Plants 2024, 13, 3460. [Google Scholar] [CrossRef]
  51. Sousa, G.F.d.; Silva, M.A.; Carvalho, M.R.d.; Morais, E.G.d.; Benevenute, P.A.N.; Van Opbergen, G.A.Z.; Van Opbergen, G.G.A.Z.; Guilherme, L.R.G. Foliar Selenium Application to Reduce the Induced-Drought Stress Effects in Coffee Seedlings: Induced Priming or Alleviation Effect? Plants 2023, 12, 3026. [Google Scholar] [CrossRef]
  52. Hajiboland, R.; Sadeghzadeh, N.; Ebrahimi, N.; Sadeghzadeh, B.; Mohammadi, S. Influence of selenium in drought-stressed wheat plants under greenhouse and field conditions. Acta Agric. Slov. 2015, 105, 175–191. [Google Scholar] [CrossRef]
  53. Nawaz, F.; Naeem, M.; Ashraf, M.Y.; Tahir, M.N.; Zulficiar, B.; Salahuddin, M.; Shabbir, R.N.; Aslam, M. Selenium supplementation affects physiological and biochemical processes to improve fodder yield and quality of maize (Zea mays L.) under water deficit conditions. Front. Plant Sci. 2016, 7, 1438. [Google Scholar] [CrossRef]
  54. Liu, Y.N.; Xu, Q.Z.; Li, W.C.; Yang, X.H.; Zheng, Q.; Li, B.; Li, Z.S.; Li, H.W. Long-term high light stress induces leaf senescence in wheat (Triticum aestivum L.). Photosynthetica 2019, 57, 830–840. [Google Scholar] [CrossRef]
  55. Yao, X.; Chu, J.; Wang, G. Effects of Selenium on Wheat Seedlings Under Drought Stress. Biol. Trace Elem. Res. 2009, 130, 283–290. [Google Scholar] [CrossRef] [PubMed]
  56. Farooq, M.; Wahid, A.; Kobayashi, N.; Fujita, D.; Basra, S.M.A. Plant drought stress: Effects, mechanisms and management. Agron. Sustain. Dev. 2009, 29, 185–212. [Google Scholar] [CrossRef]
  57. Guneidy, R.A.; Zaki, E.R.; Gad, A.A.M.; Saleh, N.S.E.; Shokeer, A. Evaluation of Phenolic Content Diversity along with Antioxidant/Pro-Oxidant, Glutathione Transferase Inhibition, and Cytotoxic Potential of Selected Commonly Used Plants. Prev. Nutr. Food Sci. 2022, 27, 282–298. [Google Scholar] [CrossRef] [PubMed]
  58. Begum, N.; Hasanuzzaman, M.; Li, Y.; Akhtar, K.; Zhang, C.; Zhao, T. Seed Germination Behavior, Growth, Physiology and Antioxidant Metabolism of Four Contrasting Cultivars under Combined Drought and Salinity in Soybean. Antioxidants 2022, 11, 498. [Google Scholar] [CrossRef]
  59. Hou, P.; Wang, F.; Luo, B.; Li, A.; Wang, C.; Shabala, L.; Ahmed, H.A.I.; Deng, S.; Zhang, H.; Song, P.; et al. Antioxidant Enzymatic Activity and Osmotic Adjustment as Components of the Drought Tolerance Mechanism in Carex duriuscula. Plants 2021, 10, 436. [Google Scholar] [CrossRef]
  60. Ozturk, M.; Turkyilmaz Unal, B.; García-Caparrós, P.; Khursheed, A.; Gul, A.; Hasanuzzaman, M. Osmoregulation and its actions during the drought stress in plants. Physiol. Plant. 2021, 172, 1321–1335. [Google Scholar] [CrossRef] [PubMed]
  61. Mahmood, T.; Abdullah, M.; Ahmar, S.; Yasir, M.; Iqbal, M.S.; Yasir, M.; Ur Rehman, S.; Ahmed, S.; Rana, R.M.; Ghafoor, A.; et al. Incredible Role of Osmotic Adjustment in Grain Yield Sustainability under Water Scarcity Conditions in Wheat (Triticum aestivum L.). Plants 2020, 9, 1208. [Google Scholar] [CrossRef] [PubMed]
  62. Abobatta, W. Drought adaptive mechanisms of plants—A review. Adv. Agric. Environ. Sci. Open Access 2019, 2, 42–45. [Google Scholar] [CrossRef]
  63. Somayyeh, S.; Masouleh, S.; Sassine, Y.; Jamal Aldine, N. Ornamental Horticulture The role of organic solutes in the osmotic adjustment of chilling stressed plants (vegetable, ornamental and crop plants). Ornam. Hortic. 2019, 25, 434–442. [Google Scholar]
  64. Gautam, T.; Dutta, M.; Jaiswal, V.; Zinta, G.; Gahlaut, V.; Kumar, S. Emerging Roles of SWEET Sugar Transporters in Plant Development and Abiotic Stress Responses. Cells 2022, 11, 1303. [Google Scholar] [CrossRef]
  65. Brito, C.; Dinis, L.T.; Ferreira, H.; Coutinho, J.; Moutinho-Pereira, J.; Correia, C.M. Salicylic acid increases drought adaptability of young olive trees by changes on redox status and ionome. Plant Physiol. Biochem. 2019, 141, 315–324. [Google Scholar] [CrossRef] [PubMed]
  66. Bacelar, E.A.; Santos, D.L.; Moutinho-Pereira, J.M.; Lopes, J.I.; Gonçalves, B.C.; Ferreira, T.C.; Correia, C.M. Physiological behaviour, oxidative damage and antioxidative protection of olive trees grown under different irrigation regimes. Plant Soil 2007, 292, 1–12. [Google Scholar] [CrossRef]
  67. Kabiri, R.; Nasibi, F.; Farahbakhsh, H. Effect of exogenous salicylic acid on some physiological parameters and alleviation of drought stress in Nigella sativa plant under hydroponic culture. Plant Prot. Sci. 2014, 50, 43–51. [Google Scholar] [CrossRef]
  68. Wang, Y.-D.; Wang, X.; Wong, Y.-s. Proteomics analysis reveals multiple regulatory mechanisms in response to selenium in rice. J. Proteom. 2012, 75, 1849–1866. [Google Scholar] [CrossRef]
  69. Andrade, F.R.; Da Silva, G.N.; Guimarães, K.C.; Barreto, H.B.F.; De Souza, K.R.D.; Guilherme, L.R.G.; Faquin, V.; Reis, A.R.D. Selenium protects rice plants from water deficit stress. Ecotoxicol. Environ. Saf. 2018, 164, 562–570. [Google Scholar] [CrossRef]
  70. Feng, T.; Chen, S.; Gao, D.; Liu, G.; Bai, H.; Li, A.; Peng, L.; Ren, Z. Selenium improves photosynthesis and protects photosystem II in pear (Pyrus bretschneideri), grape (Vitis vinifera), and peach (Prunus persica). Photosynthetica 2015, 53, 609–612. [Google Scholar] [CrossRef]
  71. Zahedi, S.M.; Moharrami, F.; Sarikhani, S.; Padervand, M. Selenium and silica nanostructure-based recovery of strawberry plants subjected to drought stress. Sci. Rep. 2020, 10, 17672. [Google Scholar] [CrossRef]
Figure 1. Field trial timeline from 0 to 210 Days After Sowing (DAS).
Agriculture 15 01086 g001
Figure 2. (a) Net photosynthetic rate (A, μmol CO2 m−2 s−1), (b) transpiration rate (E, mmol H2O m−2 s−1), (c) stomatal conductance (gs, mmol H2O m−2 s−1), and (d) intrinsic water use efficiency (A/gs, µmol mol−1) in wheat plants (means ± SE, n = 12) grown under two water regimes (WW—well-watered; and WD—water-deficit) and in response to three Se foliar spray treatments (0, 16, and 160 g ha−1 Se). Different capital letters demonstrate significant differences among water regimes and small letters demonstrate significant differences among all treatments (p < 0.05).
Agriculture 15 01086 g002
Figure 3. (a) Total phenols (TP), (b) total flavonoids (TF), (c) ortho-diphenols (OD), (d) ABTS+, (e) total soluble sugars (TSS), and (f) total soluble proteins (TSP) quantified in plants grown under well-watered (WW) and water-deficit (WD) conditions, and in response to three Se foliar spray treatments, 0, 16, and 160 g ha−1 Se. Values are means  ±  SE by DW (n = 12). Different capital letters demonstrate significant differences among water regimes, and small letters demonstrate significant differences among all treatments (p < 0.05).
Agriculture 15 01086 g003
Table 1. Maximum (Fv/Fm) and actual quantum efficiency of photosystem II (ΦPSII), maximum efficiency of PSII at open reaction centers (F’v/F’m), photochemical quenching (qP), non-photochemical quenching (NPQ), and apparent electron transport rate (ETR, μmol e m−2 s−1) in wheat plants grown under well-watered (WW) and water-deficit (WD) conditions, and in response to three Se foliar spray treatments (S), 0, 16, and 160 g ha−1 Se. Values are means  ±  SE (n = 12). Different letters indicate statistically significant differences among all treatments (p < 0.05).
Fv/FmΦPSIIF’v/F’mqPNPQETR
Water Regime (W)
  WW0.886 ± 0.005 a0.536 ± 0.0160.728 ± 0.0100.736 ± 0.0181.209 ± 0.176101 ± 2.1 a
  WD0.857 ± 0.007 b0.512 ± 0.0200.695 ± 0.0190.735 ± 0.0161.297 ± 0.17195 ± 2.2 b
Se foliar spray (S)
  0 g ha−10.876 ± 0.0120.513 ± 0.0220.711 ± 0.0210.720 ± 0.0171.160 ± 0.27295 ± 2.6
  16 g ha−10.868 ± 0.0060.530 ± 0.0220.708 ± 0.0180.748 ± 0.0231.156 ± 0.120100 ± 3.5
  160 g ha−10.871 ± 0.0090.529 ± 0.0240.714 ± 0.0190.739 ± 0.0221.428 ± 0.21598 ± 2.1
W × S
  WW × 0 g ha−10.906 ± 0.0020.590 ± 0.0080.770 ± 0.0050.766 ± 0.0160.473 ± 0.04899 ± 1.4
  WW × 16 g ha−10.900 ± 0.0030.548 ± 0.0130.717 ± 0.0060.764 ± 0.0120.540 ± 0.18592 ± 2.2
  WW × 160 g ha−10.908 ± 0.0110.603 ± 0.0170.765 ± 0.0110.790 ± 0.0330.539 ± 0.010101 ± 2.9
  WD × 0 g ha−10.892 ± 0.0090.529 ± 0.0410.751 ± 0.0160.702 ± 0.0390.578 ± 0.03889 ± 6.9
  WD × 16 g ha−10.875 ± 0.0080.593 ± 0.0140.767 ± 0.0090.772 ± 0.0091.122 ± 0.166100 ± 2.3
  WD × 160 g ha−10.863 ± 0.0100.601 ± 0.0190.735 ± 0.0000.818 ± 0.0261.065 ± 0.007101 ± 3.2
ANOVA (p-values)
  W0.00490.35390.15250.88730.77020.0372
  S0.88390.79750.97730.62530.57610.2681
  W × S0.22440.74680.90020.56100.39140.4524
Table 2. Chlorophyll a (Chl a), b (Chl b), Chl a + b, ratio (Chl a/Chl b), carotenoids (car), and chlorophyll/carotenoids ratio (Chl/Car) of wheat plants. Two water regimes (W), well-watered (WW) and water-deficit (WD), and three Se foliar spray treatments (S), 0, 16, and 160 g ha−1 Se, were applied. Values are means  ±  SE of DW (n = 12). Different letters indicate statistically significant differences among all treatments (p < 0.05).
Chl a
(mg g−1 DW)
Chl b
(mg g−1 DW)
Car
(mg g−1 DW)
Chl a + b
(mg g−1 DW)
Chl a/Chl bChl/Car
Water Regime (W)
  WW13.8 ± 0.28 a7.71 ± 0.13 a3.47 ± 0.07 a20.4 ± 0.39 a1.79 ± 0.01 a5.87 ± 0.03 a
  WD11.5 ± 0.36 b6.54 ± 0.14 b2.89 ± 0.09 b17.1 ± 0.47 b1.73 ± 0.02 b5.70 ± 0.03 b
Se foliar spray (S)
  0 g ha−113.6 ± 0.15 a7.53 ± 0.11 a3.45 ± 0.06 a20.0 ± 0.23 a1.78 ± 0.02 a5.85 ± 0.04 a
  16 g ha−113.0 ± 0.80 b7.32 ± 0.34 b3.13 ± 0.19 b19.2 ± 1.07 b1.74 ± 0.03 b5.77 ± 0.03 ab
  160 g ha−111.3 ± 0.11 c6.50 ± 0.06 c2.95 ± 0.03 c16.9 ± 0.16 c1.74 ± 0.01 b5.72 ± 0.05 b
W × S
  WW × 0 g ha−114.2 ± 0.11 b7.95 ± 0.10 a3.53 ± 0.03 b20.9 ± 0.15 b1.75 ± 0.02 bc5.81 ± 0.04 a
  WW × 16 g ha−115.3 ± 0.15 a8.30 ± 0.08 a3.86 ± 0.04 a22.4 ± 0.21 a1.85 ± 0.01 a5.76 ± 0.03 a
  WW × 160 g ha−111.6 ± 0.11 d6.68 ± 0.07 c2.94 ± 0.04 d17.3 ± 0.15 d1.74 ± 0.02 c5.89 ± 0.05 a
  WD × 0 g ha−113.1 ± 0.17 c7.12 ± 0.09 b3.35 ± 0.05 c19.1 ± 0.19 c1.80 ± 0.01 ab5.68 ± 0.04 a
  WD × 16 g ha−18.7 ± 0.04 f5.52 ± 0.05 e2.24 ± 0.04 e13.4 ± 0.05 f1.59 ± 0.01 d5.75 ± 0.05 a
  WD × 160 g ha−111.0 ± 0.14 e6.30 ± 0.06 d2.96 ± 0.05 d16.4 ± 0.18 e1.74 ± 0.01 c5.55 ± 0.04 b
ANOVA (p-values)
  W<0.0001<0.0001<0.0001<0.0001<0.0001<0.0001
  S<0.0001<0.0001<0.0001<0.0001<0.00010.0105
  W × S<0.0001<0.0001<0.0001<0.0001<0.00010.0056
Table 3. Stem length, spike length, tillers number, total grain number, thousand-grain weight, grain biomass, grain harvest index, straw biomass, and vegetative biomass parameters at the maturity stage of wheat plants grown under well-watered (WW) and water-deficit (WD) conditions, and in response to three Se foliar spray treatments (S), 0, 16, and 160 g ha−1 Se. Values are means  ±  SE (n = 20). Different letters indicate statistically significant differences among all treatments (p < 0.05).
Stem
Length
(mm)
Spike
Length
(mm)
Tillers
(Number per
Plant−1)
Total Grain
(Number per
Plant−1)
Thousand-Grain Weight (g)Grain
Biomass (mg Plant−1)
Grain Harvest
Index
(%)
Straw
Biomass (mg Plant−1)
Vegetative Biomass (mg Plant−1)
Water Regime (W)
  WW568 ± 8.79 a77 ± 1.53.7 ± 0.2293 ± 3.9 a30.9 ± 0.682855 ± 131 a49 ± 1.28 a2961 ± 45 a5770 ± 132 a
  WD527 ± 8.86 b80 ± 1.43.3 ± 0.1565 ± 3.4 b30.1 ± 0.681934 ± 97 b41 ± 1.22 b2718 ± 49 b4652 ± 112 b
Se foliar spray (S)
  0 g ha−1539 ± 10.578 ± 1.924.1 ± 0.2883 ± 5.232.7 ± 0.70 a2715 ± 17648 ± 1.672795 ± 525511 ± 194
  16 g ha−1554 ± 11.579 ± 1.343.5 ± 0.3279 ± 5.929.6 ± 0.82 b2349 ± 18044 ± 1.902811 ± 635160 ± 184
  160 g ha−1549 ± 11.779 ± 1.943.5 ± 0.2578 ± 4.628.6 ± 0.69 b2220 ± 12643 ± 1.442834 ± 645034 ± 140
W × S
  WW × 0 g ha−1555 ± 7.380 ± 1.90 ab3.8 ± 0.17108 ± 3.332.8 ± 1.10 a3532 ± 153 a56 ± 1.12 a2887 ± 86 b6419 ± 183
  WW × 16 g ha−1591 ± 17.877 ± 3.21 ab4.0 ± 0.54100 ± 8.432.1 ± 0.93 a3156 ± 246 ab52 ± 1.70 ab2761 ± 52 b5917 ± 257
  WW × 160 g ha−1594 ± 17.476 ± 2.81 ab4.3 ± 0.5993 ± 11.227.9 ± 0.92 b2569 ± 303 bc44 ± 2.59 c3131 ± 61 a5700 ± 325
  WD × 0 g ha−1518 ± 19.875 ± 2.97 b4.4 ± 0.4961 ± 4.532.2 ± 0.95 a1929 ± 135 c41 ± 1.48 c2755 ± 58 b4685 ± 157
  WD × 16 g ha−1534 ± 15.782 ± 1.27 a3.1 ± 0.2971 ± 7.727.3 ± 1.01 b1903 ± 194 c39 ± 2.35 c2886 ± 100 b4789 ± 224
  WD × 160 g ha−15112 ± 9.282 ± 1.69 a3.3 ± 0.2373 ± 5.630.4 ± 1.08 ab2165 ± 155 c45 ± 1.80 bc2548 ± 36 c4713 ± 162
ANOVA (p-values)
  W<0.00010.33810.2168<0.00010.2317<0.0001<0.00010.0010<0.0001
  S0.28600.68080.40860.95960.00280.24420.21250.96150.3446
  W × S0.38880.03680.08380.21220.00160.01870.0001<0.00010.2495
Table 4. Selenium content of grain and straw of wheat plants grown under well-watered (WW) and water-deficit (WD) conditions, and in response to three Se foliar spray treatments (S), 0, 16, and 160 g ha−1 Se. Values are means ± SE (n = 20). Different letters indicate statistically significant differences among all treatments (p < 0.05).
Grain Se (µg Plant−1)Straw Se (µg Plant−1)
Water Regime (W)
  WW892 ± 3401964 ± 643 a
  WD310 ± 1601505 ± 749 b
Se foliar spray (S)
  0 g ha−127 ± 9.4 c290 ± 100 c
  16 g ha−1207 ± 31 b798 ± 76.2 b
  160 g ha−11715 ± 406 a4253 ± 171 a
W × S
  WW × 0 g ha−141 ± 6.65452 ± 30.1 d
  WW × 16 g ha−1257 ± 7.26919 ± 38.9 c
  WW × 160 g ha−12165 ± 4584521 ± 89.5 a
  WD × 0 g ha−16 ± 0.3148 ± 2.17 e
  WD × 16 g ha−1109 ± 8.60617 ± 1.67 d
  WD × 160 g ha−1815 ± 3.053751 ± 46.9 b
ANOVA (p-values)
  W0.0600<0.0001
  S0.0008<0.0001
  W × S0.08990.0240
Disclaimer/Publisher’s Note: The statements, opinions and data contained in all publications are solely those of the individual author(s) and contributor(s) and not of MDPI and/or the editor(s). MDPI and/or the editor(s) disclaim responsibility for any injury to people or property resulting from any ideas, methods, instructions or products referred to in the content.

