
Optimization of Deoxynivalenol Removal from Wheat Grains Using Single- and Multi-Frequency Ultrasound and Impact on Quality Characteristics


Abstract
1. Introduction
2. Materials and Methods
2.1. Ingredients and Toxin Selection
2.2. Instruments and Reagents
2.3. Experimental Methods
2.3.1. Raw Material Handling
2.3.2. Ultrasonic Treatment
2.3.3. Sample Processing
2.3.4. DON Detection
2.3.5. Preservation of Dried Wheat Sample
2.3.6. Measurement of Wheat Quality
3. Experimental Results and Analysis
3.1. Impact of Ultrasound Duration on DON Removal Efficiency in Wheat Grains
3.2. Impact of Ultrasound Frequency on DON Removal Efficiency in Wheat Grains
3.3. Effect of Different Ultrasound Treatments on the Quality of Wheat
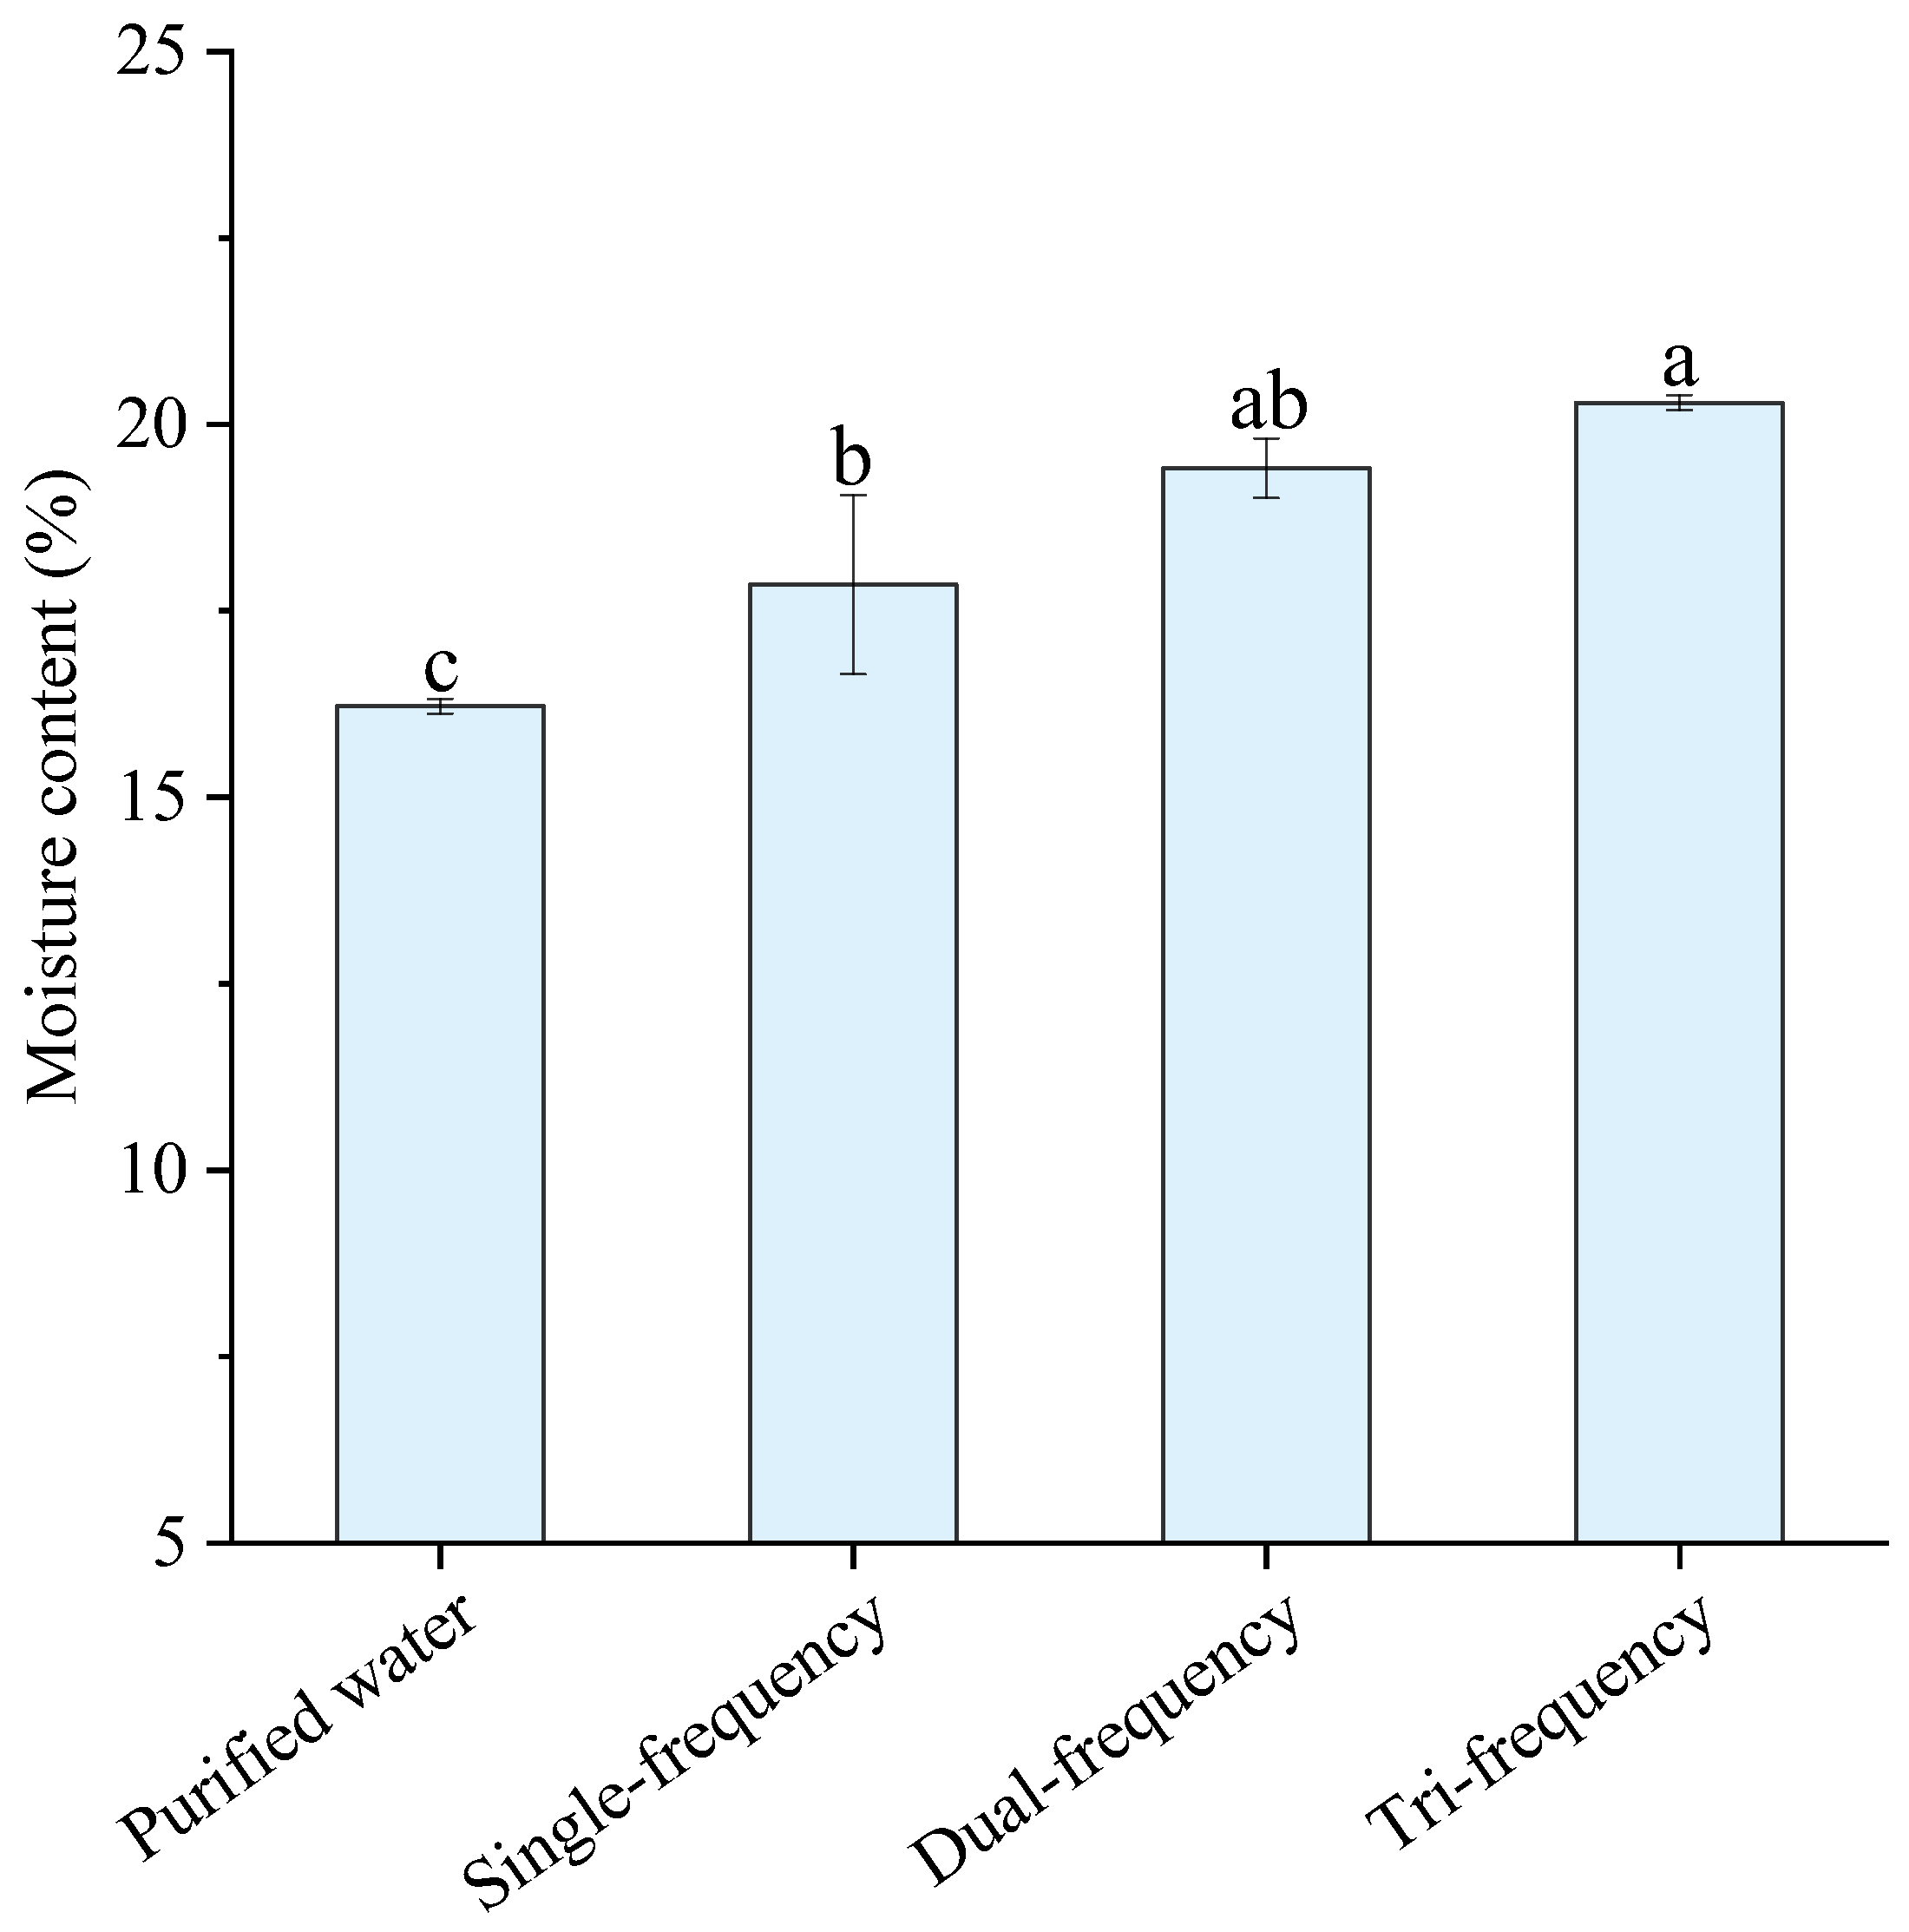
3.3.1. Determination of Moisture Content
3.3.2. Weight Gain and Loss of Solids
3.3.3. Colorimetry
3.3.4. Hardness
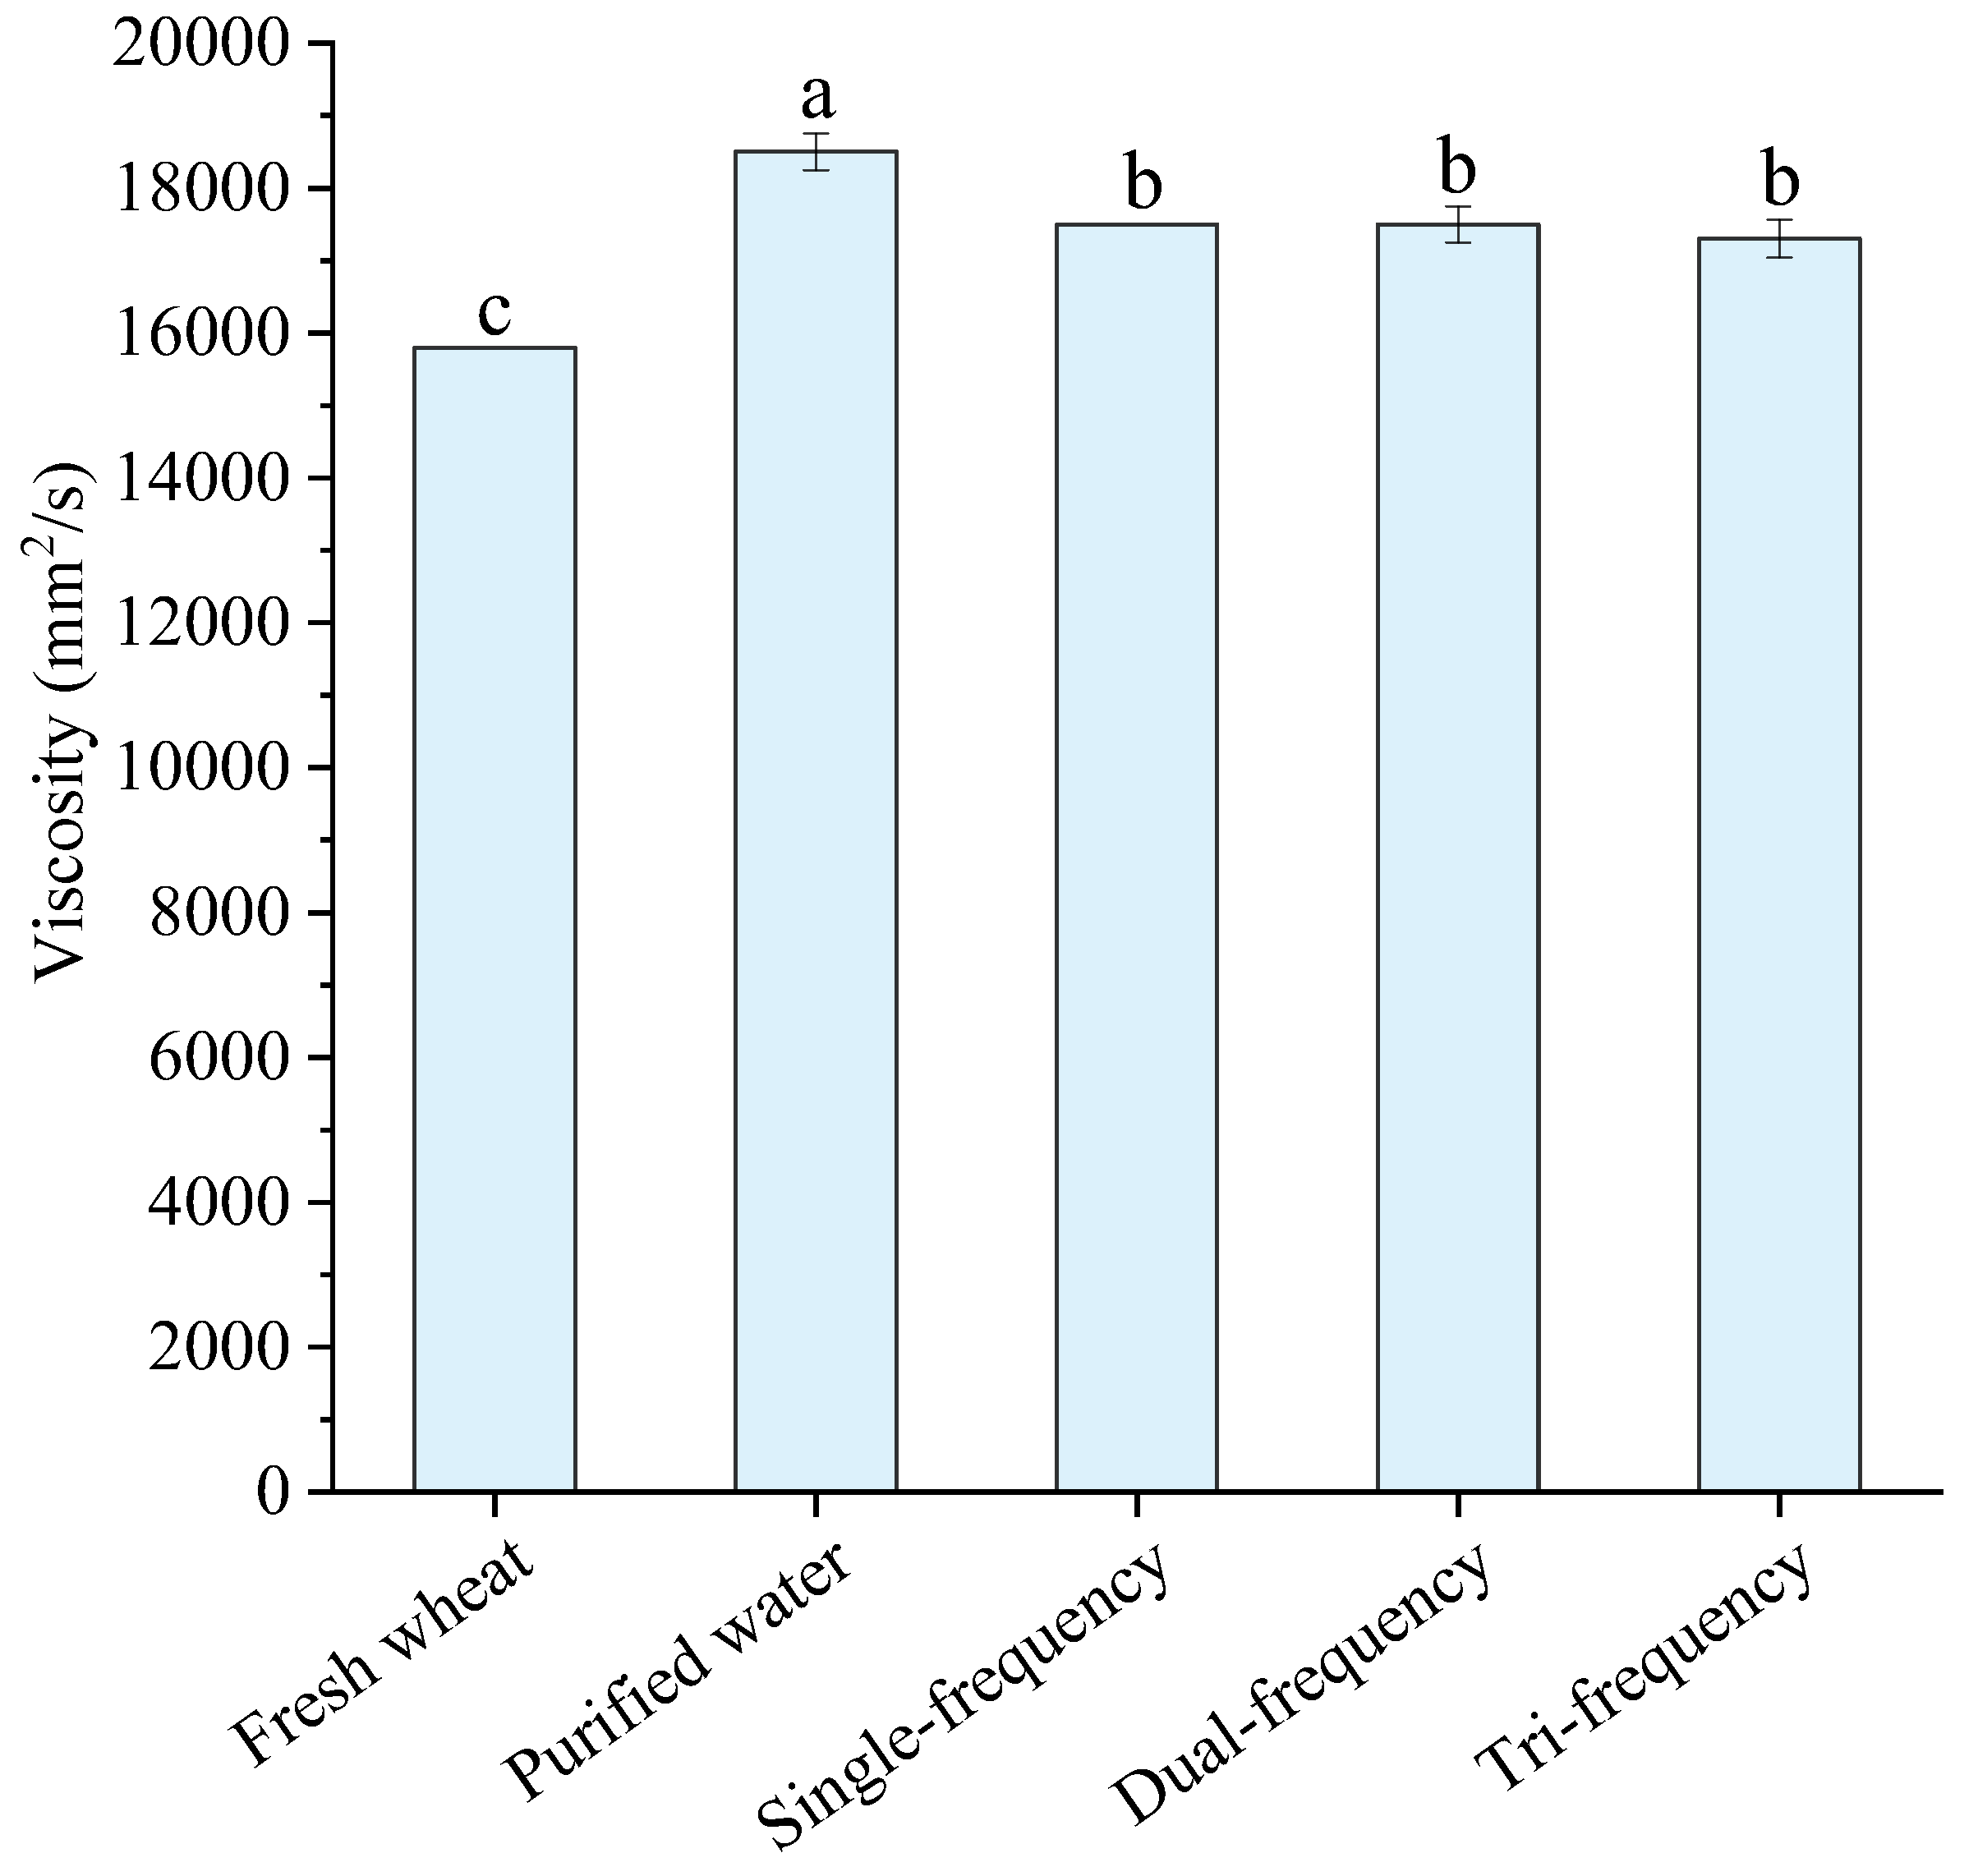
3.3.5. Viscosity
4. Conclusions
Author Contributions
Funding
Institutional Review Board Statement
Data Availability Statement
Conflicts of Interest
References
- Wu, J.; Manning, P.; Stasiewicz, M.J. Distillation as an alternative use for DON-contaminated wheat or rye: Minimal carryover of DON into distilled spirits. Food Addit. Contam. Part A 2025, 42, 369–375. [Google Scholar] [CrossRef] [PubMed]
- Soumya Moonjely, M.E.; Paton-Glassbrook, D.; Noel, Z.A.; Roze, L.; Shay, R.; Watkins, T.; Trail, F. Update on the state of research to manage Fusarium head blight. Fungal Genet. Biol. 2023, 169, 103829. [Google Scholar] [CrossRef]
- Chiha, M.; Hamdaoui, O.; Baup, S.; Gondrexon, N. Sonolytic degradation of endocrine disrupting chemical 4-cumylphenol in water. Ultrason. Sonochem. 2011, 18, 943–950. [Google Scholar] [CrossRef] [PubMed]
- Zúñiga-Benítez, H.; Soltan, J.; Peñuela, G.A. Application of ultrasound for degradation of benzophenone-3 in aqueous solutions. Int. J. Environ. Sci. Technol. 2016, 13, 77–86. [Google Scholar] [CrossRef]
- Marin, S.; Ramos, A.J.; Cano-Sancho, G.; Sanchis, V. Mycotoxins: Occurrence, toxicology, and exposure assessment. Food Chem. Toxicol. 2013, 60, 218–237. [Google Scholar] [CrossRef] [PubMed]
- de Lima Rocha, D.F.; Oliveira, M.D.S.; Furlong, E.B.; Junges, A.; Paroul, N.; Valduga, E.; Backes, G.T.; Zeni, J.; Cansian, R.L. Evaluation of the TLC quantification method and occurrence of deoxynivalenol in wheat flour of southern Brazil. Food Addit. Contam. Part A 2017, 34, 2220–2229. [Google Scholar] [CrossRef]
- Tabuc, C.; Marin, D.; Guerre, P.; Sesan, T.; Bailly, J.D. Molds and Mycotoxin Content of Cereals in Southeastern Romania. J. Food Prot. 2009, 72, 662–665. [Google Scholar] [CrossRef]
- Ji, F.; Xu, J.; Liu, X.; Yin, X.; Shi, J. Natural occurrence of deoxynivalenol and zearalenone in wheat from Jiangsu province, China. Food Chem. 2014, 157, 393–397. [Google Scholar] [CrossRef]
- Mishra, S.; Srivastava, S.; Dewangan, J.; Divakar, A.; Rath, S.K. Global occurrence of deoxynivalenol in food commodities and exposure risk assessment in humans in the last decade: A survey. Crit. Rev. Food Sci. Nutr. 2020, 60, 1346–1374. [Google Scholar] [CrossRef]
- Feizollahi, E.; Roopesh, M.S. Mechanisms of Deoxynivalenol (DON) degradation during different treatments: A review. Crit. Rev. Food Sci. Nutr. 2022, 62, 5903–5924. [Google Scholar] [CrossRef]
- Li, M.; Guan, E.; Bian, K. Effects of 60Co-γ irradiation on degradation of DON in scabbed wheat. J. Chin. Cereals Oils Assoc. 2015, 10, 1–5+14. [Google Scholar]
- Liu, Y.; Li, M.; Bian, K.; Guan, E.; Liu, Y.; Lu, Y. Reduction of Deoxynivalenol in Wheat with Superheated Steam and Its Effects on Wheat Quality. Toxins 2019, 11, 414. [Google Scholar] [CrossRef]
- Chen, X.; Qiu, Y.; Zhang, J.; Guo, Y.; Ding, Y.; Lyu, F. Degradation efficiency and products of deoxynivalenol treated by cold plasma and its application in wheat. Food Control 2022, 136, 108874. [Google Scholar] [CrossRef]
- Zhang, Y.; Ouyang, B.; Zhang, W.; Guang, C.; Xu, W.; Mu, W. Deoxynivalenol: Occurrence, toxicity, and degradation. Food Control 2024, 155, 110027. [Google Scholar] [CrossRef]
- Long, Y.; Mengmeng, L.; Guan, E.; Bian, K. Study on the degradation effect of ozonated water on DON in erythrosemic wheat. J. Henan Univ. Technol. (Nat. Sci. Ed.) 2018, 25–29, 36. [Google Scholar] [CrossRef]
- Xie, M.; Wang, M. Chemical removal of DON (Disease Onychomycotoxin). Shanghai J. Agric. 2000, 1, 58–61. [Google Scholar]
- Wu, Q.; Lohrey, L.; Cramer, B.; Yuan, Z.; Humpf, H. Impact of physicochernical parameters on the decomposition of deoxynivalenol during extrusion cooking of wheat grits. J. Agric. Food Chem. 2011, 59, 12480–12485. [Google Scholar] [CrossRef]
- He, Y.; Wu, L.; Liu, X.; Jiang, P.; Yu, L.; Qiu, J.; Ma, H. TaUGT6, a novel UDP-Glycosyltransferase gene enhances the resistance to FHB and DON accumulation in wheat. Front. Plant Sci. 2020, 11, 574775. [Google Scholar] [CrossRef]
- Chemat, F.; Zill-e-Huma; Khan, M.K. Applications of ultrasound in food technology: Processing, preservation and extraction. Ultrason. Sonochem. 2011, 18, 813–835. [Google Scholar] [CrossRef]
- Arzeni, C.; Martínez, K.; Zema, P.; Arias, A.; Pérez, O.E.; Pilosof, A.M.R. Comparative study of high intensity ultrasound effects on food proteins functionality. J. Food Eng. 2012, 108, 463–472. [Google Scholar] [CrossRef]
- Mahmoud, M.; Alelyani, M.; Ahmed, A.M.; Fagiry, M.A.; Alonazi, B.; Abdelbasset, W.K.; Alhailiy, A.B. Ultrasonic technology as a non-thermal approach for processing of fruit and vegetable juices: A review. Int. J. Food Prop. 2023, 26, 1114–1121. [Google Scholar] [CrossRef]
- Abdurahman, M.H.; Abdullah, A.Z.; Shoparwe, N.F. A comprehensive review on sonocatalytic, photocatalytic, and sonophotocatalytic processes for the degradation of antibiotics in water: Synergistic mechanism and degradation pathway. Chem. Eng. J. 2021, 413, 127412. [Google Scholar] [CrossRef]
- Fan, Q.; Zhang, J.; Cao, R.; Dai, C.; Wang, X.; Zhou, L. Ultrasonic-catalyzed ozone degradation of dibutyl phthalate in camel’s milk: Efficiency and oxidation profile. Environ. Technol. Innov. 2025, 37, 104035. [Google Scholar] [CrossRef]
- Guo, Y.; Wu, B.; Guo, X.; Liu, D.; Wu, P.; Ma, H.; Pan, Z.J. Ultrasonication and thermosonication blanching treatments of carrot at varying frequencies: Effects on peroxidase inactivation mechanisms and quality characterization evaluation. Food Chem. 2021, 343, 128524. [Google Scholar] [CrossRef] [PubMed]
- GB/T 5516-2011; Determination of Grain Oil—Determination of Kinematic Viscosity of Grains—Capillary Viscometer Method. Standards Press of China: Beijing, China, 2011.
- Yuan, D.; Li, Y. Ultrasonic modification to improve solubility of soybean isolate protein under acidic conditions. Food Feed. Ind. 2008, 1, 27–29. [Google Scholar] [CrossRef]
- Malik, S.; Saroha, A.K. Removal of Phenol from Wastewater Using Ultrasound Cavitation. J. Hazard. Toxic Radioact. Waste 2025, 29, 04024042. [Google Scholar] [CrossRef]
- Tiong, T.J.; Liew, D.K.L.; Gondipon, R.C.; Wong, R.W.; Loo, Y.L.; Lok, M.S.T.; Manickam, S. Identification of active sonochemical zones in a triple frequency ultrasonic reactor via physical and chemical characterization techniques. Ultrason. Sonochem. 2017, 35, 569–576. [Google Scholar] [CrossRef]
- Song, X. Numerical Calculation of Stepped Disc Nodal Line Position and Sound Field Distribution. Master’s Thesis, Shaanxi Normal University, Xi’an, China, 2009. [Google Scholar]
- Bullerman, L.B.; Bianchini, A. Stability of mycotoxins during food processing. Int. J. Food Microbiol. 2007, 119, 140–146. [Google Scholar] [CrossRef]
- Stepanik, T.; Kost, D.; Nowicki, T.; Gabay, D. Effects of electron beam irradiation on deoxynivalenol levels in distillers dried grain and solubles and in production intermediates. Food Addit. Contam. 2007, 24, 1001–1006. [Google Scholar] [CrossRef]
- Wang, J.; Vanga, S.K.; Raghavan, V. High-intensity ultrasound processing of kiwifruit juice: Effects on the ascorbic acid, total phenolics, flavonoids and antioxidant capacity. Food Sci. Technol. 2019, 107, 299–307. [Google Scholar] [CrossRef]
- Şayan, E.; Çalışkan, B. The Use of Ultrasound in Hydrometallurgical Studies: A Review on the Comparison of Ultrasound-Assisted and Conventional Leaching. J. Sustain. Metall. 2024, 10, 1933–1958. [Google Scholar] [CrossRef]
- Shevkani, K.; Singh, N.; Bajaj, R.; Kaur, A. Wheat starch production, structure, functionality and applications—A review. Int. J. Food Sci. Technol. 2017, 52, 38–58. [Google Scholar] [CrossRef]
- Kang, Z.; Geng, N.; He, M.; Xu, G.; Wang, Z.; Zhang, K. Effects of Amomum villosum polysaccharide on physicochemical and in vitro digestibility properties of wheat starch. Food Mach. 2024, 40, 19–24+110. [Google Scholar] [CrossRef]


| Instrument | Manufacturer |
|---|---|
| BSA2202S Analytical Balance | Sartorius Scientific Instruments Co., Ltd., Gottingen, Germany |
| WKSTQ900/3S Multi-Mode Ultrasonic Generator | Jiangsu Jiangda Wukesong Biotechnology Co., Ltd., Zhenjiang, China |
| BT100 Peristaltic Pump | Baoding Rongbai Constant Flow Pump Manufacturing Co., Ltd., Baoding, China |
| HMG001 Rapid Detection and Monitoring Analysis System (Type II) | Beijing Hua’an Maike Biotechnology Co., Ltd., Beijing, China |
| 101A-3 Electric Thermostatic Drying Oven | Shanghai Experimental Instrument Factory Co., Ltd., Shanghai, China |
| DFT-200A Grinder | Wenling Linda Machinery Co., Ltd., Taizhou, China |
| HunterLab Handheld Spectrophotometer | Hunter Associates Laboratory, Inc., Reston, VA, USA |
| TA-XT2i Food Texture Analyzer | Stable Micro Systems Ltd., Surrey, UK |
| Ubbelohde Viscometer (0.5–0.6 mm) | Shanghai Shenmeng Testing Technology Co., Ltd., Shanghai, China |
| 5810R Multi-Functional Benchtop Centrifuge | Shanghai Shenmeng Testing Technology Co., Ltd., Shanghai, China |
| LC-Vortex-P2 Vortex Mixer | Shanghai Lichen Bangxi Instrument Technology Co., Ltd., Shanghai, China |
| ZQZY-78CN Shaking Incubator | Shanghai Zhichu Instrument Co., Ltd., Shanghai, China |
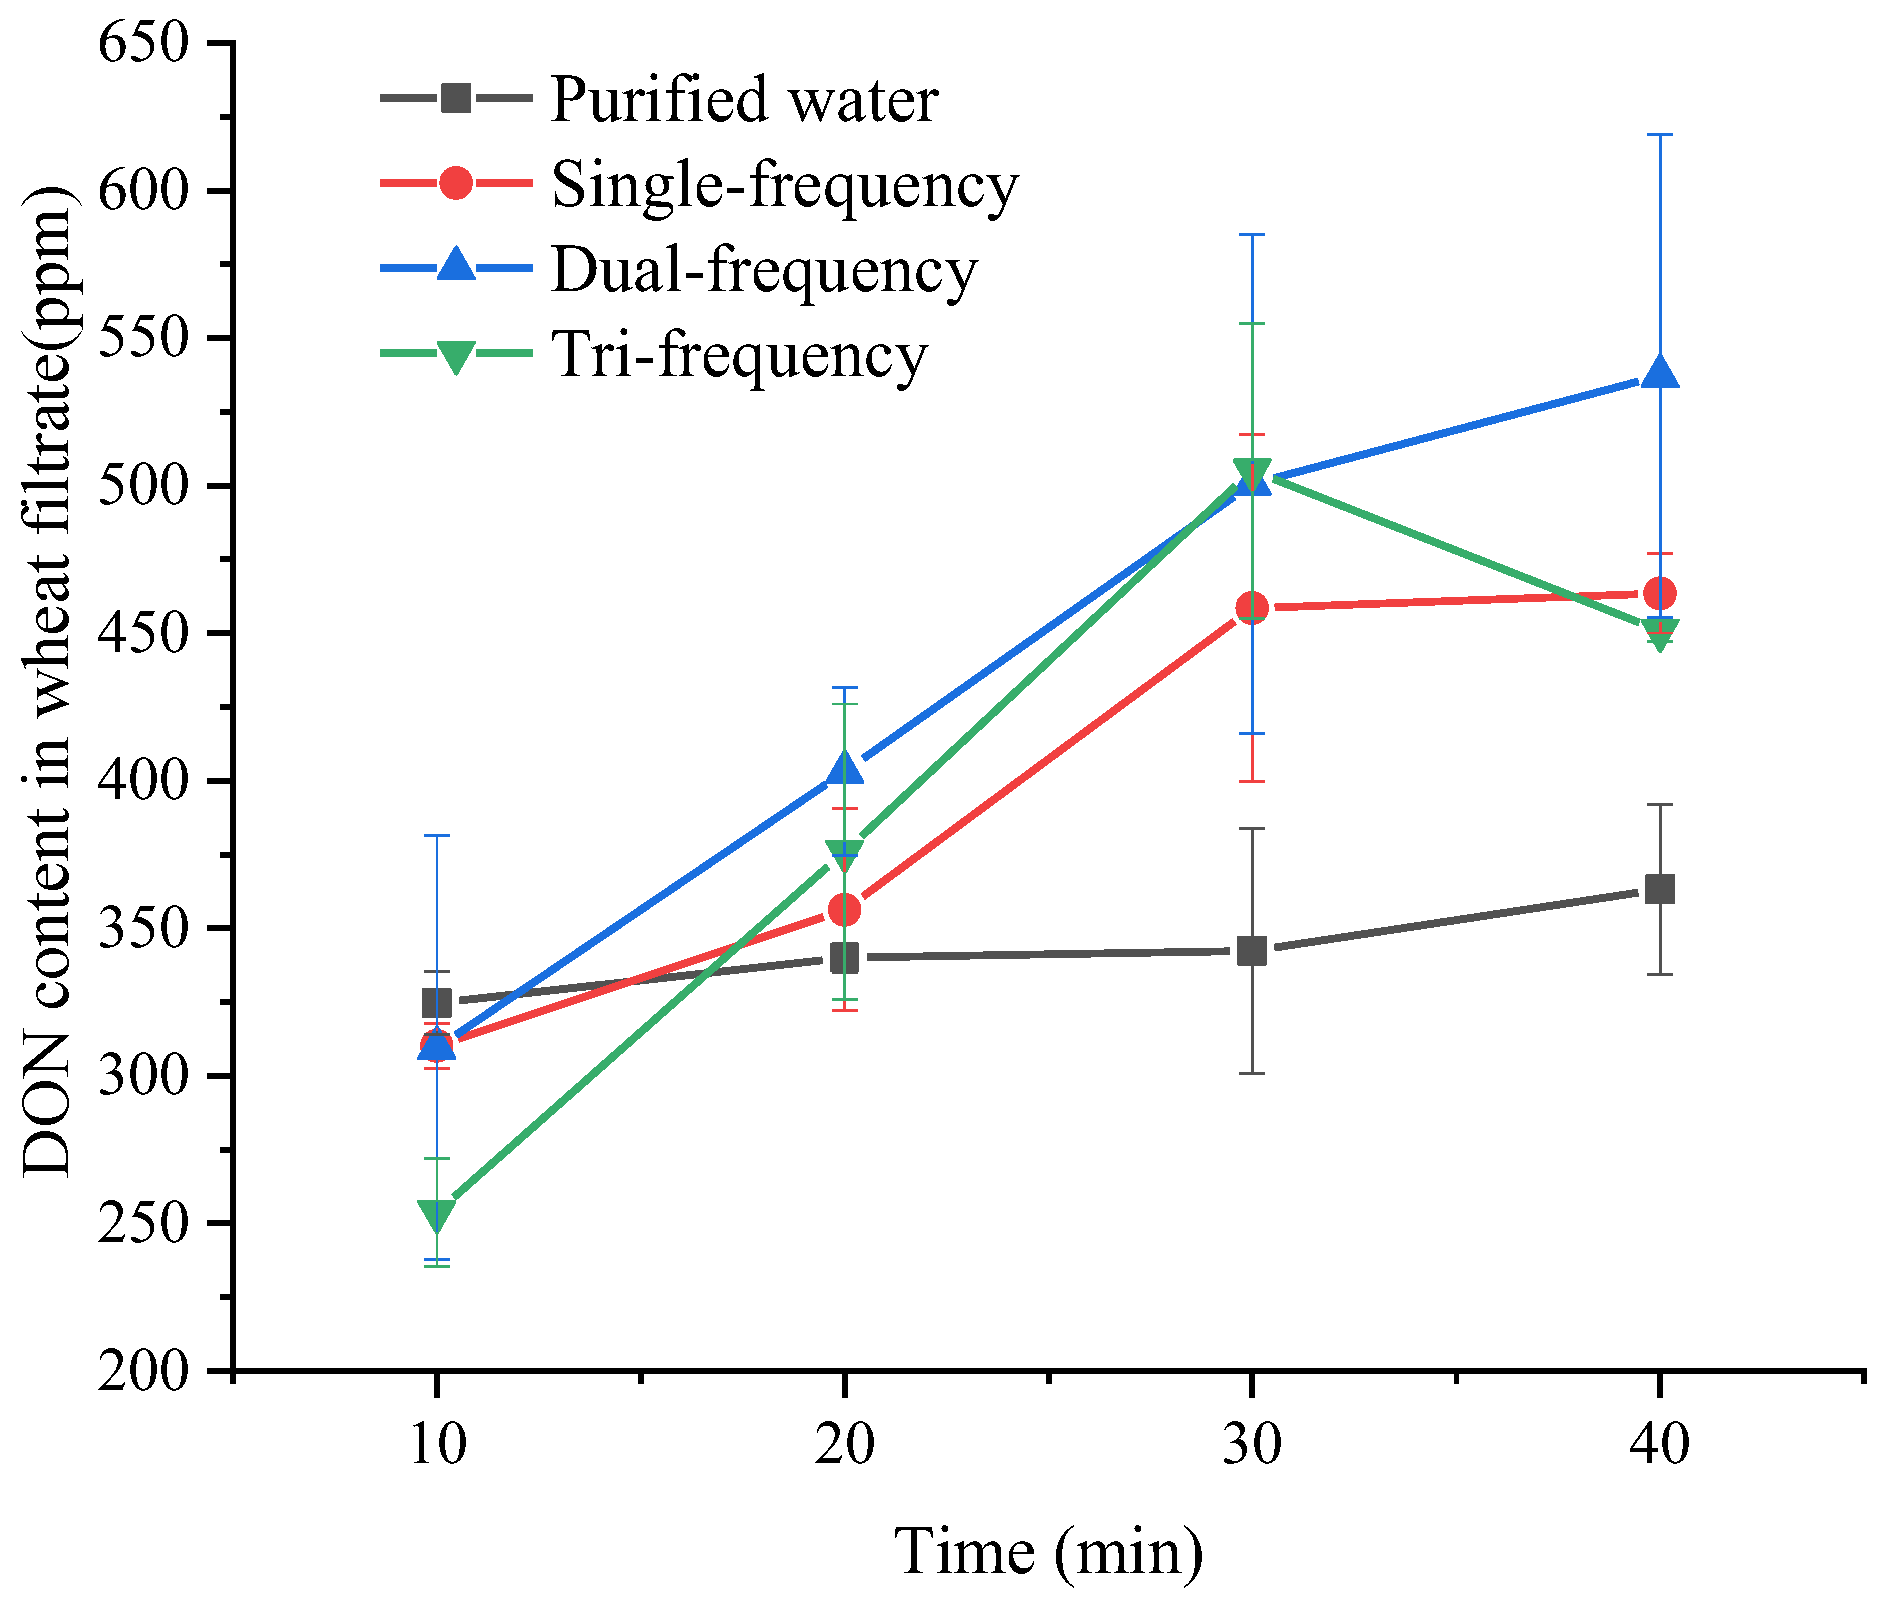
| Processing Condition (min) | DON Content in Wheat Filtrate (ppm) | Removal Rate (%) |
|---|---|---|
| Purified water-10 | 324.6800 ± 10.69145 de | 15.6171 ± 0.51426 de |
| Purified water-20 | 340.0400 ± 4.99217 de | 16.3559 ± 0.24012 de |
| Purified water-30 | 342.3250 ± 41.58495 de | 16.4658 ± 2.00024 de |
| Purified water-40 | 363.2750 ± 28.75803 cd | 17.4735 ± 1.38326 cd |
| Single-frequency-10 | 310.1500 ± 7.76403 de | 14.9182 ± 0.37345 de |
| Single-frequency-20 | 356.2900 ± 34.15326 cde | 17.1376 ± 1.64277 cde |
| Single-frequency-30 | 458.4350 ± 58.82421 abc | 22.0507 ± 2.82945 abc |
| Single-frequency-40 | 463.4950 ± 13.42796 abc | 22.2941 ± 0.64589 abc |
| Dual-frequency-10 | 309.5200 ± 71.84205 de | 14.8879 ± 3.45561 de |
| Dual-frequency-20 | 403.1300 ± 28.41155 bcd | 19.3906 ± 1.36660 bcd |
| Dual-frequency-30 | 500.6550 ± 84.59118 ab | 24.0815 ± 4.06884 ab |
| Dual-frequency-40 | 537.1700 ± 81.91125 a | 25.8379 ± 3.93994 a |
| Tri-frequency-10 | 253.8000 ± 18.31407 e | 12.2078 ± 0.88091 e |
| Tri-frequency-20 | 375.9650 ± 50.07023 cd | 18.0839 ± 2.40838 cd |
| Tri-frequency-30 | 505.0450 ± 49.98538 ab | 24.2927 ± 2.40430 ab |
| Tri-frequency-40 | 450.8300 ± 3.59210 abc | 21.6849 ± 0.17278 abc |
| Processing Conditions | Color Parameters | |||
|---|---|---|---|---|
| L* | a* | b* | ∆E | |
| Fresh wheat | 56.320 ± 0.31512 a | 6.1367 ± 1.26895 b | 15.3400 ± 2.20198 a | 0.00 ± 0.00 b |
| Purified water | 52.843 ± 0.13429 c | 6.3067 ± 0.68850 b | 15.7800 ± 1.06080 a | 2.45400 ± 1.491995 a |
| Single-frequency | 54.273 ± 0.32655 b | 7.1933 ± 0.55003 ab | 17.1967 ± 0.74002 a | 3.28050 ± 0.456084 a |
| Dual-frequency | 54.693 ± 0.50639 b | 6.8067 ± 0.38280 b | 16.2833 ± 0.49602 a | 1.81350 ± 0.258094 ab |
| Tri-frequency | 54.360 ± 0.57715 b | 8.5500 ± 0.88199 a | 16.5233 ± 0.28361 a | 2.50950 ± 0.222739 a |
| Processing Conditions | Color Parameters | |||
|---|---|---|---|---|
| L* | a* | b* | ∆E | |
| Fresh wheat | 87.1400 ± 0.48031 a | 3.0733 ± 0.04163 a | 15.8833 ± 0.28537 a | 0.00 ± 0.00 a |
| Purified water | 87.1733 ± 0.201080 a | 3.2067 ± 0.10693 a | 15.5933 ± 0.11015 ab | 1.16500 ± 0.564271 a |
| Single-frequency | 86.3033 ± 0.496622 a | 3.3067 ± 0.41429 a | 15.4367 ± 0.38280 ab | 1.86400 ± 0.386080 a |
| Dual-frequency | 85.0633 ± 0.80108 b | 2.9600 ± 0.14731 a | 15.2300 ± 0.26058 b | 1.84700 ± 1.101672 a |
| Tri-frequency | 86.4433 ± 0.650410 a | 3.3433 ± 0.20599 a | 15.5433 ± 0.28148 ab | 1.90250 ± 2.075358 a |
Disclaimer/Publisher’s Note: The statements, opinions and data contained in all publications are solely those of the individual author(s) and contributor(s) and not of MDPI and/or the editor(s). MDPI and/or the editor(s) disclaim responsibility for any injury to people or property resulting from any ideas, methods, instructions or products referred to in the content. |
© 2025 by the authors. Licensee MDPI, Basel, Switzerland. This article is an open access article distributed under the terms and conditions of the Creative Commons Attribution (CC BY) license (https://creativecommons.org/licenses/by/4.0/).
Share and Cite
Wu, B.; Song, C.; Nan, S.; Sun, B.; Ma, H.; Guo, Y. Optimization of Deoxynivalenol Removal from Wheat Grains Using Single- and Multi-Frequency Ultrasound and Impact on Quality Characteristics. Agriculture 2025, 15, 1085. https://doi.org/10.3390/agriculture15101085
Wu B, Song C, Nan S, Sun B, Ma H, Guo Y. Optimization of Deoxynivalenol Removal from Wheat Grains Using Single- and Multi-Frequency Ultrasound and Impact on Quality Characteristics. Agriculture. 2025; 15(10):1085. https://doi.org/10.3390/agriculture15101085
Chicago/Turabian StyleWu, Bengang, Chenyu Song, Shenao Nan, Baosheng Sun, Haile Ma, and Yiting Guo. 2025. "Optimization of Deoxynivalenol Removal from Wheat Grains Using Single- and Multi-Frequency Ultrasound and Impact on Quality Characteristics" Agriculture 15, no. 10: 1085. https://doi.org/10.3390/agriculture15101085
APA StyleWu, B., Song, C., Nan, S., Sun, B., Ma, H., & Guo, Y. (2025). Optimization of Deoxynivalenol Removal from Wheat Grains Using Single- and Multi-Frequency Ultrasound and Impact on Quality Characteristics. Agriculture, 15(10), 1085. https://doi.org/10.3390/agriculture15101085