Article

Functional Characteristics and Cellulose Degradation Genes of the Microbial Community in Soils with Different Initial pH Values

1
School of Agricultural Engineering, Jiangsu University, Zhenjiang 212013, China
2
High-Tech Key Laboratory of Agricultural Equipment and Intelligence of Jiangsu Province, Zhenjiang 212013, China
3
School of Electrical and Information Engineering, Jiangsu University, Zhenjiang 212013, China
4
School of Energy and Power Engineering, Jiangsu University, Zhenjiang 212013, China
*
Author to whom correspondence should be addressed.
Agriculture 2025, 15(10), 1068; https://doi.org/10.3390/agriculture15101068
Submission received: 31 March 2025 / Revised: 6 May 2025 / Accepted: 12 May 2025 / Published: 15 May 2025
(This article belongs to the Section Agricultural Soils)

Abstract

:
Soil pH critically regulates microbial community structure and activity, thereby influencing carbon transformation processes in terrestrial ecosystems. However, the mechanisms underlying pH-mediated shifts in microbial metabolic functions and cellulose-degrading functional genes remain poorly understood. This study investigated the responses of bacterial communities, metabolic profiles, and the abundance of cellobiohydrolase I (cbhI) and glycoside hydrolase family 48 (GH48) genes to varying pH levels in fluvo-aquic and red soils. High-throughput sequencing, PICRUSt-based metabolic prediction, and quantitative PCR were employed to analyze microbial composition, functional traits, and gene dynamics. Network analysis clarified linkages between functional genes, pathways, and taxa. The results revealed that elevated pH significantly increased CO2 emissions and dissolved organic carbon (DOC) content in both soils. Dominant taxa, including Alphaproteobacteria, Bacteroidetes, Xanthomonadaceae, and Mycoplasma, exhibited pH-dependent enrichment. Metabolic predictions indicated that pH positively influenced genes linked to biodegradation and xenobiotic metabolism in fluvo-aquic soil but suppressed energy-metabolism-related genes. Contrastingly, in red soil, cbhI and GH48 gene abundance declined with rising pH, suggesting that acidic conditions favor cellulolytic activity. Network analysis identified strong positive correlations between CO2 emissions and Caulobacteraceae, while cbhI and GH48 genes were closely associated with taxa such as Xanthomonadaceae, Comamonadaceae, and Micromonosporaceae, which drive organic matter decomposition. These findings underscore pH as a pivotal regulator of microbial community structure and functional gene expression, with soil-specific responses highlighting the need for tailored strategies to optimize carbon cycling and sequestration in agricultural ecosystems.

1. Introduction

Soil pH serves as a critical regulator influencing both physicochemical properties and biological characteristics in agricultural soils. Current research demonstrates that elevated pH levels significantly enhance soil organic carbon (SOC) mineralization processes [1,2]. This biochemical conversion represents a primary mechanism for atmospheric CO2 release, with amplified emissions directly contributing to greenhouse effect intensification through altered carbon cycling dynamics. Furthermore, alkaline conditions promote the solubilization of soil organic matter, particularly increasing dissolved organic carbon (DOC) concentrations [3,4]. Such pH-induced solubility changes render organic matter in fluvo-aquic soils more chemically labile compared to acidic soil systems, thereby reducing carbon stabilization potential. The dual regulatory mechanisms of pH—mediating both mineralization rates and substrate solubility—establish its pivotal role in determining soil carbon sequestration capacity and atmospheric carbon fluxes [5,6,7].
Soil pH exerts profound regulatory effects on microbial ecology through its narrow optimal range for microbial physiological processes [8]. The parameter fundamentally governs both microbial biomass dynamics and community architecture, as evidenced by phospholipid fatty acid profiling studies in the hoosfield acid strip, which established pH as a determinant of microbial population shifts [9,10]. Although pH-driven bacterial community shifts are well documented [11], methodological limitations hinder definitive conclusions. Current conclusions predominantly rely on comparative analyses of geographically disparate samples with inherent physicochemical variabilities beyond pH differences, thus precluding definitive causal attribution [12,13]. Though pioneering work at the Lausanne experimental station examined microbial responses under uniform soil matrices, these investigations failed to account for confounding factors such as root exudates and pH-mediated variations in plant-derived carbon inputs [14]. This knowledge gap underscores the necessity for controlled experiments isolating pH effects from edaphic and biological covariables.
Beyond community composition analysis, pH-driven functional metabolic adaptations remain poorly characterized. Emerging evidence suggests that pH gradients modulate enzymatic potential and substrate utilization efficiency, thereby altering nutrient transformation kinetics during organic matter decomposition [15]. Recent methodological advances, particularly Phylogenetic Investigation of Communities by Reconstruction of Unobserved States (PICRUSt), enable the predictive modeling of microbial metabolic functions through 16S rRNA sequence extrapolation [16]. While successfully deployed in wastewater treatment and composting systems, this metagenomic prediction tool remains underutilized in deciphering pH-dependent functional shifts in natural soil environments. The systematic application of such omics approaches could unravel mechanistic linkages between pH gradients, microbial catalysis pathways, and biogeochemical cycling dynamics [17].
The advent of molecular biotechnology has intensified the scientific scrutiny of functional gene dynamics in soil ecosystems [18]. While nitrogen-cycling-associated genes have been extensively documented, systematic investigations into genetic determinants governing carbon transformation processes remain scarce. Notably, carbon-fixation-related genes exert critical regulatory effects on organic matter mineralization. Cellulose, constituting the predominant recalcitrant carbon pool in arable soils, undergoes decomposition through a coordinated enzymatic hydrolysis-a rate-limiting step in terrestrial carbon cycling [19]. This biochemical process is mediated by three synergistic enzyme groups: endoglucanases, cellobiohydrolases (e.g., GH48 and cbhI) [20], and β-glucosidases, which collectively depolymerize crystalline cellulose. Recent methodological advances enable the targeted quantification of cellulolytic microorganisms via primers specific to cbhI and GH48 genes in ascomycete, basidiomycete fungi, and actinobacteria. These genetic markers not only reflect cellulolytic microbial abundance, but also elucidate their ecological contributions to carbon flux regulation. Given the pH-sensitive nature of enzymatic activities and microbial consortia, deciphering the tripartite relationship between pH gradients, cellulase-encoding genes, and microbial taxa is imperative for unraveling pH-mediated carbon conversion mechanisms. Soil pH critically regulates cellulolytic gene expression through direct enzymatic effects (e.g., pH-dependent enzyme stability) and indirect community shifts (e.g., favoring Acidobacteria in acidic soils vs. Proteobacteria in alkaline systems) [21]. Additionally, pH alters DOC availability and ionic toxicity (e.g., aluminum), further modulating microbial investment in cellulase production. These mechanisms highlight pH’s dual role in shaping cellulolytic gene dynamics [22]. Complementary network analyses further enable the identification of bacterial co-occurrence patterns and their associations with functional genes and environmental parameters [23,24].
In this study, in order to investigate functional characteristics and cellulose degradation genes of the microbial community in different initial pH, a 28-day incubation was conducted to investigate the succession of bacterial community under different pH gradients. The structure of the microbial community was determined by high-throughput sequencing, and the metabolic function characteristics of bacteria were further predicted by PICRUSt. Meanwhile, quantitative PCR was adopted to analyze the GH48 and cbhI genes’ abundance related to cellulose degradation, and the links between metabolic function characteristics and the cellulose degradation genes of the microbial community were established.

2. Materials and Methods

2.1. Soil Sample

The fluvo-aquic soil [25] samples were obtained from Fengqiu County, Henan Province, China (35°00′ N, 114°24′ E), following the wheat harvest. This region, characterized by a summer maize–winter wheat rotation system, represents a typical area of the North China Plain. The site experiences an average annual temperature of 13.9 °C and receives 615 mm of precipitation yearly. In contrast, red soil [26] was collected in July from Yingtan City, Jiangxi Province (28°12′ N, 116°57′ E), subsequent to rice harvesting. This southern location has warmer and wetter climatic conditions, with mean annual temperature and precipitation reaching 18 °C and 1800 mm, respectively.
The fluvo-aquic soil originates from Yellow River alluvial deposits, while the red soil was developed from Quaternary red clay. According to the China Soil Taxonomic Classification, these soils are categorized as semi-hydromorphic soil and Fe-accumuli-stagnic Anthrosol, respectively. Surface soil samples (0–20 cm depth) were collected from both sites. Following the removal of stones and visible plant residues, the soils were thoroughly mixed and sieved through a 2 mm mesh. The processed samples were then divided into two portions: one portion was air-dried for physicochemical analysis, while the other was preserved at 4 °C in refrigeration for subsequent incubation experiments.

2.2. Soil Experimental Procedure

To establish pH gradients, fluvo-aquic soil was adjusted to four levels (pH 7.0, 7.8, 8.5, and 9.0) through the addition of chemical amendments: 7.5 g Al2(SO4)3 for pH 7.0, no amendment for pH 7.8, 0.4 g lime for pH 8.5, and 0.9 g lime for pH 9.0, with corresponding labels of A 7.0, A 7.8, A 8.5, and A 9.0. Similarly, red soil was modified to create a pH gradient (5.8, 6.7, 7.5, and 8.5) by incorporating varying amounts of lime: 0 g, 0.1 g, 0.2 g, and 0.8 g, designated as R 5.8, R 6.7, R 7.5, and R 8.5, respectively. All soil samples underwent a two-week pre-incubation period at 25 °C and 50% water-holding capacity (WHC) in a biochemical incubator to reactivate microbial communities [27,28]. Following this stabilization phase, experimental incubations were conducted using 10 g of fresh soil (triplicates per treatment) in 250 mL conical flasks. The incubation process, maintained at 25 °C for 28 days, involved sealing each flask with a rubber stopper equipped with a central glass tube. Throughout the experimental period, soil moisture was consistently maintained at 50% WHC through periodic additions of deionized water.

2.3. Soil Chemical Analysis

Soil chemical analyses were performed using standardized methods [29,30,31]. Organic carbon content was quantified through wet oxidation with potassium dichromate (K2Cr2O7) and sulfuric acid (H2SO4). For total nitrogen determination, the Kjeldahl digestion method was employed. Soil pH measurements were conducted using a digital pH meter (Ohaus, Brooklyn, NY, USA) with a soil-to-water ratio of 1:2.5. To assess dissolved organic matter, soil samples were extracted with potassium sulfate (K2SO4) and filtered through 0.45 μm membranes, followed by an analysis of dissolved organic carbon (DOC) and nitrogen (DON) concentrations using a TOC analyzer (TOC-VCPH, Shimadzu, Kyoto, Japan).

2.4. CO2 Flux Measurement

CO2 flux was measured at 1, 3, 5, 7, 14, 21, and 28 days. At each gas sampling time point, 20 mL gas was taken from the headspace of the conical flask by airtight syringe and the gas was removed into a 20 mL vacuum vial for CO2 flux analysis [32]. The concentration of CO2 was measured by gas chromatography (Agilent 7890B, Santa Clara, CA, USA). CO2 emission rates were calculated by the following equation [33]:
E = P × V × Δ c Δ t × 1 R T × M × 1 m
where E is CO2 flux (μg·g−1·h−1), P is the standard atmosphere pressure (Pa), V is the headspace volume of the conical flask (cm3), Δc is the concentration changes in CO2 (ppm), Δt is the time between gas sample (h), R is universal gas constant (8.31 Pa·m3·mol−1·K−1), T is absolute gas temperature (K), M is the molecular mass of CO2 (g·mol−1), and m is the mass of incubating soil by dry weight basis (g).

2.5. DNA Extraction, High-Throughput Sequencing, and qPCR Amplification

Soil DNA extraction was performed on 0.6 g fresh samples using the FastDNA Spin Kit for Soil (MP Biomedicals, Solon, OH, USA) following manufacturer’s protocol. Extracted DNA was quantified and quality-checked using a NanoDrop ND-1000 spectrophotometer (NanoDrop Technologies, Wilmington, DE, USA) before storage at −80 °C for subsequent analysis.
For bacterial community analysis, the V4 region of 16S rRNA genes was amplified using universal primers F515 (5′-GTGCCAGCMGCCGCGGTAA-3′) and R806 (5′-GGACTACVSGGGTATCTAAT-3′). The 50 μL PCR reaction mixture consisted of 2 μL (5 μM) of each primer, 27 μL ddH2O, 2.5 μL template DNA (10 ng), 10 μL five-fold Fastpfu buffer, 1 μL TransStart Fastpfu polymerase (TransGen, Beijing, China), 5 μL dNTPs (2.5 mM), and 0.5 μL bovine serum albumin. Following amplification using previously described thermal cycling conditions [34], PCR products were purified using a PCR Clean-up Purification Kit (MP Biomedicals) and quantified with a Qubit 2.0 fluorimeter (Invitrogen, Carlsbad, CA, USA). Equimolar concentrations of purified products were pooled for paired-end sequencing (2 × 250 bp) on an Illumina MiSeq platform [35,36,37].
Gene quantification of GH48 and cbhI was conducted through quantitative real-time PCR (q-PCR) using an iCycler system (BioRad, Hercules, CA, USA) with Bio-Rad iQ5 v2.0 analysis software. Target genes were amplified using specific primer pairs: fungcbhIF (ACCAAYTGCTAYACIRGYAA) and fungcbhIR (GCYTCCCAIATRTCCATC) for cbhI, and GH48_F8 (GCCADGHTBGGCGACTACCT) and GH48_R5 (CGCCCCABGMSWWGTACCA) for GH48. The 20 μL reaction mixture contained 0.4 μL (10 μM) of each primer, 7.6 μL ddH2O, 1.6 μL diluted DNA (10-fold), and 10 μL 2× SuperMix. Standard curves (102–108 gene copies) were generated using tenfold serial dilutions of plasmid DNA containing target gene sequences. The primers fungcbhIF (5′-ACCAAYTGCTAYACIRGYAA-3′) and fungcbhIR (5′-GCYTCCCAIATRTCCATC-3′) for cbhI and GH48_F8 (5′-GCCADGHTBGGCGACTACCT-3′) and GH48_R5 (5′-CGCCCCABGMSWWGTACCA-3′) for GH48 were selected based on their specificity for targeting cellulolytic genes in ascomycete fungi, basidiomycetes, and actinobacteria, as validated in previous studies by Edwards et al. and de Menezes et al. [38,39]. The qPCR reactions were performed using 2× SYBR Green SuperMix (Bio-Rad, Hercules, CA, USA), which contains SYBR Green I dye, dNTPs, stabilizers, and iTaq DNA polymerase. Each 20 μL reaction mixture included 0.4 μL (10 μM) of each primer, 7.6 μL ddH2O, 1.6 μL diluted DNA (10-fold), and 10 μL SuperMix. Thermal cycling conditions followed the protocols described in the aforementioned references, with an initial denaturation at 95 °C for 3 min, followed by 40 cycles of 95 °C for 30 s, 55 °C annealing for 30 s, and 72 °C extension for 45 s.

2.6. Statistical Analysis

Before analysis, Raw Illumina PE 250 bp data were first quantity-filtered and trimmed to a consistent length, then the same sequence, chimera, and low-quality sequence were deleted. The OTU (operational taxonomic unit) [40] was identified at a >97% similar sequence clusters level using UCLUST in Quantitative Insights into Microbial Ecology (QIIME) software pipeline. The representative sequence of each OTU was selected and assigned the taxonomy annotation using the Ribosomal Database Project (RDP) classifier. The indicators of Chao1, Shannon, and Observed-OTUs were determined to represent the alpha-diversity of microbial communities. Principal components analysis (PCA) was conducted using R (version 3.4.3 for windows) package to compare microbial community structures of all samples. The bacterial OTUs were uploaded into PICRUSt, which was used to predict the functional characteristics of bacterial OTUs, and the metagenomes prediction was analyzed using the KEGG database after normalizing the OTUs [41]. It should be noted that PICRUSt predictions are based on inferred gene content from reference genomes rather than direct metagenomic data, which may introduce inaccuracies in complex or under-characterized microbial communities. The statistical analysis was performed by one-way analysis of variance (ANOVA) with SPSS 20.0 software, and post hoc tests (Tukey’s LSD) was used to assess significance. Graphs were conducted using Origin 8.1.
Network analysis [42,43] was conducted on bacterial high throughput sequence data and soil properties using maximal information coefficient (MIC) in MINE software. The MIC was a highly useful score that can reveal the strength of linear and non-linear associations among variables [44]. A total of 143 OTUs with strong positive (r > 0.8), strong negative (r < −0.08), and strong nonlinear (MIC-p2 > 0.8) relationships were included in network diagrams in Cytoscape 3.6.1 [45]. The network analyzer tool was used to calculate the network topological characteristics in Cytoscape. Mode application with default parameters was used for analyzing the modular structure of highly interconnected nodes. OTUs with maximum betweenness centrality scores were considered as keystone species [46].

3. Results and Discussion

3.1. Soil CO2 Emission and Soil Properties

Soil organic carbon mineralization releases CO2, and pH plays an important role in this process [47]. In the present study, the respiration variations of two kinds of soil with different pH values were revealed. As shown in Figure 1A,B, the CO2 flux is high from the first day to the 14th day, but this decreases and tends to be stable after 14 days in fluvo-aquic and red soil. Labels A 7.0, A 7.8, A 8.5, and A 9.0 denote fluvo-aquic soil treatments adjusted to pH 7.0, 7.8, 8.5, and 9.0, respectively, while R 5.7, R 6.7, R 7.5, and R 8.5 represent red soil treatments at pH 5.7, 6.7, 7.5, and 8.5 (Section 2.2). Subfigures C and D (labeled a–d) illustrate dissolved organic carbon (DOC) and nitrogen (DON) concentrations under each pH treatment, where a: pH 7.0 (fluvo-aquic)/pH 5.7 (red), b: pH 7.8/pH 6.7, c: pH 8.5/pH 7.5, and d: pH 9.0/pH 8.5.
Generally, the obvious result was that CO2 flux was positively correlated with pH in fluvo-aquic and red soil, except the R 5.7. This result was consistent with the results of Xu et al. [48], who found that the highest emissions of CO2 occurred in relatively high pH soil. Acidity is detrimental to the activity of soil microorganisms, which leads to a reduction in soil respiration [49]. In addition, low pH promoted aluminum activity, which was harmful to microbial activity after releasing aluminum into the soil [50,51]. On the other hand, the addition of lime increases the ability of soil microorganisms to utilize macromolecular substances and the metabolic potential of microorganisms, thus increasing soil respiration.
Moreover, the changes in DOC and DON content in two kinds of soil with different pH gradients are shown in Figure 1C,D. In fluvo-aquic soil, DOC concentrations increased by 208.68 mg·kg−1 from pH 7.0 to pH 8.5; in red soil, DOC concentrations increased by 240.60 mg·kg−1 from pH 5.7 to pH 8.5. It was obvious that the DOC concentrations were positively correlated with soil pH (Figure 1C). DON showed the highest contents in pH 9.0 for alkaline soil and the highest in pH 7.5 for red soil, respectively (Figure 1D). The high DOC and DON concentrations in the high pH value were likely to be a result of the stimulation of the solubility of soil organic matter induced by liming [52]. A tentative inference on this result is that the increase in pH likely helps metabolize large molecules [53] and releases more readily available substances for use by the microbes; thus, accelerated soil microbial respiration leads to the loss of soil-dissolved organic carbon.

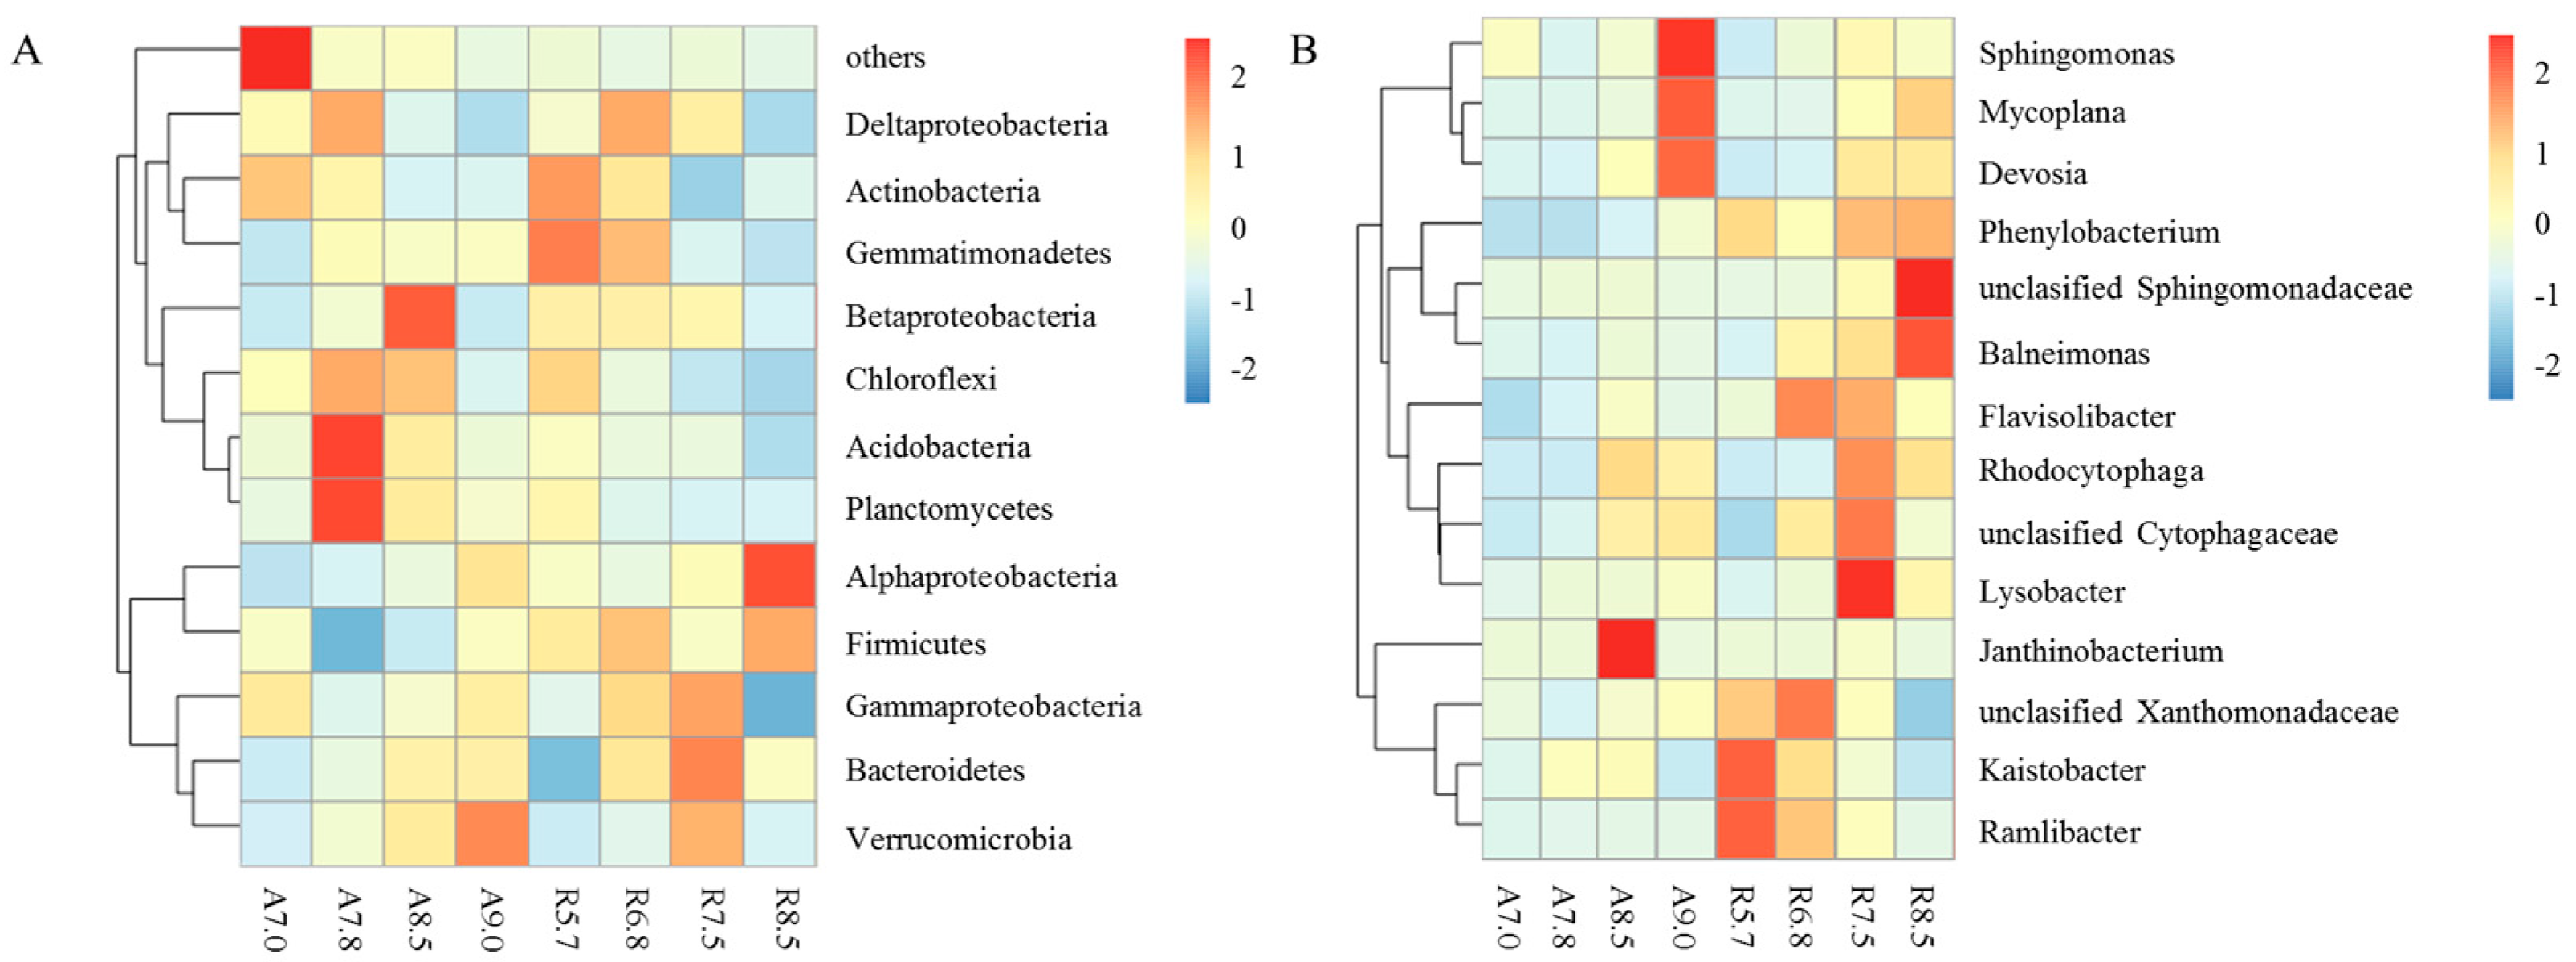
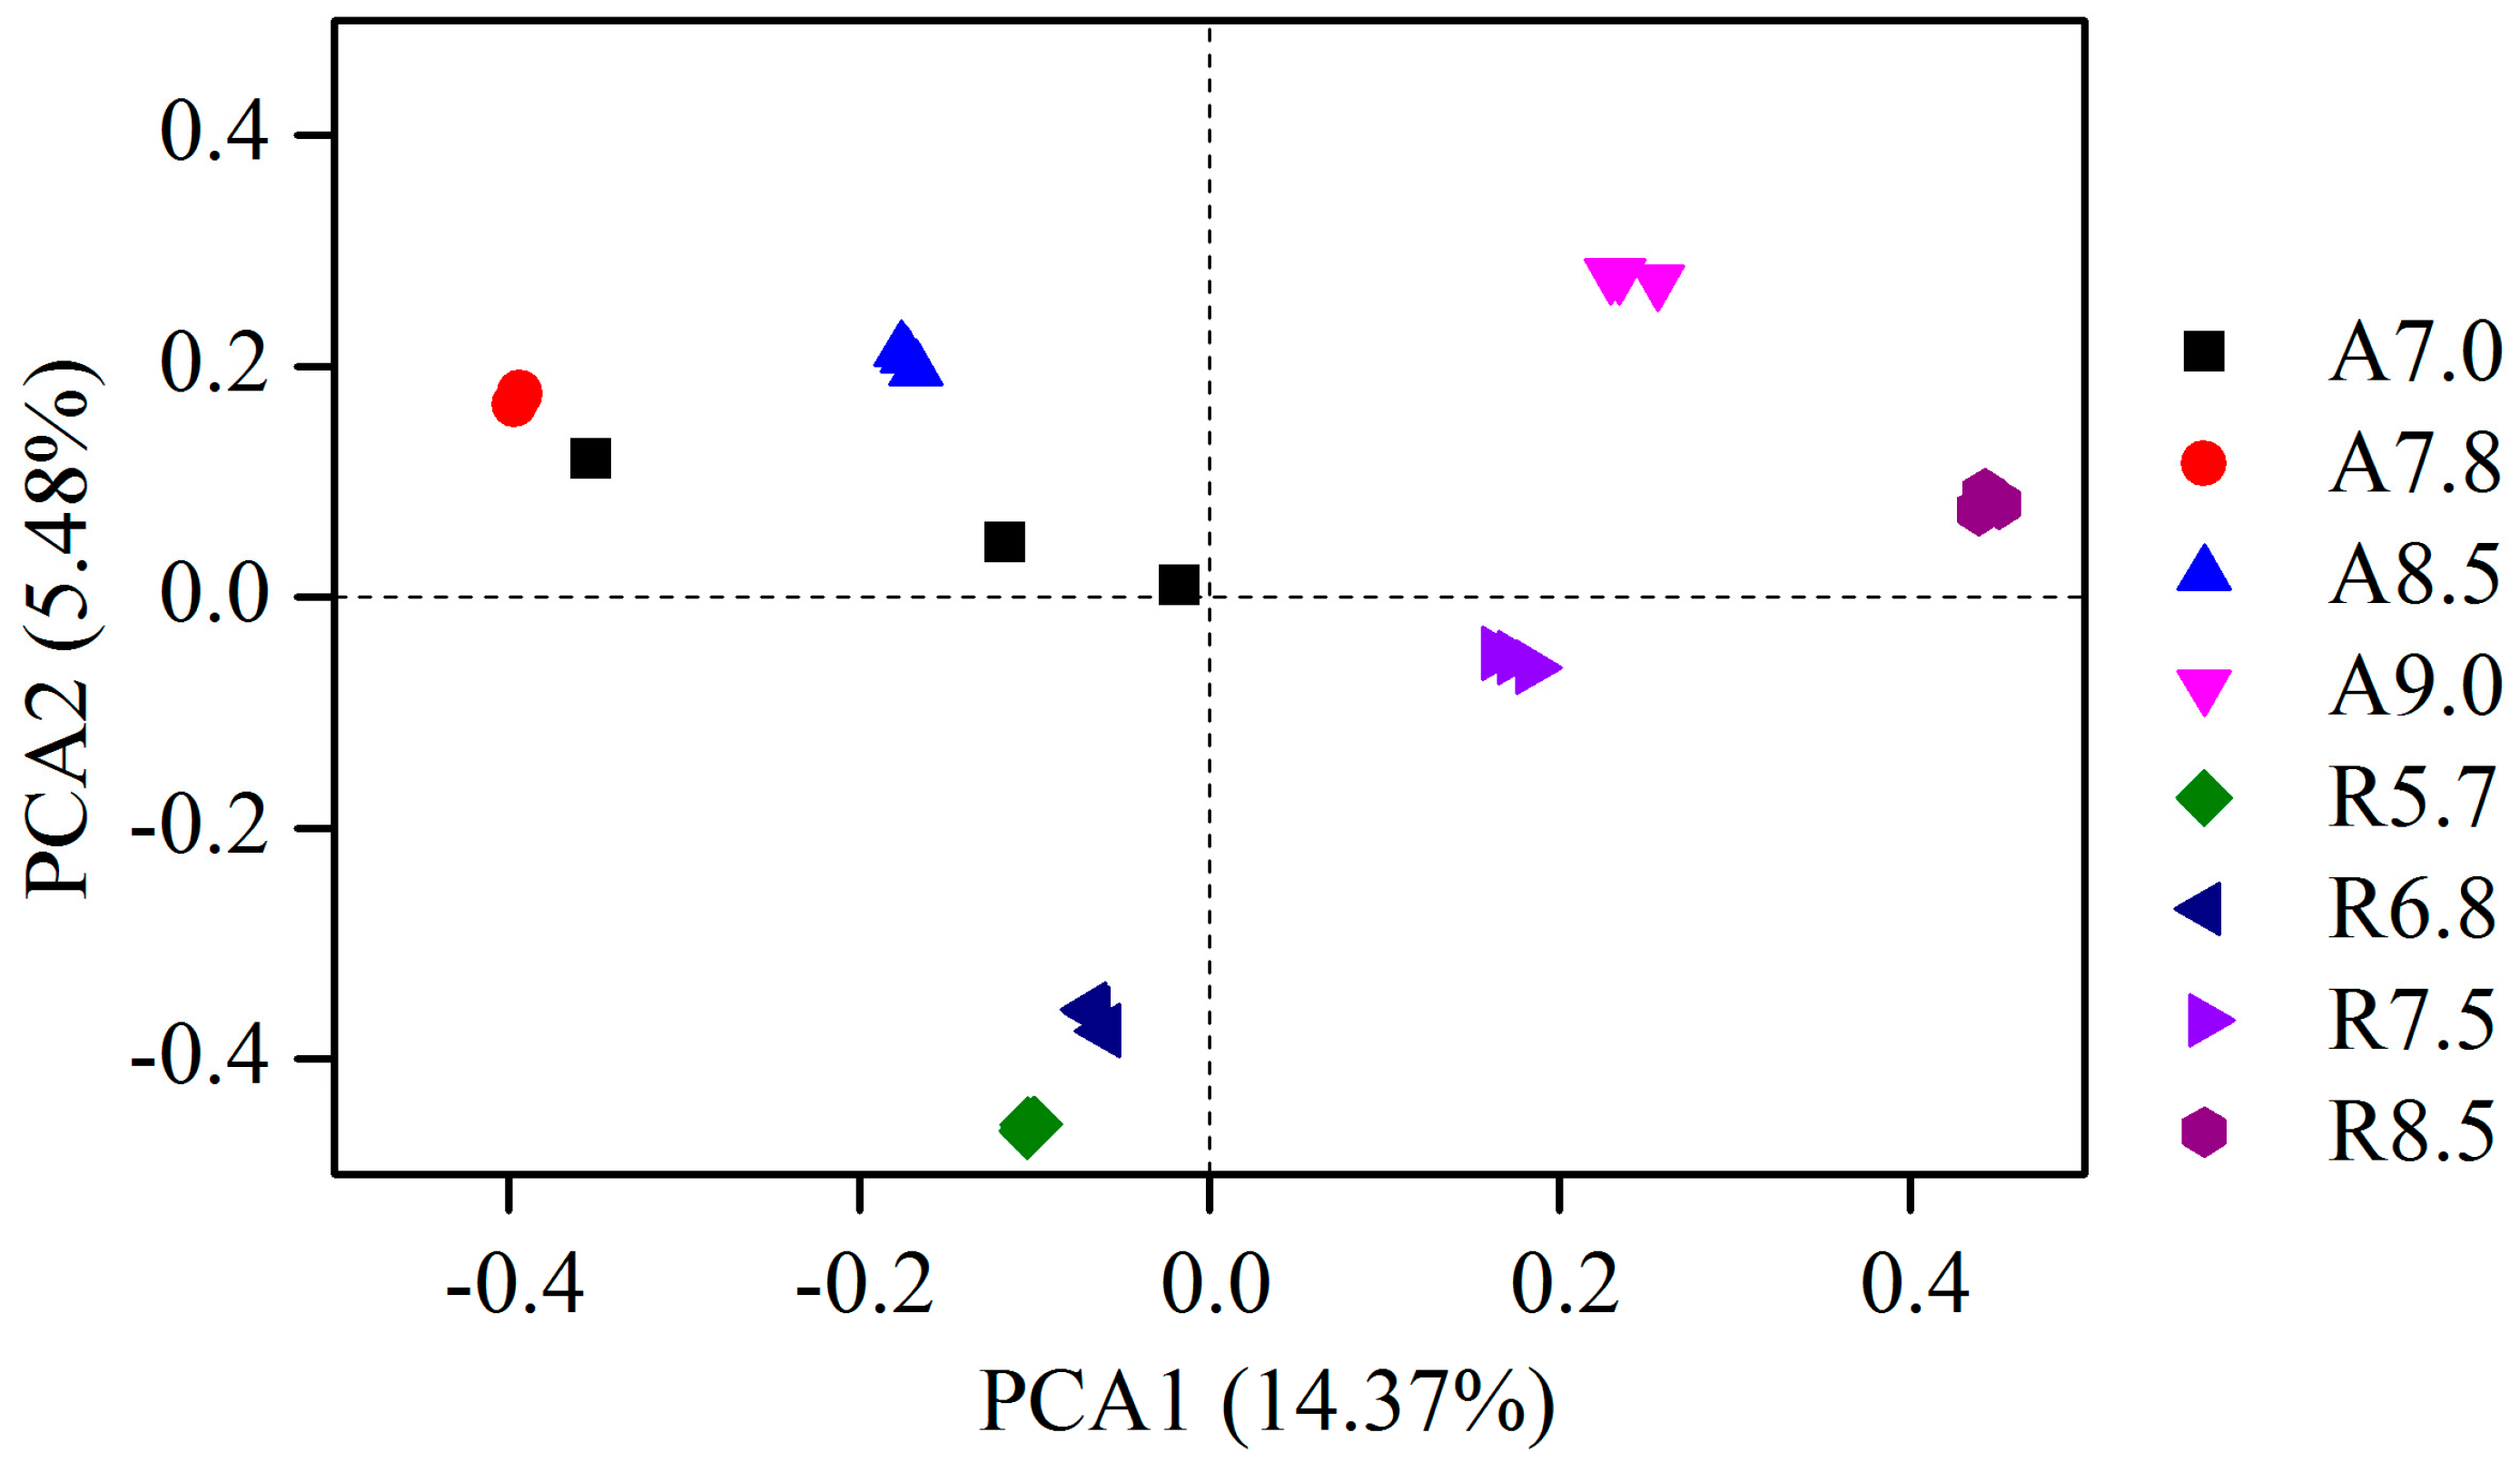
3.2. Bacterial Community Composition

The bacterial community composition of two kinds of soil with different pH values was determined based on the high-throughput sequence. In the present study, Alphaproteobacteria, Bacteroidetes Acidobacteria, and Actinobacteria were the dominant phyla in all treatments in two kinds of soil (Figure 2A). The relative abundance of Alphaproteobacteria increased the most as pH increased in both soils, which was similar to previous results. For instance, an upward trend has been found in the relative abundance of Alphaproteobacteria toward high pH in arable soil and Craibstone Experimental Farm soil due to different original soils [14,54]. The relative abundance of Bacteroidetes was higher in high-pH soils than those with low pH. Alphaproteobacteria and Bacteroidetes, as eutrophic microorganisms, grow well in the sufficient substrate condition [55]. In our study, the increasing content of DOC with high pH may contribute to the increased abundances of Alphaproteobacteria and Bacteroides. As shown in our study, Acidobacteria presented a decreased trend toward high pH (Figure 2A). Many members of the Acidobacteria phylum belong to oligotrophic microorganisms. Thus, the increase in DOC content with high pH increased competition and inhibited the activity of members of Acidobacteria, which was in line with the previous study [12]. As heterotrophic aerobic bacteria, Actinobacteria decreased toward high pH in two kinds of soil (Figure 2A).
The 14 most abundant bacterial genera (Figure 2B) were unclassified Xanthomonadaceae, unclassified Sphingomonadaceae, Mycoplana, and Kaistobacter in two kinds of soil (Figure 2B). Xanthomonadaceae was described previously as a decomposer of hydrocarbon, and it can obtain carbon from co-occurring microbes [56]. Sphingomonadaceae could transform the nutrients and decompose the recalcitrant carbon resource and aromatic compound [57,58]. In our study, the relative abundance of Sphingomonadaceae showed an obvious increase toward high pH in red soil, which indicated that high pH could stimulate soil refractory substance and reduce the stability of soil organic carbon. The abundance of Mycoplana, belonging to the family Caulobacteraceae, showed a significantly positive correlation with pH value in two kinds of soil (Figure 2B). Mycoplana was considered as a rhizospheric microorganism and it was prevalent in fertile soils [59]. Taken together, Mycoplana microorganisms are abundant in high pH because the high pH value improves the nutrient utilization rate of soil. Kaistobacter was more sensitive to pH change in red soil than that in fluvo-aquic soil and its abundance showed a negative correlation with pH in red soil (Figure 2B). It has been demonstrated that Kaistobacter is widely present in an Fe mineral reduction environment; the low pH value can increase the solubility of Fe, increase the activity of Fe3+ reductase, and reduce Fe3+ to Fe2+ to facilitate root absorption [60] (Figure 3).
Principal component analysis (PCA) revealed distinct clustering patterns of bacterial communities across pH gradients. The first two principal components (PC1 and PC2) explained 68% of the total variance (PC1: 52%, PC2: 16%). Fluvo-aquic soil treatments (A 7.0, A 7.8, A 8.5) clustered closely along PC1, indicating minimal structural divergence at moderate pH levels. In contrast, red soil treatments (R 5.7, R 6.7) formed a separate group, reflecting inherent differences in native microbial communities. Notably, high-pH treatments (A 9.0 and R 8.5) diverged significantly from their respective soil clusters, demonstrating that extreme pH shifts restructured bacterial assemblages [61].
The distribution along PC1 correlated strongly with pH gradients (Mantel r = 0.89, p < 0.001), confirming pH as the dominant driver of community variation. This axis primarily separated taxa adapted to alkaline conditions (e.g., Alphaproteobacteria) from acidophilic groups (e.g., Acidobacteria). In red soil, the rightward shift of R 8.5 along PC1 mirrored the enrichment of Bacteroidetes and suppression of Actinobacteria, consistent with their pH-dependent metabolic strategies [62].
Mantel tests further quantified pH-dependent associations (Table 1). Significant positive correlations (r > 0.6, p < 0.01) were observed between pH and Alphaproteobacteria (r = 0.76), Bacteroidetes (r = 0.69), and Actinobacteria (r = 0.78) in fluvo-aquic soil, while Acidobacteria abundance declined with pH (r = −0.63). In red soil, Bacteroidetes (r = 0.90) and Acidobacteria (r = −0.83) exhibited contrasting trends, underscoring soil-specific pH effects. Notably, CO2 emissions and DOC showed strong pH dependence (r > 0.85), aligning with enhanced microbial activity under alkaline conditions [63,64,65].

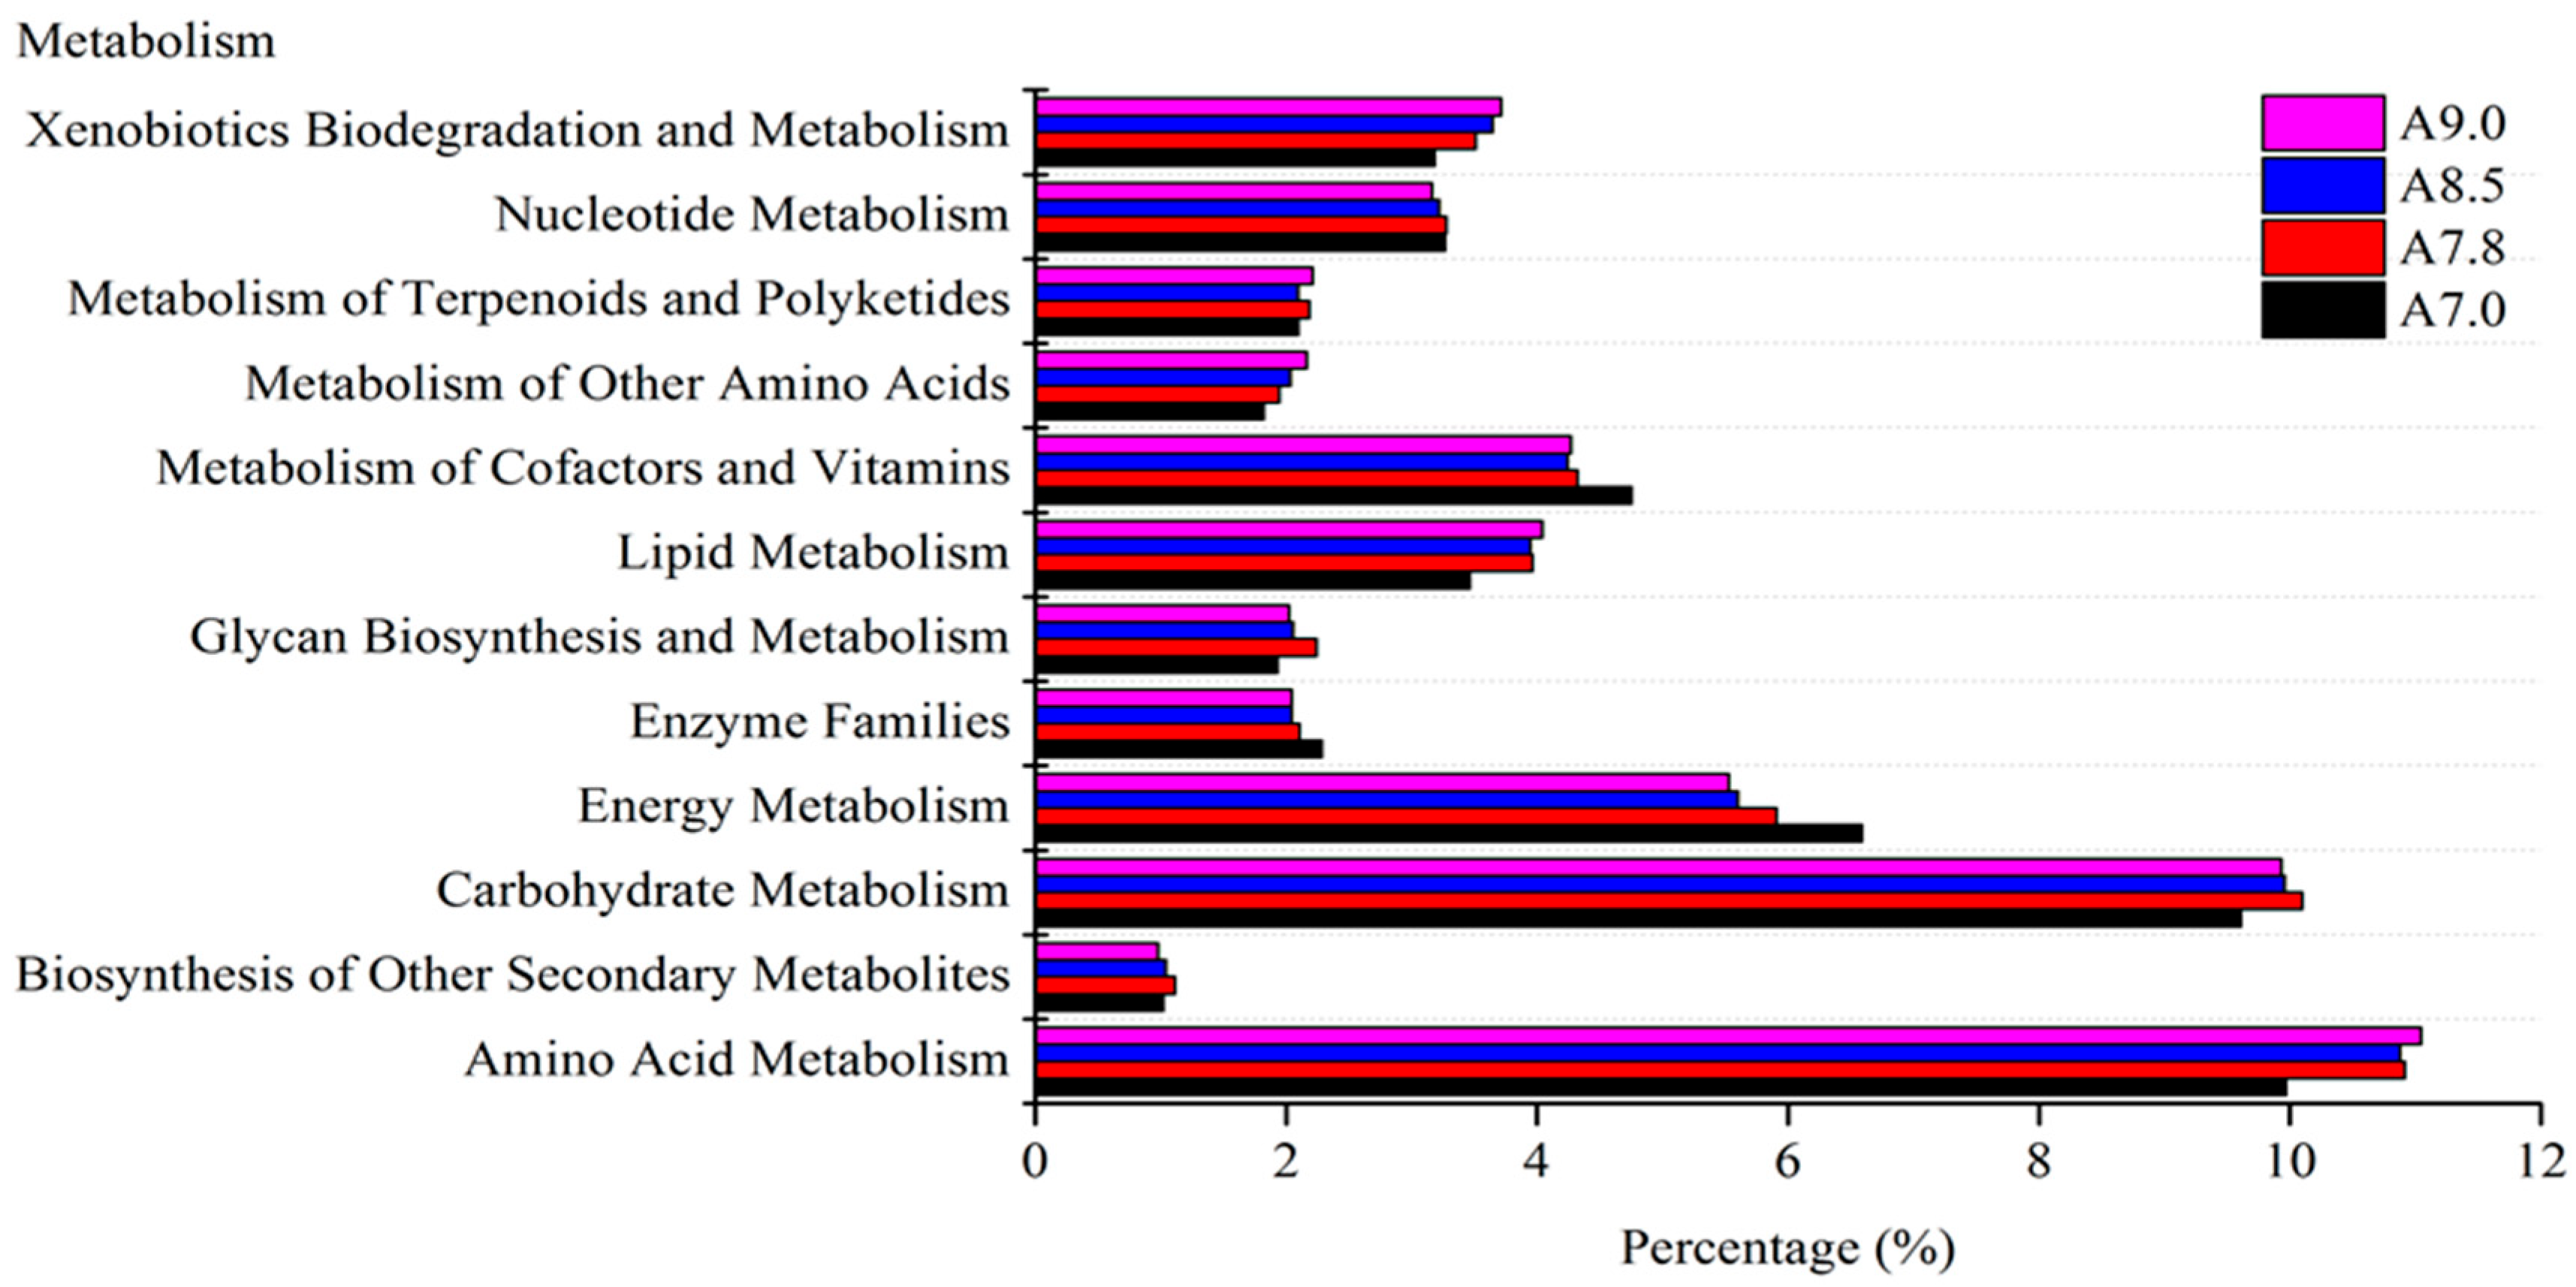
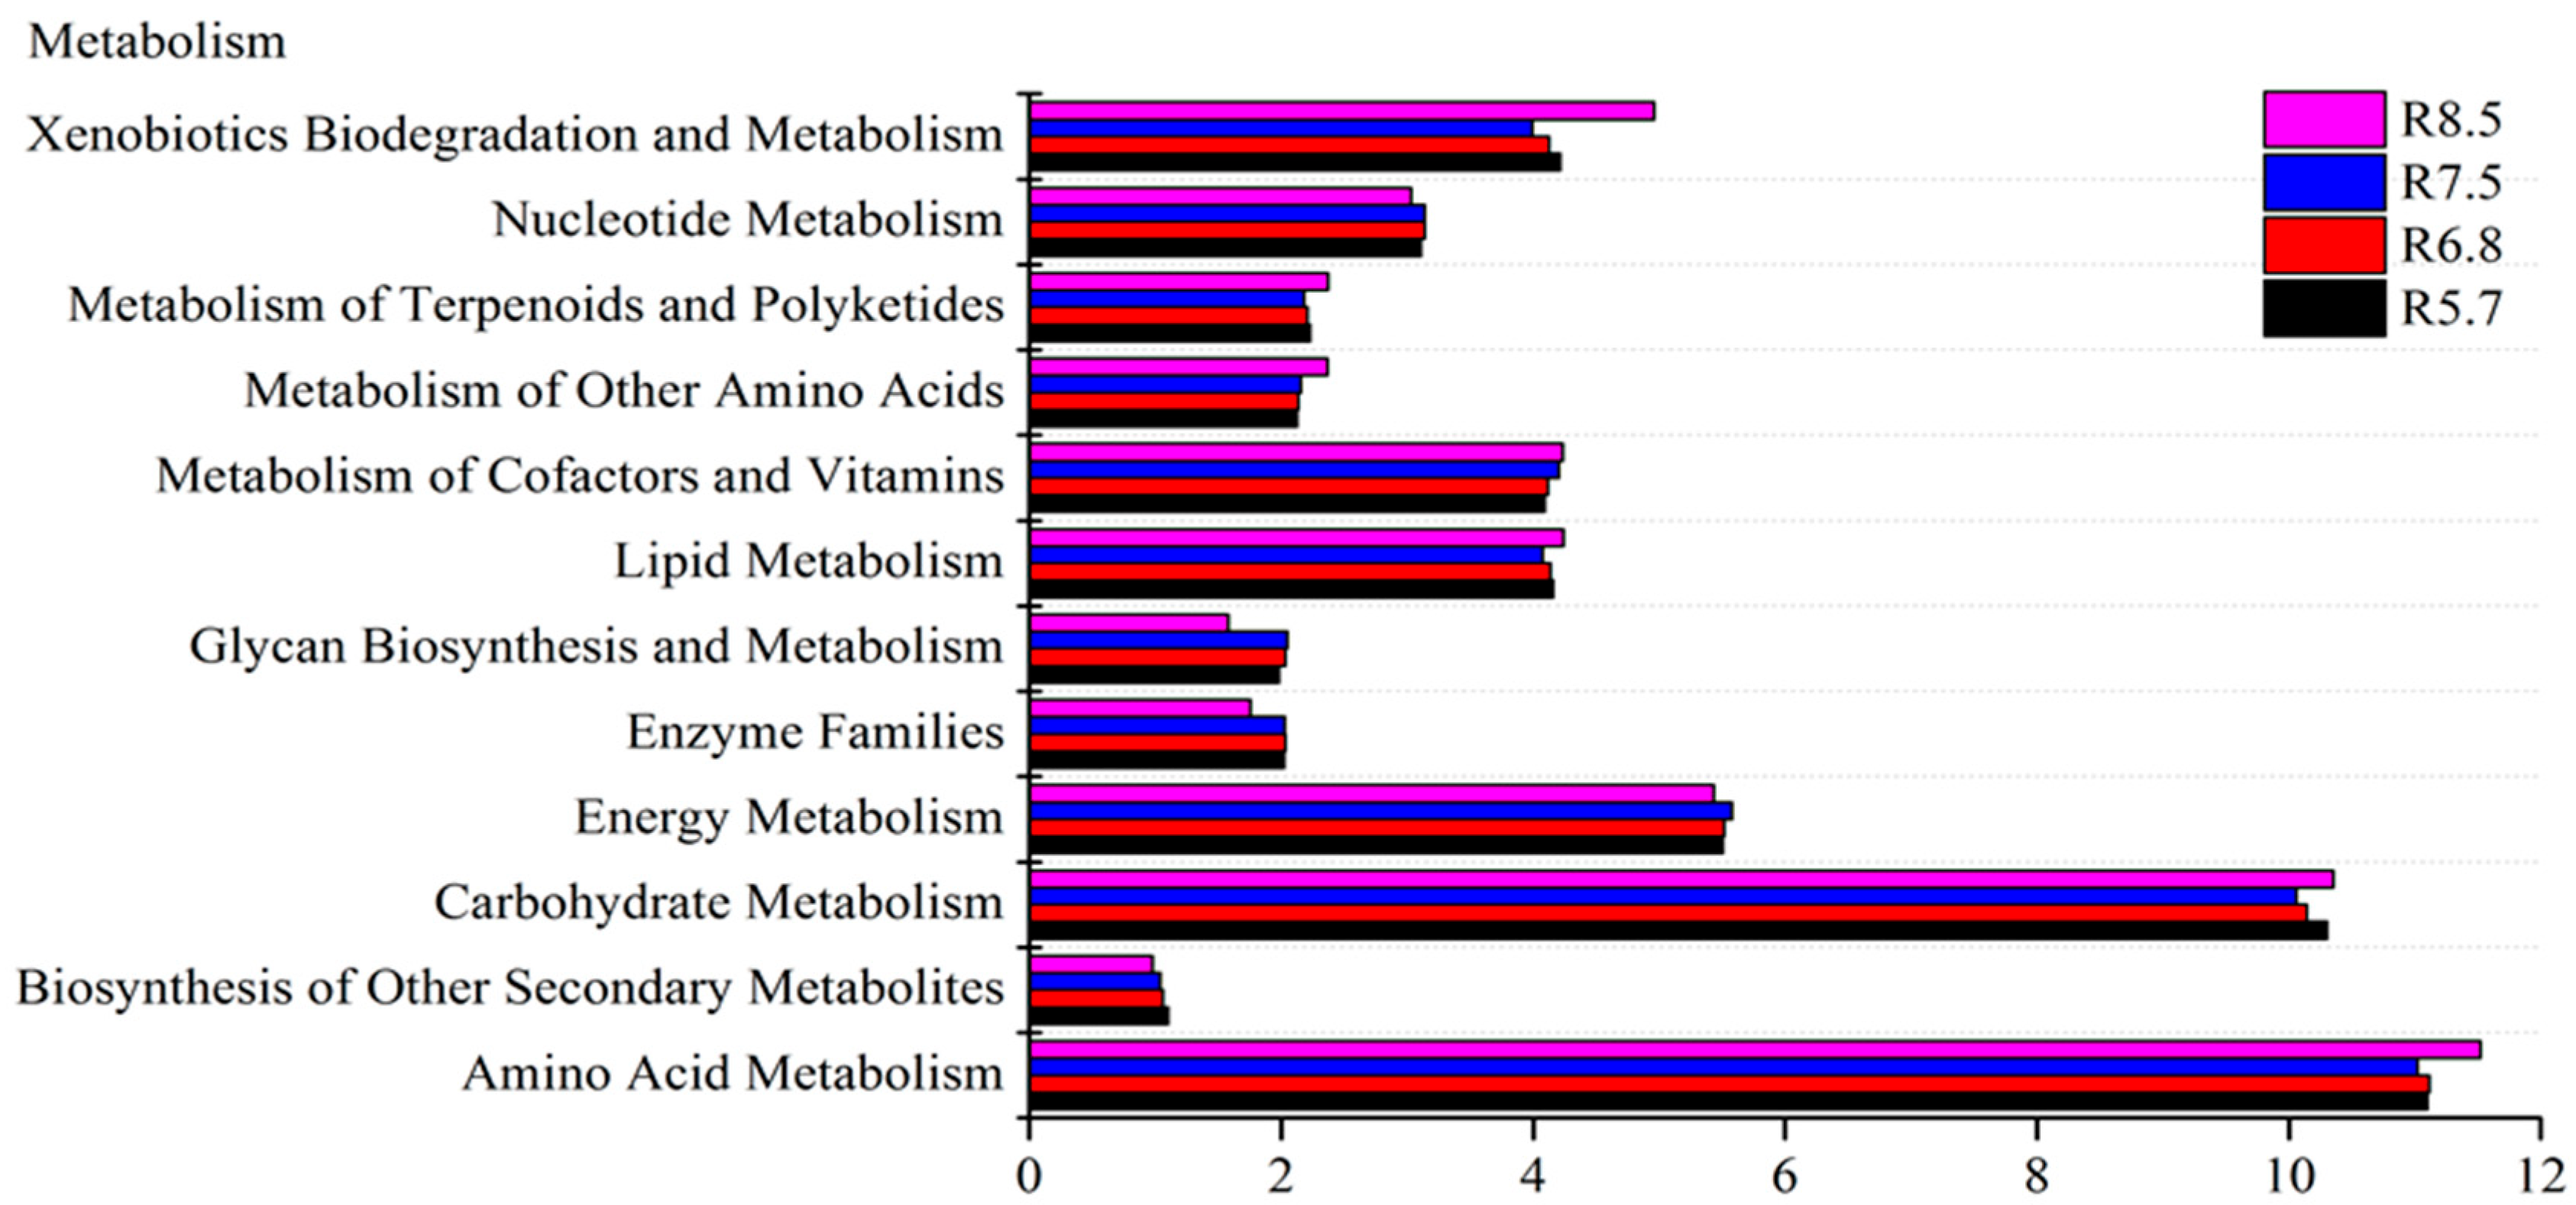
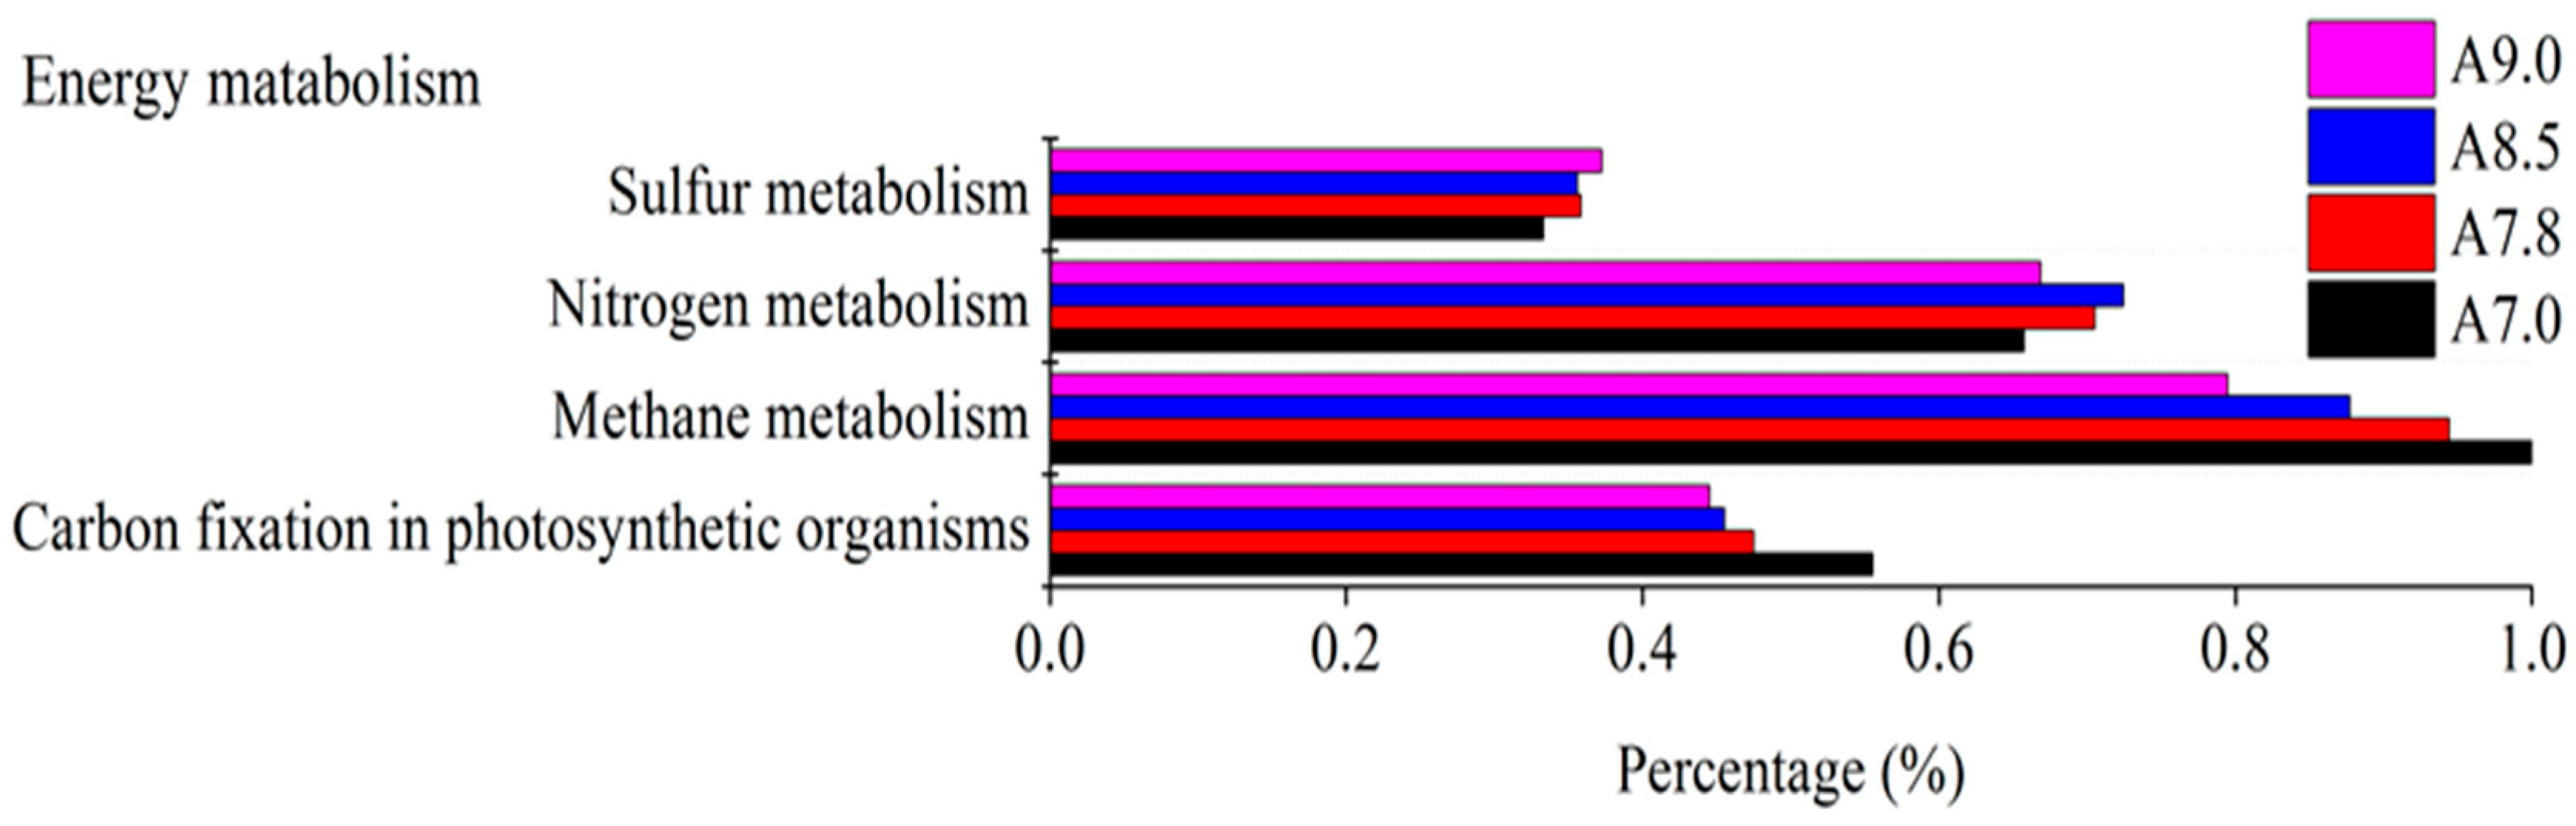
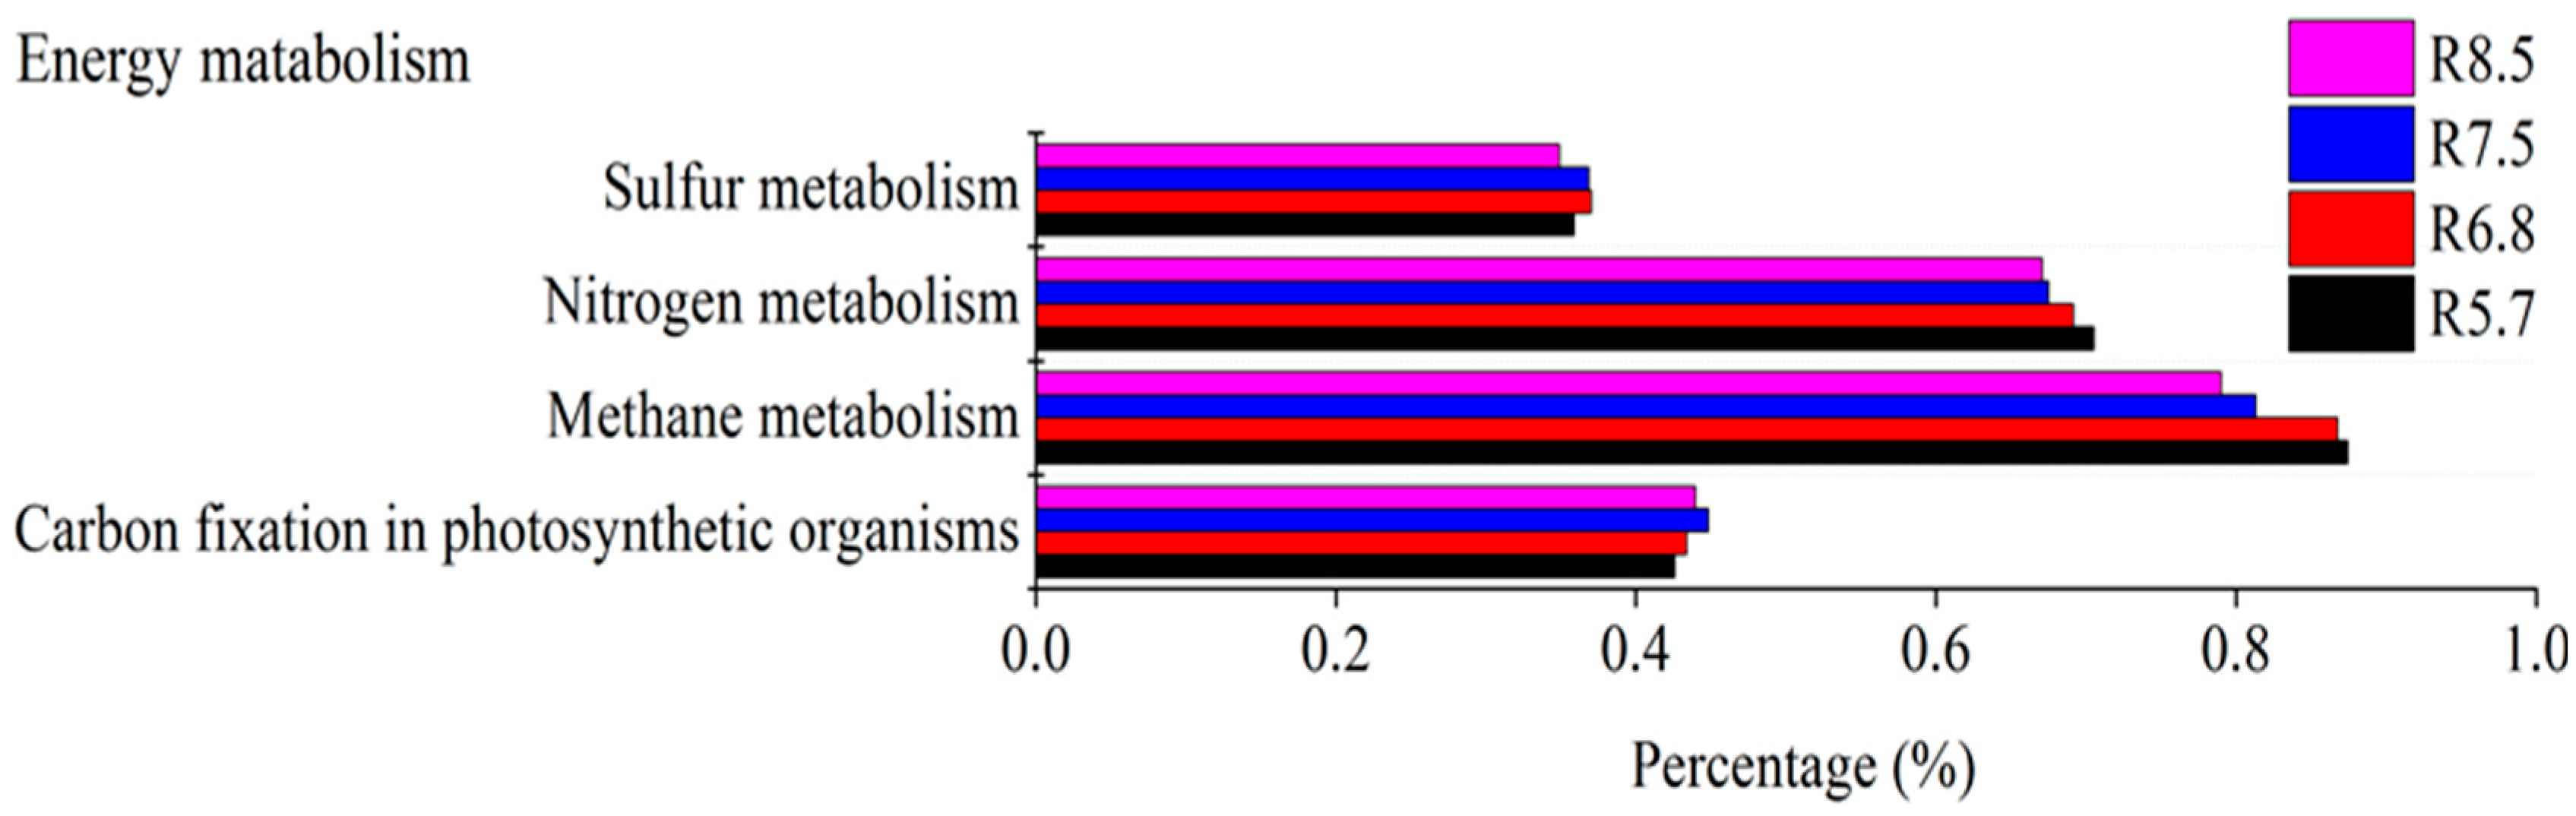
3.3. Bacterial Functional Prediction in Response to pH Gradient

In addition, the pH value could also change the metabolism function of the bacterial community [30,66]. The functional characteristics of the bacterial community from a different gradient of pH in two kinds of soil were analyzed by PICRUSt [41]. There are twelve functional groups of the genes in the metabolism category. The dominant groups are amino acid metabolism, carbohydrate metabolism, and energy metabolism in fluvo-aquic and red soil (Figure 4 and Figure 5).
For alkaline soil, the relative abundance of genes connected with cofactors, vitamins, enzyme families, and energy metabolism decreased with the increasing pH [67,68,69]. The genes involved in lipid metabolism, amino acid metabolism, and xenobiotics biodegradation metabolism exhibited a continuous increase toward high pH value (Figure 4). It was concluded that high pH in fluvo-aquic soil inhibited bacterial activity related to energy metabolism, but promoted bacterial capability related to xenobiotics biodegradation and metabolism, amino acid metabolism, and lipid metabolism.
For red soil, the sequences assigned to the biosynthesis of other secondary metabolites decreased gradually between pH 5.7 and pH 8.5. Conversely, the abundance involved in the metabolism of other amino acids, cofactors, and vitamins showed an increase as pH increased, and there was no significant change in the other bacterial metabolism capability in red soil (Figure 5)
Otherwise, the subgroups of energy metabolism were predicted, such as carbon fixation in photosynthetic organisms, methane metabolism, nitrogen metabolism, and sulfur metabolism (Figure 6). The abundance of bacterial carbon fixation in photosynthetic organisms decreased toward high pH in fluvo-aquic soil. The shift in metabolism function of the bacterial community was possibly caused by the utilization of readily decomposable substrates.
The sequence of bacterial methane metabolism function was more abundant in high pH (Figure 7). Accompanied by hydrolysis, acidogenesis, and acetogenesis, methanogenesis finished the cellulose degradation process. It was speculated that the alkaline environment is conducive to the decomposition of cellulose, which is not good for carbon fixation. The sequence associated with nitrogen metabolism revealed a negative relationship with pH in red soil, which was supported by the study that the increase in pH decreased cumulative N2O production [70]. In conclusion, pH influenced the metabolism function of bacteria and the effects differed in two kinds of soil.

3.4. GH48 and cbhI Gene Abundance Under Different pH Values

Cellulose is the major component of organic carbon in farmland soil; thus, the ecological characteristics of microorganisms in their degradation process are very important. Likewise, it was considered that the cellulolytic enzyme encoded by cbhI gene and GH48 gene could catalyze cellulose decomposition [38]. Therefore, it is of great importance to investigate the change in chhI gene and GH48 gene abundance in response to pH alteration.
In fluvo-aquic soil, the abundance of GH48 gene ranged from 1.04 × 10³ to 5.96 × 10⁵ copies g−1, and cbhI gene ranged from 0.6 × 10⁴ to 4.9 × 10⁴ copies g−1; all of them were significantly lower in A7.0 than that in higher pH treatments (Figure 8A). In red soil, the abundance of GH48 gene ranged from 7.01 × 10⁴ to 21 × 104 copies g−1, while cbhI gene ranged from 0.17 × 10⁴ to 7.2 × 10⁴ copies g−1. The abundances of GH48 and cbhI gene in red soil gradually decreased with increasing pH value, and it declined by 1.40 × 10⁵ copies g−1 soil and 7.03 × 10⁴ copies g−1 between R 5.7 and R 8.5, respectively (Figure 8B). Exchangeable aluminum was reported to increase as pH increases, and the high contents of exchangeable aluminum were harmful to microbial activity. For fluvo-aquic soil, GH48 and cbhI gene abundance were lowest in A 7.0, partly due to the influence of the addition of exchangeable aluminum in regulating pH. Therefore, proper the reduction in soil pH can reduce the abundance of cellulose-related genes, which is beneficial to the carbon fixation of fluvo-aquic soil. As for red soil, pH showed a negative relationship with the cellulose degradation gene (GH48 and cbhI). It was reported that enzyme composition containing cellulolytic enzymes, such as endo-glucanase and polysaccharide hydrolases, was contacted better with cellulose-rich material under acidic conditions. Our result likely means that the cellulose degradation gene could play an important role in breaking down cellulose under low pH value in red soil (Figure 8C,D). Generally, pH would regulate the organic matter decomposition by controlling the key gene abundance, but the effect of the key genes on organic matter decomposition is different for different types of soil [71,72,73].
From above, the observed shifts in GH48 and cbhI gene abundance under varying pH levels align with pH-driven microbial community restructuring (Section 3.2). In red soil, the decline in GH48 and cbhI gene abundance at higher pH (Figure 8B) corresponds with reduced Acidobacteria (Figure 2A, Table 1), a phylum known to harbor cellulolytic taxa. Conversely, the enrichment of Alphaproteobacteria and Bacteroidetes at elevated pH (Table 1) suggests their potential functional redundancy in cellulose degradation under alkaline conditions, albeit with lower gene abundance. This implies that pH-induced microbial compositional changes directly modulate cellulolytic gene dynamics, with soil-specific taxa driving functional adaptations.

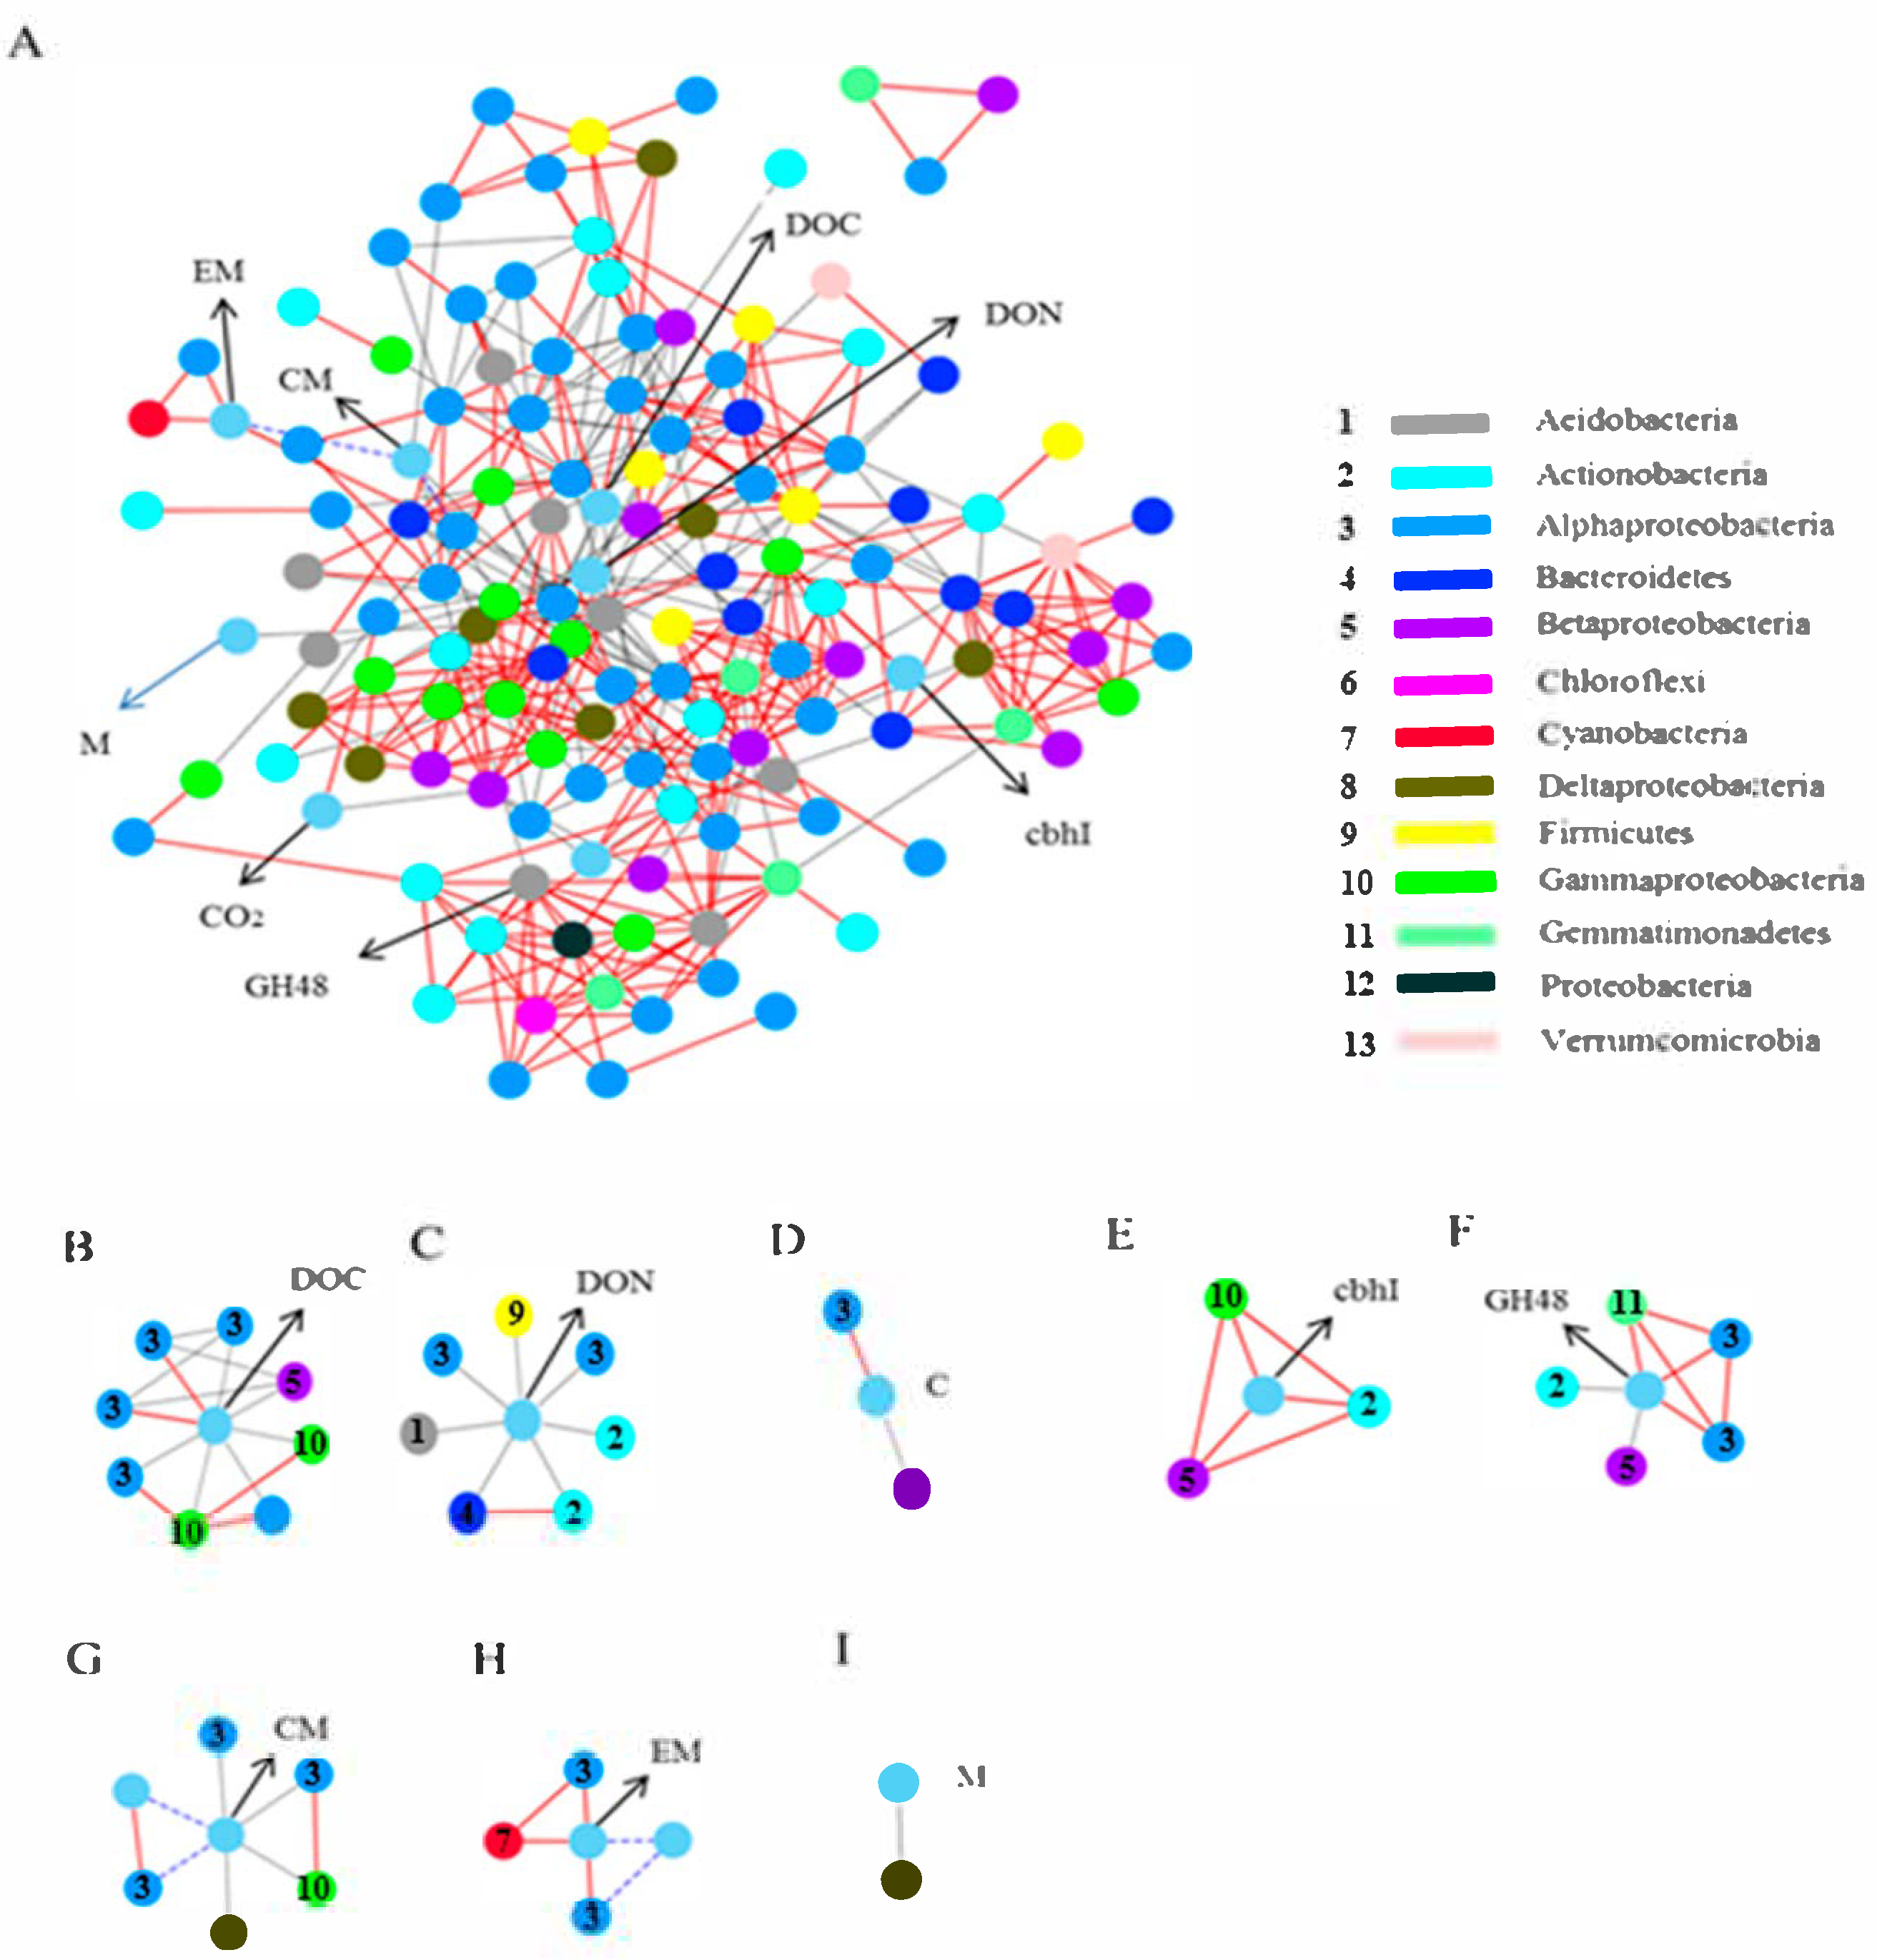
3.5. Network Associations Among Bacterial Community and Soil Chemical Characteristics, Functional Genes, and Microbial Metabolism

Network analysis was applied to reflect the associations between bacterial community and environmental factors such as soil chemical characteristics and soil respiration [74,75,76,77]. For 418 significant associations (edges), the network contains 127 nodes with an average number of clustering coefficient of 0.44 and neighbors of 8.46 (Figure 9A). Network edges were principally composed of strong positive associations, and the dominate OTUs belonged to Alphaproteobacteria, Deltaproteobacteria, and Actinobacteria (Figure 9A). The change in pH influenced dominant soil microbial community activity, thus affecting soil CO2 emissions through soil microbial respiration [78]. Network analysis indicated that CO2 emission showed a strong positive association with Caulobacteraceae and was nonlinear with Comamonadaceae. Caulobacteraceae is adaptive to oligotrophic conditions of low availability of metabolic substrate [57].
As the heterotrophic bacteria, Comamonadaceae contributes to the decomposition of soil organic compounds and is adaptive to rich nutrient environments [79,80]. The cluster of bacteria related to dissolved organic carbon (DOC), including Mycoplana, Erythrobacteraceae, Sphingomonadaceae, Lysobacter, Thermomonas, Rhodoplanes, and Janthinobacterium, was also shown in the network. Mycoplana and rythrobacteraceae were significantly positively correlated with DOC. Mycoplana was commonly found in the rhizosphere, which contributed to soil nutrient cycling and the decomposition of soil organic pollutants [81]. Therefore, the higher relative abundance of Mycoplana in high pH could accelerate soil organic matter transformation; this could be supported by the fact that higher DOC content occurred in high-pH treatment. Previous research also found that Erythrobacteraceae was capable of degrading the polycyclic aromatic hydrocarbon in soil [82,83].
Additionally, Sphingomonadaceae, Lysobacter, and Thermomonas showed nonlinear relationships with DOC, and Sphingomonadaceae and Thermomonasper formed a significantly positive correlation with Lysobacter, indicating that there was a synergistic effect of the microbial community on soil carbon cycling [84,85,86]. Furthermore, Bacillus, Phenylobacterium, Flavisolibacter, Phycicoccus, Micromonosporaceae, and Acetobacteraceae were nonlinearly related to DON. Acetobacteraceae has been described as a N-fixing bacterium that could incorporate atmosphere N2 into soil organic matter. Bacteria from the Acetobacteraceae family could generate organic acids as a final metabolic product by incompletely oxidating sugars and alcohols and could survive in very acidic conditions, but the optimum range is close to pH5.0–6.5. Members of Flavisolibacter and Bacilli were considered as degraders of cellulose and soil organic matter; therefore, they could contribute to soil C cycling [87,88,89].
To further explore the relationship between bacterial community and carbon-related functional genes, two clusters of bacteria neighboring GH48 and cbhI were constructed. As shown in Figure 9B, Xanthomonadaceae, Comamonadaceae, and Micromonosporaceae exhibited positive associations with the cbhI gene [90,91]. GH48 displayed a nonlinear correlation with Pimelobacter and Comamonadaceae, and a positive correlation with Sphingomonadaceae and Gemmatimonadetes. Xanthomonadaceae and Sphingomonadaceae have been shown to have the ability to degrade complex organic matter. It has been proved that a high abundance of Gemmatimonadetes and Comamonadaceae was beneficial to decompose chitin and soil organic compounds [82,83]. Micromonosporaceae from phylum Actinobacteria have been reported to have the capability of breaking down cellulose [92,93]. Thus, these results indicated that GH48 and cbhI genes showed close associations with microbial groups involved in the decomposition of soil organic matter [94,95].
In order to explore the association between bacterial metabolism and bacterial taxa, subnetworks were further constructed (Figure 9C). There was a nonlinear relationship between Haliangiaceae and metabolism (M). It was obvious that Sphingomonas, Streptophyta, and Agrobacterium had notable positive correlations with energy metabolism (EM). In addition, carbohydrate metabolism (CM) exhibited a nonlinear relationship with four genera, including Rhodoplanes, Sphingomonadaceae, Lysobacter, and Haliangiaceae, while it displayed a negative association with Agrobacterium. Specifically, energy metabolism (EM) was negatively correlated with carbohydrate metabolism (CM). In general, some bacterial taxa were positively related to different biochemical metabolic pathways, indicating that bacterial taxa had a synergistic effect on metabolic pathways [93].

4. Conclusions

The present work revealed that pH greatly influenced the soil mineralization and microbial community composition, and the effect depended on soil types. A high pH value led to an increase in CO2 emissions and soil DOC content. The pH-driven restructuring of microbial communities significantly influenced the abundance of cellulose-degrading functional genes (cbhI and GH48) in fluvo-aquic soils, as taxa harboring these genes (e.g., Xanthomonadaceae, Comamonadaceae) exhibited pH-dependent shifts in relative abundance. These compositional changes, in turn, modulated functional gene pools linked to cellulose metabolism. Similarly, pH affected the abundance of functional genes (cbhI and GH48) in red soil, but had less of an effect on carbohydrate metabolism. This study concluded that, for fluvo-aquicsoil, the abundance of carbohydrate metabolism and cellulose degradation were largest, and it is conducive to carbon preservation and soil stability. The microbial communities were more vulnerable to pH change in red soil than in fluvo-aquic soil.

Author Contributions

Conceptualization, L.J. and B.X.; methodology, L.J.; software, B.X.; validation, B.X., L.J. and Q.W.; formal analysis, Q.W.; writing—original draft preparation, L.J.; writing—review and editing, Q.W.; funding acquisition, Q.W. All authors have read and agreed to the published version of the manuscript.

Funding

This work was funded by the Priority Academic Program Development of Jiangsu Higher Education Institutions (grant number PAPD-2023-87).

Institutional Review Board Statement

Not applicable.

Data Availability Statement

Data are contained within the article.

Conflicts of Interest

We declare that we do not have any commercial or associative interests that represent a conflict of interest in connection with the work submitted. Data are contained within the article.

References

  1. Liu, X.; Chen, Y.; Liu, Y.; Wang, S.; Jin, J.; Zhao, Y.; Yu, D. A framework combining CENTURY modeling and chronosequences sampling to estimate soil organic carbon stock in an agricultural region with large land use change. Agronomy 2023, 13, 1055. [Google Scholar] [CrossRef]
  2. Yang, Y.; Sun, K.; Han, L.; Chen, Y.; Liu, J.; Xing, B. Biochar stability and impact on soil organic carbon mineralization depend on biochar processing, aging and soil clay content. Soil Biol. Biochem. 2022, 169, 108657. [Google Scholar] [CrossRef]
  3. Xu, Y.; Liu, X.; Jing, Y.; Luo, J.; Guo, D.; Ma, Y. Dissolved N and C leaching losses mitigated by optimized fertilization management in intensive greenhouse system: Insights from DOM characteristics via EEM-PARAFAC. J. Soils Sediments 2023, 23, 657–671. [Google Scholar] [CrossRef]
  4. Jing, Y.; Zhang, Y.; Han, I.; Wang, P.; Mei, Q.; Huang, Y. Effects of different straw biochars on soil organic carbon, nitrogen, available phosphorus, and enzyme activity in paddy soil. Sci. Rep. 2020, 10, 8837. [Google Scholar] [CrossRef]
  5. Zhang, C.; Li, X.; Yan, H.; Ullah, I.; Zuo, Z.; Li, L.; Yu, J. Effects of irrigation quantity and biochar on soil physical properties, growth characteristics, yield and quality of greenhouse tomato. Agric. Water Manag. 2020, 241, 106263. [Google Scholar] [CrossRef]
  6. Feng, L.; Xu, Y.; Xiao, Y.; Song, J.; Li, D.; Zhang, Z.; Liu, C.; Liu, C.; Jiang, N.; Zhang, M.; et al. Effects of pre-drying treatments combined with explosion puffing drying on the physicochemical properties, antioxidant activities and flavor characteristics of apples. Food Chem. 2021, 338, 128015. [Google Scholar] [CrossRef]
  7. Tunio, M.H.; Gao, J.; Qureshi, W.A.; Sheikh, S.A.; Chen, J.; Chandio, F.A.; Lakhiar, I.A.; Solangi, K.A. Effects of droplet size and spray interval on root-to-shoot ratio, photosynthesis efficiency, and nutritional quality of aeroponically grown butterhead lettuce. Int. J. Agric. Biol. Eng. 2022, 15, 79–88. [Google Scholar]
  8. Mao, H.; Kumi, F.; Li, Q.; Han, L. Combining X-ray computed tomography with relevant techniques for analyzing soil–root dynamics—An overview. Acta Agric. Scand. Sect. B—Soil Plant Sci. 2016, 66, 1–19. [Google Scholar] [CrossRef]
  9. Li, G.; Kim, S.; Han, S.H.; Chang, H.; Du, D.; Son, Y. Precipitation affects soil microbial and extracellular enzymatic responses to warming. Soil Biol. Biochem. 2018, 120, 212–221. [Google Scholar] [CrossRef]
  10. Li, P.; Li, Y.; Zheng, X.; Ding, L.; Ming, F.; Pan, A.; Lv, W.; Tang, X. Rice straw decomposition affects diversity and dynamics of soil fungal community, but not bacteria. J. Soils Sediments 2018, 18, 248–258. [Google Scholar] [CrossRef]
  11. Wang, C.; Wu, B.; Jiang, K.; Wei, M.; Wang, S. Effects of different concentrations and types of Cu and Pb on soil N-fixing bacterial communities in the wheat rhizosphere. Appl. Soil Ecol. 2019, 144, 51–59. [Google Scholar] [CrossRef]
  12. Shen, C.; Xiong, J.; Zhang, H.; Feng, Y.; Lin, X.; Li, X.; Liang, W.; Chu, H. Soil pH drives the spatial distribution of bacterial communities along elevation on Changbai Mountain. Soil Biol. Biochem. 2013, 57, 204–211. [Google Scholar] [CrossRef]
  13. Yun, Y.; Wang, H.; Man, B.; Xiang, X.; Zhou, J.; Qiu, X.; Duan, Y.; Engel, A.S. The Relationship between pH and bacterial communities in a single karst ecosystem and its implication for soil acidification. Front. Microbiol. 2016, 7, 1955. [Google Scholar] [CrossRef] [PubMed]
  14. Rousk, J.; Brookes, P.C.; Bååth, E. Investigating the mechanisms for the opposing pH relationships of fungal and bacterial growth in soil. Soil Biol. Biochem. 2010, 42, 926–934. [Google Scholar] [CrossRef]
  15. Liu, Y.; Fu, W.; Li, P.; Ten, B. Complementary Utilization of Nutrients between Phragmites Australis and Phalaris Arundinacea Based on Accumulative Dynamics of Soil Nutrient during Litter Decomposition. Commun. Soil Sci. Plant Anal. 2021, 52, 1622–1630. [Google Scholar] [CrossRef]
  16. Cayetano, R.D.A.; Park, J.; Kim, G.-B.; Jung, J.-H.; Kim, S.-H. Enhanced anaerobic digestion of waste-activated sludge via bioaugmentation strategy—Phylogenetic investigation of communities by reconstruction of unobserved states (PICRUSt2) analysis through hydrolytic enzymes and possible linkage to system performance. Bioresour. Technol. 2021, 332, 125014. [Google Scholar] [CrossRef]
  17. Abdualrahman, M.A.Y.; Ma, H.; Zhou, C.; Yagoub, A.E.A.; Hu, J.; Yang, X. Thermal and single frequency counter-current ultrasound pretreatments of sodium caseinate: Enzymolysis kinetics and thermodynamics, amino acids composition, molecular weight distribution and antioxidant peptides. J. Sci. Food Agric. 2016, 96, 4861–4873. [Google Scholar] [CrossRef]
  18. Vincze, É.-B.; Becze, A.; Laslo, É.; Mara, G. Beneficial Soil microbiomes and their potential role in plant growth and soil fertility. Agriculture 2024, 14, 152. [Google Scholar] [CrossRef]
  19. Zhang, Q.; Liang, G.; Guo, T.; He, P.; Wang, X.; Zhou, W. Evident variations of fungal and actinobacterial cellulolytic communities associated with different humified particle-size fractions in a long-term fertilizer experiment. Soil Biol. Biochem. 2017, 113, 1–13. [Google Scholar] [CrossRef]
  20. Min, X.; Xiao, L.; Li, Z.; Li, P.; Wang, F.; Liu, X.; Chen, S.; Wang, Z.; Pan, L. Effects of Incubation Temperature and Sludge Addition on Soil Organic Carbon and Nitrogen Mineralization Characteristics in Degraded Grassland Soil. Agronomy 2024, 14, 1590. [Google Scholar] [CrossRef]
  21. Zang, X.; Liu, M.; Fan, Y.; Xu, J.; Xu, X.; Li, H. The structural and functional contributions of β-glucosidase-producing microbial communities to cellulose degradation in composting. Biotechnol. Biofuels 2018, 11, 51. [Google Scholar] [CrossRef] [PubMed]
  22. Wu, D.; Qu, F.; Li, D.; Zhao, Y.; Li, X.; Niu, S.; Zhao, M.; Qi, H.; Wei, Z.; Song, C. Effect of Fenton pretreatment and bacterial inoculation on cellulose-degrading genes and fungal communities during rice straw composting. Sci. Total. Environ. 2022, 806, 151376. [Google Scholar] [CrossRef] [PubMed]
  23. Banerjee, S.; Kirkby, C.A.; Schmutter, D.; Bissett, A.; Kirkegaard, J.A.; Richardson, A.E. Network analysis reveals functional redundancy and keystone taxa amongst bacterial and fungal communities during organic matter decomposition in an arable soil. Soil Biol. Biochem. 2016, 97, 188–198. [Google Scholar] [CrossRef]
  24. Barberán, A.; Bates, S.T.; Casamayor, E.O.; Fierer, N. Using network analysis to explore co-occurrence patterns in soil microbial communities. ISME J. 2012, 6, 343–351. [Google Scholar] [CrossRef]
  25. Yuan, Q.; Gao, Y.; Ma, G.; Wu, H.; Li, Q.; Zhang, Y.; Liu, S.; Jie, X.; Zhang, D.; Wang, D. The long-term effect of biochar amendment on soil biochemistry and phosphorus availability of calcareous soils. Agriculture 2025, 15, 458. [Google Scholar] [CrossRef]
  26. Li, H.; Zhou, B.; Zhuo, Z.; Wang, L.; Wang, Z.; Xie, C.; Jiang, F.; Lin, J.; Huang, Y.; Zhang, Y. Effects of Cover Measures on Soil Organic Nitrogen Fractions and Total Soluble Nitrogen Pools in Citrus Orchards of the Red Soil Hilly Region of Southern China. Agriculture 2024, 14, 1879. [Google Scholar] [CrossRef]
  27. Zhang, J.; Yu, X.; Xu, B.; Yagoub, A.E.A.; Mustapha, A.T.; Zhou, C. Effect of intensive pulsed light on the activity, structure, physico-chemical properties and surface topography of polyphenol oxidase from mushroom. Innov. Food Sci. Emerg. Technol. 2021, 72, 102741. [Google Scholar] [CrossRef]
  28. Tian, Y.; Wu, L.; Lu, R.; Bao, H.; Zhou, Y.; Pang, M.; Brown, J.; Wang, J.; Wang, R.; Zhang, H. Virulent phage vB_CpeP_HN02 inhibits Clostridium perfringens on the surface of the chicken meat. Int. J. Food Microbiol. 2022, 363, 109514. [Google Scholar] [CrossRef]
  29. Zhang, H.; Wang, Y.; Liu, L.; Zhou, J.; Wan, Q.; Chen, J.; Cao, Y.; Zhang, L.; Feng, F.; Ning, Q.; et al. Bibliometric Analysis of Contemporary Research on the Amelioration of Saline Soils. Agronomy 2024, 14, 2935. [Google Scholar] [CrossRef]
  30. Xu, Y.; Ma, Y.; Cayuela, M.L.; Sánchez-Monedero, M.A.; Wang, Q. Compost biochemical quality mediates nitrogen leaching loss in a greenhouse soil under vegetable cultivation. Geoderma 2020, 358, 113984. [Google Scholar] [CrossRef]
  31. Cai, C.; Wei, B.; Tian, Y.; Ma, R.; Chen, L.; Qiu, L.; Jin, Z. Structural changes of chemically modified rice starch by one-step reactive extrusion. Food Chem. 2019, 288, 354–360. [Google Scholar] [CrossRef] [PubMed]
  32. Akhlaq, M.; Zhang, C.; Yan, H.; Ou, M.; Zhang, W.; Liang, S.; Ikram, R.M.A. Response of tomato growth to continuous elevated CO2 concentration under controlled environment. Int. J. Agric. Biol. Eng. 2022, 15, 51–59. [Google Scholar] [CrossRef]
  33. Sun, B.; Wang, X.; Wang, F.; Jiang, Y.; Zhang, X.-X. Assessing the relative effects of geographic location and soil type on microbial communities associated with straw decomposition. Appl. Environ. Microbiol. 2013, 79, 3327–3335. [Google Scholar] [CrossRef]
  34. Li, F.; Chen, L.; Zhang, J.; Yin, J.; Huang, S. Bacterial community structure after long-term organic and inorganic fertilization reveals important associations between soil nutrients and specific taxa involved in nutrient transformations. Front. Microbiol. 2017, 8, 187. [Google Scholar] [CrossRef]
  35. Duan, N.; Gong, W.; Wu, S.; Wang, Z. Selection and Application of ssDNA Aptamers against Clenbuterol Hydrochloride Based on ssDNA Library Immobilized SELEX. J. Agric. Food Chem. 2017, 65, 1771–1777. [Google Scholar] [CrossRef]
  36. Lu, Y.Z.; Liu, P.F.; Montazar, A.; Paw, U.K.T.; Hu, Y.G. Soil water infiltration model for sprinkler irrigation control strategy: A case for tea plantation in Yangtze river region. Agriculture 2019, 9, 206. [Google Scholar] [CrossRef]
  37. Zhao, Z.; Li, H.; Liu, J.; Yang, S.X. Control method of seedbed compactness based on fragment soil compaction dynamic characteristics. Soil Tillage Res. 2020, 198, 104551. [Google Scholar] [CrossRef]
  38. Edwards, I.P.; Upchurch, R.A.; Zak, D.R. Isolation of fungal cellobiohydrolase I genes from sporocarps and forest soils by PCR. Appl. Environ. Microbiol. 2008, 74, 3481–3489. [Google Scholar] [CrossRef]
  39. de Menezes, A.B.; Prendergast-Miller, M.T.; Poonpatana, P.; Farrell, M.; Bissett, A.; Macdonald, L.M.; Toscas, P.; Richardson, A.E.; Thrall, P.H. C/N Ratio drives soil actinobacterial cellobiohydrolase gene diversity. Appl. Environ. Microbiol. 2015, 81, 3016–3028. [Google Scholar] [CrossRef]
  40. Zeng, J.; Yuan, Q.; Xu, W.; Li, H.; Li, M.; Lei, X.; Wang, W.; Lin, Q.; Li, X.; Xu, R.; et al. Research on a Biofilter for a Typical Application Scenario in China: Treatment of Pesticide Residue Wastewater in Orchards. Agronomy 2024, 14, 934. [Google Scholar] [CrossRef]
  41. Langille, M.G.I.; Zaneveld, J.; Caporaso, J.G.; McDonald, D.; Knights, D.; Reyes, J.A.; Clemente, J.C.; Burkepile, D.E.; Vega Thurber, R.L.; Knight, R.; et al. Predictive functional profiling of microbial communities using 16S rRNA marker gene sequences. Nat. Biotechnol. 2013, 31, 814–821. [Google Scholar] [CrossRef] [PubMed]
  42. Ye, Z.; Hu, F.; Zhang, W.; Fang, D.; Dong, K.; Cao, J. Amino acid transporters of Brassica napus: Identification, evolution, expression and response to various stresses. Ind. Crop. Prod. 2023, 194, 116338. [Google Scholar] [CrossRef]
  43. Huang, Y.; Sun, Y.; Mehmood, A.; Lu, T.; Chen, X. Unraveling the temporal changes of Maillard reaction products and aroma profile in coffee leaves during hot-air drying. J. Food Compos. Anal. 2024, 128, 106055. [Google Scholar] [CrossRef]
  44. Reshef, D.N.; Reshef, Y.A.; Finucane, H.K.; Grossman, S.R.; McVean, G.; Turnbaugh, P.J.; Lander, E.S.; Mitzenmacher, M.; Sabeti, P.C. Detecting novel associations in large data sets. Science 2011, 334, 1518–1524. [Google Scholar] [CrossRef]
  45. Wang, K.; Zheng, X.; Su, Y.; Lu, Y.; Yang, Q.; Shi, Y.; Lanhuang, B.; Zhang, X.; Zhao, L.; Godana, E.A.; et al. A glycoside hydrolase superfamily gene plays a major role in Penicillium expansum growth and pathogenicity in apples. Postharvest Biol. Technol. 2023, 198, 112228. [Google Scholar] [CrossRef]
  46. Su, Z.; Li, Y.; Dong, Y.; Tang, Z.; Liang, Z. Simulation of rice threshing performance with concentric and non-concentric threshing gaps. Biosyst. Eng. 2020, 197, 270–284. [Google Scholar] [CrossRef]
  47. Jiang, N.J.; Wang, Y.J.; Chu, J.; Kawasaki, S.; Tang, C.S.; Cheng, L.; Du, Y.J.; Shashank, B.S.; Singh, D.N.; Han, X.L.; et al. Bio-mediated soil improvement: An introspection into processes, materials, characterization and applications. Soil Use Manage 2022, 38, 68–93. [Google Scholar] [CrossRef]
  48. Xu, J.; Tang, C.; Chen, Z. Chemical composition controls residue decomposition in soils differing in initial pH. Soil Biol. Biochem. 2006, 38, 544–552. [Google Scholar] [CrossRef]
  49. Zuo, Z.; Li, X.; Xu, C.; Yang, J.; Zhu, X.; Liu, S.; Song, F.; Liu, F.; Mao, H. Responses of barley Albina and Xantha mutants deficient in magnesium chelatase to soil salinity. Plant Soil Environ. 2017, 63, 348–354. [Google Scholar] [CrossRef]
  50. Liu, E.; Terumasa, T. Effects of Applying Recycled Urban Green Waste Compost Made from Pruning Materials to Soil on the Growth of Plants. J. Soil Sci. Plant Nutr. 2022, 22, 1088–1097. [Google Scholar] [CrossRef]
  51. Zhang, H.-Y.; Goncalves, P.; Copeland, E.; Qi, S.-S.; Dai, Z.-C.; Li, G.-L.; Wang, C.-Y.; Du, D.-L.; Thomas, T. Invasion by the weed Conyza canadensis alters soil nutrient supply and shifts microbiota structure. Soil Biol. Biochem. 2020, 143, 107739. [Google Scholar] [CrossRef]
  52. Castro, H.F.; Classen, A.T.; Austin, E.E.; Norby, R.J.; Schadt, C.W. Soil microbial community responses to multiple experimental climate change drivers. Appl. Environ. Microbiol. 2010, 76, 999–1007. [Google Scholar] [CrossRef] [PubMed]
  53. Pawlett, M.; Hopkins, D.W.; Moffett, B.F.; Harris, J.A. The effect of earthworms and liming on soil microbial communities. Biol. Fertil. Soils 2009, 45, 361–369. [Google Scholar] [CrossRef]
  54. Bartram, A.K.; Jiang, X.; Lynch, M.D.; Masella, A.P.; Nicol, G.W.; Dushoff, J.; Neufeld, J.D. Exploring links between pH and bacterial community composition in soils from the Craibstone Experimental Farm. FEMS Microbiol. Ecol. 2014, 87, 403–415. [Google Scholar] [CrossRef]
  55. Hang, T.; Lu, N.; Takagaki, M.; Mao, H. Leaf area model based on thermal effectiveness and photosynthetically active radiation in lettuce grown in mini-plant factories under different light cycles. Sci. Hortic. 2019, 252, 113–120. [Google Scholar] [CrossRef]
  56. Lueders, T.; Kindler, R.; Miltner, A.; Friedrich, M.W.; Kaestner, M. Identification of bacterial micropredators distinctively active in a soil microbial food web. Appl. Environ. Microbiol. 2006, 72, 5342–5348. [Google Scholar] [CrossRef]
  57. Wakelin, S.A.; Colloff, M.J.; Kookana, R.S. Effect of wastewater treatment plant effluent on microbial function and community structure in the sediment of a freshwater stream with variable seasonal flow. Appl. Environ. Microbiol. 2008, 74, 2659–2668. [Google Scholar] [CrossRef]
  58. Lafortune, I.; Juteau, P.; Déziel, E.; Lépine, F.; Beaudet, R.; Villemur, R. Bacterial diversity of a consortium degrading high-molecular-weight polycyclic aromatic hydrocarbons in a two-liquid phase biosystem. Microb. Ecol. 2008, 57, 455–468. [Google Scholar] [CrossRef]
  59. Legrand, F.; Picot, A.; Cobo-Díaz, J.F.; Carof, M.; Chen, W.; Le Floch, G. Effect of tillage and static abiotic soil properties on microbial diversity. Appl. Soil Ecol. 2018, 132, 135–145. [Google Scholar] [CrossRef]
  60. Chen, Z.; Wang, Y.; Xia, D.; Jiang, X.; Fu, D.; Shen, L.; Wang, H.; Li, Q.B. Enhanced bioreduction of iron and arsenic in sediment by biochar amendment influencing microbial community composition and dissolved organic matter content and composition. J. Hazard. Mater. 2016, 311, 20–29. [Google Scholar] [CrossRef]
  61. Jensen, M.; Michelsen, A.; Gashaw, M. Responses in plant, soil inorganic and microbial nutrient pools to experimental fire, ash and biomass addition in a woodland savanna. Oecologia 2001, 128, 85–93. [Google Scholar] [CrossRef] [PubMed]
  62. Fernández-Calviño, D.; Bååth, E. Growth response of the bacterial community to pH in soils differing in pH. FEMS Microbiol. Ecol. 2010, 73, 149–156. [Google Scholar] [CrossRef] [PubMed]
  63. Ren, G.; Meng, T.; Ma, Y. Sugars altered fungal community composition and caused high network complexity in a Fusarium wilt pathogen-infested soil. Biol. Fertil. Soils 2020, 56, 395–409. [Google Scholar] [CrossRef]
  64. Wang, L.; Zhang, H.; Xu, C.; Zhong, Y.; Xu, X.; Yuan, J.; Wang, J.; Zhang, Y. Ten years of urea fertilization alter the pqqC-harbouring community and increase soil inorganic phosphorus mobilization. Eur. J. Soil Sci. 2024, 75, e13563. [Google Scholar] [CrossRef]
  65. Chen, W.; Gao, Y.; Yang, J.; Fan, F.; Zhang, W.; Li, J.; Zhou, C.; Shi, G.; Tong, F.; Fan, G. Taxonomical and functional bacterial community selection in the rhizosphere of the rice genotypes with different nitrogen use efficiencies. Plant Soil 2022, 470, 111–125. [Google Scholar] [CrossRef]
  66. Solangi, K.A.; Siyal, A.A.; Wu, Y.; Abbasi, B.; Solangi, F.; Lakhiar, I.A.; Zhou, G. An Assessment of the spatial and temporal distribution of soil salinity in combination with field and satellite data: A case study in sujawal district. Agronomy 2019, 9, 869. [Google Scholar] [CrossRef]
  67. Zhong, R.; Wan, X.; Wang, D.; Zhao, C.; Liu, D.; Gao, L.; Wang, M.; Wu, C.; Nabavid, S.M.; Daglia, M.; et al. Polysaccharides from Marine Enteromorpha: Structure and function. Trends Food Sci. Technol. 2020, 99, 11–20. [Google Scholar] [CrossRef]
  68. Huang, X.; Zhao, W.; Li, Z.; Zhang, N.; Wang, S.; Shi, J.; Zhai, X.; Zhang, J.; Shen, T. Preparation of a Dual-Functional Active Film Based on Bilayer Hydrogel and Red Cabbage Anthocyanin for Maintaining and Monitoring Pork Freshness. Foods 2023, 12, 4520. [Google Scholar] [CrossRef]
  69. Wen, C.; Zhang, J.; Duan, Y.; Zhang, H.; Ma, H. A Mini-Review on Brewer’s Spent Grain Protein: Isolation, Physicochemical Properties, Application of Protein, and Functional Properties of Hydrolysates. J. Food Sci. 2019, 84, 3330–3340. [Google Scholar] [CrossRef]
  70. Ouyang, X.-J.; Guo-Yi, Z.; Huang, Z.-L.; Ju-Xiu, L.; Zhang, D.-Q.; Jiong, L. Effect of simulated acid rain on potential carbon and nitrogen mineralization in forest soils. Pedosphere 2008, 18, 503–514. [Google Scholar] [CrossRef]
  71. Goleij, P.; Khandan, M.; Tabari, M.A.K.; Sanaye, P.M.; Alijanzadeh, D.; Soltani, A.; Hosseini, Z.; Larsen, D.S.; Khan, H.; Kumar, A.P.; et al. Unlocking the Potential: How Flavonoids Affect Angiogenesis, Oxidative Stress, Inflammation, Proliferation, Invasion, and Alter Receptor Interactions in Endometriosis. Food Sci. Nutr. 2025, 13, e4607. [Google Scholar] [CrossRef] [PubMed]
  72. He, H.; Zhu, S.; Jiang, Z.; Ji, Y.; Wang, F.; Zhao, R.; Bie, T. Comparative mapping of powdery mildew resistance gene Pm21 and functional characterization of resistance-related genes in wheat. Theor. Appl. Genet. 2016, 129, 819–829. [Google Scholar] [CrossRef] [PubMed]
  73. Apaliya, M.T.; Zhang, H.; Yang, Q.; Zheng, X.; Zhao, L.; Kwaw, E.; Mahunu, G.K. Hanseniaspora uvarum enhanced with trehalose induced defense-related enzyme activities and relative genes expression levels against Aspergillus tubingensis in table grapes. Postharvest Biol. Technol. 2017, 132, 162–170. [Google Scholar] [CrossRef]
  74. Pang, Y.; Li, H.; Tang, P.; Chen, C. Synchronization optimization of pipe diameter and operation frequency in a pressurized irrigation network based on the genetic algorithm. Agriculture 2022, 12, 673. [Google Scholar] [CrossRef]
  75. Shi, B.; Sreeram, V.; Zhao, D.; Duan, S.; Jiang, J. A wireless sensor network-based monitoring system for freshwater fishpond aquaculture. Biosyst. Eng. 2018, 172, 57–66. [Google Scholar] [CrossRef]
  76. Zhao, Z.; Jin, M.; Tian, C.; Yang, S.X. Prediction of seed distribution in rectangular vibrating tray using grey model and artificial neural network. Biosyst. Eng. 2018, 175, 194–205. [Google Scholar] [CrossRef]
  77. Wu, M.; Sun, J.; Lu, B.; Ge, X.; Zhou, X.; Zou, M. Application of deep brief network in transmission spectroscopy detection of pesticide residues in lettuce leaves. J. Food Process. Eng. 2019, 42, e13005. [Google Scholar] [CrossRef]
  78. Sauze, J.; Jones, S.P.; Wingate, L.; Wohl, S.; Ogée, J. The role of soil pH on soil carbonic anhydrase activity. Biogeosciences 2018, 15, 597–612. [Google Scholar] [CrossRef]
  79. Zhang, Y.; Wu, R.; Zhang, Y.; Wang, G.; Li, K. Impact of nutrient addition on diversity and fate of fecal bacteria. Sci. Total. Environ. 2018, 636, 717–726. [Google Scholar] [CrossRef]
  80. Dennis, P.G.; Newsham, K.K.; Rushton, S.P.; O’Donnell, A.G.; Hopkins, D.W. Soil bacterial diversity is positively associated with air temperature in the maritime Antarctic. Sci. Rep. 2019, 9, 2686. [Google Scholar] [CrossRef]
  81. Cao, B.; Zhang, Y.; Wang, Z.; Li, M.; Yang, F.; Jiang, D.; Jiang, Z. Insight Into the Variation of Bacterial Structure in Atrazine-Contaminated Soil Regulating by Potential Phytoremediator: Pennisetum americanum (L.) K. Schum. Front. Microbiol. 2018, 9, 864. [Google Scholar] [CrossRef] [PubMed]
  82. Teshita, A.; Khan, W.; Ullah, A.; Iqbal, B.; Ahmad, N. Soil Nematodes in Agroecosystems: Linking Cropping System’s Rhizosphere Ecology to Nematode Structure and Function. J. Soil Sci. Plant Nutr. 2024, 24, 6467–6482. [Google Scholar] [CrossRef]
  83. Zhu, L.; Hou, Z.; Hu, X.; Liu, X.; Dai, T.; Wang, X.; Zeng, C.; Wang, Y.; Wang, C.; Yang, S.; et al. Genomic and metabolic features of an unexpectedly predominant, thermophilic, assistant starter microorganism, Thermus thermophilus, in Chinese Inner Mongolian Cheese. Foods 2021, 10, 2962. [Google Scholar] [CrossRef]
  84. Hou, X.; Dai, C.; Tang, Y.; Xing, Z.; Mintah, B.K.; Dabbour, M.; Ding, Q.; He, R.; Ma, H. Thermophilic solid-state fermentation of rapeseed meal and analysis of microbial community diversity. LWT 2019, 116, 108520. [Google Scholar] [CrossRef]
  85. Wei, W.; Hu, X.; Hou, Z.; Wang, Y.; Zhu, L. Microbial community structure and diversity in different types of non-bovine milk. Curr. Opin. Food Sci. 2021, 40, 51–57. [Google Scholar] [CrossRef]
  86. Zhao, Q.; Shi, Y.; Ngea, G.L.N.; Zhang, X.; Yang, Q.; Zhang, Q.; Xu, X.; Zhang, H. Changes of the microbial community in kiwifruit during storage after postharvest application of Wickerhamomyces anomalus. Food Chem. 2023, 404, 134593. [Google Scholar] [CrossRef]
  87. Li, H.; Li, P.; Li, J.; Jiang, Y.; Huang, X. Influence of micro/nano aeration on the diversity of the microbial community in drip irrigation to reduce emitter clogging. Biosyst. Eng. 2023, 235, 116–130. [Google Scholar] [CrossRef]
  88. Zheng, Z.; He, Y.; He, Y.; Zhan, J.; Shi, C.; Xu, Y.; Wang, X.; Wang, J.; Zhang, C. Micro-nano bubble water subsurface drip irrigation affects strawberry yield and quality by modulation of microbial communities. Agric. Water Manag. 2025, 307, 109228. [Google Scholar] [CrossRef]
  89. Qin, Y.; Yu, H.; Chen, K.; Cui, R.; Cao, J.; Wang, Z.; Zhang, Z.-H.; Soteyome, T. Effects of chitosan/eugenol-loaded IRMOF-3 nanoparticles composite films on reactive oxygen species metabolism and microbial community dynamics in postharvest strawberries. Food Biosci. 2025, 63, 105652. [Google Scholar] [CrossRef]
  90. Yergeau, E.; Kang, S.; He, Z.; Zhou, J.; Kowalchuk, G.A. Functional microarray analysis of nitrogen and carbon cycling genes across an Antarctic latitudinal transect. ISME J. 2007, 1, 163–179. [Google Scholar] [CrossRef]
  91. Bodenhausen, N.; Horton, M.W.; Bergelson, J. Bacterial Communities associated with the leaves and the roots of Arabidopsis thaliana. PLoS ONE 2013, 8, e56329. [Google Scholar] [CrossRef] [PubMed]
  92. Yeager, C.M.; Gallegos-Graves, L.V.; Dunbar, J.; Hesse, C.N.; Daligault, H.; Kuske, C.R. Polysaccharide degradation capability of actinomycetales soil isolates from a semiarid grassland of the colorado plateau. Appl. Environ. Microbiol. 2017, 83, e03020-16. [Google Scholar] [CrossRef]
  93. Wei, H.; Wang, L.; Hassan, M.; Xie, B. Succession of the functional microbial communities and the metabolic functions in maize straw composting process. Bioresour. Technol. 2018, 256, 333–341. [Google Scholar] [CrossRef] [PubMed]
  94. Lin, H.; Pan, T.; Li, Y.; Chen, S.; Li, G. Development of analytical method associating near-infrared spectroscopy with one-dimensional convolution neural network: A case study. J. Food Meas. Charact. 2021, 15, 2963–2973. [Google Scholar] [CrossRef]
  95. Liu, S.; Liu, Q.; Li, X.; Obadi, M.; Jiang, S.; Li, S.; Xu, B. Effects of dough resting time on the development of gluten network in different sheeting directions and the textural properties of noodle dough. LWT 2021, 141, 110920. [Google Scholar] [CrossRef]
Figure 1. (A) Temporal variation of CO2 flux in fluvo-aquic soil across pH treatments; (B) Temporal variation of CO₂ flux in red soil across pH treatments; (C) pH-dependent dissolved organic carbon (DOC) concentrations in fluvo-aquic and red soils. (D) pH-dependent dissolved organic nitrogen (DON) concentrations in fluvo-aquic and red soils. Note; the labels a–d denote hierarchical levels, where a represents the highest and d the lowest rank.
Agriculture 15 01068 g001
Figure 2. Heatmap indicates the relative abundance of major bacterial phyla and genera with different treatment in two soil samples: (A) the relative abundance of dominant bacterial phyla and classes of Proteobacteria; (B) the relative abundance of the 14 most abundant bacterial genera.
Agriculture 15 01068 g002
Figure 3. Principal component analysis (PCA) of bacterial community from two kinds of soil with different values of pH.
Agriculture 15 01068 g003
Figure 4. Prediction of bacterial metabolism function with different pH values in alkaline soil analyzed by PICRUSTs.
Agriculture 15 01068 g004
Figure 5. Prediction of bacterial metabolism function with different pH values in red soil analyzed by PICRUSTs.
Agriculture 15 01068 g005
Figure 6. Subsystem of energy metabolism with different pH values in alkaline soil analyzed by PICRUSTs.
Agriculture 15 01068 g006
Figure 7. Subsystem of energy metabolism with different pH values in red soil analyzed by PICRUSTs.
Agriculture 15 01068 g007
Figure 8. (A) GH48 gene abundance under increasing pH gradients in fluvo-aquic soil. (B) cbhI gene abundance under increasing pH gradients in fluvo-aquic soil. (C) Decline in GH48 gene abundance with rising pH in red soil. (D) Decline in cbhI gene abundance with rising pH in red soil. Note; the labels a–c denote hierarchical levels, where a represents the highest and d the lowest rank.
Agriculture 15 01068 g008
Figure 9. Network analysis revealing the associations among bacterial community and soil chemical characteristics, functional genes, and microbial metabolism (A). Subnetwork for the microorganism with soil chemical characteristics (B), functional genes (C), and microbial metabolism (D). Red solid and blue dashed lines represent strong positive linear (r > 0.8) and strong negative (r < −0.08) relationships, while gray lines denote strong nonlinear associations (MIC-p2 > 0.8). Colored nodes signify corresponding OTUs assigned to major phyla and classes.(E): Temporal dynamics of microbial enzymatic activity (e.g., cellulase, β-glucosidase) across pH gradients. (F): Soil microbial biomass carbon (MBC) and nitrogen (MBN) variations under different pH treatments. (G): pH-dependent shifts in fungal-to-bacterial ratio influencing organic matter decomposition. (H): Correlation heatmap between soil physicochemical properties (e.g., DOC, DON) and microbial taxa abundance. (I): Functional redundancy analysis of cellulolytic genes (GH48, cbhI) across microbial taxa in contrasting pH conditions.
Agriculture 15 01068 g009
Table 1. The correlations (r) and significance (P) were determined by Mantel tests between pH and bacterial phyla, genus, and environmental variables.
Alkaline SoilRed Soil
rprp
Dominant Phyla
Alphaproteobacteria0.76<0.00010.580.003
Bacteroidetes0.690.0010.9<0.0001
Actinobacteria0.780.00010.630.001
Acidobacteria0.630.0050.83<0.0001
Functional Genes
GH480.1450.1210.6010.002
cbhI−0.0950.8390.5430.006
Soil Properties
DOC0.91<0.00010.95<0.0001
DON0.95<0.00010.95<0.0001
CO2 flux0.864<0.00010.7140.001
Disclaimer/Publisher’s Note: The statements, opinions and data contained in all publications are solely those of the individual author(s) and contributor(s) and not of MDPI and/or the editor(s). MDPI and/or the editor(s) disclaim responsibility for any injury to people or property resulting from any ideas, methods, instructions or products referred to in the content.

