Article

Integrated Transcriptome and Metabolome Analysis Reveals Candidate Genes and Regulatory Pathways Shaping Duck Meat Color

1
Farm Animal Genetic Resources Exploration and Innovation Key Laboratory of Sichuan Province, College of Animal Science and Technology, Sichuan Agricultural University, Chengdu 613000, China
2
Henan Xurui Food Company, Jiaozuo 454991, China
*
Author to whom correspondence should be addressed.
Agriculture 2025, 15(10), 1059; https://doi.org/10.3390/agriculture15101059
Submission received: 3 March 2025 / Revised: 24 April 2025 / Accepted: 7 May 2025 / Published: 14 May 2025
(This article belongs to the Section Farm Animal Production)

Abstract

:
Meat color is the most intuitive measure of meat quality and has a significant impact on consumer preference. To explore the molecular mechanisms affecting duck pectoralis meat color, the phenotypic traits of Cherry Valley duck (CV, eight males and eight females) and Huai Fu duck (HF, eight males and eight females) were compared; three males and three females of each variety were later selected for transcriptomic and metabolomic analyses to reveal key molecular processes. This study found that the expression level of CA3 (carbonic anhydride enzyme 3) is positively correlated with the meat color phenotype, suggesting that it may play a positive regulatory role in the formation of meat color. The expression trend of the ST13 gene is opposite to the phenotype, suggesting that it may play a negative regulatory role. With the participation of CA3 and NDUF family genes (such as NDUFC2, NDUFB2, etc.), the oxidative phosphorylation pathway plays a key role in meat color formation by regulating the oxygenation/deoxygenation state of myoglobin and intracellular pH value. Although the effects of these genes and pathways on meat color have been discovered, their specific genetic mechanisms and molecular functions still need further verification. This provides important clues for further understanding the molecular mechanism of meat color formation and may offer potential molecular targets for improving meat color or breeding new varieties.

1. Introduction

Meat color is an important sensory indicator for evaluating meat quality, which directly affects consumers’ perception of freshness and health [1,2]. Usually, consumers prefer bright-red chicken or beef, while duck meat usually has a darker meat color. For duck meat, a bright red or an even deeper red is considered to indicate high-quality meat, while a pale or abnormal color may indicate poor quality [3]. Undesirable meat color reduces consumers’ willingness to buy meat products, resulting in stagnation, waste, and economic losses. Therefore, improving meat color traits has become key to breeding efforts.
Understanding the mechanism of meat color formation is essential to improving meat color appearance in breeding. Meat color is mainly determined by the contents of myoglobin in meat [4]. Notably, the content of myoglobin is distinct among different muscle fiber types, especially since there is a higher content of myoglobin in slow-oxidizing muscle fibers (Myosin Heavy Chain Type I). Hence, muscle rich in type I fibers shows a brighter-red appearance [5]. Zou et al. found that Angus beef psoas rich in type I muscle fibers showed a more vivid red color [6]. In addition, there is a close relationship between meat color and mitochondrial function [7,8,9,10]. In muscle, myoglobin functions synergistically with the mitochondria, which produce energy, while myoglobin is responsible for oxygen transportation and storage. Competition between them for oxygen utilization may decrease partial pressure, prompting myoglobin’s conversion to methemoglobin and deepening the meat color. At the same time, reactive oxygen species produced by mitochondria may oxidize myoglobin, affecting the stability of meat color. These interrelated biological processes will eventually determine the final formation of meat color. Nevertheless, meat color, as a complex quantitative trait, is still regulated by various genes and environmental factors, and its complexity has not yet been fully revealed [11]. Due to the low heritability of meat colors (0.14–0.25) and the difficulties in measuring live animals, traditional breeding methods have faced challenges in achieving the genetic improvement necessary for meat color trait accuracy [12].
Duck meat is popular among consumers because of its high protein, low cholesterol, and easy digestibility. According to statistics, China’s duck meat production ranks first in the world, with a total output of 10.23 million tons in 2023, and its production and sales are the third largest meat product after pork and chicken in China. In sales, meat color plays a decisive role in consumer choice. Currently, 53 QTL loci related to meat color traits have been screened in chickens, and these loci involve multiple chromosomes. Several candidate genes related to chicken meat color have been identified, such as BCO1, BEGAIN, CDYL2, ZFYVE26, ACSS3, and ACAA2 [13]. However, relatively few studies have been conducted on meat color traits in duck meat, mainly because, compared with chicken meat, the genetic resources of duck meat are relatively limited, and current understanding of duck genomic information is not yet perfect, and all of these factors limit the genetic analysis of meat color traits in duck meat, which limits the improvement in duck meat quality and intensifies the challenge in breeding practice.
Transcriptomic and metabolomic analysis have been proven to be powerful tools for studying meat quality traits, contributing to a better understanding of the molecular mechanisms underlying meat color formation through multiomics analyses. In ducks, the Cherry Valley and Huai Fu breeds showed significant differences in meat color appearance under naked-eye observation. Therefore, in this study, taking these two duck breeds as the research objects, transcriptomics and metabolomics techniques were employed to deeply explore the molecular process underlying meat color differences at the levels of gene expression and metabolites, intending to provide valuable genetic information for breeding practices and deeper understanding of the biological basis of meat color formation. This will help to improve the quality of duck meat in a more targeted manner to meet consumer demand for high-quality meat.

2. Materials and Methods

2.1. Ethics Statement

The animal experimentation protocols implemented in this research received formal approval from the Ethics Committee of Sichuan Agricultural University (IACUC Approval Code: DKY-B20201302), with all procedures being performed in strict compliance with institutional animal welfare regulations [14].

2.2. Experimental Design and Sampling

This experiment was conducted on the farm attached to Henan Xurui Foods Company. A total of 2000 ducklings were selected for rearing, of which half were Cherry Valley (CV) ducks and half were Huai Fu (HF) ducks. All ducks were kept under the same environmental conditions that comply with commercial duck rearing standards, and the environmental parameters were monitored and maintained within industry standards to ensure the welfare and optimal growth of the ducks. During the feeding period, the ducks were free to drink water, and feeding was carried out in two stages: (1) Forage No. 548 was fed freely to ducks until 1 kg was eaten up; and (2) in the later stage, they were fed with feed 549T2, with free access during the day (12 h feeding) and no feeding at night (Supplementary Table S1).
At 56 days of age, 16 healthy ducks (8 males and 8 females) of similar weight were randomly selected from each breed for slaughter and phenotypic data collection. The ducks were fasted for 12 h prior to slaughter, stunned by electroshock, bled, and plucked; this was followed by rapid segmentation of the left pectoral muscle of the ducks. Within 1–2 h after slaughter, the fascia was removed, and three sampling points were selected from the upper, middle, and lower pectoral muscles of the left breast of the sample ducks, and L*a*b* values (luminance (L*, 0−100, where 50 means 50% of blackness), redness (a*, +127~−128, positive reddish, negative greenish), and yellowness (b*, +127~−128, positive yellowish, negative blueish)) were determined with a colorimeter, and the average value was taken as the phenotypic value. After completing the determination of L*a*b* values, the pectoral muscles were photographed under the following conditions: high resolution and the same position and exposure. The obtained photos were imported into PS software (Adobe Photoshop CC 2019), and an area of 1 cm × 1 cm was selected to count the RGB (redness (R), greenness (G), and blueness (B), all with values ranging from 0 to 255) and HSB (hue (H, 0−360), saturation (S, 0−100%) and brightness (B, 0−100%)) color values of the four corners and diagonal intersections, and each measurement was repeated five times, and the average value was taken as the phenotypic data. After the phenotypic data were collected, three males and three females (six individuals) were randomly selected from each species to collect thoracic tissues for subsequent histological analysis. Standardized 2 cm × 1 cm × 1 cm tissues were excised from each pectoral muscle homologous region. These samples were immediately snap-frozen in liquid nitrogen and maintained at −80 °C for subsequent RNA and metabolite isolation. The remaining pectoral muscle tissue was transferred to a refrigerator at −20 °C for storage until further analytical processing (Figure 1).

2.3. Transcriptome Analysis of Pectoral Muscle Tissue

Total RNA was isolated using TRIzol reagent (Takara, Chengdu, China). Following chloroform phase separation and centrifugation, the RNA-containing precipitate was collected, air-dried, and resuspended in 20 μL DEPC-treated water. RNA purity was assessed via spectrophotometry with triplicate measurements, while integrity was confirmed by agarose gel electrophoresis showing distinct bands within expected molecular weight ranges without degradation. All qualified RNA samples were stored at −80 °C.
For library preparation, ≥1 μg total RNA was processed using the NEBNext Ultra Directional RNA Library Prep Kit. Poly (A) + RNA was enriched with magnetic beads; this was followed by fragmentation in a divalent cation buffer. First-strand cDNA synthesis was performed using reverse transcriptase, with subsequent second-strand generation. After double-stranded end repair and 3’ end single-base extension, the cDNA was connected to sequencing adapters. The cDNA product of the target length was selected for PCR enrichment and purification, and the sequencing library was constructed.
RNA sequencing libraries were constructed with the VAHTS mRNA-seq V3 Library Prep Kit (Illumina (San Diego, CA, USA)) following manufacturer protocols [15,16]. Initial quality control of cDNA libraries was performed using an Agilent 2200 TapeStation system (Beijing, China) to verify fragment size distribution and library integrity. Qualified libraries were subsequently processed on an Illumina NovaSeq 6000 platform. Raw sequencing data underwent quality assessment via FastQC (V0.11.9), with NGSToolkits (v2.3.3) employed to filter reads, retaining only high-quality sequences (Q-score > 20) [15]. Functional annotation of unigenes was achieved through homology searches against the UniProt public database using sequence alignment methods [17,18].
Differentially expressed genes (DEGs) across the four experimental groups were determined via the DESeq2 R (v4.5.1) package, with statistical significance defined as p < 0.05 combined with absolute log2 (fold changes) exceeding 1 (|log2FC| > 1). Functional interpretation was conducted through dual approaches: KEGG pathway enrichment analysis was executed using KOBAS (http://bioinfo.org/kobas/genelist/ (accessed on September 2023)), while GO term annotation was performed with dedicated enrichment tools. For both analyses, biological terms/pathways meeting the significance threshold (p < 0.05) were considered statistically enriched.

2.4. Metabolome Analysis of Pectoral Muscle Tissue

A total of 200 mg (±1%) of duck pectoral muscle sample was weighed into a 2 mL centrifuge tube, 600 μL of methanol solution containing 4 ppm 2-chlorophenylalanine pre-cooled to −20 °C was quickly added, and the contents were mixed thoroughly after 30 s of vortexing and oscillation. A total of 100 mg of grinding beads were added and transferred to a grinder, the tissue was crushed for 1.5 min at 60 Hz, the tissue was sonicated for 15 min at 4 °C with 12,000 rpm centrifugation for 10 min, and the filtrate was transferred to a feed bottle for measurement. After centrifugation at 12,000 rpm for 10 min at 4 °C, 300 μL of supernatant was purified using a 0.22 μm filter membrane, and the filtrate was transferred to the injection bottle for measurement. The filtrate was transferred to the injection bottle for measurement. A total of 20 μL of the supernatant from each treatment group was used as the quality control mixture, and the remaining sample was used for LC-MS detection [19].
Based on the Thermo Vanquish (Thermo Fisher Scientific, Massachusetts USA) ultra-high-performance liquid chromatography system, the ACQUITY UPLC®HSS T3 chromatographic separation column was configured. The flow rate was set at 0.3 mL/min, the column oven was kept at a constant temperature of 40 °C, and the injection volume was set at 2 μL. The mobile phase system included the following: 0.1% formic acid acetonitrile (B2) and 0.1% formic acid water (A2) or acetonitrile (B3) and 5 mM ammonium formate water (A3). The gradient elution procedure was as follows: initial stage (0–1 min)—B2/B3 was 8%; linear increase (1–8 min)—B2/B3 rose from 8% to 98%; maintenance of balance (8–10 min)—B2/B3 remained at 98%; rapid reset (10–10.1 min)—B2/B3 recovered to 8% The ESi-MSn experiment was accomplished using the Thermo Orbitrap Exploris 120 mass spectrometer. A voltage of 3.50 kV was applied in the positive ion mode, adjusted to −2.50 kV in the negative ion mode, the sheath gas flow rate was set at 40arb, and the auxiliary gas flow rate was controlled at 10arb. The capillary was heated to 325 °C. The resolution of the first-stage full scan was set at 60,000 (m/z 100–1000). The second-stage pyrolysis adopted the HCD mode (collision energy 30%), and the second-stage resolution was 15,000. The first 4 ions of the collected signal were fragmented, and the dynamic exclusion strategy was applied to remove the unnecessary MS/MS information [20,21].
The raw data were converted to mzXML format using Proteowizard (v3.0.8789) and subsequently processed with R (v3.4.1) XCMS package for peak detection, filtration, and alignment. Following intra-sample normalization of peak area data, metabolomics datasets underwent Pareto scaling for standardization. Metabolite annotation was performed by matching MS/MS spectra against five major databases: HMDB (http://www.hmdb.ca (accessed on 15 September 2023)), Metlin (http://metlin.scripps.edu (accessed on 15 September 2023)), Massbank (http://www.massbank.jp/ (accessed on 15 September 2023)), LipidMaps (http://www.lipidmaps.org (accessed on 15 September 2023)), and Mzclound (https://www.mzcloud.org (accessed on 15 September 2023)) to obtain accurate metabolite information. Differentially abundant metabolites (DAMs) were identified using dual thresholds of statistical significance (p ≤ 0.05) and multivariate analysis relevance (VIP ≥ 1) [22]. The results of the cluster analysis of metabolite abundance patterns were visualized through hierarchical heatmaps generated with the pheatmap package. Pathway enrichment analysis was conducted using MetaboAnalyst 5.0 to elucidate significantly perturbed metabolic pathways [18].

2.5. Comprehensive Analysis

Firstly, KEGG co-enrichment was performed on the transcriptome and metabolome data. Secondly, in the gene expression data of the transcriptome, all the genes included in the pathway and the shared genes in the four groups were selected. In the metabolite relative content data of the metabolome, all the differential metabolites were selected, and Pearson correlation coefficients between the DEGs and the DAMs were calculated by using the cor program in the R language and generating the correlation clustering heatmap, after which the gene–metabolite pairs with correlation coefficients greater than 0.6 were screened out to construct a transcript and metabolite network. The KEGG database was used for joint biological annotation to uncover the association relationship between the differentially expressed genes and the differential metabolites.

2.6. Statistical Analysis

Data were analyzed using SPSS statistical software, version 20.0. A t-test was used to analyze the differences between the groups. The data are presented as the mean ± SEM, and p < 0.05 was used to define significant statistical differences [23].

3. Results

3.1. Descriptions of Duck Meat Color

The results of meat color phenotypic data analysis for Cherry Valley (CV) and Huai Fu (HF) duck groups are presented in Table 1. The CV ducks exhibited higher mean values for R, G, B1, S, B2, L*a*b*, and IMF than HF ducks. In particular, the average G value and b* value of CV ducks were 51.45 and 5.04, which were significantly different from 39.31 and 3.71 in the HF group (p < 0.05).
The phenotypic comparison results of meat color between the male and female ducks in the CV and HF groups are presented in Table 2. The results showed significant sexual dimorphism in the CV group. Specifically, the R, G, B1, S, B2, and b* values of CV male ducks (CV-M) were significantly higher than those of female ducks (CV-F), especially the B1 value; the value of 59.4 for CV-M was much higher than the value of 40.43 for CV-F (p < 0.01), which made the overall meat color of CV-M more bright and intense. It is worth mentioning that, when comparing the four groups of male and female data of CV and HF, the average value of CV-M reached its highest for R (89.7), G (63.03), B1 (59.4), B2 (35.15), L* (42.54), and b* (5.66). It further highlights the superiority of its meat color. In contrast, there were no significant differences between the sexes within the HF group. Although the values for HF male ducks (HF-M) were slightly higher than those for female ducks (HF-F) on some phenotypic items, these differences were not statistically significant.

3.2. Overview of Transcriptome and Metabolome Dataset

In the transcriptome analysis, 12 cDNA libraries were synthesized to generate RNA-seq data. The average clean data generated for each sample were about 6 GB, and the percentage of the number of high-quality sequence reads was above 96.82%, indicating high sequencing quality. After data filtering, Q20 was ≥97.68%, and Q30 was ≥93.55%. These results indicate that the sequencing data are reliable and can be used for subsequent analysis (Supplementary Tables S2 and S3). In the metabolome analysis, according to the base-peak chromatograms of the selected typical samples shown, the differences in the appearance time of each peak and the peak area between the two groups indicated that the types and concentrations of the metabolites varied greatly between the two groups (Supplementary Figure S1).
Based on the analysis of normalized data using OPLS-DA with transcriptome data as well as positive and negative ion pattern data, the results showed that PC1 of the transcriptome accounted for 11.1% of the variance (Figure 2A). In comparison, PC1 of metabolites accounted for 11.3% (positive) and 10.3% (negative) of the variance (Figure 2B,C). The samples clustered well within each group, indicating good reproducibility and reliable sample quality. The permutation plot can effectively evaluate whether the current model is overfitting. The evaluation criteria are as follows (only one needs to be satisfied): (1) all the blue Q2 points are lower than the rightmost original blue Q2 point; (2) the regression line of the Q2 point is less than or equal to zero at the intersection. The results of all groups meet the above requirements (Figure 2a–c), indicating that the established model is reliable and has good predictive ability. The remaining groups meet the above conditions (Supplementary Figure S2).

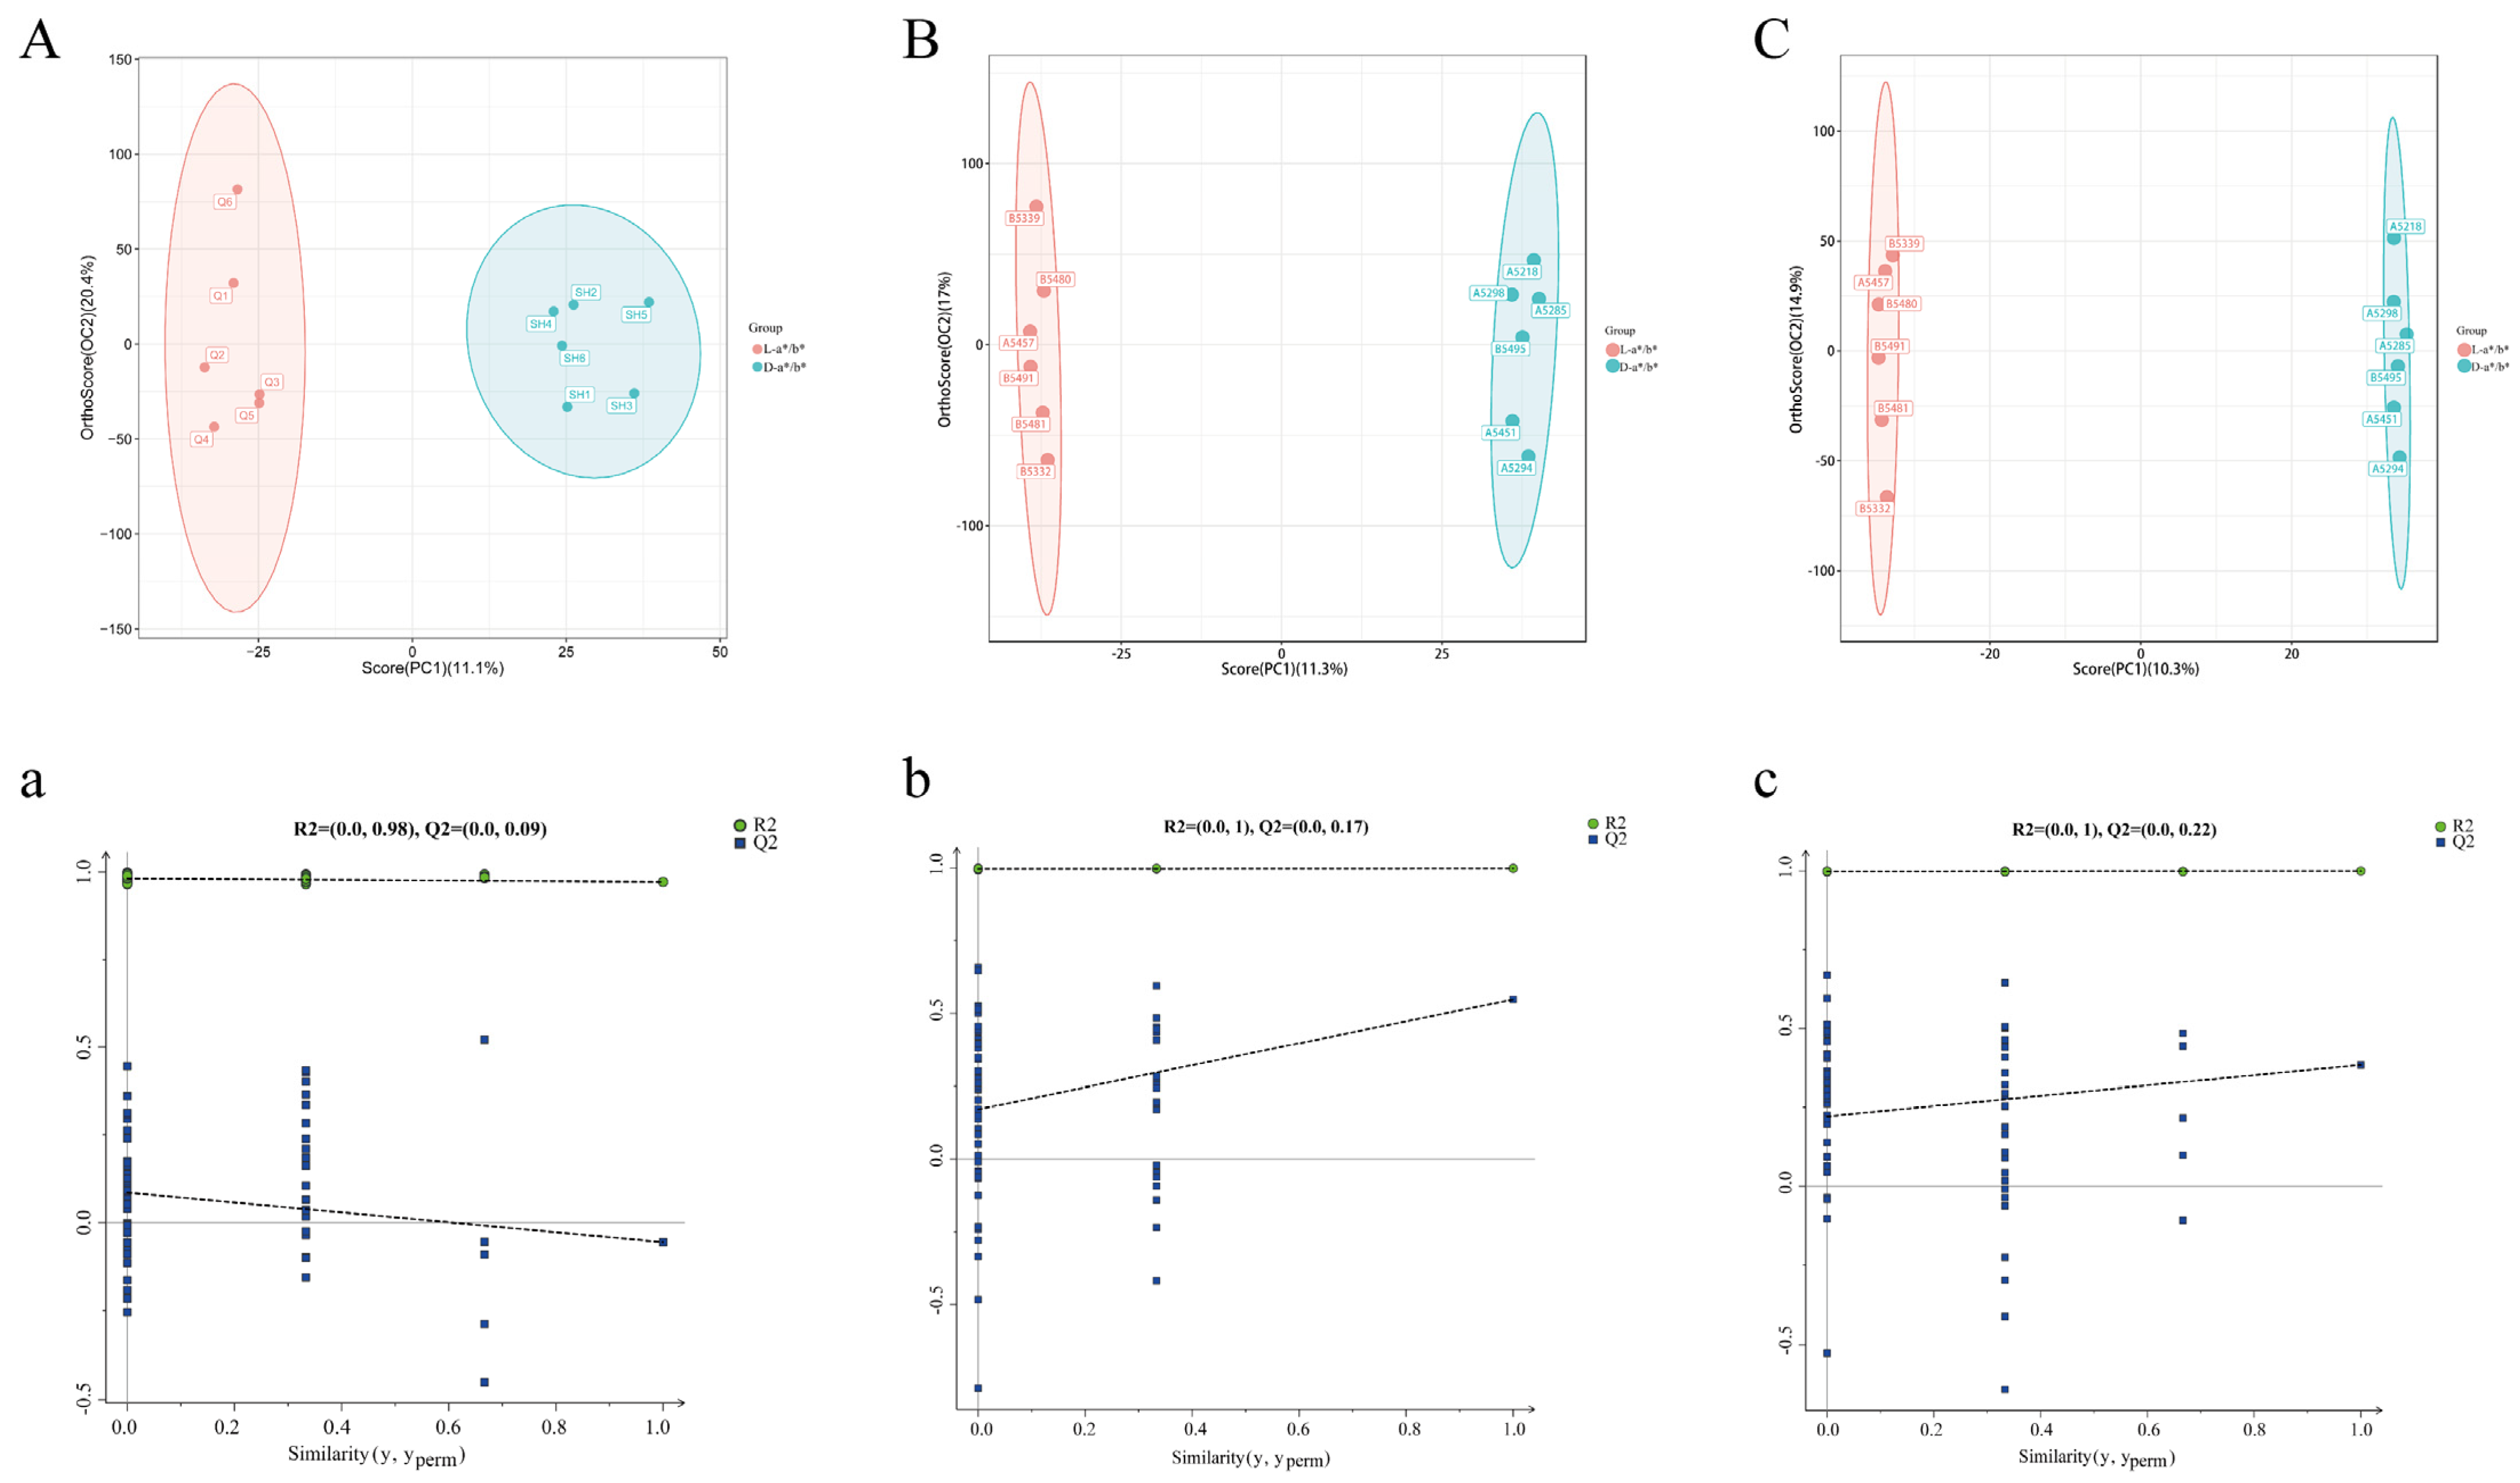
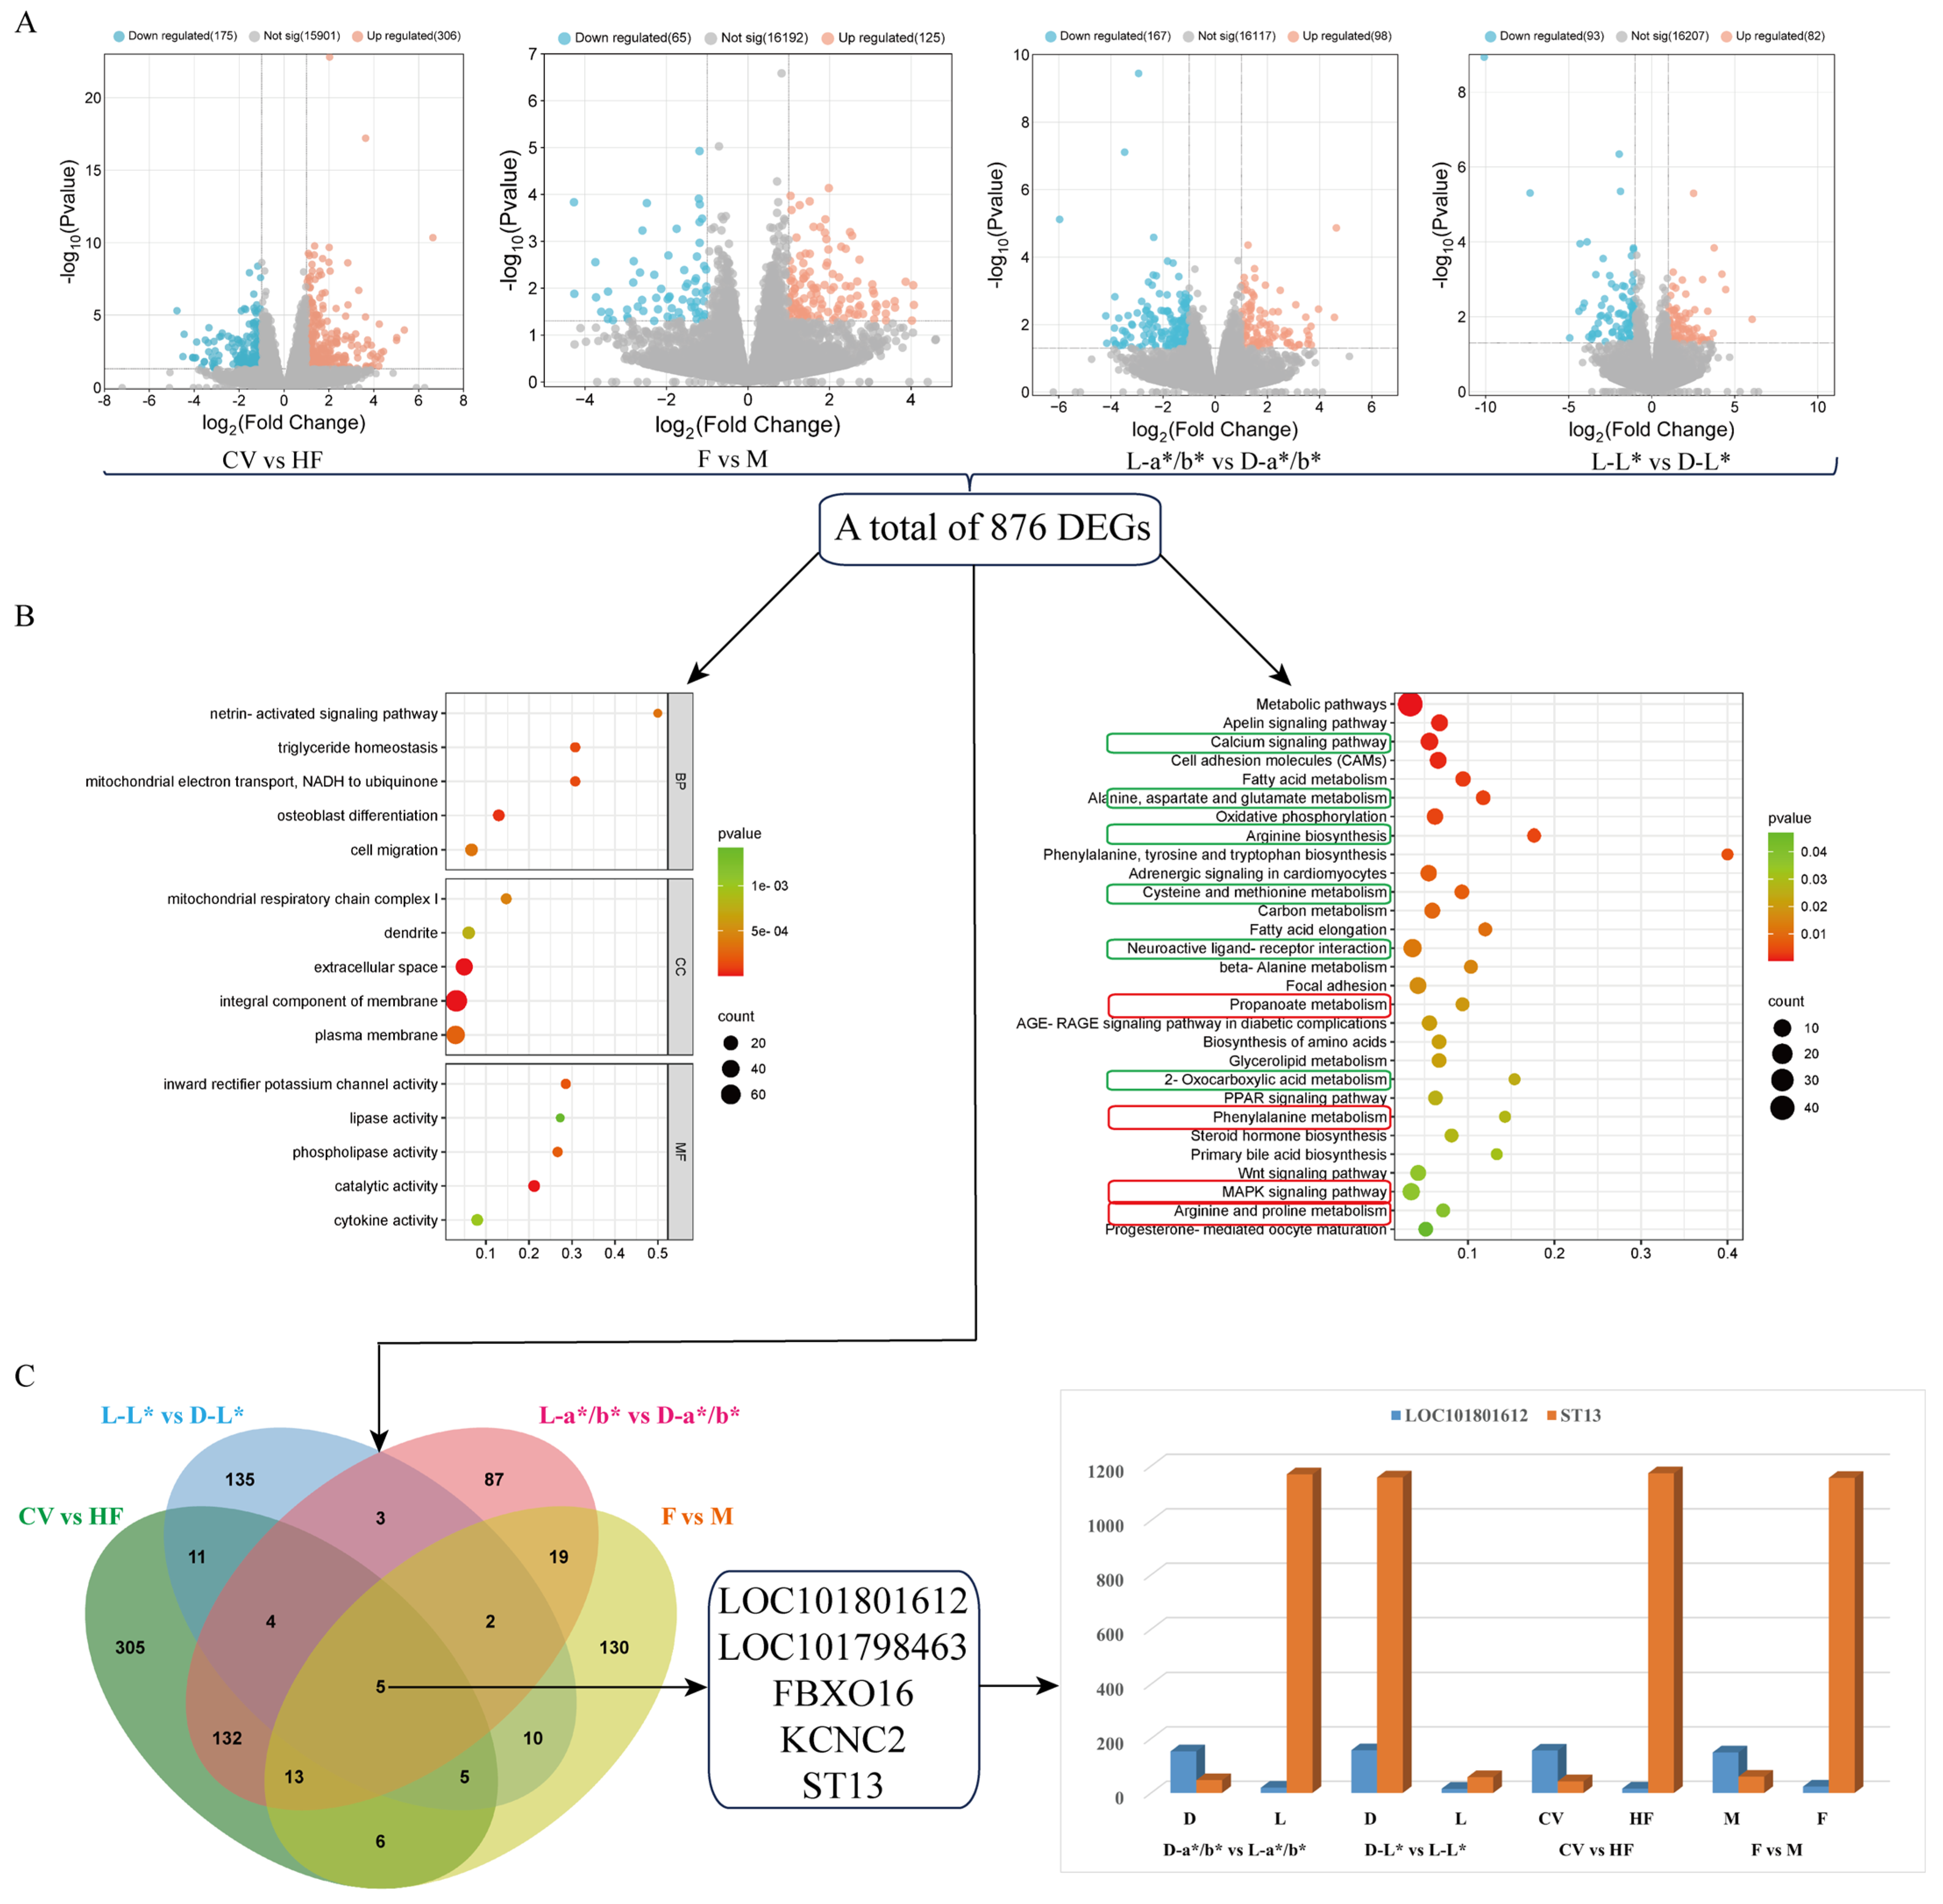
3.3. Comparative Analysis Based on the Pectoral Muscle Transcriptome

To further analyze transcriptome differences in meat color, this study used the following groupings based on the analysis results of the meat color phenotype data: (1) Breeds: This consists of group CV for Cherry Valley ducks and group HF for Huai Fu ducks. (2) Sex: Due to the consistent pattern of meat color differences between males and females within the CV and HF groups, the breeds were subsequently combined and grouped based on sex alone—Group M for male ducks and Group F for female ducks. (3) Meat color (a*b*): This consists of dark meat color (D-a*/b*) and light meat color (L-a*/b*), grouped according to high or low a*/b* values. (4) Meat color (L*): This grouping is based on the L* value, with the high-L-value meat color group named D-L* and the low-L*-value meat color group named L-L*. Subsequent analysis was carried out according to the above groupings.
The DESeq2 package in R (v 3.4.1) was used to identify different groups of differentially expressed genes (DEGs). The results showed that 481 DEGs, comprising 306 up-regulated genes and 175 down-regulated genes, were screened in the CV and HF groups. Additionally, 190 DEGs were obtained in the F and M groups, of which 125 were up-regulated and 65 were down-regulated. A total of 265 DEGs were screened in the meat color L-a*/b* and D-a*/b* groups, among which 167 DEGs were down-regulated and 98 DEGs were up-regulated. A total of 175 DEGs were screened in the meat color L-L* and D-L* groups, including 82 up-regulated and 93 down-regulated genes (Figure 3A).
To further understand the role of these DEGs in biological processes, the present study analyzed 867 DEGs in pectoral muscles by GO, and the results showed that these DEGs are mainly concerned with triglyceride homeostasis, mitochondrial electron transport (NADH to ubiquinone), lipase activity, catalytic activity, inward rectifier potassium channel activity, phospholipase activity, and other biological processes. In addition, 29 pathways were further identified by KEGG enrichment analysis, among which the major pathways involved in muscle growth and development, including the MAPK signaling pathway, focal adhesion, the Wnt signaling pathway, the PPAR signaling pathway, etc. In addition, several pathways are involved in fat metabolism, including fatty acid metabolism, elongation, and adrenal signaling in cardiomyocytes. Together, these pathways regulate muscle growth, development, fat synthesis, breakdown, and energy metabolism (Figure 3B).
In order to study the potential role of DEGs in the formation of meat color, five common DEGs in four groups were investigated and represented by Venn diagrams: LOC101801612 (carbonic anhydrase 3), LOC101798463 (methyl A subunit), FBXO16, KCNC2, and ST13. In the four groups, the expression level of carbonic anhydrase 3 was consistent with the pattern presented in the meat color phenotypic data, showing higher levels in groups with better meat color, which may imply a potential positive regulatory role of carbonic anhydrase 3. Conversely, the expression trend of the ST13 gene in the three groups—CV vs. HF, M vs. F, and L-a*/b* vs. D-a*/b*—was opposite to its corresponding phenotype, indicating that the ST13 gene may play a negative regulatory role in the formation of meat color. The expression trend and meat color phenotype of this gene in the L-L* vs. D-L* group are inconsistent, which may be caused by the split of the two varieties in this group, and this group may be deprioritized in future studies. These findings provide new insights into the role of these genes in the formation of meat color. As for the three genes FBXO16, KCNC2, and LOC101798463, no significant association has been found between their expression trends and meat color phenotypes. This may suggest their relationship with meat color is relatively complex or requires further research (Figure 3C).

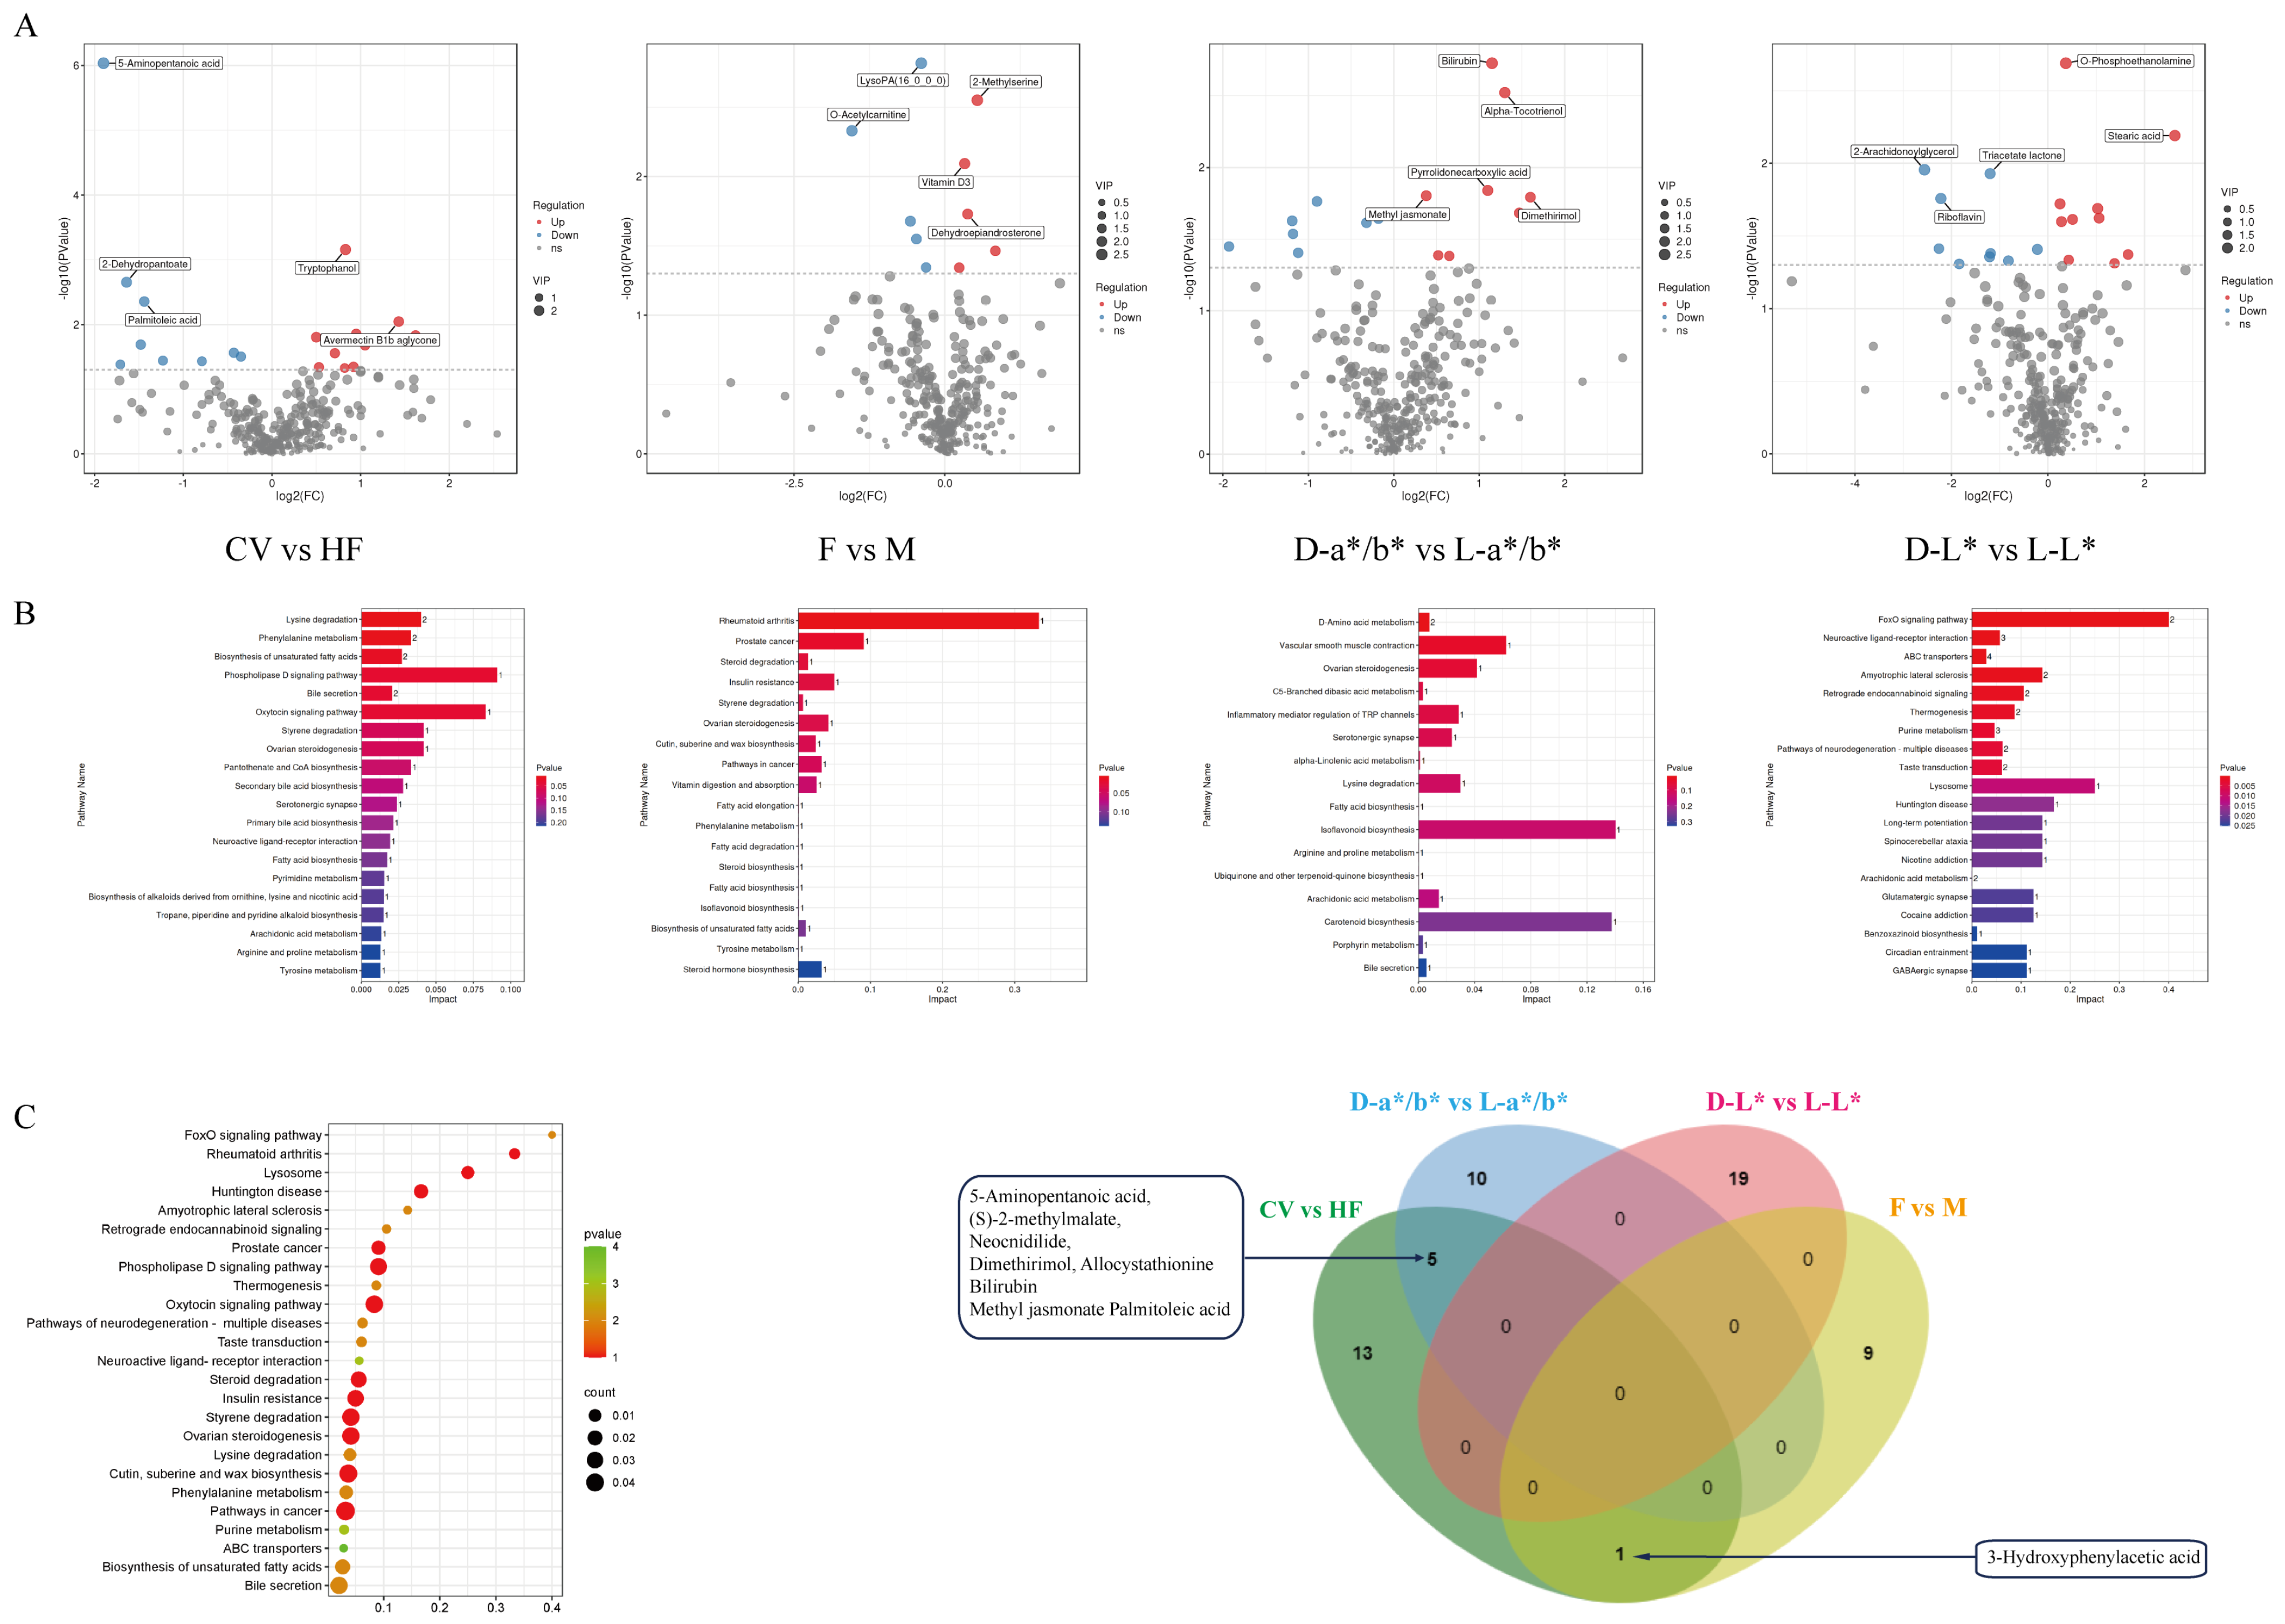
3.4. Comparative Analysis of Pectoral Muscle Metabolism

Using the groupings of the transcriptome analysis, in order to study the differences in metabolites related to meat color formation in each group, the pectoral muscle metabolites were detected by the LC-MS/MS method in positive ion and negative ion modes, respectively, and 13,891 and 12,307 metabolites were identified. After further molecular weight determination and matching annotation in the database, 333 representative metabolites were identified, which covered 39 categories, mainly including lipids, alcohols, phenols, polyhydroxyl compound nucleic acids and their derivatives, carboxylic acids and their derivatives, amino acid derivatives, etc. Based on VIP ≥ 1 and |log2 (fold change)| ≥ 1, the following results were obtained: There were 19 different metabolites between CV and HF, of which 10 were up-regulated and 9 were down-regulated. There were 10 different metabolites between F and M, of which 5 were up-regulated and 5 were down-regulated. Between L-a*/b* and D-a*/b*, eight were up-regulated and seven were down-regulated. Between L-L* and D-L*, 10 were up-regulated and 9 were down-regulated (Figure 4A).
KEGG enrichment analysis was used to help us understand the biological mechanisms associated with phenotypic change. Most of the differential metabolites were found to be closely related to fat metabolism, such as arachidonic acid metabolism, fatty acid biosynthesis, biosynthesis of unsaturated fatty acids, the phospholipase D signaling pathway, the sphingolipid signaling pathway, insulin secretion, and insulin resistance (Figure 4B,C).
To explore the related metabolites that play a role in the formation of meat color, it was found that there were differences in five common metabolites between the CV group and the HF group, and between the L-a*/b* group and the D-a*/b* group: 5-Aminopentanoic acid, (S)-2-methylmalate, Neocnidilide, Dimethirimol and Allocystathionine. There is a common metabolite difference between the CV and HF groups and between the F and M groups: 3-Hydroxyphenylacetic acid. These six metabolites are enriched in D-Amino acid metabolism, Lysine degradation, and Phenylalanine metabolism (Figure 4C).

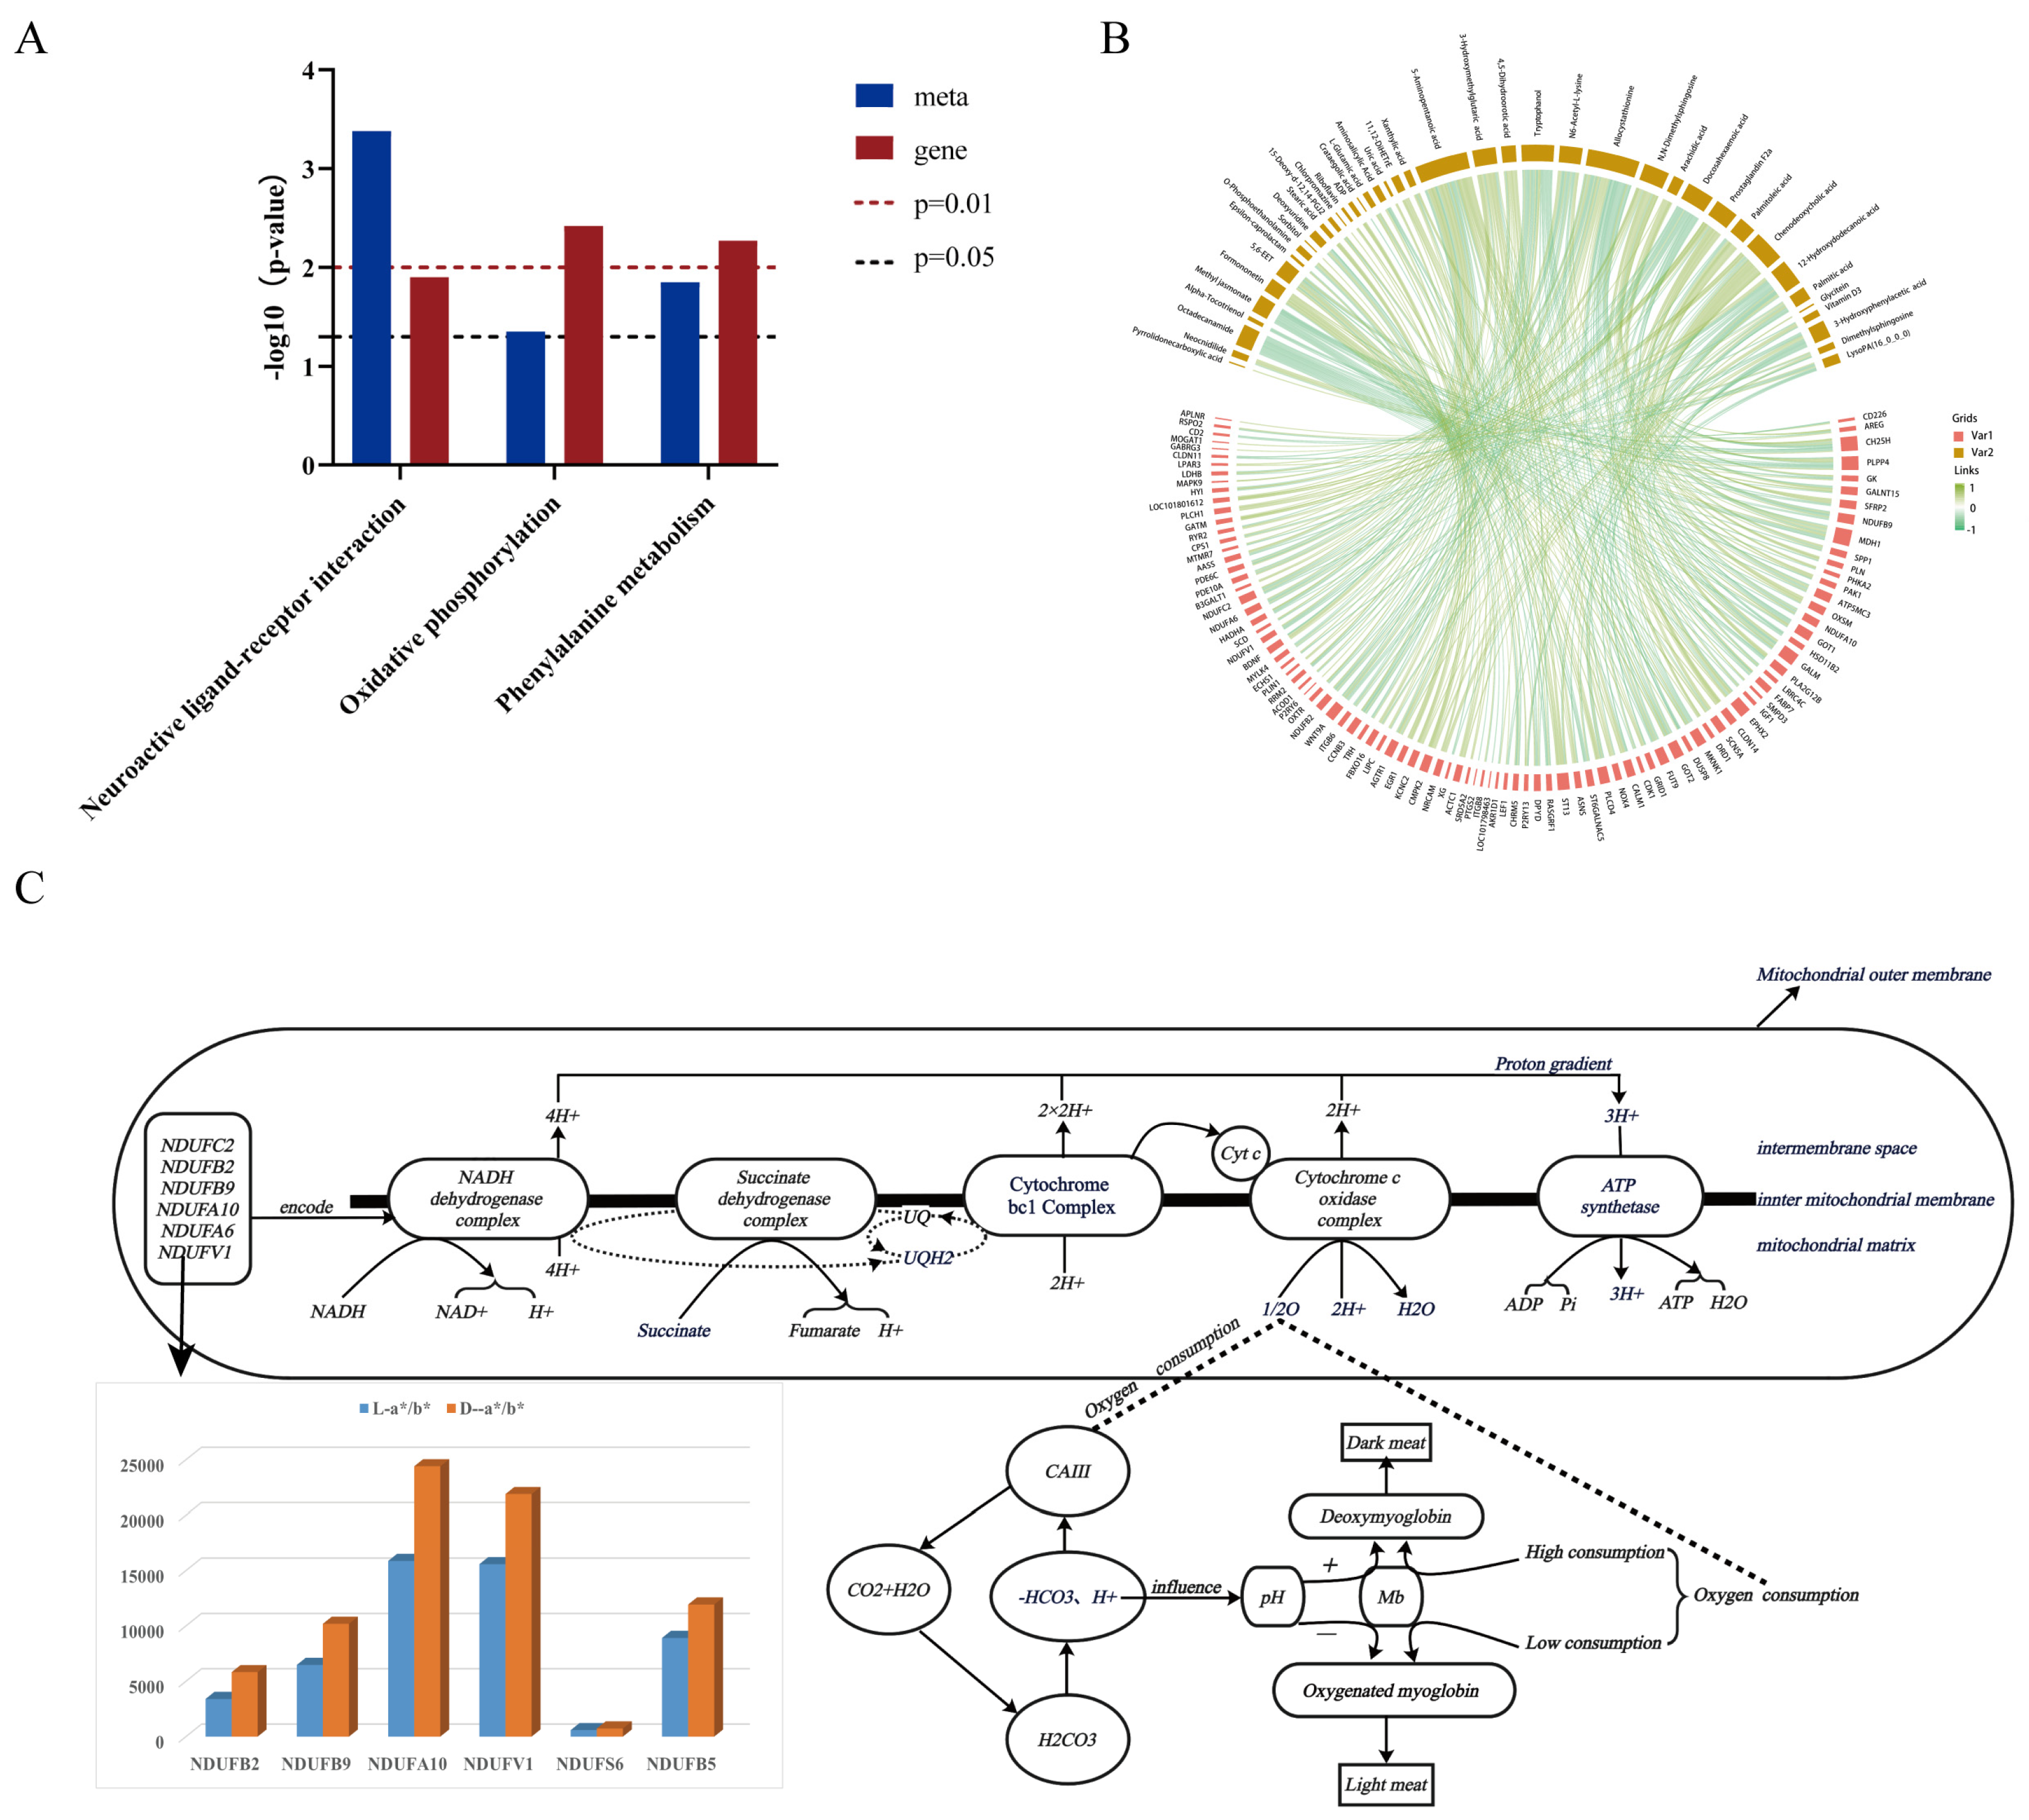
3.5. Comprehensive Analysis of Transcriptome and Metabolome Data

To further investigate the biological mechanism affecting meat color phenotype, this study integrated transcriptomic and metabolomic data of CV ducks and HF ducks, screened out the pathway of co-enrichment of genes and metabolites under the significant threshold value of p-value < 0.05, and conducted KEGG co-enrichment analysis. It was found that these genes and metabolites are co-enriched mainly in three pathways: oxidative phosphorylation, neuroactive ligand–receptor interaction, and phenylalanine metabolism (Figure 5A).
To further understand the relationship between these gene expression changes and metabolite content, correlation analysis of differentially expressed genes and metabolites between the two varieties was carried out, the correlation between DEGs and DAMs was calculated using the Pearson algorithm, and a correlation coefficient clustering heatmap was plotted. A total of 408 gene–metabolite pairs of higher correlation were obtained by screening with the criterion of p < 0.05 and r > 0.6, of which the ST13 gene was associated with 5,6-EET, Riboflavin, L-Glutamic acid, 11,12-DiHETrE, 3-Hydroxymethylglutaric acid, 4,5-Dihydroorotic acid, N6-Acetyl-L-lysine, 12-Hydroxydodecanoic acid, and Glycitein. LOC101801612 and N6-Acetyl-L-lysine, Prostaglandin F2a, and Chenodeoxycholic acid were significantly correlated with metabolites. NDUFA10, NDUFB9, NDUFB2, NDUFV1, NDUFA6, and NDUFC2 were strongly correlated with Octadecanamide, Methyl jasmonate, 5-Aminopentanoic acid, Tryptophanol, Allocystathionine, N,N-Dime-thylsphingosine, Docosahexaenoic acid, Palmitoleic acid, and 3-Hydroxyphenylacetic acid (Figure 5B,C).
In addition, the role of DGEs and DAMs in biological pathways were studied, with particular attention paid to oxidative phosphorylation, which is a core process in ATP production. NDUF family genes activate NADH dehydrogenase subunits, which consume a large amount of oxygen when promoting ATP synthesis, affect the oxygen supply in cells, and then affect the REDOX state of myoglobin and change the meat color. As a type I muscle fiber regulator, CA3 regulates pH to stabilize myoglobin reduction and maintain a bright flesh color. However, the oxygen consumption change affects pH, interferes with CA3, and darkens the meat color.
By further analyzing the expression levels of key genes in the two groups, the results showed that the expression level of NDUF family genes in the dark meat group was significantly higher than that in the light meat group, suggesting that NDUF family genes play an important role in the positive regulation of meat color (Figure 5C). Similarly, the CA3 gene also showed a similar trend, and its expression level was higher in the dark meat group, as shown in Figure 5C, further supporting its potential positive role in the regulation of meat color.

4. Discussion

With the enhancement of health consciousness, consumers’ demand for duck quality and nutrition is increasing, and meat quality traits are affected by various factors, among which meat color is particularly critical and directly related to consumers’ purchasing decisions. Cherry Valley ducks and Huai Fu ducks were selected as the subjects of this experiment to investigate the molecular mechanism of meat color formation. Through the combined transcriptome and metabolome analysis, this study focused on the differentially expressed genes and metabolites in the pectoral muscles of the two breeds to reveal the key factors leading to differences in meat color. At 56 days of age, the meat color index of Cherry Valley ducks and Huai Fu ducks was evaluated. The results showed that Cherry Valley ducks exhibited a superior meat color, boasting a more vivid and richer hue. This finding highlights the differences in meat color between breeds and further suggests that the Cherry Valley duck has a unique advantage in meat color. In addition, regardless of breed, male ducks generally showed better meat color than females, which may be related to sex-related physiological differences and genetic factors.
The transcriptome analysis identified several genes associated with muscle growth, development, and meat color. The LMOD2 gene is involved in muscle development and myosin ganglion assembly by regulating the phosphorylation of the myosin light chain, which is essential for muscle growth and contraction [23,24]. The MYLK4 and SCN5A genes are involved in muscle contraction and cellular excitability and conductance regulation, respectively, to ensure proper muscle function [25]. In addition, COL21A1 and MATN3 genes play a key role in forming and maintaining bone and muscle structure [26]. Among the meat color-related genes, PHTF2 may be involved in pigment metabolism or transport, and AKR1D1, as a member of the aldo-keto reductase family, is involved in lipid metabolism or redox reactions, both of which indirectly affect meat color. The CLDN14 and RBP5 genes regulate meat color by affecting intercellular substance exchange and vitamin A metabolism, respectively. Specifically, the expression of carbonic anhydrase 3 matched the trend of the meat color phenotypic data, suggesting that it may directly affect meat color, which has been confirmed in many studies [8,27,28,29]. In addition, genes of the NDUF family (ubiquinone oxidoreductase) are key enzymes in the respiratory chain of mitochondrial membranes. They are involved in electron transfer from NADH to the respiratory chain. Mitochondria are the energy factories of the cell, providing energy for muscle contraction and metabolism through respiration. Myoglobin is the mitochondrial oxygen reservoir and oxygen transport protein. Approximately 80% of the oxygen in the cell is used by mitochondria [30]. Thus, competition for oxygen between mitochondria and myoglobin is the limiting factor leading to the development of the bright-cherry-red surface color. More specifically, mitochondria can influence the myoglobin redox state by lowering the partial pressure of oxygen through respiration and reducing high iron myoglobin, which influences muscle color change. The discovery of these genes deepens our understanding of muscle growth and development and meat color formation and provides important clues for subsequent gene function studies and breeding practices [31].
Metabolomic analysis revealed that the differential metabolites between Cherry Valley ducks and Huai Fu broiler ducks were widely enriched in fatty acid metabolism and synthesis pathways, including the metabolic pathway, the process of tyrosine, pyruvic acid, and phenylalanine acid metabolism, the process of biosynthesis of phenylalanine, arginine, tryptophan, and tyrosine, and the PPAR signaling pathway, among many other pathways. The degree of fatty acid metabolism affects meat quality, and previous studies have found that the fatty acid composition of muscle and its metabolism are important factors influencing overall meat quality and consumer preference. Increasing evidence suggests that fatty acid biosynthesis and metabolism are regulated by peroxisome proliferator-activated receptors (PPARs), mainly through the PPAR signaling pathway [32].
In the joint transcriptome and metabolome analysis, the results showed that genes and metabolites were co-enriched in three pathways, among which oxidative phosphorylation involves the collaboration of the electron transport chain and ATP synthase, a key way for cells to obtain energy. Among them, the NADH dehydrogenase subunits are encoded by NDUFC2, NDUFB2, NDUFB9, NDUFA10, NDUFA6, and NDUFV1 genes, which constitute the starting part of the electron transport chain, and their role is to transfer the electrons in NADH to ubiquinone and then promote the synthesis of ATP. This process is accompanied by a large amount of oxygen consumption, which may lead to an insufficient supply of oxygen molecules in the cell, affecting myoglobin’s ability to bind to oxygen molecules and causing a change in meat color. In addition, the distribution differences in CA3 in different muscle fiber types and its potential influence on meat color were noted. As a key regulator of type I muscle fibers (slow muscle fibers), the expression level of CA3 not only affects meat color but also exerts a corresponding influence on the reoxidation–reduction state of myoglobin by regulating intracellular pH environment, thus changing meat color. Under suitable pH conditions, CA3 can stabilize the reduced state of myoglobin and maintain the bright color of meat. In contrast, in the case of pH imbalance, myoglobin is easily converted to high ferrimyoglobin, resulting in darker meat color. The neuroactive ligand–receptor interaction pathway involves transmitting and regulating neural signals, possibly related to signal transduction during muscle growth, development, and meat formation [21]. On the other hand, the phenylalanine metabolic pathway is an important component of amino acid metabolism, and its metabolites may have direct or indirect effects on meat color. Through the screening of gene metabolite pair correlations, the LOC10180162 gene and three metabolites, N6-Acetyl-L-lysine, Prostaglandin F2a, and Chenodeoxycholic acid, were exceptionally highly correlated. There is no conclusive evidence of their direct effect on meat color. However, these molecules may affect meat color through indirect pathways, such as affecting animals’ muscles, health, and lipid metabolism, and the specific mechanisms need further exploration.

5. Conclusions

In summary, we identified a key metabolic pathway involved in pectoral muscle color formation by combining transcriptomic and metabolomic data: oxidative phosphorylation. We also identified genes that affect meat color, including NDUF family genes, such as NDUFC2, NDUFB2, NDUFB9, NDUFA10, NDUFA6, and NDUFV1, as well as carbonic anhydrase 3, ST13, and other genes. However, the genetic mechanisms that influence the formation of meat color and the molecular functions of these key genes and metabolic pathways need to be further verified. This study provides a new perspective on the regulation of metabolism during the development of duck pectoral muscle color and also provides a theoretical basis for the genetic improvement in meat color in ducks; meanwhile, it highlights the potential of molecular breeding techniques to further improve meat quality traits in ducks.

Supplementary Materials

The following supporting information can be downloaded at https://www.mdpi.com/article/10.3390/agriculture15101059/s1. Supplementary Table S1. No. 548 and 549T2 feed nutrient composition table. Supplementary Table S2. Statistics of disembarkation data. Supplementary Table S3. Data filtering statistics.

Author Contributions

S.J.: Writing—Original Draft, Data Curation, and Visualization. Z.Y.: Methodology. Y.L.: Visualization. T.Z.: Methodology. M.X.: Methodology. X.H. (Xu Han): Methodology. Q.T.: Methodology. Y.B.: Methodology. X.H. (Xinxin He): Methodology. B.H.: Resources. J.Z.: Re-sources. L.L.: Methodology. A.H.: Methodology. L.B.: Methodology. J.H.: Methodology. H.L.: Funding Acquisition, Project Administration, and Methodology. All authors have read and agreed to the published version of the manuscript.

Funding

This research was funded by grants from the National Key R&D Program of China (2023YFD1300302, 2022YFF1000100), and the National Natural Science Foundation of China (32472898), the China Agriculture Research System of Waterfowl (CARS-42).

Institutional Review Board Statement

The animal experimentation protocols implemented in this research received formal approval from the Ethics Committee of Sichuan Agricultural University (IACUC Approval Code: DKY-B20201302), with all procedures being performed in strict compliance with institutional animal welfare regulations.

Informed Consent Statement

Informed consent was obtained from all subjects involved in the study.

Data Availability Statement

The data presented in this study are available on request from the corresponding author. The data are not publicly available due to these data may still be used by the research group in the later stage, so they have not been uploaded to the public database.

Conflicts of Interest

Authors Bo Han and Junsheng Zhu were employed by the Henan Xurui Food Company. The remaining authors declare that the research was conducted in the absence of any commercial or financial relationships that could be construed as a potential conflict of interest.

References

  1. Fu, X.; Chen, J. A Review of Hyperspectral Imaging for Chicken Meat Safety and Quality Evaluation: Application, Hardware, and Software. Compr. Rev. Food Sci. Food Saf. 2019, 18, 535–547. [Google Scholar] [CrossRef] [PubMed]
  2. Taheri-Garavand, A.; Fatahi, S.; Omid, M.; Makino, Y. Meat quality evaluation based on computer vision technique: A review. Meat Sci. 2019, 156, 183–195. [Google Scholar] [CrossRef] [PubMed]
  3. Ramanathan, R.; Kiyimba, F.; Suman, S.P.; Mafi, G.G. The potential of metabolomics in meat science: Current applications, trends, and challenges. J. Proteom. 2023, 283–284, 104926. [Google Scholar] [CrossRef] [PubMed]
  4. Mancini, R.A.; Hunt, M.C. Current research in meat color. Meat Sci. 2005, 71, 100–121. [Google Scholar] [CrossRef]
  5. Jeong, J.Y.; Hur, S.J.; Yang, H.S.; Moon, S.H.; Hwang, Y.H.; Park, G.B.; Joo, S.T. Discoloration characteristics of 3 major muscles from cattle during cold storage. J. Food Sci. 2009, 74, C1–C5. [Google Scholar] [CrossRef]
  6. Zou, B.; Shao, L.; Liu, Y.; Sun, Y.; Li, X.; Dai, R. Muscle fiber characteristics and apoptotic factor differences in beef Longissimus lumborum and Psoas major during early postmortem. Meat Sci. 2023, 198, 109092. [Google Scholar] [CrossRef]
  7. Ke, Y.; Mitacek, R.M.; Abraham, A.; Mafi, G.G.; VanOverbeke, D.L.; DeSilva, U.; Ramanathan, R. Effects of Muscle-Specific Oxidative Stress on Cytochrome c Release and Oxidation-Reduction Potential Properties. J. Agric. Food Chem. 2017, 65, 7749–7755. [Google Scholar] [CrossRef]
  8. Yu, Q.; Wu, W.; Tian, X.; Jia, F.; Xu, L.; Dai, R.; Li, X. Comparative proteomics to reveal muscle-specific beef color stability of Holstein cattle during post-mortem storage. Food Chem. 2017, 229, 769–778. [Google Scholar] [CrossRef]
  9. Yu, Q.; Tian, X.; Shao, L.; Xu, L.; Dai, R.; Li, X. Label-free proteomic strategy to compare the proteome differences between longissimus lumborum and psoas major muscles during early postmortem periods. Food Chem. 2018, 269, 427–435. [Google Scholar] [CrossRef]
  10. Ribeiro, C.C.d.S.; Contreras-Castillo, C.J.; Santos-Donado, P.R.d.; Venturini, A.C. New alternatives for improving and assessing the color of dark–cutting beef—A review. Sci. Agric. 2021, 79, e20200079. [Google Scholar] [CrossRef]
  11. Liu, H.; Hou, L.; Zhou, W.; Wang, B.; Han, P.; Gao, C.; Niu, P.; Zhang, Z.; Li, Q.; Huang, R.; et al. Genome-Wide Association Study and F(ST) Analysis Reveal Four Quantitative Trait Loci and Six Candidate Genes for Meat Color in Pigs. Front. Genet. 2022, 13, 768710. [Google Scholar] [CrossRef]
  12. Correa, J.A.; Faucitano, L.; Laforest, J.P.; Rivest, J.; Marcoux, M.; Gariépy, C. Effects of slaughter weight on carcass composition and meat quality in pigs of two different growth rates. Meat Sci. 2006, 72, 91–99. [Google Scholar] [CrossRef] [PubMed]
  13. Yan, X.; Hu, J.; Qi, J.; Tang, Q.; Li, J.; Bai, L.; Tang, B.; Ouyang, Q.; Wu, T.; He, H.; et al. Research Note: Integrated transcriptomic and metabolomic analysis reveals potential candidate genes and regulatory pathways associated with egg weight in ducks. Poult. Sci. 2023, 102, 102341. [Google Scholar] [CrossRef] [PubMed]
  14. Zha, C.; Liu, K.; Wu, J.; Li, P.; Hou, L.; Liu, H.; Huang, R.; Wu, W. Combining genome-wide association study based on low-coverage whole genome sequencing and transcriptome analysis to reveal the key candidate genes affecting meat color in pigs. Anim. Genet. 2023, 54, 295–306. [Google Scholar] [CrossRef]
  15. Jin, J.; Panicker, D.; Wang, Q.; Kim, M.J.; Liu, J.; Yin, J.L.; Wong, L.; Jang, I.C.; Chua, N.H.; Sarojam, R. Next generation sequencing unravels the biosynthetic ability of spearmint (Mentha spicata) peltate glandular trichomes through comparative transcriptomics. BMC Plant Biol. 2014, 14, 292. [Google Scholar] [CrossRef]
  16. Jin, J.; Kim, M.J.; Dhandapani, S.; Tjhang, J.G.; Yin, J.L.; Wong, L.; Sarojam, R.; Chua, N.H.; Jang, I.C. The floral transcriptome of ylang ylang (Cananga odorata var. fruticosa) uncovers biosynthetic pathways for volatile organic compounds and a multifunctional and novel sesquiterpene synthase. J. Exp. Bot. 2015, 66, 3959–3975. [Google Scholar] [CrossRef]
  17. Fumagalli, M.; Vieira, F.G.; Linderoth, T.; Nielsen, R. ngsTools: Methods for population genetics analyses from next-generation sequencing data. Bioinformatics 2014, 30, 1486–1487. [Google Scholar] [CrossRef]
  18. Shen, Z.; Lu, Y.; Bai, Y.; Li, J.; Wang, H.; Kou, D.; Li, Z.; Ma, Q.; Hu, J.; Bai, L.; et al. Transcriptome-metabolome reveals the molecular changes in meat production and quality in the hybrid populations of Sichuan white goose. Poult. Sci. 2024, 103, 103931. [Google Scholar] [CrossRef]
  19. Grabherr, M.G.; Haas, B.J.; Yassour, M.; Levin, J.Z.; Thompson, D.A.; Amit, I.; Adiconis, X.; Fan, L.; Raychowdhury, R.; Zeng, Q.; et al. Full-length transcriptome assembly from RNA-Seq data without a reference genome. Nat. Biotechnol. 2011, 29, 644–652. [Google Scholar] [CrossRef]
  20. Dunn, W.B.; Broadhurst, D.; Begley, P.; Zelena, E.; Francis-McIntyre, S.; Anderson, N.; Brown, M.; Knowles, J.D.; Halsall, A.; Haselden, J.N.; et al. Procedures for large-scale metabolic profiling of serum and plasma using gas chromatography and liquid chromatography coupled to mass spectrometry. Nat. Protoc. 2011, 6, 1060–1083. [Google Scholar] [CrossRef]
  21. Zhang, Z.; Du, H.; Yang, C.; Li, Q.; Qiu, M.; Song, X.; Yu, C.; Jiang, X.; Liu, L.; Hu, C.; et al. Comparative transcriptome analysis reveals regulators mediating breast muscle growth and development in three chicken breeds. Anim. Biotechnol. 2019, 30, 233–241. [Google Scholar] [CrossRef] [PubMed]
  22. Zelena, E.; Dunn, W.B.; Broadhurst, D.; Francis-McIntyre, S.; Carroll, K.M.; Begley, P.; O’Hagan, S.; Knowles, J.D.; Halsall, A.; Wilson, I.D.; et al. Development of a robust and repeatable UPLC-MS method for the long-term metabolomic study of human serum. Anal. Chem. 2009, 81, 1357–1364. [Google Scholar] [CrossRef] [PubMed]
  23. Kiss, B.; Gohlke, J.; Tonino, P.; Hourani, Z.; Kolb, J.; Strom, J.; Alekhina, O.; Smith, J.E., 3rd; Ottenheijm, C.; Gregorio, C.; et al. Nebulin and Lmod2 are critical for specifying thin-filament length in skeletal muscle. Sci. Adv. 2020, 6. [Google Scholar] [CrossRef] [PubMed]
  24. Li, D.; Pan, Z.; Zhang, K.; Yu, M.; Yu, D.; Lu, Y.; Wang, J.; Zhang, J.; Zhang, K.; Du, W. Identification of the Differentially Expressed Genes of Muscle Growth and Intramuscular Fat Metabolism in the Development Stage of Yellow Broilers. Genes 2020, 11, 244. [Google Scholar] [CrossRef]
  25. Ham, A.S.; Lin, S.; Tse, A.; Thürkauf, M.; Oliveri, F.; Ruegg, M.A. Single-nuclei sequencing of skeletal muscle reveals subsynaptic-specific transcripts involved in neuromuscular junction maintenance. bioRxiv 2024. [Google Scholar] [CrossRef]
  26. Elango, J.; Hou, C.; Bao, B.; Wang, S.; Maté Sánchez de Val, J.E.; Wenhui, W. The Molecular Interaction of Collagen with Cell Receptors for Biological Function. Polymers 2022, 14, 876. [Google Scholar] [CrossRef]
  27. Gao, X.; Zhao, D.; Wang, L.; Cui, Y.; Wang, S.; Lv, M.; Zang, F.; Dai, R. Proteomic Changes in Sarcoplasmic and Myofibrillar Proteins Associated with Color Stability of Ovine Muscle during Post-Mortem Storage. Foods 2021, 10, 2989. [Google Scholar] [CrossRef]
  28. Schilling, M.W.; Suman, S.P.; Zhang, X.; Nair, M.N.; Desai, M.A.; Cai, K.; Ciaramella, M.A.; Allen, P.J. Proteomic approach to characterize biochemistry of meat quality defects. Meat Sci. 2017, 132, 131–138. [Google Scholar] [CrossRef]
  29. Vasilaki, A.; Simpson, D.; McArdle, F.; McLean, L.; Beynon, R.J.; Van Remmen, H.; Richardson, A.G.; McArdle, A.; Faulkner, J.A.; Jackson, M.J. Formation of 3-nitrotyrosines in carbonic anhydrase III is a sensitive marker of oxidative stress in skeletal muscle. Proteom. Clin. Appl. 2007, 1, 362–372. [Google Scholar] [CrossRef]
  30. Wittenberg, J.B. Myoglobin-facilitated oxygen diffusion: Role of myoglobin in oxygen entry into muscle. Physiol. Rev. 1970, 50, 559–636. [Google Scholar] [CrossRef]
  31. Ramanathan, R.; Hunt, M.C.; Mancini, R.A.; Nair, M.N.; Denzer, M.L.; Suman, S.P.; Mafi, G.G. Recent updates in meat color research: Integrating traditional and high-throughput approaches. Meat Muscle Biol. 2020, 4. [Google Scholar] [CrossRef]
  32. Lamas Bervejillo, M.; Ferreira, A.M. Understanding Peroxisome Proliferator-Activated Receptors: From the Structure to the Regulatory Actions on Metabolism. Adv. Exp. Med. Biol. 2019, 1127, 39–57. [Google Scholar] [CrossRef] [PubMed]
Figure 1. Technological route. Note: Cherry Valley ducks and Huai Fu ducks: the two different breeds of ducks used in the experiment. Feeding to 56 days of age: the ducks were fed until they reached 56 days of age. Meat color phenotype analysis: lab measurement: using a colorimeter to measure the L*, a*, b* values of the meat; RGB/HSB analysis: using image processing software (Photoshop) (Adobe Photoshop CC 2019) to analyze the RGB and HSB values of the meat color. Omics analysis: transcriptome sequencing: analyzing gene expression levels through transcriptome sequencing; non-targeted metabolome analysis: detecting and analyzing metabolites using non-targeted metabolome analysis.
Agriculture 15 01059 g001
Figure 2. General overview of transcriptomic and metabolomic data. (A,a) OPLS-DA score plots and comparison test plots for groups L-a*/b* and D-a*/b* in the transcriptomic analysis (X-axis represents the correlation coefficient between the original y variable and the comparison y variable; Y-axis represents the cumulative R2 and Q2 of the correlation coefficient); (B,b) metabolomics OPLS-DA analysis based on the cationic model for the L-a*/b* group and D-a*/b* group; (C,c) analysis of the metabolome of the L-a*/b* and D-a*/b* groups under the negative anion model.
Agriculture 15 01059 g002
Figure 3. Pectoral muscle transcriptome changes. (A) DEGs: blue represents down-regulation, and orange represents up-regulation. (B) GO/KEGG enrichment analysis results: In the KEGG bubble map, the red box marks the pathways related to fat metabolism, and the green box marks the pathways related to muscle growth and development. The horizontal coordinate represents the impact value associated with different enriched pathways, the vertical coordinate represents the enrichment pathway, and the dot size represents the number of corresponding genes on the pathway. The redder the color is, the smaller the p-value is. The greener the color is, the larger the p-value is. (C) Venn diagram, the intersection of differentially expressed genes in the four groups: The expression level of the shared differentially expressed genes in each group was compared. The orange represents ST13 and the blue represents LOC101801612, and the height of the columns is proportional to the expression level.
Agriculture 15 01059 g003
Figure 4. Pectoral muscle metabolome changes. (A) Differential metabolite profiles among groups: blue represents up-regulation, and orange represents down-regulation. (B) Bar chart of KEGG enrichment analysis among groups: horizontal coordinates represent impact values enriched into different metabolic pathways, and the vertical coordinates represent metabolic pathways. Numbers indicate the corresponding number of metabolites in the pathway. The color correlates with the p-value. The redder the color is, the smaller the p-value is, and the greener the color is, the larger the p-value is. (C) Bubble plot of KEGG enrichment analysis of all differential metabolites. Wayne’s plot, the intersection of differential metabolites in each group.
Agriculture 15 01059 g004
Figure 5. Combined transcriptome and metabolome analysis. (A) KEGG co-enrichment pathway: purple represents genes, blue represents metabolites, the red dashed line indicates p = 0.01, and the green dashed line indicates p = 0.05. (B) In the association and chord diagram, the lower half of the fan nodes represent genes, the upper half of the fan nodes represent metabolites, the orbitals between the fan nodes represent the interactions between the genes and the metabolites or their association, and the thickness and color of the tracks reflect the strength and nature of the association (positive/negative correlation). (C) Oxidative phosphorylation metabolic pathway and CA3 association flow chart.
Agriculture 15 01059 g005
Table 1. Comparison of meat color between CV group and HF group.
Index/GroupCVHFp-Value
R75.86 ± 21.8762.54 ± 21.260.0908
G51.45 ± 17.8339.31 ± 130.0356 *
B149.91 ± 15.7348.36 ± 14.570.7745
H118.88 ± 149.75126.2 ± 166.210.8967
S36.93 ± 5.1336.68 ± 4.820.888
B229.78 ± 8.5329.11 ± 7.670.8189
L*41.3 ± 3.4641.22 ± 2.380.938
a*14.58 ± 2.2813.35 ± 1.480.0803
b*5.04 ± 1.633.71 ± 1.230.0138 *
IMF (%)4.46 ± 0.484.18 ± 0.520.1308
Note: Comparison of meat color between CV group and HF group: the label “*” represents a p-value < 0.05.
Table 2. Comparison of meat color between sexes in CV group and HF group.
Index/GroupCV-MCV-FHF-MHF-F
R89.7 ± 23.51 Ab62.03 ± 5.9 B68.8 ± 26.88 a56.23 ± 12.43 B
G63.03 ± 18.98 B39.88 ± 3.85 A41.73 ± 16.24 A36.9 ± 9.21 A
B159.4 ± 17.77 a40.43 ± 2.96 b48.9 ± 17.1847.83 ± 12.61
H41.8 ± 62.9195.95 ± 174.7117.88 ± 162.86134.53 ± 180.33
S35.7 ± 5.7638.15 ± 4.4437.95 ± 5.2735.4 ± 4.29
B235.15 ± 9.2 a24.4 ± 2.33 b29.65 ± 9.6428.58 ± 5.7
L*42.54 ± 3.9340.06 ± 2.5840.21 ± 1.4242.23 ± 2.79
a*14.57 ± 2.4814.59 ± 2.2414.04 ± 1.4912.65 ± 1.16
b*5.66 ± 1.72 Ab4.43 ± 1.373.98 ± 1.29 a3.43 ± 1.19 B
IMF (%)4.44 ± 0.664.48 ± 0.254.19 ± 0.474.17 ± 0.6
Note: Meat color comparison between different groups. R (red), G (green), and B1 (blue)—the intensity of the red, green, and blue components in meat color determining the hue and saturation. H (Hue)—the basic color tone of meat. S (saturation)—the purity or intensity of meat color; higher values indicate greater vividness. B2 (brightness)—a higher value indicates brighter meat. L* (lightness)—the brightness of the meat color; higher values indicate greater brightness. Value of a* (red/green chroma)—positive values lean towards red, while negative values lean towards green. b* (yellow/blue chroma)—positive values lean towards yellow, and negative values lean towards blue. IMF (%)—intramuscular fat content. AB/ab represents the significant difference between different groups; the superscript AB represents a significant difference at 0.001, and the superscript ab represents a significant difference at 0.05.
Disclaimer/Publisher’s Note: The statements, opinions and data contained in all publications are solely those of the individual author(s) and contributor(s) and not of MDPI and/or the editor(s). MDPI and/or the editor(s) disclaim responsibility for any injury to people or property resulting from any ideas, methods, instructions or products referred to in the content.

