Article

Calibration and Experimental Validation of Discrete Element Parameters for Long-Grain Rice with Different Moisture Contents Based on Repose Angle

1
College of Engineering, Heilongjiang Bayi Agricultural University, Daqing 163319, China
2
Key Laboratory of Intelligent Agricultural Machinery Equipment in Heilongjiang Province, Daqing 163319, China
*
Author to whom correspondence should be addressed.
Agriculture 2025, 15(10), 1058; https://doi.org/10.3390/agriculture15101058
Submission received: 12 April 2025 / Revised: 8 May 2025 / Accepted: 12 May 2025 / Published: 14 May 2025
(This article belongs to the Section Agricultural Technology)

Abstract

:
The accurate determination of discrete element parameters is crucial for ensuring reliable results in simulating the critical post-harvest stages of rice grain (processing, transportation, and storage) with different moisture contents. To determine the discrete element parameters, a physical model of rice grain was constructed by the multi-sphere (MS) modeling approach. Using the repose angle as the evaluation index, the discrete element parameters of rice grain were calibrated and optimized through the Plackett–Burman (PB) test, the steepest climbing test, and the Box–Behnken (BB) test using EDEM software. A moisture content–significance discrete element parameters model was further developed based on a moisture content–repose angle model ( R 2 = 0.992) and a repose angle–significance discrete element parameters model ( R 2 = 0.970). The calibration results showed that the relative error between the simulated and actual repose angle did not exceed 3.52%. Meanwhile, the cylinder lifting method and unloading mass flow rate verification were performed. And the results showed that the relative errors of the repose angle and mass flow rate of rice grain did not exceed 2.09% and 7.72%, respectively. The study provides a general and reliable method for determining the parameters of discrete element method simulation for rice grain with different moisture contents.

1. Introduction

As one of the world’s most productive food crops, rice grain is vital to may countries’ economic development and food security [1]. In the key stages of rice grain processing, storage, and transportation, analyzing the movement characteristics and processing behavior of rice grains helps to reveal their dynamic mechanisms under various working conditions. This analysis also provides essential theoretical support and data for the design and optimization of efficient grain-processing systems [2,3,4]. It also contributes significantly to food preservation and loss reduction. However, since the mechanical equipment is typically enclosed, directly observing the complete movement process of paddy is difficult, making comprehensive analysis through mathematical modeling challenging. Recently, simulation technology has been widely applied in the agricultural field. The discrete element method (DEM) provides a practical approach to simulating and analyzing the interaction mechanisms between rice grains, as well as between rice grains and mechanical components [5,6,7].
By acquiring the intrinsic and contact parameters of a material, the accurate calibration of discrete component parameters enhances simulation accuracy, bringing the results closer to the actual operating process. The parameter calibration process is mainly performed through EDEM software [8]. Chen et al. used EDEM software to calibrate the discrete element parameters of pepper seeds, with the angle of repose as the dependent variable [9]. Chen et al. developed a polyhedral discrete element model for maize kernels, calibrated its parameters using the oblique test method, and validated the results by measuring the angle of repose with the cylinder lifting method [10]. Han et al. used an MS model to construct a rice grain representation to calibrate the discrete element parameters of the particles, and the flow behaviors were analyzed [11,12]. Zhang et al. established a rice grain model based on the size enlargement method, which reduced the simulation computation time [13]. In addition, the moisture content of the material significantly affects the variation in the discrete elemental parameters. The discrete element parameters calibrated at a single moisture content might not accurately represent the interaction mechanisms between the particles and mechanical components, as well as between particles with different moisture contents [14].
Based on the material repose angle test, Tian et al. successfully calibrated the contact parameters of wood flour and established a model describing the relationship between its moisture content and repose angle [15]. Bai et al. performed the calibration and validation of the discrete element parameters for brown rice across various moisture content levels [16]. Similarly, Wang et al. proposed a model to explain the relationship between moisture content and the discrete element parameters of sheep manure [17]. Wu et al. developed a correlation model between the moisture content of cotton stalk particles and their contact parameters [18]. This model improved simulation accuracy during mechanized operations. Liu et al. established a predictive model linking the moisture content of organic fertilizer particles with discrete element parameters, thereby providing a reliable method for parameter calibration in numerical simulations [19]. Wang et al. calibrated the key contact parameters of alfalfa pellets, which further expanded the applicability of simulation to biomass materials under various moisture conditions [20]. Similarly, Ben et al. proposed a coupled model that described the relationships among the moisture content, angle of repose, and contact parameters of gluten pellets [21]. This approach offers an effective method for the DEM modeling of high-moisture particulate materials. Collectively, these studies indicate that developing moisture-dependent contact parameter models is of great significance for enhancing the accuracy and applicability of discrete element simulations of granular materials. Changes in the moisture content of rice grains during harvesting, processing, storage, and transportation affect their physical properties, including particle velocity, displacement, and the pore structure of the grain layer [22,23]. However, most existing studies on calibrating the discrete element parameters of rice grains are based on grains with a single moisture content. There is a notable lack of studies specifically focused on the calibration of parameters for rice grains with different moisture contents.
Therefore, this study took rice grains with different moisture contents as its research object and the angle of repose as its response variable. The PB test, steepest climbing test, and BB test were sequentially conducted using Design-Expert software to establish a mathematical model describing the relationship between the moisture content and discrete element parameters of rice grains. The accuracy of the model was validated through DEM simulations and physical experiments, ensuring a reliable contact parameter model for simulating rice grains.

2. Materials and Methods

2.1. Test Material and Particle Size

Long-grain rice has been widely used in various types of discrete element simulation studies, whose models can effectively reflect the dynamic behavior of rice grains during the flow process [3,24]. In this study, long-grain japonica rice (Daohuaxiang 2) was selected as the test material for repose angle calibration. It has typical elliptical characteristics and is widely planted.

2.1.1. Moisture Content of Rice Grain

The moisture content of harvested rice grains typically ranges from 16% to 25%, and it is usually reduced to less than 14.5% for storage purposes [25,26,27]. All references to rice grain moisture content in this study were based on the wet basis moisture content. The rice grains were cleaned to remove impurities, and the rice grains’ moisture contents were measured by the drying method. The average initial moisture content of the rice grains was 13.75%. Long-grain rice samples underwent moisture conditioning by natural drying and humidification. Five sets of rice grains were tested for their repose angle, with moisture contents of 13.75, 16.36, 19.10, 22.12, and 24.34%, respectively. The long-grain rice moisture conditioning was calculated as in Equation (1).
G w = G 1 ( M 2 M 1 ) 1 M 2
where G w is the mass of water to be added for preparing the long-grain rice sample, kg; G 1 is the mass of the long-grain rice sample, kg; M 1 represents the initial moisture content of the long-grain rice, %; and M 2 represents the target moisture content, %.

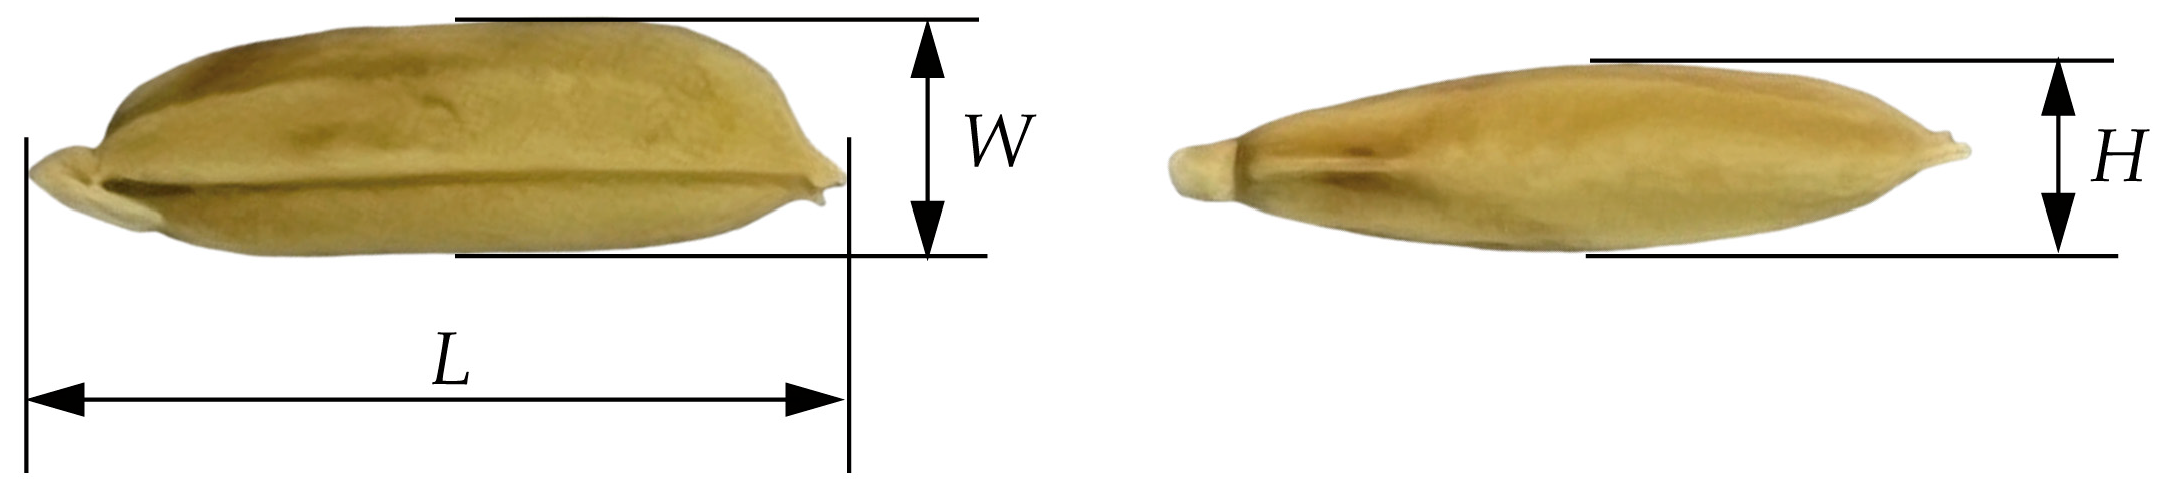
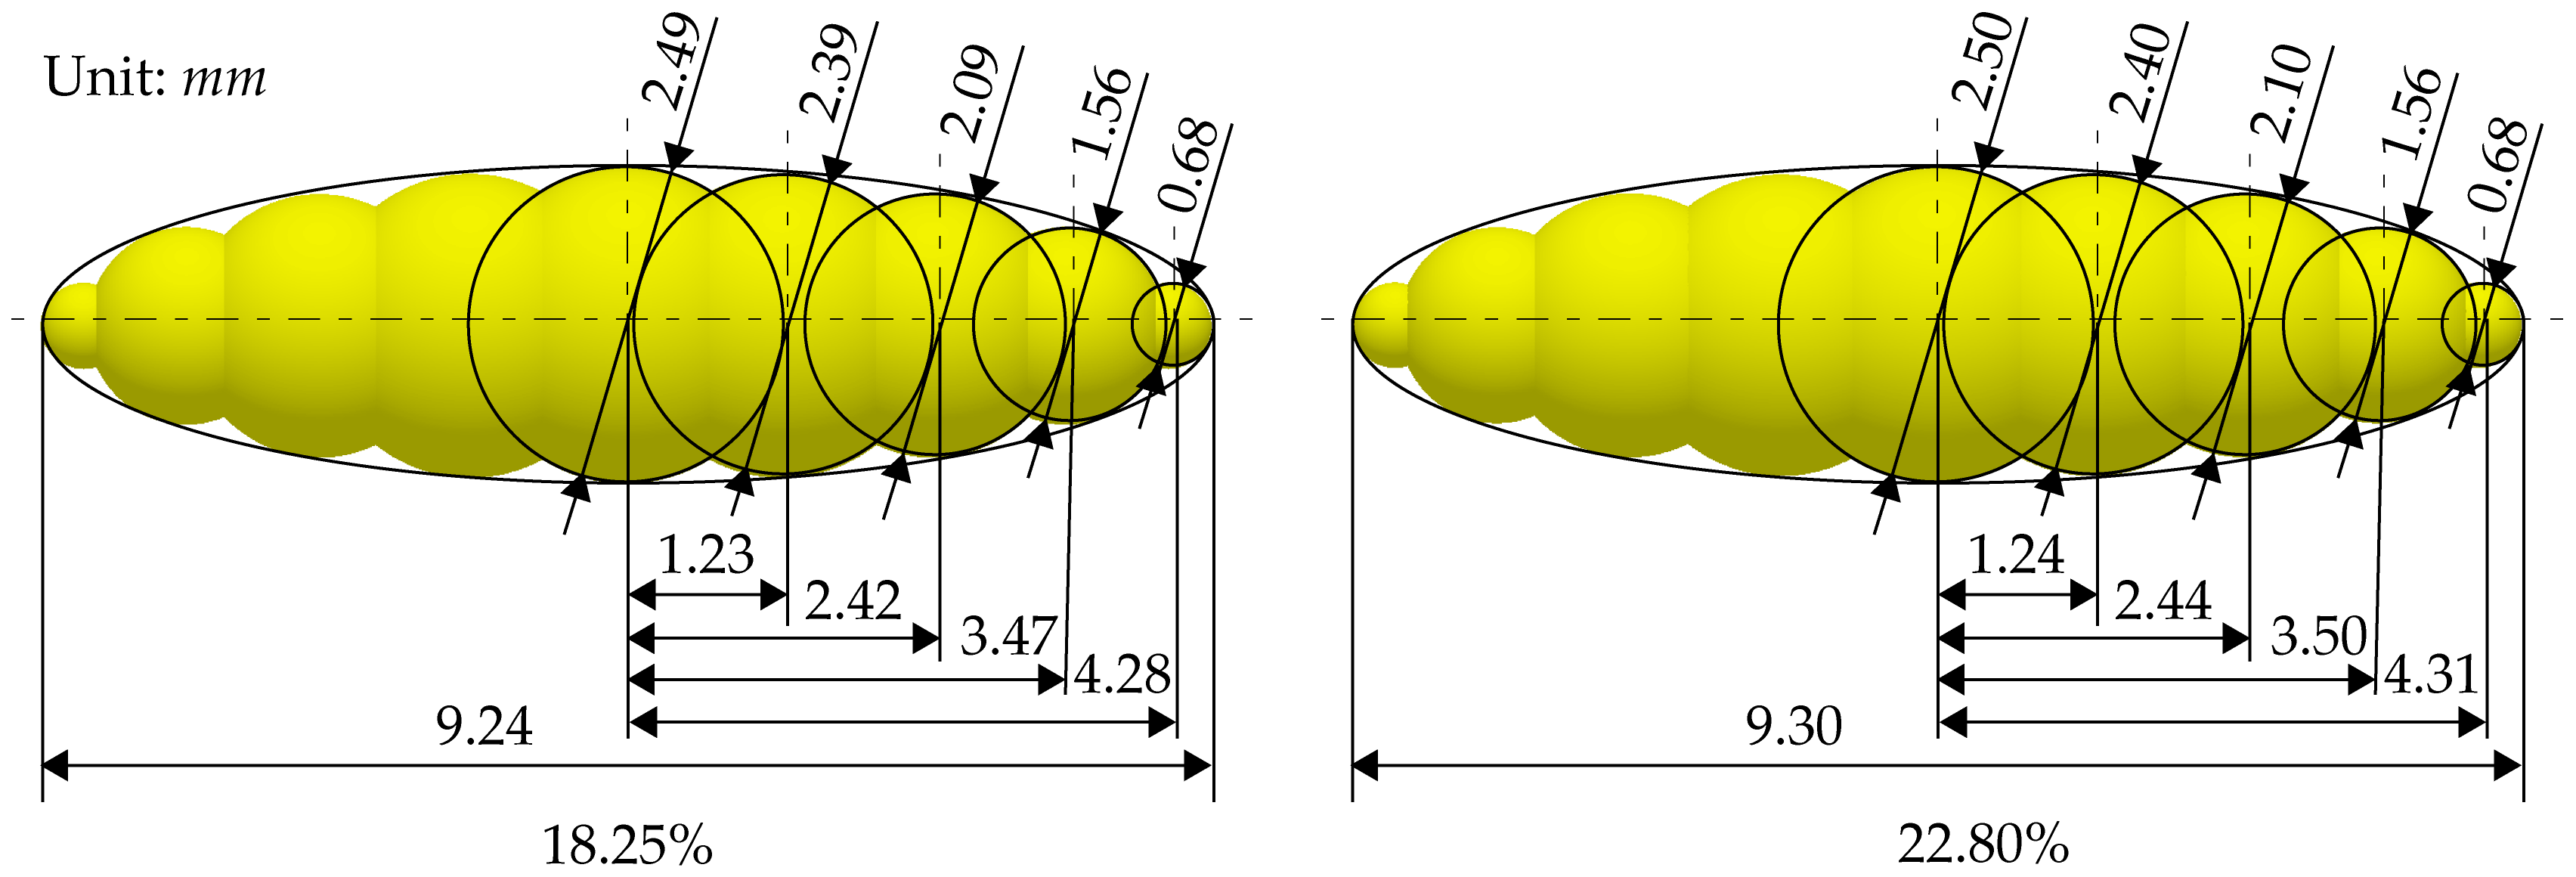
2.1.2. Rice Grain Size

At each moisture level, the length (L), width (W), and thickness (H) of the rice grains were measured using digital vernier calipers (0.01 mm) by randomly selecting 200 rice grains, as shown in Figure 1. The dimensions of each grain were measured three times, and the final results were taken as the average of the grain dimensions at each moisture content. In this case, the length, width, and thickness of the long-grain rice ranged from 9.20 to 9.31 mm, 2.84 to 2.87 mm, and 2.11 to 2.14 mm, respectively, within the moisture content range of 13.75% to 24.34%.

2.2. DEM Modeling and Numerical Methods for Rice Grain Particles

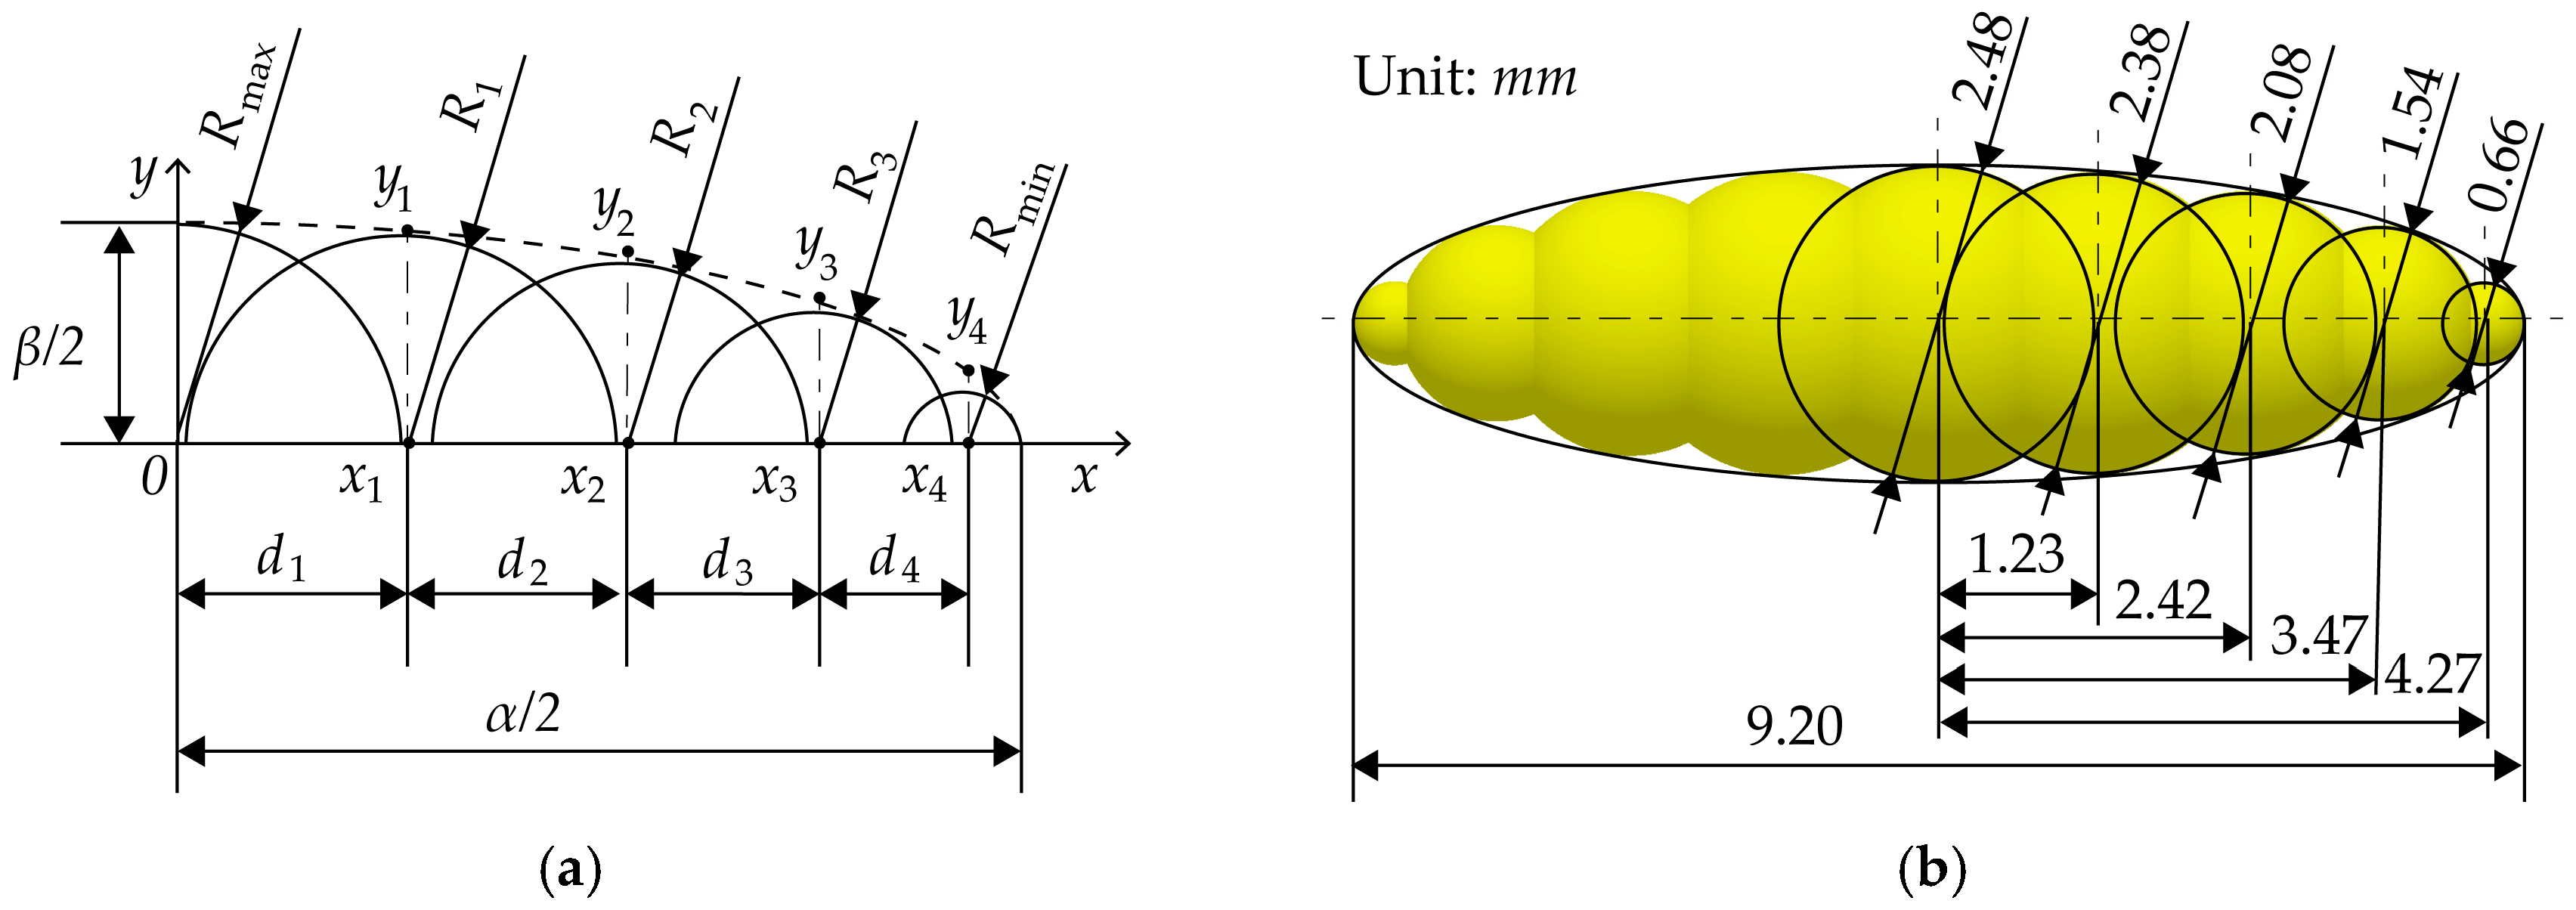
2.2.1. DEM Modeling of Rice Grain Particles

In terms of obtaining the geometric shape of rice grain particles, some studies have employed 3D laser scanning technologies and other techniques to accurately capture the particles’ profiles, enabling high-precision modeling [28]. However, this approach requires representing the particle contours with dozens of spheres in discrete element modeling, which significantly increases the computational load in large-scale simulations. To simplify the model, rice grain particles are typically modeled as axisymmetric ellipsoids. The MS method was used in this study to construct a particle model for long-grain rice [29,30]. In the rice grain DEM model, the long-axis value (α) was defined as the average rice grain (L) of the rice particle, while the short-axis value (β) was calculated based on the width (W) and thickness (H), as shown in Equation (2) [31].
β = W + H 2
where β is the short-axis value of the long-grain rice DEM model, mm; W is the average of the measured widths of the long-grain rice, mm; and H is the average value of the measured rice grain thickness, mm.
Based on the approach proposed by Markauskas et al., an MS model of rice grain was developed by systematically arranging multiple spheres of varying diameters within an ellipsoidal envelope [30]. To achieve a balance between simulation accuracy and computational efficiency, each rice grain was modeled using nine overlapping spheres, which adequately replicate the geometric shape and dynamic behavior of real rice grain particles [11]. The modeling process began by simplifying the 3D ellipsoid filling problem to a 2D elliptical plane, as shown in Figure 2a. The radius Rmin of the smallest inscribed tangent circle within the ellipse was determined using Equation (3). Then, by incorporating Equations (4) and (5), along with the standard form of the ellipsoid equation, the parameters d1d4 were sequentially calculated to locate the centroid coordinates of each internal sphere [30]. Subsequently, the variation in the radius of the tangent circles at different positions within the ellipse was further examined using CAXA CAD 2022 software. The radius of the inscribed circle at different positions within the ellipsoid was recorded. This provided data support for analyzing the filling behavior of long-grain rice at various moisture contents. Finally, the MS model of the rice grain was reconstructed in EDEM 2022 software based on the obtained parameters.
R m i n = β 2 2 α
k = 1 n d k = α 2 R m i n
d k + 1 = d k y k ( x k ) y k - 1 ( x k - 1 )
where R m i n is the radius Rmin of the smallest inscribed tangent circle within the ellipse, mm; d k is the center-to-center distance between the filling spheres within the ellipse, mm; x k is the center coordinate of the filled circle within the ellipse, mm; and y k is the point on the ellipse, mm.
The effect of particle size variations due to moisture content differences was not considered in the construction of the DEM model. In this study, rice grain modeling was conducted using rice grains with a moisture content of 13.75%. The long and short axes of the DEM model were 9.20 mm and 2.48 mm, respectively. The rice grain DEM model is shown in Figure 2b.

2.2.2. The Numerical Method

It was assumed that there was no cohesion or liquid bridge force between the rice grains [3,32]. Therefore, the rice grains were considered ideal granular materials. To enhance computational efficiency, the no-slip Hertz–Mindlin contact model was selected for this study [29]. The DEM simulations were conducted using the commercial EDEM 2022 software on a personal computer equipped with an Intel Xeon E5-2684 v4 CPU, 64 GB of RAM (Intel Corporation, Santa Clara, CA, USA), and an NVIDIA RTX 3090 GPU, 24 GB VRAM (NVIDIA Corporation, Santa Clara, CA, USA) running Windows 10. The mass of the long-grain rice and the lifting velocity of the cylinder were kept identical in both the simulation and the physical tests to ensure consistency. The cylinder contained rice grain with a total mass of 100 g. The rice grain generation rate was set to 20 g/s, and the time step was defined as 25% of the Rayleigh time step. After the rice particles stabilized in the cylinder, the cylinder began linear motion in the positive z-axis direction at 6 s. At the same time, the simulation run time was set to 8.2 s based on the cylinder’s lift velocity and the need for the particle heap to reach a steady state.

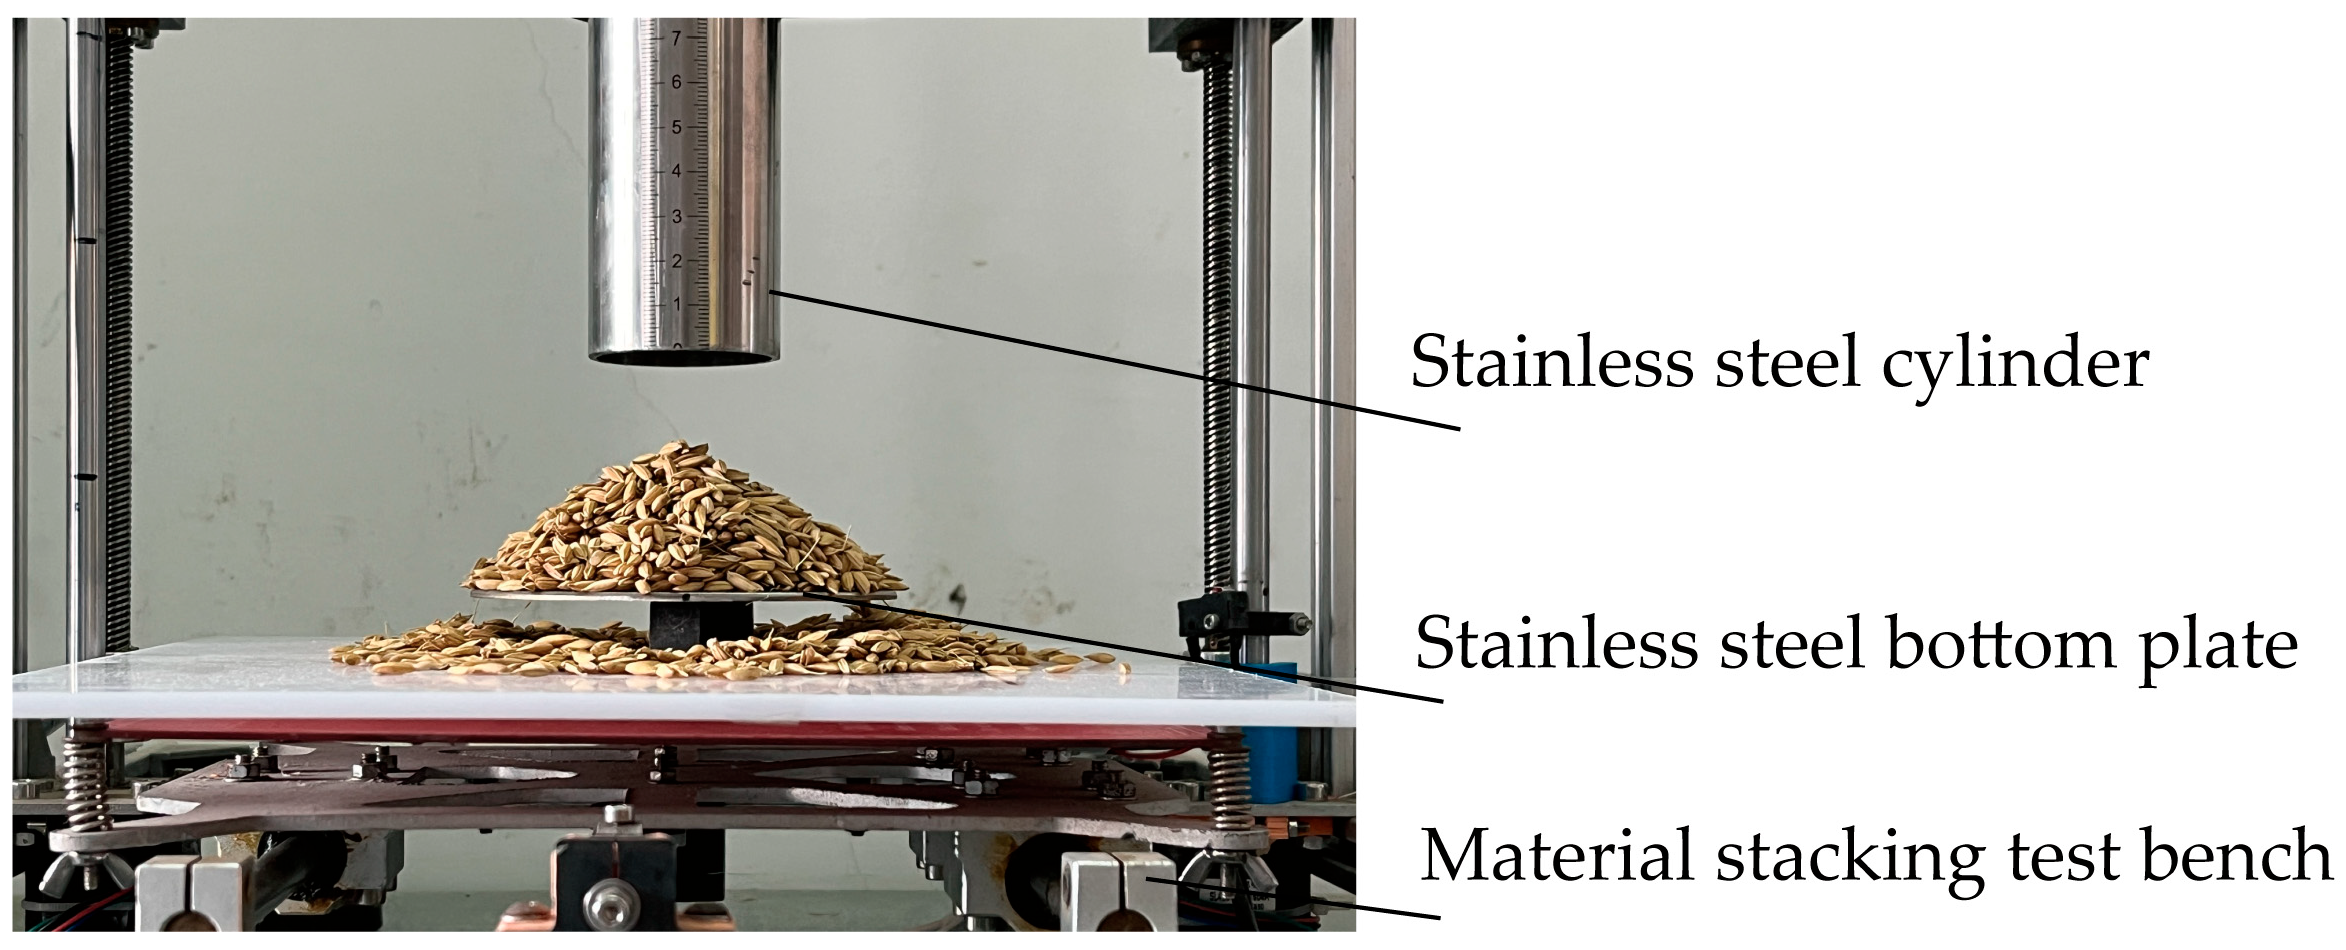
2.3. Repose Angle Test Based on Cylinder Lifting Method

The repose angle is an important response variable that reflects the friction and flow properties of material particles and is widely used for calibrating discrete element parameters. In this study, the repose angle at different moisture contents was measured using the cylinder lifting method. The diameter of the cylinder was determined based on the particle size of the long-grain rice to be measured. Specifically, the cylinder diameter should be 4 to 5 times larger than the maximum particle size [33]. In this study, within the tested moisture content range, the maximum average value of the rice grains was 9.31 mm. Therefore, the cylinder diameter was set to 40 mm. The actual physical test setup is shown in Figure 3.
The cylinder was lifted at a velocity of 0.05 m/s, enabling the grains to form a stable pile on a 50 mm diameter circular steel plate [11]. To minimize the impact of particle irregularity and local stacking variations during the stacking test of the long-grain rice, the repose angles were measured separately from the front and side views of the long-grain rice heap. In each cylinder lifting test, the front and side images of the rice grain pile were captured using a camera to comprehensively obtain the geometric shape of the pile. The collected images were then processed through image segmentation. As a result, four segmented images of the repose angle were obtained for each test, which supported the extraction and analysis of the rice grain pile′s contour features. Meanwhile, the images were binarized using MATLAB R2019b software, and the contours of the rice grain heap were fitted linearly [13]. The repose angles of the long-grain rice heap in the front and side views were calculated separately, and their average was taken as the final result for each test. The repose angle test for long-grain rice at each moisture content was repeated five times. The process of contour line extraction for the rice grain heap is shown in Figure 4. The repose angle θ was determined according to Equation (6) [11].
θ = arctan K × 180 ° π
where K represents the slope value of the linear fit line.

2.4. Calibration Test Method for DEM Simulation Parameters of Rice Grains

2.4.1. PB Test

Critical parameters were effectively screened using the PB test design available in Design Expert 8.0.6 software [34]. The test was designed with nine actual physical parameters ( X 1 X 9 ) and two dummy parameters ( X 10 , X 11 ), using the repose angle as the response variable. Reference values of the intrinsic and contact parameters of rice grains from experimental measurements and the literature were used, and the range of experimental parameters was appropriately extended [13,28,33,35,36]. The maximum and minimum values of each parameter were defined as the high level and low level, respectively. In addition, the experiment generated a total of 15 sets of simulation tests, with each test repeated five times. The list of PB test parameters is shown in Table 1. The test device was made of stainless steel, with a density, Poisson’s ratio, and shear modulus of 8.0 × 10³ kg/m3, 0.29, and 7.5 × 10⁴ MPa, respectively.

2.4.2. Steepest Climbing Test

To refine the range of critical parameter values further, the PB test results were used to design a steepest climbing test. During the test, the values of the parameters that had significant effects on the repose angle of long-grain rice were gradually increased, while those with weaker effects were kept at intermediate levels [37].

2.4.3. BB Test

Similarly, the repose angle was selected as the test index. Based on the results of the steepest climbing test, further BB tests were performed. The significance test parameters were set at three levels: high (+1), medium (0), and low (−1), while the values of the non-significant test parameters were kept consistent with those used in the steepest climb test. Each test was repeated five times, and the average value was recorded. Based on the experimental results, a model was developed to relate the significance parameters and the repose angle of long-grain rice at different moisture contents.

2.5. Validation Test

Firstly, a repose angle validation test for rice grain was conducted using the cylinder lifting method. Additionally, long-grain rice samples with moisture contents of 14.50%, 18.25%, and 22.80% were prepared through moisture conditioning for the validation tests. Meanwhile, the effect of variations in rice grain size due to moisture changes on the precision of parameters was assessed through validation tests. Based on rice grain size measurements and the MS modeling approach, rice grain discrete element models with moisture contents of 18.25% and 22.80% were constructed, as shown in Figure 5. When the moisture content of long-grain rice was 14.50% and 13.75%, respectively, the grain size remained essentially unchanged. Therefore, the model for rice grains with moisture contents of 13.75% could be used for modeling rice grains with moisture contents of 14.50%.
In addition, an engineering validation of the unloading mass flow rate was performed, as shown in Figure 6. Comparing the unloaded mass flow rates provided a means to evaluate the effectiveness of DEM simulation in practical applications [38]. The surface of the grain heap in the hopper was maintained flat. The unloading device was operated continuously at 10, 20, and 30 r/min during both the simulation and actual physical tests. The mass of rice grains in the collecting box was measured after 5 r of continuous unloading, and the unloading rate was calculated. Each test was repeated three times, and the average value was recorded. A comparison between the actual and simulated results was made to evaluate the accuracy of the simulation. The unloading mass flow rate value was calculated as in Equation (7).
Q = m r T
where Q is the unloading mass flow rate of long-grain rice, g/s; m r is the mass of long-grain rice in the collecting box, g; and T is the continuous unloading time, s.

3. Results and Discussion

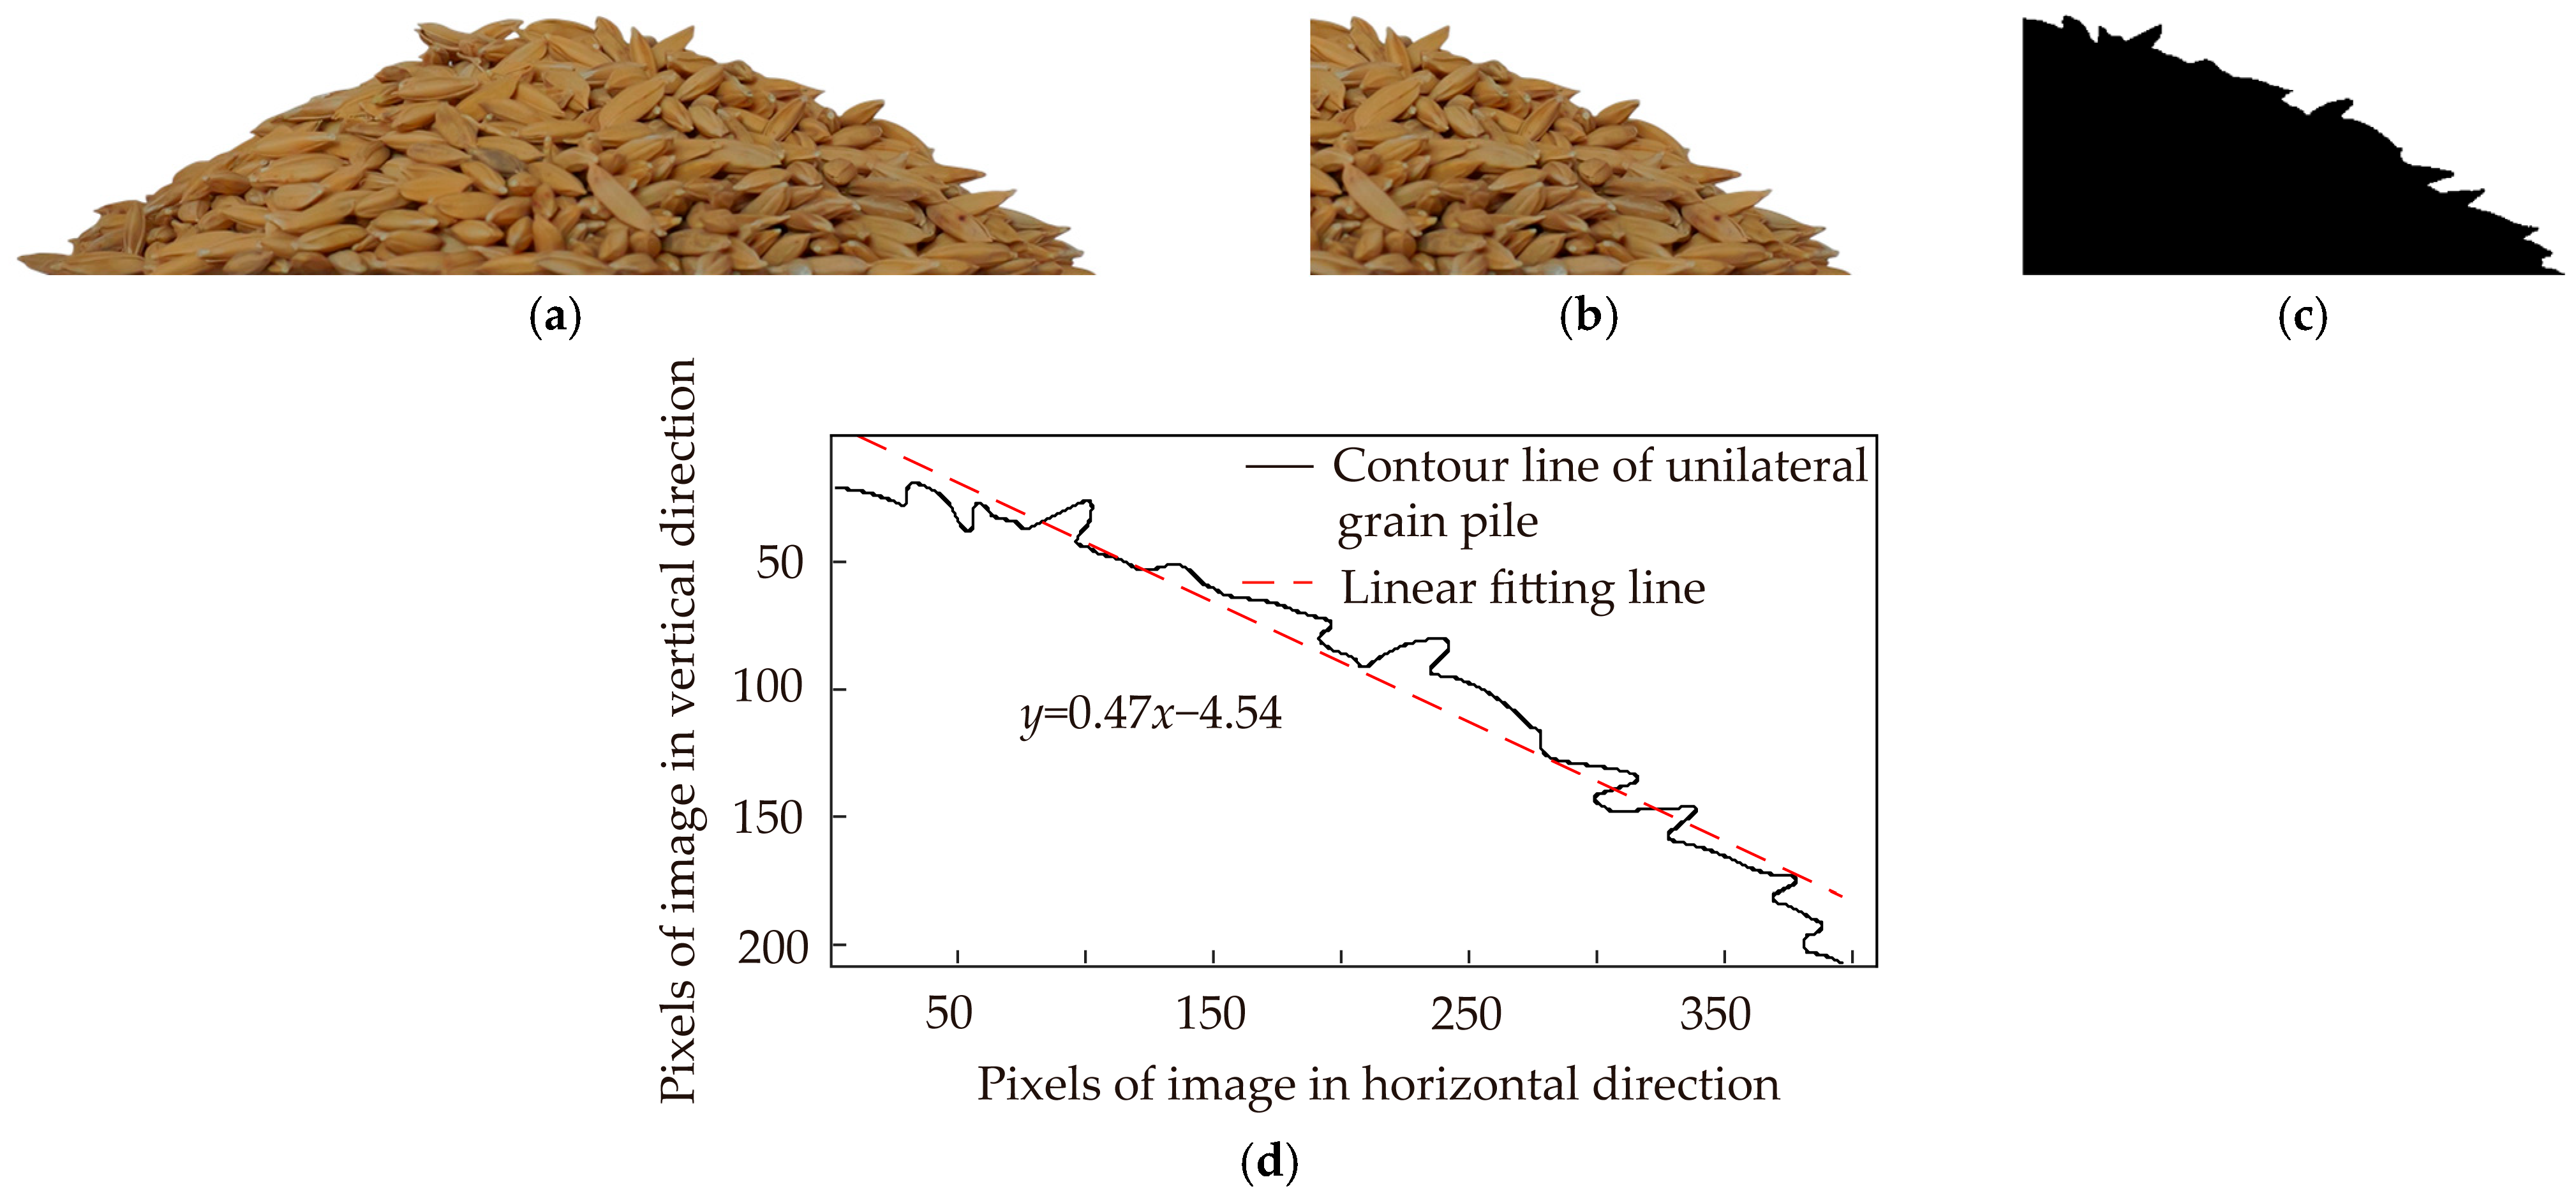
3.1. The Results and Analysis of the Repose Angle Physics Test

The results of the tests at different moisture contents are shown in Figure 7. Meanwhile, a fitted equation describing the relationship between the repose angle and the moisture content of rice grain was obtained, as shown in Equation (8).
θ 1 = 0.00834 x 3 0.471 x 2 + 9.0903 x 32.939
where x is the moisture content of the long-grain rice, %.
As shown in Figure 7, the regression model exhibits a strong correlation with the actual data ( R 2 = 0.992). The fitted curve accurately represents the data trend, indicating that the equation was suitable for predicting the repose angle. The angle of inclination increased with the rise in moisture content of long-grain rice grains. At low moisture contents, the surface of the long-grain rice was dry. The contact force between the grains was primarily governed by friction, which was influenced by surface characteristics and roughness [39]. In this state, the rice grains exhibited good fluidity. The repose angle increased by 4.98° as the moisture content of the long-grain rice rose from 13.75% to 24.34%. As the moisture content gradually increased, the size and surface area of the long-grain rice slightly expanded. This likely increased the effective contact area, which in turn enhanced friction between grains, as well as between the grains and the steel plate surface [40]. In addition, the static coefficient of friction between the rice grains significantly increased with increasing moisture content. This inhibited the relative sliding of the rice grains, reduced their mobility, and led to an increase in the repose angle [40,41].

3.2. Discrete Element Parameter Calibration Test Results and Analysis

3.2.1. PB Test Results and Analysis

The PB test design and results for the repose angle are shown in Table 2.
The simulation results were analyzed using ANOVA in Design Expert 8.0.6 software, as shown in Table 3. Meanwhile, the significance of the variables in the PB test results was ranked [13]. The repose angle of long-grain rice was found to be significantly affected by X 5 , X 8 , and X 9 . Therefore, the significant parameters X 5 , X 8 , and X 9 were investigated through experiments to calibrate the discrete element parameters of rice grains at different moisture contents. Intermediate-level values were assigned to the non-significant parameters. As a result, the density, Poisson’s ratio, and Young’s modulus of the rice grain were 1200 kg/m3, 0.25, and 210 MPa, respectively. The coefficients of restitution and rolling friction for rice grain–steel were 0.44 and 0.05, while the coefficient of restitution for rice grain–rice grain was 0.4.

3.2.2. Steepest Climbing Test Results and Analysis

The test design and results are shown in Table 4. The results indicate that, as the values of the significance parameters X 5 , X 8 , and X 9 increase, the mean relative error first decreases and then increases with different moisture contents. Group 3 had the lowest mean relative error of 19.22%. Therefore, the parameter combination for Test 3 was selected as the intermediate level (0) in the BB test, while those for Test 2 and Test 4 were chosen as the low (−1) and high (+1) levels, respectively.

3.2.3. BB Test Results and Analysis

The BB test design and results are shown in Table 5. The regression models of X 5 , X 8 , and X 9 with the simulated repose angle at different moisture contents were established, as shown in Equation (9).
θ 2 = 87.17 X 5 + 39.573 X 8 + 328.14 X 9 + 19.36 X 5 X 8 386.364 X 5 X 9 + 65.741 X 8 X 9 78.781 X 5 2 40.508 X 8 2 837.969 X 9 2 12.801
The results of the ANOVA for the repose angle regression model of the simulated tests are shown in Table 6. The regression model for the repose angle of the long-grain rice was highly significant (p < 0.01). The effects of the independent variables X 5 , X 8 , and X 9 on the repose angle of rice grain were highly significant (p < 0.01). The lack-of-fit term had a p value of 0.0893, indicating that it was not significant (p > 0.05). The regression equation exhibited a good fit, indicating the reliability of the test and the practical predictive significance of the regression model ( R 2 = 0.970).
As shown in Table 6, the interaction term X 8 X 9 had a highly significant effect on the angle of repose, whereas X 5 X 8 and X 5 X 9 showed no significant effect. Response surface plots depicting the interaction between X 5 , X 8 , and X 9 on the repose angle of long-grain rice at different moisture contents are shown in Figure 8. As shown in Figure 8a, the repose angle of long-grain rice increased with the rise of X 5 and X 8 when X 9 was 0.07. Specifically, the repose angle was in the larger range of values when X 5 and X 8 were greater than 0.37 and 0.48, respectively. As shown in Figure 8b, the repose angle of the long-grain rice increased with the rise of X 5 and X 9 when X 8 was 0.48. The change in the value of X 9 had a more significant effect on the repose angle of rice grains than change in X 5 . Meanwhile, the repose angle was generally greater than 32° when X 5 took values between 0.26 and 0.48 and X 9 was greater than 0.07. As shown in Figure 8c, when the significance parameter X 5 was 0.37, and X 8 and X 9 were greater than 0.42 and 0.07, respectively, the repose angle value was larger for rice grain.

3.2.4. Validation of Repose Angle–Significant Discrete Element Parameter Model

The effects of X 5 , X 8 , and X 9 on the repose angle of long-grain rice were analyzed collectively. The parameter optimization module in Design-Expert 8.0.6 software was employed to match the target repose angle values obtained from the physical experiments. Subsequently, the parameter combinations whose simulation results were closest to the actual repose angle values and rice grain heap contours were selected as the final solutions. The optimal combinations of five groups of simulation parameters were obtained, and the results of the actual physical and simulated tests using the cylinder lifting method are shown in Table 7.
The results indicated an excellent correlation between the simulated and actual values, with the maximum relative error in the repose angle of rice grains being 3.52%, and a minimum relative error being 0.94%, while the average relative error was 1.94%. This demonstrates the precision of the combination of the significant parameters and the constructed model.

3.3. Moisture Content–Significant Discrete Element Parameter Model

The moisture content–significant parameter model was established based on the relationships between moisture content and repose angle, as well as between repose angle and the significant discrete element parameters. By setting θ 1 = θ 2 , the model was finalized, as shown in Equation (10).
θ 1 = 0.00834 x 3 0.471 x 2 + 9.0903 x 32.939 θ 2 = 87.17 X 5 + 39.573 X 8 + 328.14 X 9 + 19.36 X 5 X 8 386.364 X 5 X 9 + 65.741 X 8 X 9 78.781 X 5 2 40.508 X 8 2 837.969 X 9 2 12.801 θ 1 = θ 2
According to Equation (10), the corresponding repose angle of the rice grain was first determined based on moisture content. Then, target optimization was performed using Design-Expert software to obtain the optimal combination of discrete element parameters.

3.4. Validation of Moisture Content–Significant Discrete Element Parameter Model

3.4.1. Validation Test Based on Repose Angle of Rice Grain

Based on Equation (10), significant discrete element parameter combinations were obtained for long-grain rice grains with moisture contents of 14.50%, 18.25%, and 22.80%, respectively. The repose angle of long-grain rice under three sets of moisture content conditions were obtained from both actual physical and simulation tests, and the comparison results are shown in Figure 9.
The results are presented in Table 8. As shown in Table 8, the values of parameters X 5 , X 8 , and X 9 do not vary much with the moisture content of long-grain rice. Specifically, parameter X 8 remains nearly constant as the moisture content increases, while the angle of repose can be adjusted by modifying the values of X 5 and X 9 . Meanwhile, the discrete element parameter combinations for moisture contents of 18.25% and 22.80% align with the parameter combinations for 19.10% and 22.12% moisture content listed in Table 7. This was primarily due to the low variability in the repose angle for adjacent moisture contents. Therefore, the same combination of discrete element parameters can be applied within an acceptable error range. The simulated test values showed good agreement with the physical test measurements, demonstrating that the contours of the rice grain heaps were highly similar. The relative error between the physical and simulated test values for the repose angle of long-grain rice was less than or equal to 2.09% across all three sets of tests, with a mean value of 1.32%. This suggested that the discrete element parameters were highly accurate and remained applicable despite slight variations in particle size due to changes in moisture content.

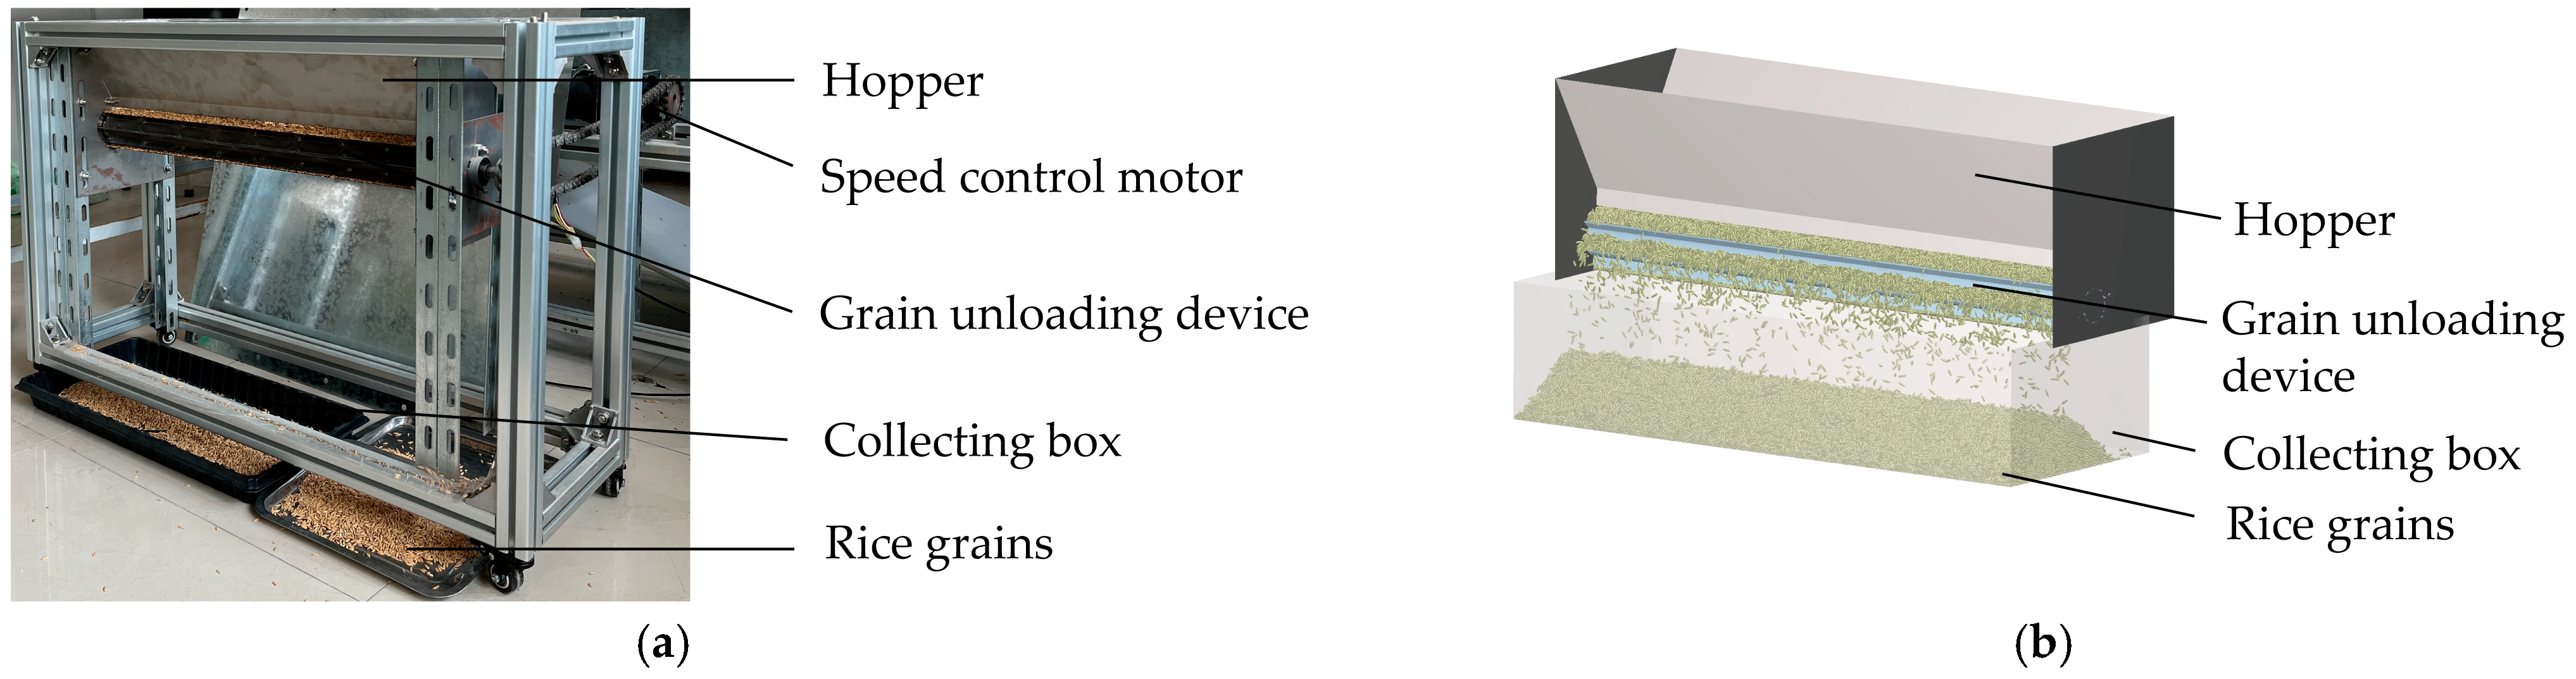
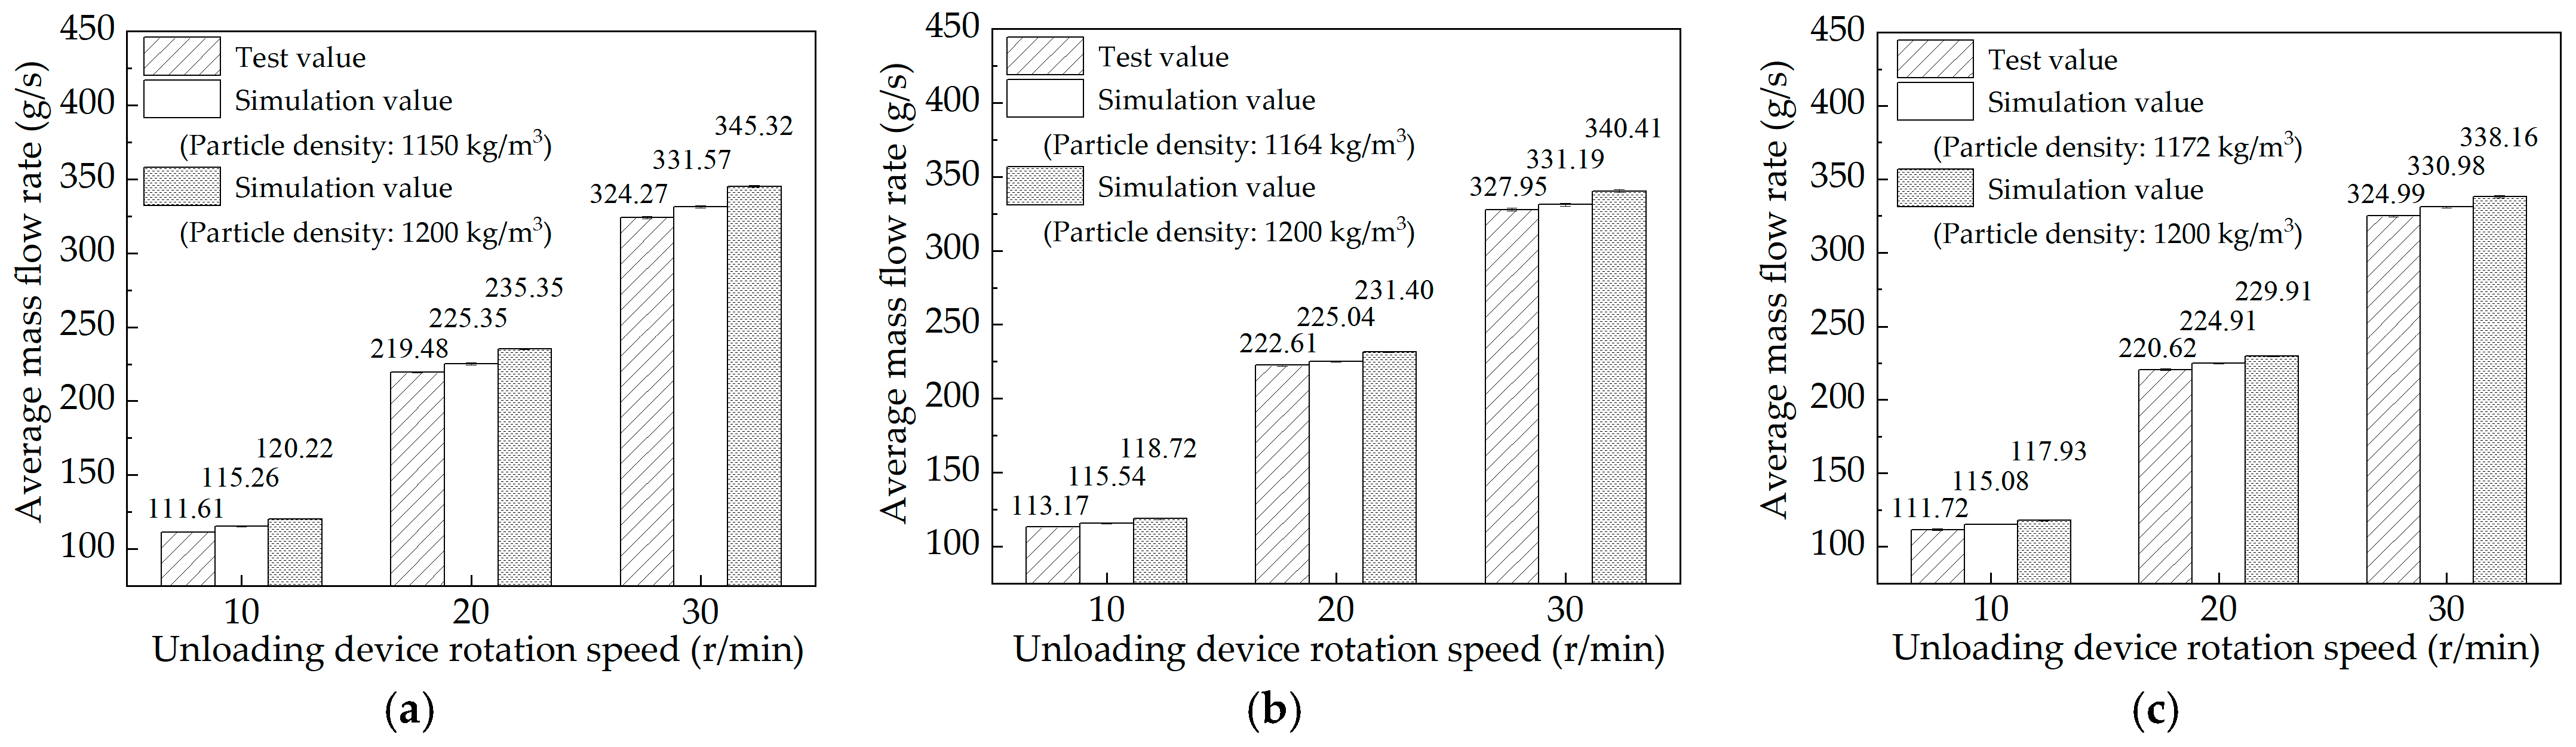
3.4.2. Validation Test for Unloading Mass Flow Rate

The variation in the unloading mass flow rate of rice grain at different rotational speeds and moisture contents in both actual and simulated tests is shown in Figure 10.
As shown in Figure 10, under the calibrated parameters, the average mass flow rates obtained from DEM simulations at different moisture contents were slightly higher than the experimental values, with maximum relative errors of 7.72%, 4.91%, and 5.57%, respectively. One possible explanation was that idealized rice grain particles with regular morphology were used in the DEM simulations, and the particle model size was kept constant. Inter-particle cohesion and liquid bridge forces were not considered, whereas these effects were present in the actual tests and could not be ignored. Moreover, the effect of rice particle density on the repose angle was not significant. However, the density of the rice grains was directly related to their mass. The unloaded mass flow rate was affected by changes in particle density during tests conducted at different moisture contents.
To reduce errors caused by differences in rice grain density, the true density was determined using the water displacement method [42]. The true density was measured to be 1150 kg/m3, 1164 kg/m3, and 1172 kg/m3 at 14.50%, 18.25%, and 22.80% moisture content, respectively. The relative errors between the repose angles from the actual and simulated tests at true density, obtained using the cylinder lifting method, were 0.24%, 0.33%, and 3.03%, respectively. Therefore, the unloading mass flow rate test simulation was carried out using true density conditions, and the results are shown in Figure 10. The maximum relative errors between the simulated and actual tests at different moisture contents were 3.27%, 2.10%, and 3.01%, respectively. The comparison showed that the relative error between the simulation and the actual test results was reduced when using the true density of rice grains.
In summary, it could be seen that the rice unloading mass flow rates at different rotational speeds showed good agreement, both at the calibrated density and at the true density. Since the maximum error between the simulated and actual test results was controlled within 10% under the calibrated parameters, the current simulation results achieved acceptable accuracy. It was shown that the established moisture content–significant discrete element parameter model demonstrated good applicability and reliability.
With the rapid advancement of machinery for rice processing and handling, accurately determining the contact parameters of rice grain and similar granular materials has become a critical task for understanding their interaction mechanisms with mechanical components. The calibrated parameters of granular materials vary depending on particle shape and physical properties. DEM parameters for grains such as rice, corn, and wheat can be reliably determined through material piling tests [10,13,43]. This study addresses the limited generalizability of DEM calibration methods when applied to long-grain rice grains with varying moisture contents. The proposed method offers a reliable and flexible framework for the accurate determination of DEM parameters specific to long-grain rice. Furthermore, this approach has been applied to other materials with different moisture levels, such as brown rice, wood powder, and sheep dung [15,16,17]. The results indicate that the dominant influencing factors differ among various particulate materials. Previous studies on brown rice at different moisture contents identified the static and rolling friction coefficients between particles as critical factors in parameter fitting. Similarly, in this study on rice grains, both coefficients were found to play a key role in the calibration process. The main difference lies in the use of JKR surface energy as one of the parameters influencing the angle of repose in the study of brown rice, where it was found to be a significant factor for parameter calibration. In previous studies, the maximum relative error between the simulated and actual tests’ repose angles was typically below 5%, which aligns with the calibration accuracy achieved in this work. Moreover, due to the substantial differences in particle size and geometry between long-grain and short-grain rice, their repose angles and contact parameters also differ significantly [44]. Consequently, future research should aim to enhance the adaptability of the model to various rice grain types, thereby improving its generalizability and expanding its practical applications.

4. Conclusions

In this study, the parameters of long-grain rice grains with different moisture contents were calibrated using the PB test, the steepest climbing test, and the BB response surface method. The main conclusions are as follows:
(1)
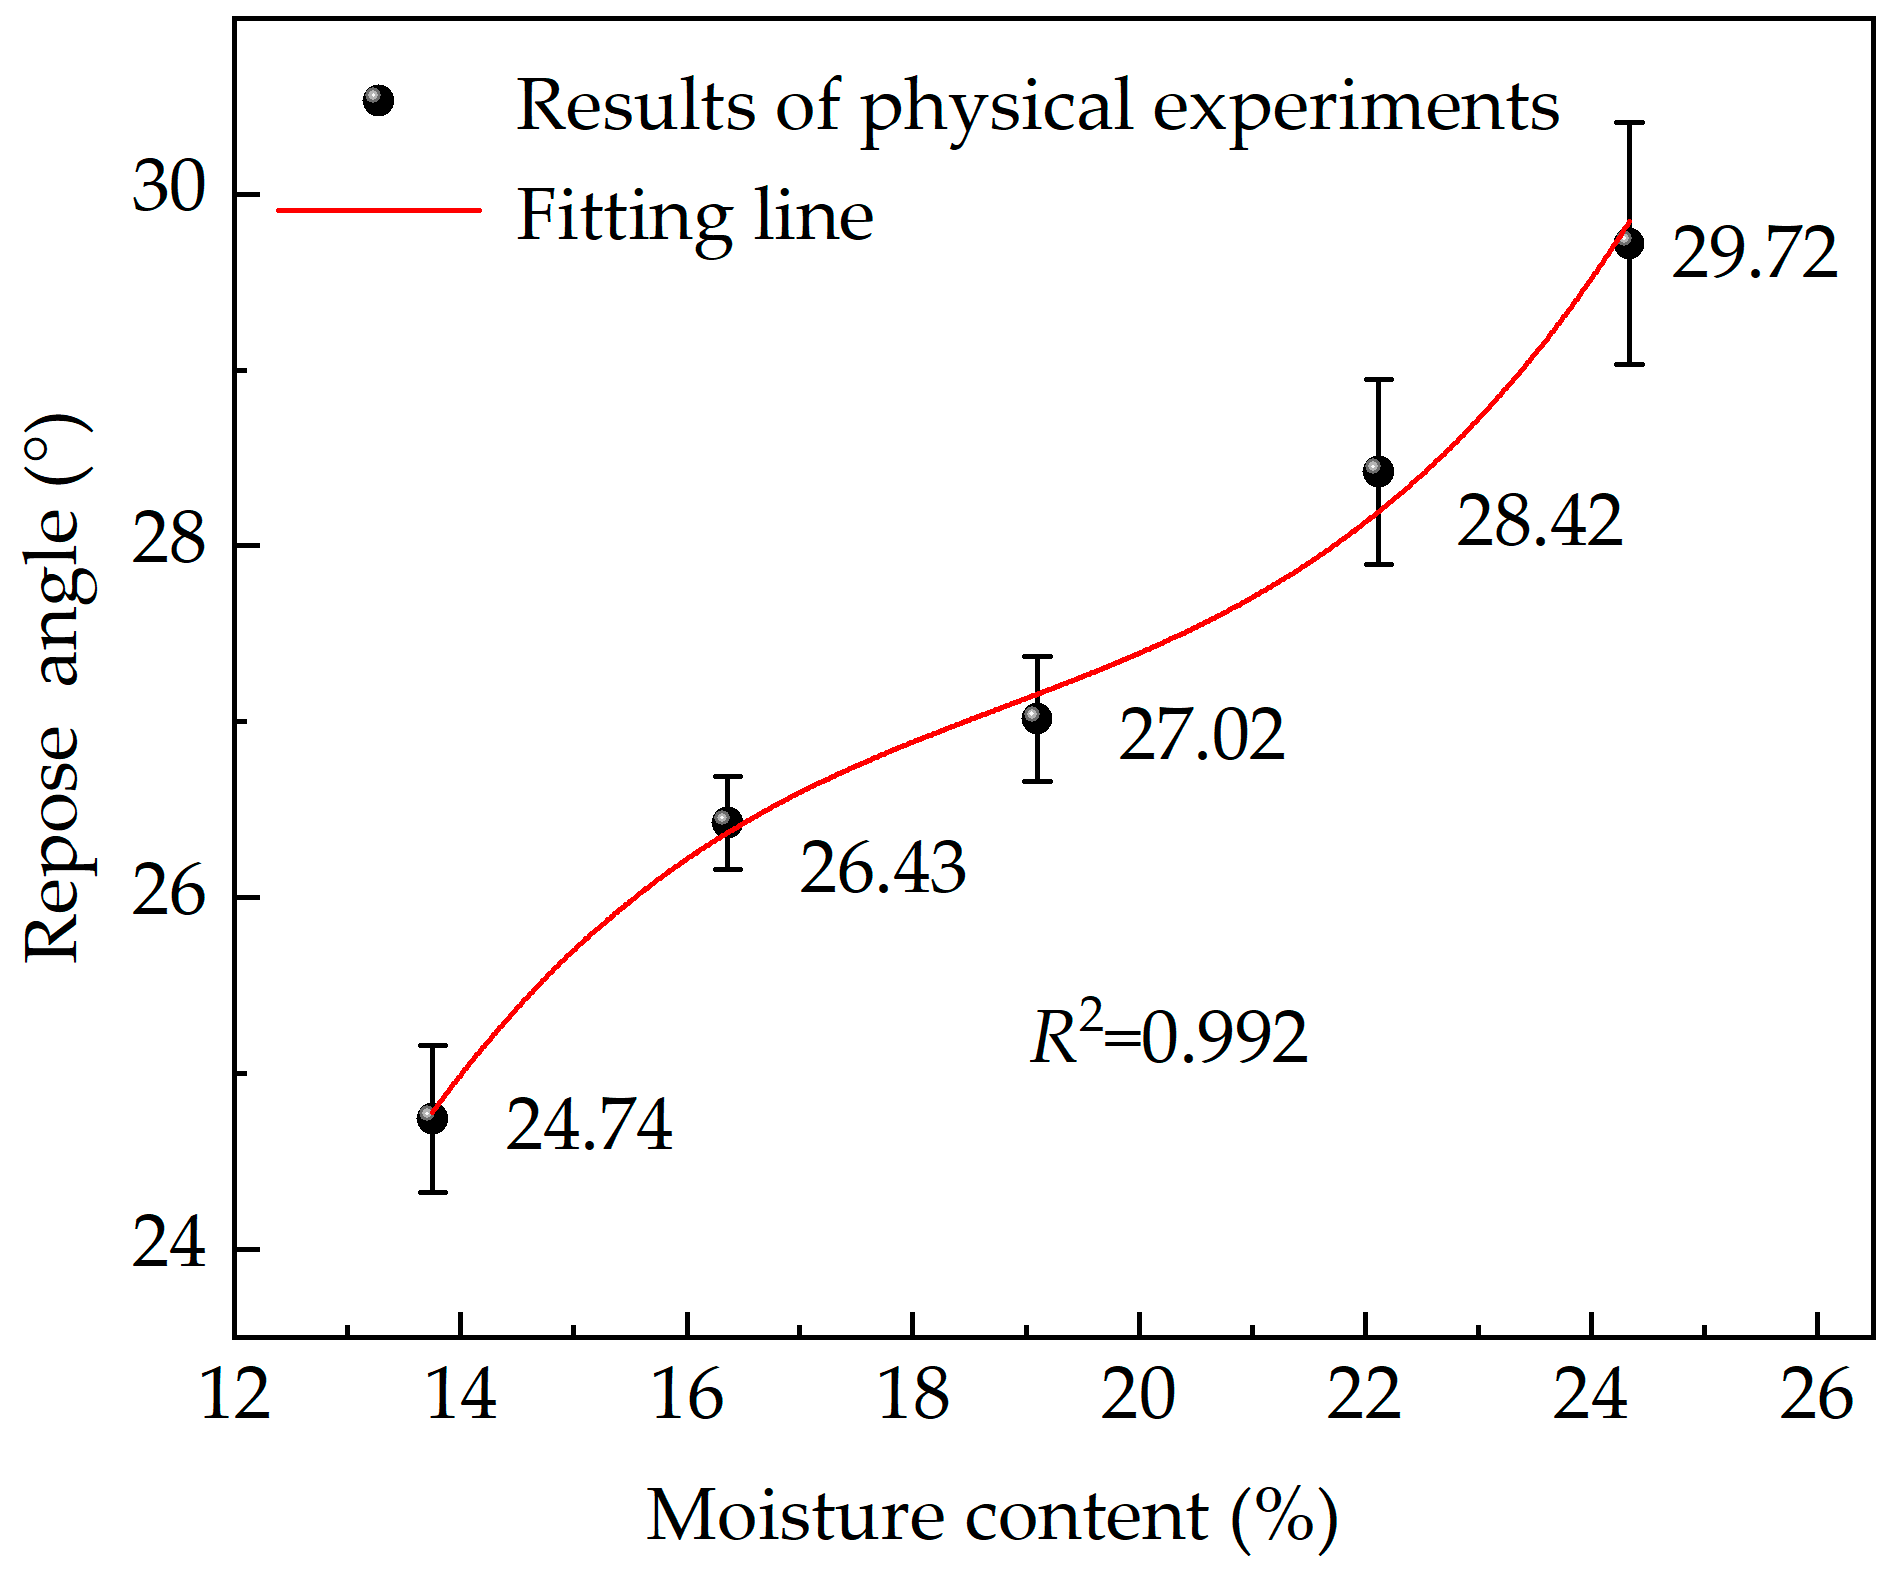
A moisture content–repose angle model for rice grain, with moisture content ranging from 13.75% to 24.34%, was developed based on physical tests using the cylinder lifting method. The model demonstrated a high correlation with the actual data, with a coefficient of determination of 0.992.
(2)
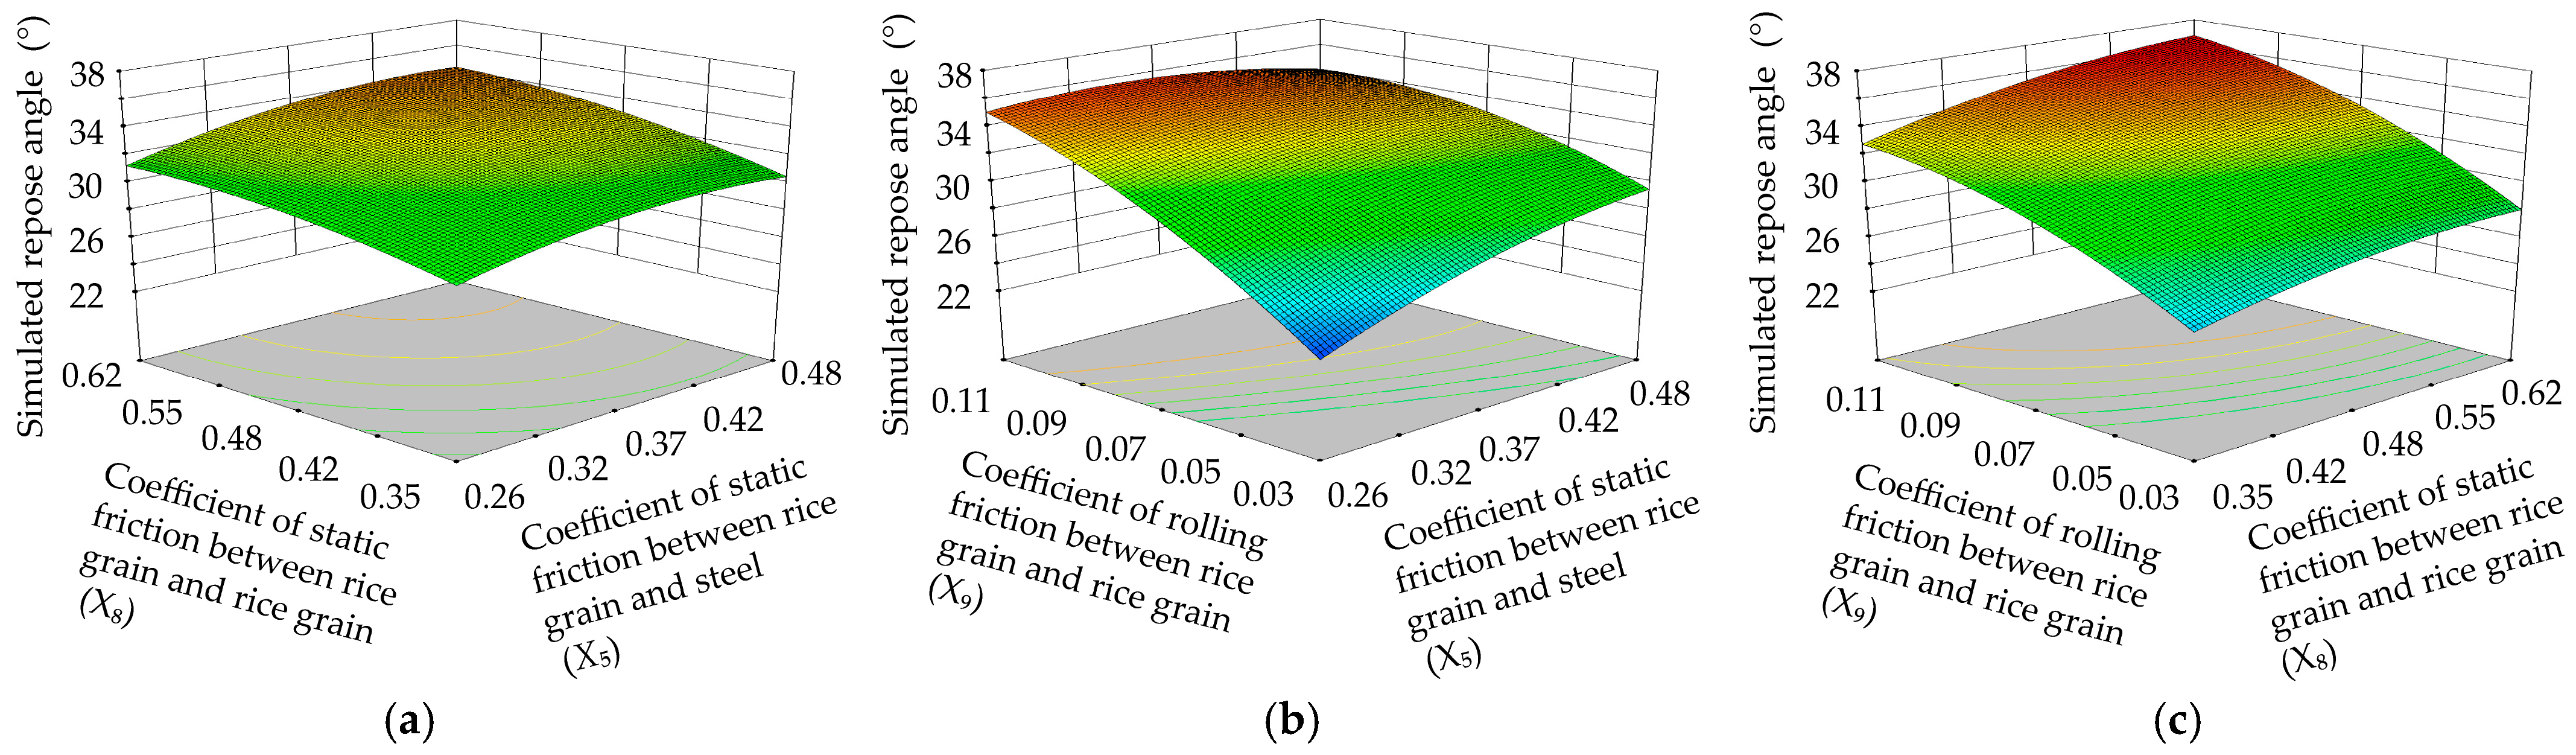
The discrete element parameters of rice grain under different moisture content conditions were determined through the PB test and steepest climbing test: the coefficient of static friction between the rice grains and steel plate was 0.26–0.48, the coefficient of static friction between the rice grains was 0.35–0.62, and the coefficient of rolling friction between the rice grains was 0.03–0.11. The model of the interaction between the repose angle of rice grain and the significant discrete element parameters of the rice was developed by the BB test, and the coefficient of determination of was 0.970. The relative error between the simulated and actual values of the repose angles did not exceed 3.52%, and the average relative error was 1.94%.
(3)
A moisture content–significant discrete element parameters model was established based on the relationships between moisture content and repose angle, as well as between the repose angle and significant discrete element parameters. The reliability of the model was verified under calibrated parameters using the cylinder lifting method and the unloading mass flow rate test, which resulted in relative errors less than or equal to 2.09% and 7.72%, respectively. These results showed that the discrete element parameters of rice grains with different moisture contents could be accurately predicted based on this model. Meanwhile, the model still remained applicable despite the slight change in particle size due to the change in moisture content. This study provides a reliable method for the determination of discrete element parameters in the simulation of long-grain rice at different moisture contents.

Author Contributions

Conceptualization, Z.C. and G.C.; methodology, Z.C.; software, Z.C.; validation, Z.C.; formal analysis, Z.C.; investigation, Z.C.; resources, Z.C., G.C. and L.W.; data curation, Z.C.; writing—original draft preparation, Z.C.; writing—review and editing, Z.C., G.C., L.W. and H.W.; visualization, Z.C. and K.Z.; supervision, Z.C. and G.C.; project administration, Z.C. and G.C.; funding acquisition, G.C. All authors have read and agreed to the published version of the manuscript.

Funding

This research was funded by the National Key Research and Development Program, grant number 2021YFD2100901; the National Grassroots Agricultural Extension Project, grant number JCTG1904; and the Major Project of Heilongjiang Province Applied Technology Research and Development Program, grant number GA15B402.

Institutional Review Board Statement

Not applicable.

Data Availability Statement

This article contains the data from this research report.

Conflicts of Interest

The authors declare no conflicts of interest.

References

  1. Zhao, W.; Chou, J.; Li, J.; Xu, Y.; Li, Y.; Hao, Y. Impacts of extreme climate events on future rice yields in global major rice-producing regions. Int. J. Environ. Res. Public Health 2022, 19, 4437. [Google Scholar] [CrossRef] [PubMed]
  2. Han, Y.; Jia, F.; Zeng, Y.; Jiang, L.; Zhang, Y.; Cao, B. Effects of rotation speed and outlet opening on particle flow in a vertical rice mill. Powder Technol. 2016, 297, 153–164. [Google Scholar] [CrossRef]
  3. Chen, P.; Han, Y.; Jia, F.; Meng, X.; Xiao, Y.; Bai, S. DEM simulations and experiments investigating the influence of feeding plate angle in a rubber-roll paddy grain huller. Biosyst. Eng. 2021, 201, 23–41. [Google Scholar] [CrossRef]
  4. Zhao, Z.; Li, Y.; Liang, Z.; Gong, Z. DEM simulation and physical testing of rice seed impact against a grain loss sensor. Biosyst. Eng. 2013, 116, 410–419. [Google Scholar] [CrossRef]
  5. Wang, P.; Zhu, L.; Zhu, X. Flow pattern and normal pressure distribution in flat bottom silo discharged using wall outlet. Powder Technol. 2016, 295, 104–114. [Google Scholar] [CrossRef]
  6. Herman, A.P.; Gan, J.; Zhou, Z.; Yu, A. Discrete particle simulation for mixing of granular materials in ribbon mixers: A scale-up study. Powder Technol. 2022, 400, 117222. [Google Scholar] [CrossRef]
  7. Mahto, L.; De, T.; Chakraborty, J.; Kumar, J.; Tripathi, A.; Sen, M.; Ketterhagen, W. Accelerated DEM simulation of the hopper-screw feeder and tablet-press feeder using the multi-level coarse-graining technique. Powder Technol. 2024, 436, 119466. [Google Scholar] [CrossRef]
  8. Jin, Q.; You, Y.; Wang, H.; Ma, X.; Wang, L.; Wang, D.; Fang, X. Calibration and experimental verification of finite element parameters for alfalfa conditioning model. Agriculture 2024, 14, 1724. [Google Scholar] [CrossRef]
  9. Chen, X.; Bai, J.; Wang, X.; Fang, W.; Hong, T.; Zang, N.; Fang, L.; Wang, G. Calibration and testing of discrete elemental simulation parameters for pod pepper seeds. Agriculture 2024, 14, 831. [Google Scholar] [CrossRef]
  10. Chen, H.; Lin, H.; Song, X.; Zhang, F.; Dai, F.; Yang, T.; Li, B. Study on the contact parameter calibration of the maize kernel polyhedral discrete element model. Agriculture 2024, 14, 1644. [Google Scholar] [CrossRef]
  11. Han, Y.; Zhao, D.; Jia, F.; Qiu, H.; Li, A.; Bai, S. Experimental and numerical investigation on the shape approximation of rice particle by multi-sphere particle models. Adv. Powder Technol. 2020, 31, 1574–1586. [Google Scholar] [CrossRef]
  12. Han, Y.; Jia, F.; Tang, Y.; Liu, Y.; Zhang, Q. Influence of granular coefficient of rolling friction onaccumulation characteristics. Acta Phys. Sin. 2014, 63, 173–179. [Google Scholar]
  13. Zhang, S.; Tekeste, M.Z.; Li, Y.; Gaul, A.; Zhu, D.; Liao, J. Scaled-up rice grain modelling for DEM calibration and the validation of hopper flow. Biosyst. Eng. 2020, 194, 196–212. [Google Scholar] [CrossRef]
  14. Yu, Q.; Liu, Y.; Chen, X.; Sun, K.; Lai, Q. Calibration and experiment of simulation parameters for panax notoginseng seeds based on DEM. Trans. Chin. Soc. Agric. Mach. 2020, 51, 123–132. [Google Scholar]
  15. Tian, X.; He, F.; Chen, F.; Zhan, L. Calibration of discrete elemental parameters of wood powder with different moisture content based on angle of repose. J. Agric. Sci. Technol 2025, 27, 118–128. [Google Scholar]
  16. Bai, J.; Xie, B.; Yan, J.; Zheng, Y.; Liu, N.; Zhang, Q. Moisture content characterization method of wet particles of brown rice based on discrete element simulation. Powder Technol. 2023, 428, 118775. [Google Scholar] [CrossRef]
  17. Wang, J.; Ren, K.; Li, Z.; Zhang, L. An investigation on a comprehensive calibration technique to determine the discrete elemental characteristics of unrotted sheep dung at varying water concentrations. Agriculture 2024, 14, 1762. [Google Scholar] [CrossRef]
  18. Wu, T.; Yan, L.; Jiang, D.; Gou, H.; Fu, X.; Zhang, J. Establishment and research of cotton stalk moisture content–discrete element parameter model based on multiple verification. Processes 2024, 12, 1770. [Google Scholar] [CrossRef]
  19. Liu, H.; Lu, Q.; Wang, J.; Zhou, W.; Wang, N. Rapid calibration method for discrete element simulation parameters of columnar granular organic fertilizer with variable moisture content. Powder Technol. 2024, 448, 120354. [Google Scholar] [CrossRef]
  20. Wang, H.; Wu, P.; He, H.; Ma, Y.; Bu, K.; Xue, J. Calibration of parameters for discrete element simulation model for alfalfa with different moisture contents based on angle of repose test. BioResources 2022, 17, 1467–1484. [Google Scholar] [CrossRef]
  21. Ben, Z.; Sun, X.; Zhu, R.; Zhang, X.; Bai, Y.; Yang, D.; Chen, K.; Dong, Y. Measurement and calibration of gluten pellets discrete element parameters at varied moisture content. J. Food Sci. 2024, 89, 1616–1631. [Google Scholar] [CrossRef] [PubMed]
  22. Li, T.; Li, C.; Li, C.; Xu, F.; Fang, Z. Porosity of flowing rice layer: Experiments and numerical simulation. Biosyst. Eng. 2019, 179, 1–12. [Google Scholar] [CrossRef]
  23. Luo, H.; Li, C.; Zhang, Y. Design and experimental study of 5HP-25 type grain dryer. Trans. Chin. Soc. Agric. Eng. 2021, 37, 279–289. [Google Scholar]
  24. Zeng, Y.; Mao, B.; Li, A.; Han, Y.; Jia, F. DEM investigation of particle flow in a vertical rice mill: Influence of particle shape and rotation speed. Powder Technol. 2022, 399, 117105. [Google Scholar] [CrossRef]
  25. Wang, H.; Che, G.; Wan, L.; Tang, H. Effects of drying approaches combined with variable temperature and tempering on the physicochemical quality of rice. Dry. Technol. 2023, 41, 1199–1213. [Google Scholar] [CrossRef]
  26. Xu, L.; Li, Y. Critical speed of impact damage on a rice kernel. Trans. Chin. Soc. Agric. Mach. 2009, 40, 54–57. [Google Scholar]
  27. Zheng, X.; Liu, C.; Chen, Z.; Ding, N.; Jin, C. Effect of Drying Conditions on the Texture and Taste Characteristics of Rough Rice. Dry. Technol. 2011, 29, 1297–1305. [Google Scholar] [CrossRef]
  28. Liu, C.; Wang, Y.; Song, J.; Li, Y.; Ma, T. Experiment and discrete element model of rice seed based on 3D laser scanning. Trans. Chin. Soc. Agric. Eng. 2016, 32, 294–300. [Google Scholar]
  29. Zeng, Y.; Jia, F.; Zhang, Y.; Meng, X.; Han, Y.; Wang, H. DEM study to determine the relationship between particle velocity fluctuations and contact force disappearance. Powder Technol. 2017, 313, 112–121. [Google Scholar] [CrossRef]
  30. Markauskas, D.; Kacianauskas, R.; Dziugys, A.; Navakas, R. Investigation of adequacy of multi-sphere approximation of elliptical particles for DEM simulations. Granul. Matter 2010, 12, 107–123. [Google Scholar] [CrossRef]
  31. Li, A.; Jia, F.; Han, Y.; Chen, P.; Zhang, J.; Wang, Y.; Fei, J.; Shen, S.; Hao, X.; Feng, W. Effect of the rotational speeds of the screw conveyor and milling roller on the behaviour of grain flows in the connected chamber of a vertical “conveying-milling” rice mill. Biosyst. Eng. 2022, 224, 161–182. [Google Scholar] [CrossRef]
  32. Keppler, I.; Kocsis, L.; Oldal, I.; Farkas, I.; Csatar, A. Grain velocity distribution in a mixed flow dryer. Adv. Powder Technol. 2012, 23, 824–832. [Google Scholar] [CrossRef]
  33. Jia, F.; Han, Y.; Liu, Y.; Cao, Y.; Shi, Y.; Yao, L.; Wang, H. Simulation prediction method of repose angle for rice particle materials. Trans. Chin. Soc. Agric. Eng. 2014, 30, 254–260. [Google Scholar]
  34. Fang, W.; Wang, X.; Han, D.; Chen, X. Review of material parameter calibration method. Agriculture 2022, 12, 706. [Google Scholar] [CrossRef]
  35. Zhao, Z.; Wu, Y.; Yin, J.; Tang, Z. Monitoring method of rice seeds mass in vibrating tray for vacuum-panel precision seeder. Comput. Electron. Agric. 2015, 114, 25–31. [Google Scholar] [CrossRef]
  36. Liang, Z.; Li, Y.; Xu, L.; Zhao, Z. Sensor for monitoring rice grain sieve losses in combine harvesters. Biosyst. Eng. 2016, 147, 51–66. [Google Scholar] [CrossRef]
  37. Shu, C.; Yang, J.; Wan, X.; Yuan, J.; Liao, Y.; Liao, Q. Calibration and experiment of the discrete element simulation parameters of rape threshing mixture in combine harvester. Trans. Chin. Soc. Agric. Eng. 2022, 38, 34–43. [Google Scholar]
  38. Lian, G.; Zhong, W.; Liu, X. DEM study on the mixed feeding process of coal and cylindroid biomass particles in a screw feeder. Adv. Powder Technol. 2021, 32, 2543–2554. [Google Scholar] [CrossRef]
  39. Nicholas, A.P.; Benjamin, L.S.; Julio, M.O.; Richard, M.L. Surface roughness effects in granular matter: Influence on angle of repose and the absence of segregation. Phys. Rev. E 2006, 73, 031304. [Google Scholar] [CrossRef]
  40. Abdul-Rasaq, A.A.; Lateef, O.S.; Hameed, O.O.; Olayinka, R.K. Effect of variety and moisture content on some engineering properties of paddy rice. J. Food Sci. Technol. 2011, 48, 551–559. [Google Scholar] [CrossRef]
  41. Mohammadreza, A.; Saeed, M. Effect of de-awing and moisture content on some frictional of paddy. J. Food Process Eng. 2012, 35, 471–482. [Google Scholar] [CrossRef]
  42. Kibar, H.; Öztürk, T.; Esen, B. The effect of moisture content on physical and mechanical properties of rice (Oryza sativa L.). Span. J. Agric. Res. 2010, 8, 741–749. [Google Scholar] [CrossRef]
  43. Fan, J.; Wang, H.; Sun, K.; Zhang, L.; Wang, L.; Zhao, J.; Yu, J. Experimental verification and simulation analysis of a multi-sphere modelling approach for wheat seed particles based on the discrete element method. Biosyst. Eng. 2024, 245, 135–151. [Google Scholar] [CrossRef]
  44. Shi, H.; Siebenmorgen, T.J. Effect of Rice Cultivar, Type, Form, and Moisture Content on the Angle of Repose. Appl. Eng. Agric. 2019, 35, 361–368. [Google Scholar] [CrossRef]
Figure 1. Measurement of rice grain size.
Agriculture 15 01058 g001
Figure 2. The DEM modeling of long-grain rice. (a) The two-dimensional structure of the ellipsoidal model of the long-grain rice; (b) the DEM modeling of long-grain rice with a moisture content of 13.75%.
Agriculture 15 01058 g002
Figure 3. Cylinder lifting test device.
Agriculture 15 01058 g003
Figure 4. Edge contour extraction process of rice grain heap: (a) heap of rice grains; (b) unilateral heap of rice grains; (c) image binarization; (d) contour lines and linear fit of unilateral rice grain heap.
Agriculture 15 01058 g004
Figure 5. The DEM modeling of long-grain rice with moistures of 18.25% and 22.80%.
Agriculture 15 01058 g005
Figure 6. Unloading mass flow rate verification test. (a) Physical test; (b) simulation test.
Agriculture 15 01058 g006
Figure 7. Relationship curve between moisture content and repose angle for rice grain.
Agriculture 15 01058 g007
Figure 8. Effects of interaction factors on simulated repose angle. The color represents the magnitude of the variable, with red indicating the maximum value (36.35°) and blue indicating the minimum value (22.68°). (a) Interaction effects of X 5 and X 8 ; (b) interaction effects of X 5 and X 9 ; (c) interaction effects of X 8 and X 9 .
Agriculture 15 01058 g008
Figure 9. Comparisons of tests and simulations at different moisture contents. (a) Actual tests; (b) simulation tests.
Agriculture 15 01058 g009
Figure 10. Simulation and experimental comparison of unloading mass flow rates of rice grains at different moisture contents and rotational speeds. (a) Moisture content of 14.50%; (b) moisture content of 18.25%; (c) moisture content of 22.80%.
Agriculture 15 01058 g010
Table 1. Parameters of PB test.
TypesParametersSymbolLow LevelHigh Level
Rice grainDensity (kg/m3) X 1 10501350
Poisson’s ratio X 2 0.20.3
Young’s modulus (MPa) X 3 20400
Rice grain–steelCoefficient of restitution X 4 0.100.76
Coefficient of static friction X 5 0.140.60
Coefficient of rolling friction X 6 00.1
Rice grain–rice grainCoefficient of restitution X 7 0.20.6
Coefficient of static friction X 8 0.210.75
Coefficient of rolling friction X 9 00.15
Virtual parameters X 10 , X 11 --
Table 2. Design and results of PB simulation test for long-grain rice.
No. X 1 X 2 X 3 X 4 X 5 X 6 X 7 X 8 X 9 Simulated Repose Angle/(°)
113500.3200.760.600.10.20.21017.41
210500.34000.10.600.10.60.21018.36
313500.24000.760.140.10.60.7508.77
410500.3200.760.6000.60.750.1540.32
510500.24000.10.600.10.20.750.1540.50
610500.2200.760.140.10.60.210.1511.71
713500.2200.10.6000.60.75025.80
813500.3200.10.140.10.20.750.1524.80
913500.34000.10.1400.60.210.1511.44
1010500.34000.760.1400.20.7508.28
1113500.24000.760.6000.20.210.1526.88
1210500.2200.10.1400.20.2105.96
1312000.252100.430.370.050.40.480.07533.79
1412000.252100.430.370.050.40.480.07534.46
1512000.252100.430.370.050.40.480.07534.54
Table 3. Design and results of PB test.
ParametersEffectsSum of SquaresContribution Rate/%Significance Ranking
x 1 −1.678.380.416
x 2 0.170.080.0049
x 3 −1.9611.540.575
x 4 −2.2515.170.744
x 5 16.39805.4139.551
x 6 0.480.690.038
x 7 −1.244.600.237
x 8 9.45268.0013.163
x 9 11.85420.9120.672
Note: x 1 x 9 are code values of X 1 X 9 ; the same below.
Table 4. Design and results of steepest climbing test in long-grain rice.
No. X 5 X 8 X 9 Simulated Repose Angle/(°)Mean Relative Error/%
10.140.2106.84298.61
20.260.350.0319.4240.40
30.370.480.0733.7519.22
40.480.620.1136.7125.73
50.600.750.1540.7633.11
Table 5. Design and results of BB test.
No. x 5 x 8 x 9 Simulated Repose Angle/(°)
1−1−1029.19
21−1029.74
3−11032.09
411033.79
5−10−122.68
610−129.89
7−10134.71
810135.12
90−1−125.99
1001−128.31
110−1132.61
1201136.35
1300032.10
1400032.62
1500032.91
1600033.62
1700033.22
Table 6. ANOVA of modified BB model.
SourceSum of SquaresDegree of FreedomMean SquareF Valuesp Value
Model188.26920.9224.870.0002 **
x 5 12.18112.1814.480.0067 **
x 8 21.16121.1625.150.0015 **
x 9 127.361127.36151.42<0.0001 **
x 5 x 8 0.3310.330.390.5506
x 8 x 9 11.56111.5613.740.0076 **
x 5 x 9 0.510.50.60.4642
x 5 2 3.8313.834.550.0704
x 8 2 2.2912.292.730.1426
x 9 2 7.5717.5790.0199 *
Residual5.8970.84
Lack of Fit4.5531.524.530.0893
Pure Error1.3440.33
Note: ** and * indicated significance at 0.01 and 0.05 levels, respectively.
Table 7. Combinations of significant discrete element parameters.
Moisture Content/% X 5 X 8 X 9 Actual Repose Angle/(°)Simulated Repose Angle/(°)Relative Error/%
13.750.290.470.0324.7424.970.94
16.360.330.420.0326.4325.892.04
19.100.360.360.0427.0227.431.52
22.120.450.360.0428.4227.941.70
24.340.390.500.0429.7230.773.52
Table 8. Three significant discrete element parameter combinations at different moisture contents.
Moisture Content/% X 5 X 8 X 9 Actual Repose Angle/(°)Simulated Repose Angle/(°)Relative Error/%
14.500.350.360.0324.9525.291.36
18.250.360.360.0427.0226.880.52
22.800.450.360.0428.6728.072.09
Disclaimer/Publisher’s Note: The statements, opinions and data contained in all publications are solely those of the individual author(s) and contributor(s) and not of MDPI and/or the editor(s). MDPI and/or the editor(s) disclaim responsibility for any injury to people or property resulting from any ideas, methods, instructions or products referred to in the content.

