Article

Experimental Study of Liquid Jet Atomization and Penetration in Subsonic Crossflows

1
School of Agricultural Engineering, Jiangsu University, Zhenjiang 212013, China
2
Jiangsu Provincial Key Laboratory of Hi-Tech Research for Intelligent Agricultural Equipment, Jiangsu University, Zhenjiang 212013, China
*
Author to whom correspondence should be addressed.
Agriculture 2025, 15(10), 1037; https://doi.org/10.3390/agriculture15101037 (registering DOI)
Submission received: 3 April 2025 / Revised: 7 May 2025 / Accepted: 9 May 2025 / Published: 11 May 2025
(This article belongs to the Section Agricultural Technology)

Abstract

:
This study experimentally investigates the breakup mechanisms and atomization characteristics of liquid jets in subsonic crossflows and develops a penetration depth model that incorporates the incidence angle. Experimental data show that the model fits well, with a minimum R2 value of 0.924 and an average of 0.969. High-speed imaging techniques were used to systematically analyze the effects of liquid- and gas-phase Weber numbers and incidence angles on the penetration and atomization of liquid jets. The experimental results indicate the following: (1) As the liquid Weber number (Wel) increases, the penetration depth increases, while the gas Weber number (Wea) is inversely related to penetration depth. (2) A decrease in the incidence angle (ranging from 45° to 90°) significantly reduces penetration performance. (3) As Wea increases, the volume median diameter (VMD) of droplets decreases by 61.70% to 83.09%, while smaller incidence angles cause a 42.96% increase in the VMD. The VMD shows a non-linear trend with respect to Wel, reflecting the complex interaction between inertial forces and surface tension. These findings provide a theoretical basis for understanding the atomization behavior of transverse jets and the key parameters affecting penetration and droplet formation. The results are of practical significance for the structural optimization and performance enhancement of air-assisted atomizing nozzles used in precision agricultural spraying systems.

1. Introduction

Air-assisted atomizing nozzles have significant potential for improving spraying efficiency and reducing pesticide usage. The advantage of atomizing nozzles lies in their ability to produce fine and uniform droplets, thereby enhancing coverage and deposition density on crop surfaces. In recent years, with the development of precision agriculture, the performance requirements for atomizing nozzles have increased significantly [1,2].
Liquid jet in crossflow (JICF) is a widely encountered multiphase flow phenomenon in various engineering applications such as combustors and agricultural spraying systems. While extensive studies have explored the atomization characteristics in supersonic crossflows, the mechanisms under subsonic conditions remain relatively under-investigated. In subsonic regimes, aerodynamic forces such as drag and lift interact differently with surface tension and liquid momentum, in contrast to the compressibility and shock-induced effects that dominate supersonic flows. These differences result in distinct jet breakup modes, penetration paths, and atomization behaviors [3]. Critical parameters such as breakup length, jet trajectory, and droplet size distribution significantly influence spray performance [4,5,6,7,8]. Understanding the underlying mechanisms of jet breakup, droplet transport, and spray formation in transversal jets is therefore essential for improving atomization efficiency [9,10,11].
The penetration depth of transverse jets is a key parameter for describing motion trajectory. The motion trajectory of a liquid jet in a crossflow significantly influences the final penetration and mixing of the gas–liquid phases. Researchers have developed a semi-empirical formula for the penetration depth curve of column breakup in jets within supersonic crossflows based on theoretical analysis and experimental methods [12,13,14]. Jiang et al. [15] developed a semi-empirical model for the rotary nozzle spray range based on instability theory, achieving an average relative error below 2.5%. Xie et al. [16] proposed a comprehensive theoretical model for the primary breakup of liquid jets in subsonic crossflows, while Kong et al. [17] reported a transition from column breakup to shear-layer-driven atomization under low-speed airflow. However, these studies commonly assume a fixed injection angle and often neglect the influence of varying incidence angles on atomization and penetration [18].
Droplet size and distribution are key parameters for evaluating atomization performance, directly affecting spray uniformity and deposition efficiency [19,20]. Liu et al. performed numerical simulations of spray jets in supersonic crossflows using momentum theory and the Eulerian two-fluid model. They developed a prediction model for the droplet mean diameter (SMD) and validated it [21]. Yu et al. indicated that in supersonic crossflows, strong crossflow shear forces reduce droplet diameter [22]. Kumar et al. proposed a droplet size prediction model based on numerical analysis. Experimental results showed that the model failed to accurately predict the jet breakup pattern at low Weber numbers, resulting in higher theoretical values [3]. The precise control of droplet size, distribution, and penetration plays a crucial role in the design of atomizing nozzles [23,24,25].
The key parameters of the crossflow, including airflow velocity, density, and viscosity, as well as the physical properties of the liquid jet, including jet velocity, density, viscosity, and surface tension, are the primary factors influencing the atomization efficiency of lateral jets [3,26]. Researchers commonly use dimensionless numbers, such as the Weber number (We) and the momentum flux ratio (q) [27,28], to study the atomization mechanism of transverse jets. The calculation formulas are as follows:
W e = ρ v 2 d σ
q = ρ l v l 2 ρ a v a 2
where ρ is the density, kg/m3; v is the velocity, m/s; d is the liquid column diameter, m; and σ is the surface tension, N/m. The subscripts l and a refer to properties related to the liquid jet and the crossflow, respectively.
While substantial research has been conducted on the motion trajectories of liquid jets in supersonic crossflows, theoretical analyses of jet motion in subsonic crossflows remain limited. Few models quantitatively capture the coupled effect of incidence angle and Weber number on jet trajectory.
Addressing these limitations, the present study introduces an experimental analysis and empirical model that jointly consider liquid injection angle and aerodynamic forces in subsonic crossflows, with a particular focus on how factors such as airflow velocity va, liquid velocity vl, and incidence angle θ influence jet penetration and atomization breakup. The findings provide a theoretical basis for the design of transverse jet atomizing nozzles.

2. Materials and Methods

2.1. Theoretical Analysis

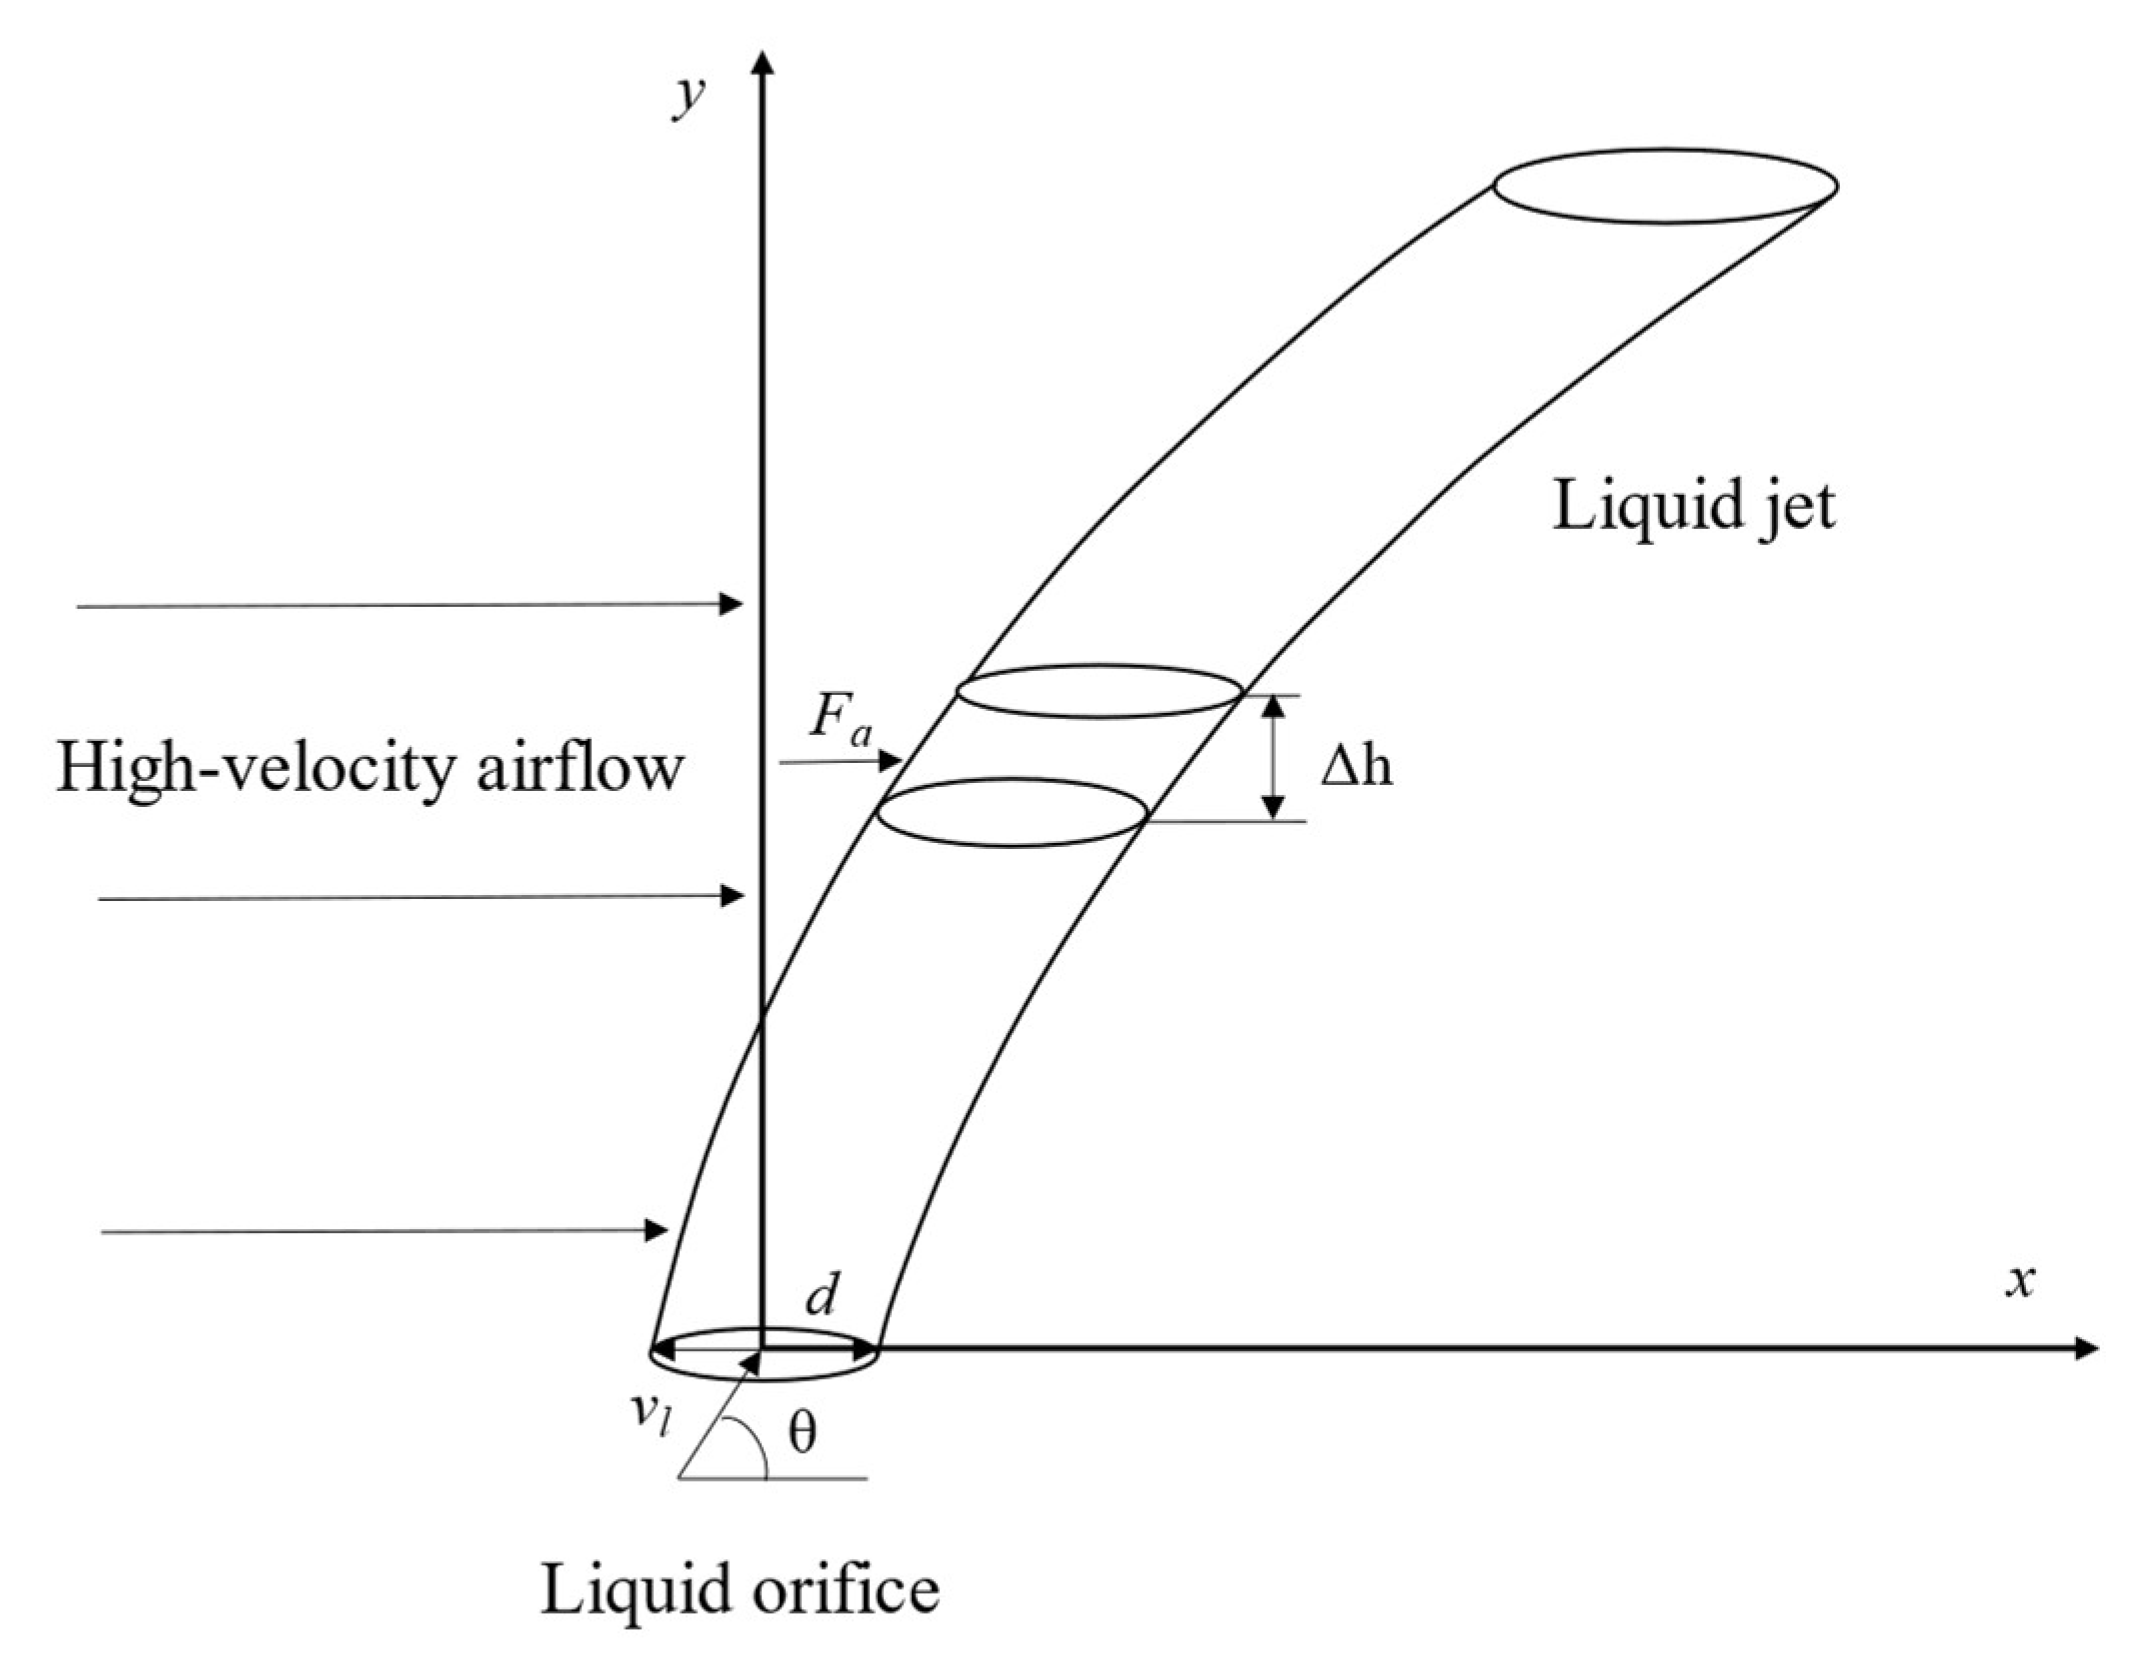
In this study, the liquid jet is simplified as a cylindrical structure composed of infinitesimal elements with diameter d and thickness Δh, following the momentum-based modeling framework. High-speed imaging observations confirm that the jet maintains an approximately cylindrical shape in the early stage of its trajectory, supporting the geometric simplification used in the derivation. Therefore, this assumption is considered valid during the initial penetration phase [29]. A rectangular coordinate system is established, with its origin at the center of the liquid orifice. The x-axis is aligned with the direction of the crossflow, and the y-axis is perpendicular to it, as shown in Figure 1.
The infinitesimal element is subjected to the aerodynamic force Fa, expressed as
F a = 1 2 ρ a v a 2 S F C d
where SF is the frontal cross-sectional area of the infinitesimal element, m2; and Cd is the drag coefficient.
S F = d Δ h
According to Newton’s second law, the acceleration of the liquid jet in the direction of the crossflow velocity satisfies Equation (5).
1 2 ρ a v a 2 S F C d = ρ l S c h d 2 x d t 2
S c = π d 2 4
x d = 1 π C d ρ a ρ l v a 2 t 2 d 2
where Sc is the cross-sectional area of the jet, m2; which is the area of the liquid orifice.
After the liquid jet exits the nozzle, assuming the liquid jet deformation is negligible,
t = y v l
x d = 1 π C d ρ a ρ l v a v l 2 y d 2
The simplified penetration depth curve model for the transverse jet:
y d = π C d q x d
where y represents the penetration depth of the transverse jet, m.
Taking into account the actual characteristics of the liquid flow, the penetration depth curve model was modified, and the modified penetration depth curve model is shown in Equation (11).
y d = C q α ( x d ) β
where x and y are the coordinates of the penetration depth curve along the crossflow direction and perpendicular to the crossflow direction, respectively. C, α, and β are empirical coefficients.
When the angle between the direction of the liquid jet and the crossflow air direction is θ (incidence angle), the velocity of the liquid jet perpendicular to the crossflow is vly, and the velocity along the crossflow direction is vlx, as shown in Figure 2.
v l y = v l cos ϑ
v l x = v l sin ϑ
The relative velocity between the liquid jet and the crossflow air in the direction of the crossflow air, va−l, and the penetration depth curve model for the liquid incidence angle θ are shown below:
v a l = v a v l sin ϑ
y d = C ρ l v l 2 sin 2 ϑ ρ a v a v l cos ϑ 2 α ( x d ) β
As shown in Equation (15), the penetration depth is influenced by factors such as va, vl, m/s; and θ, °. This model reveals the basic pattern of penetration depth variation in the atomization process of the transverse jet.

2.2. Experimental Setup

2.2.1. Visualization of Charged Droplet Generation

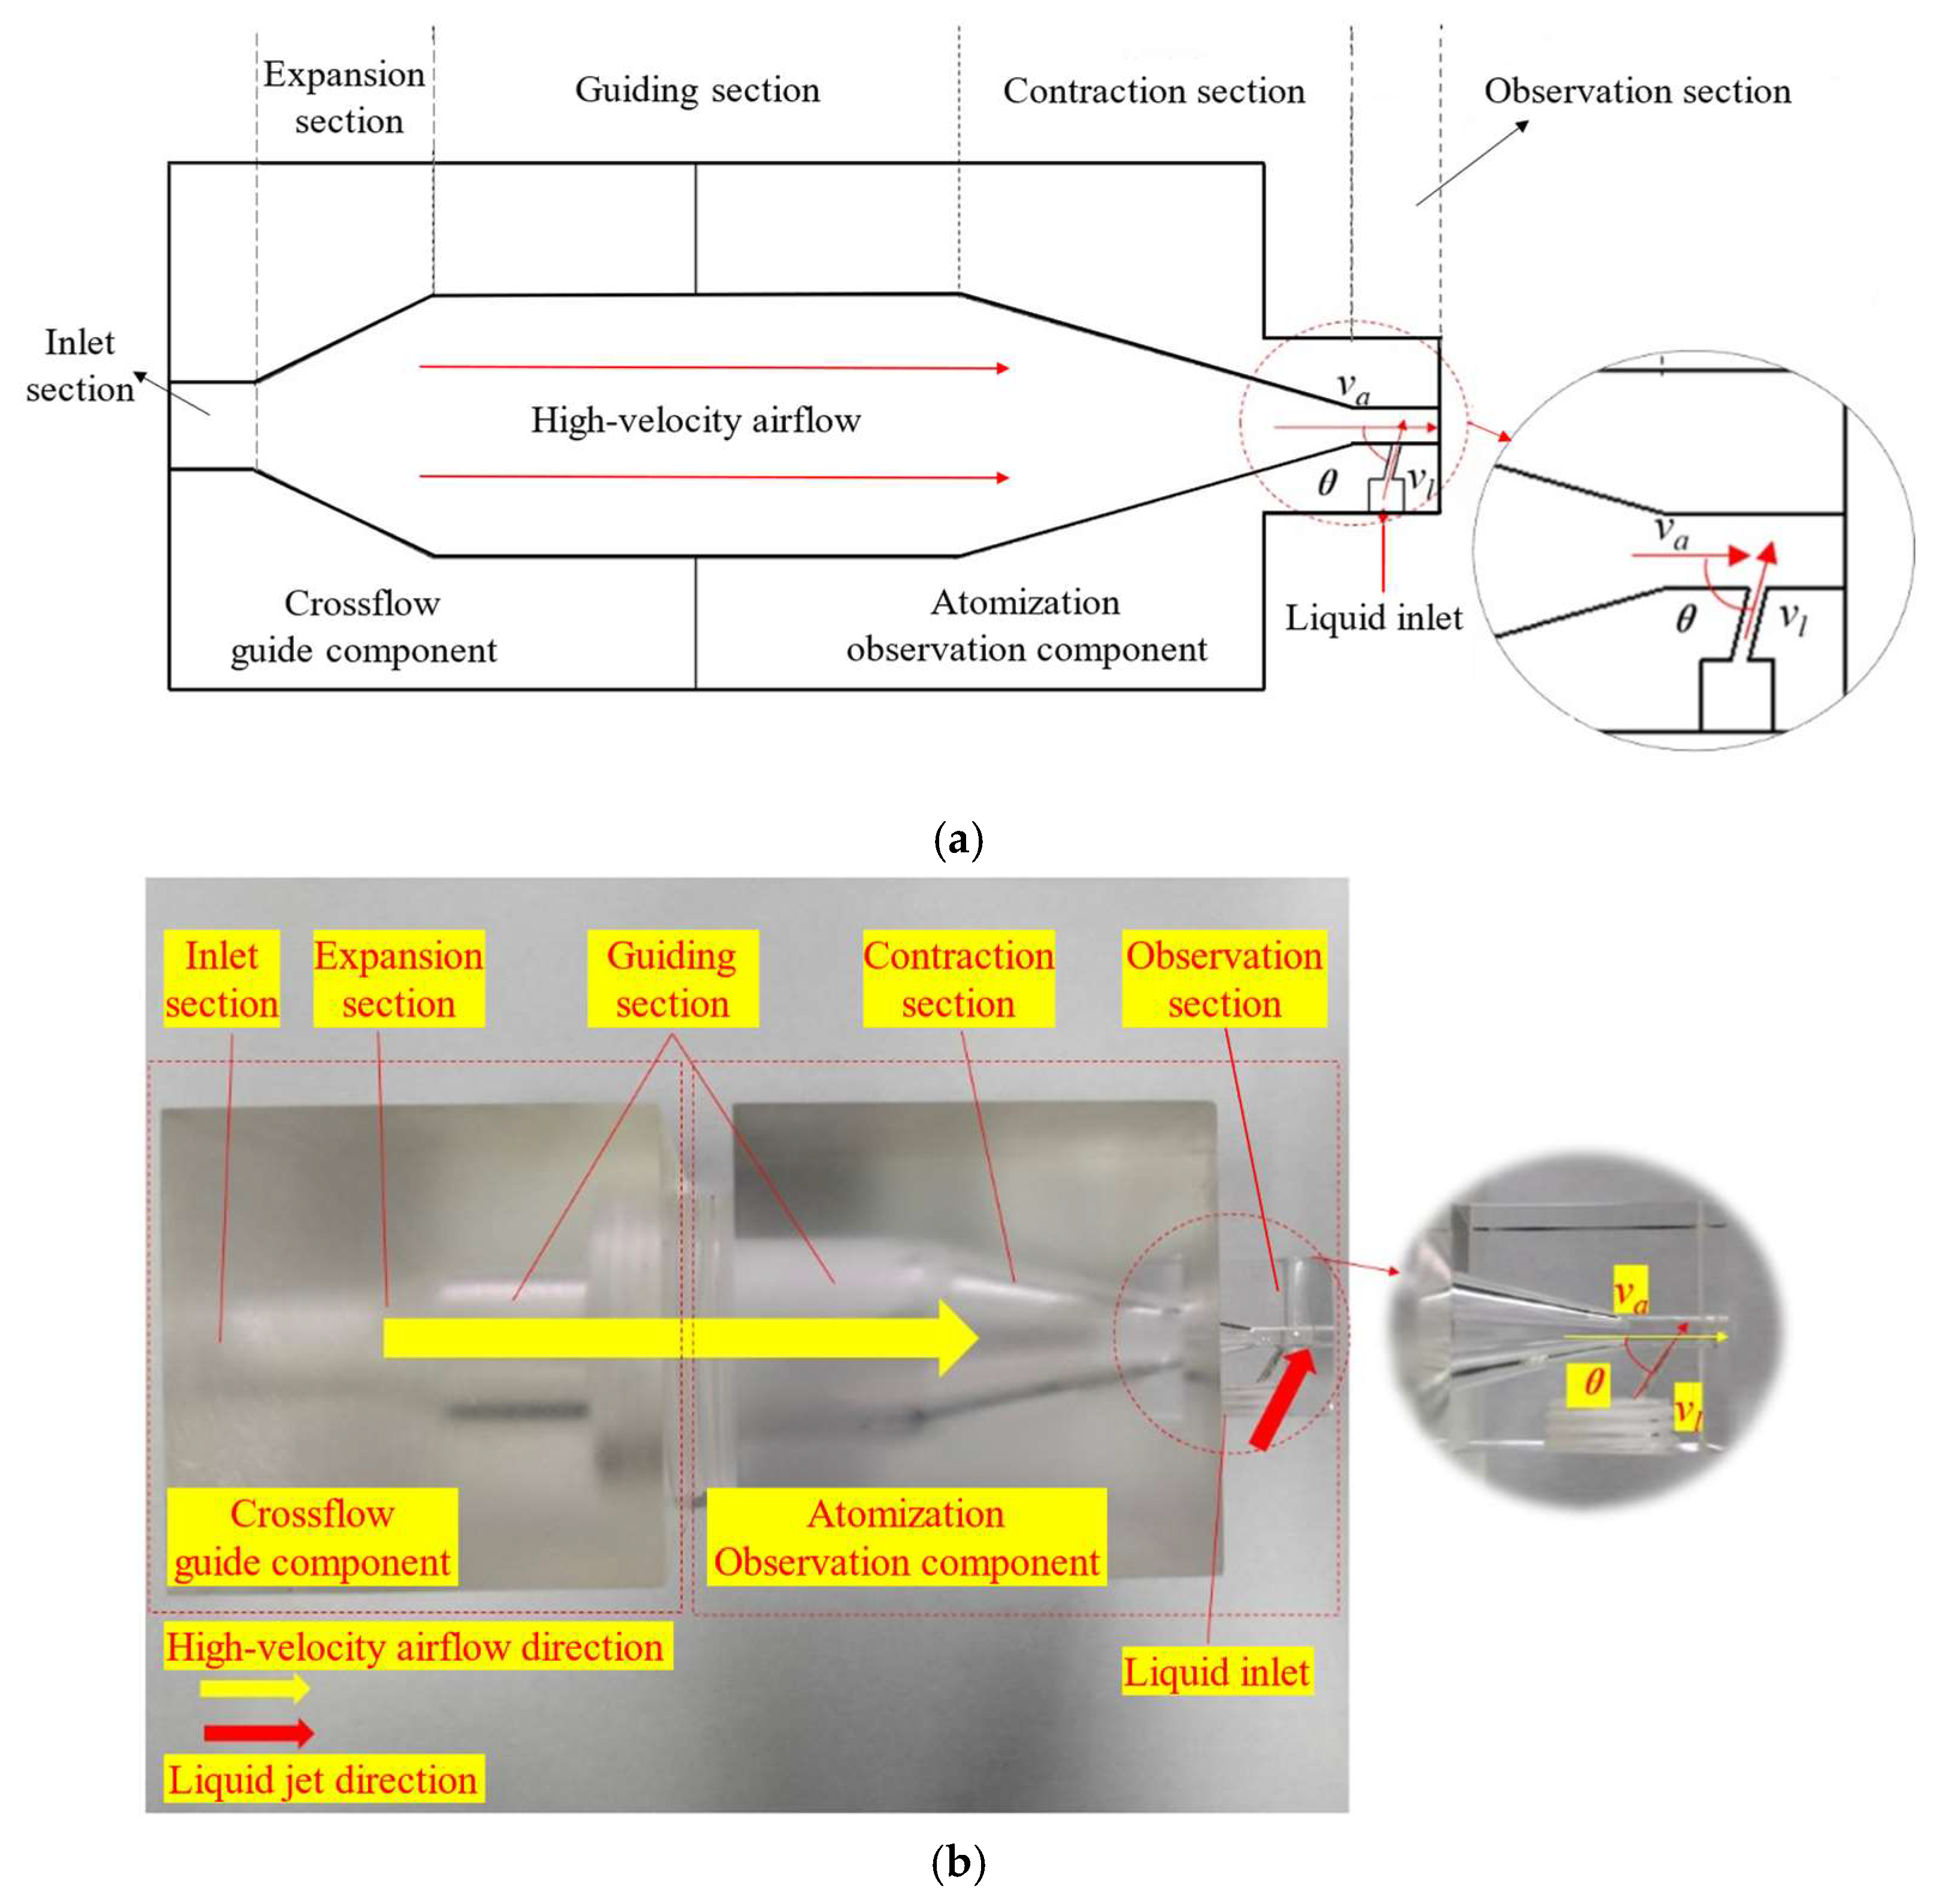
The experiment is carried out in a transverse jet atomization device, which comprises two main components: a crossflow guide component and an atomization observation component. The internal cavities of both components together form the experimental flow path, as illustrated in Figure 3. The crossflow guide component consists of an inlet section, an expansion section, and a guiding section. The atomization observation component includes a guiding section, a contraction section, an observation section, and a liquid inlet port. In the experiment, compressed air enters the crossflow guide component through the inlet section, accelerates through the expansion and guiding sections, and forms a uniform high-velocity airflow in the contraction section. Simultaneously, the liquid enters the observation section via the liquid inlet orifice, where it intersects with the high-velocity airflow, resulting in transverse jet atomization in the observation section.
The inlet section features a circular cross-section with a diameter of 10 mm, while the expansion section has an expansion angle of 20°. The guiding section has a circular cross-section with a diameter of 30 mm. The contraction section has a contraction angle of 10°, and the observation section has a square cross-section with a side length of 3 mm. The liquid inlet port has a diameter of 0.7 mm. To investigate the impact of the liquid incidence angle on transverse jet atomization, four observation units were designed with incidence angles of 45°, 60°, 75°, and 90°. The liquid used in the experiment was tap water, with the relevant physical properties provided in Section 2.3. This selection ensured consistent fluid properties and facilitated the accurate calculation of Weber numbers across all test conditions.
To minimize flow disturbances caused by geometric irregularities, the internal walls of the experimental flow path were designed with smooth and circular contours, and sharp edges were deliberately avoided. This ensures uniform airflow distribution and reduces the influence of structural turbulence on the atomization and penetration characteristics of the transverse liquid jet.

2.2.2. Visualization Test System

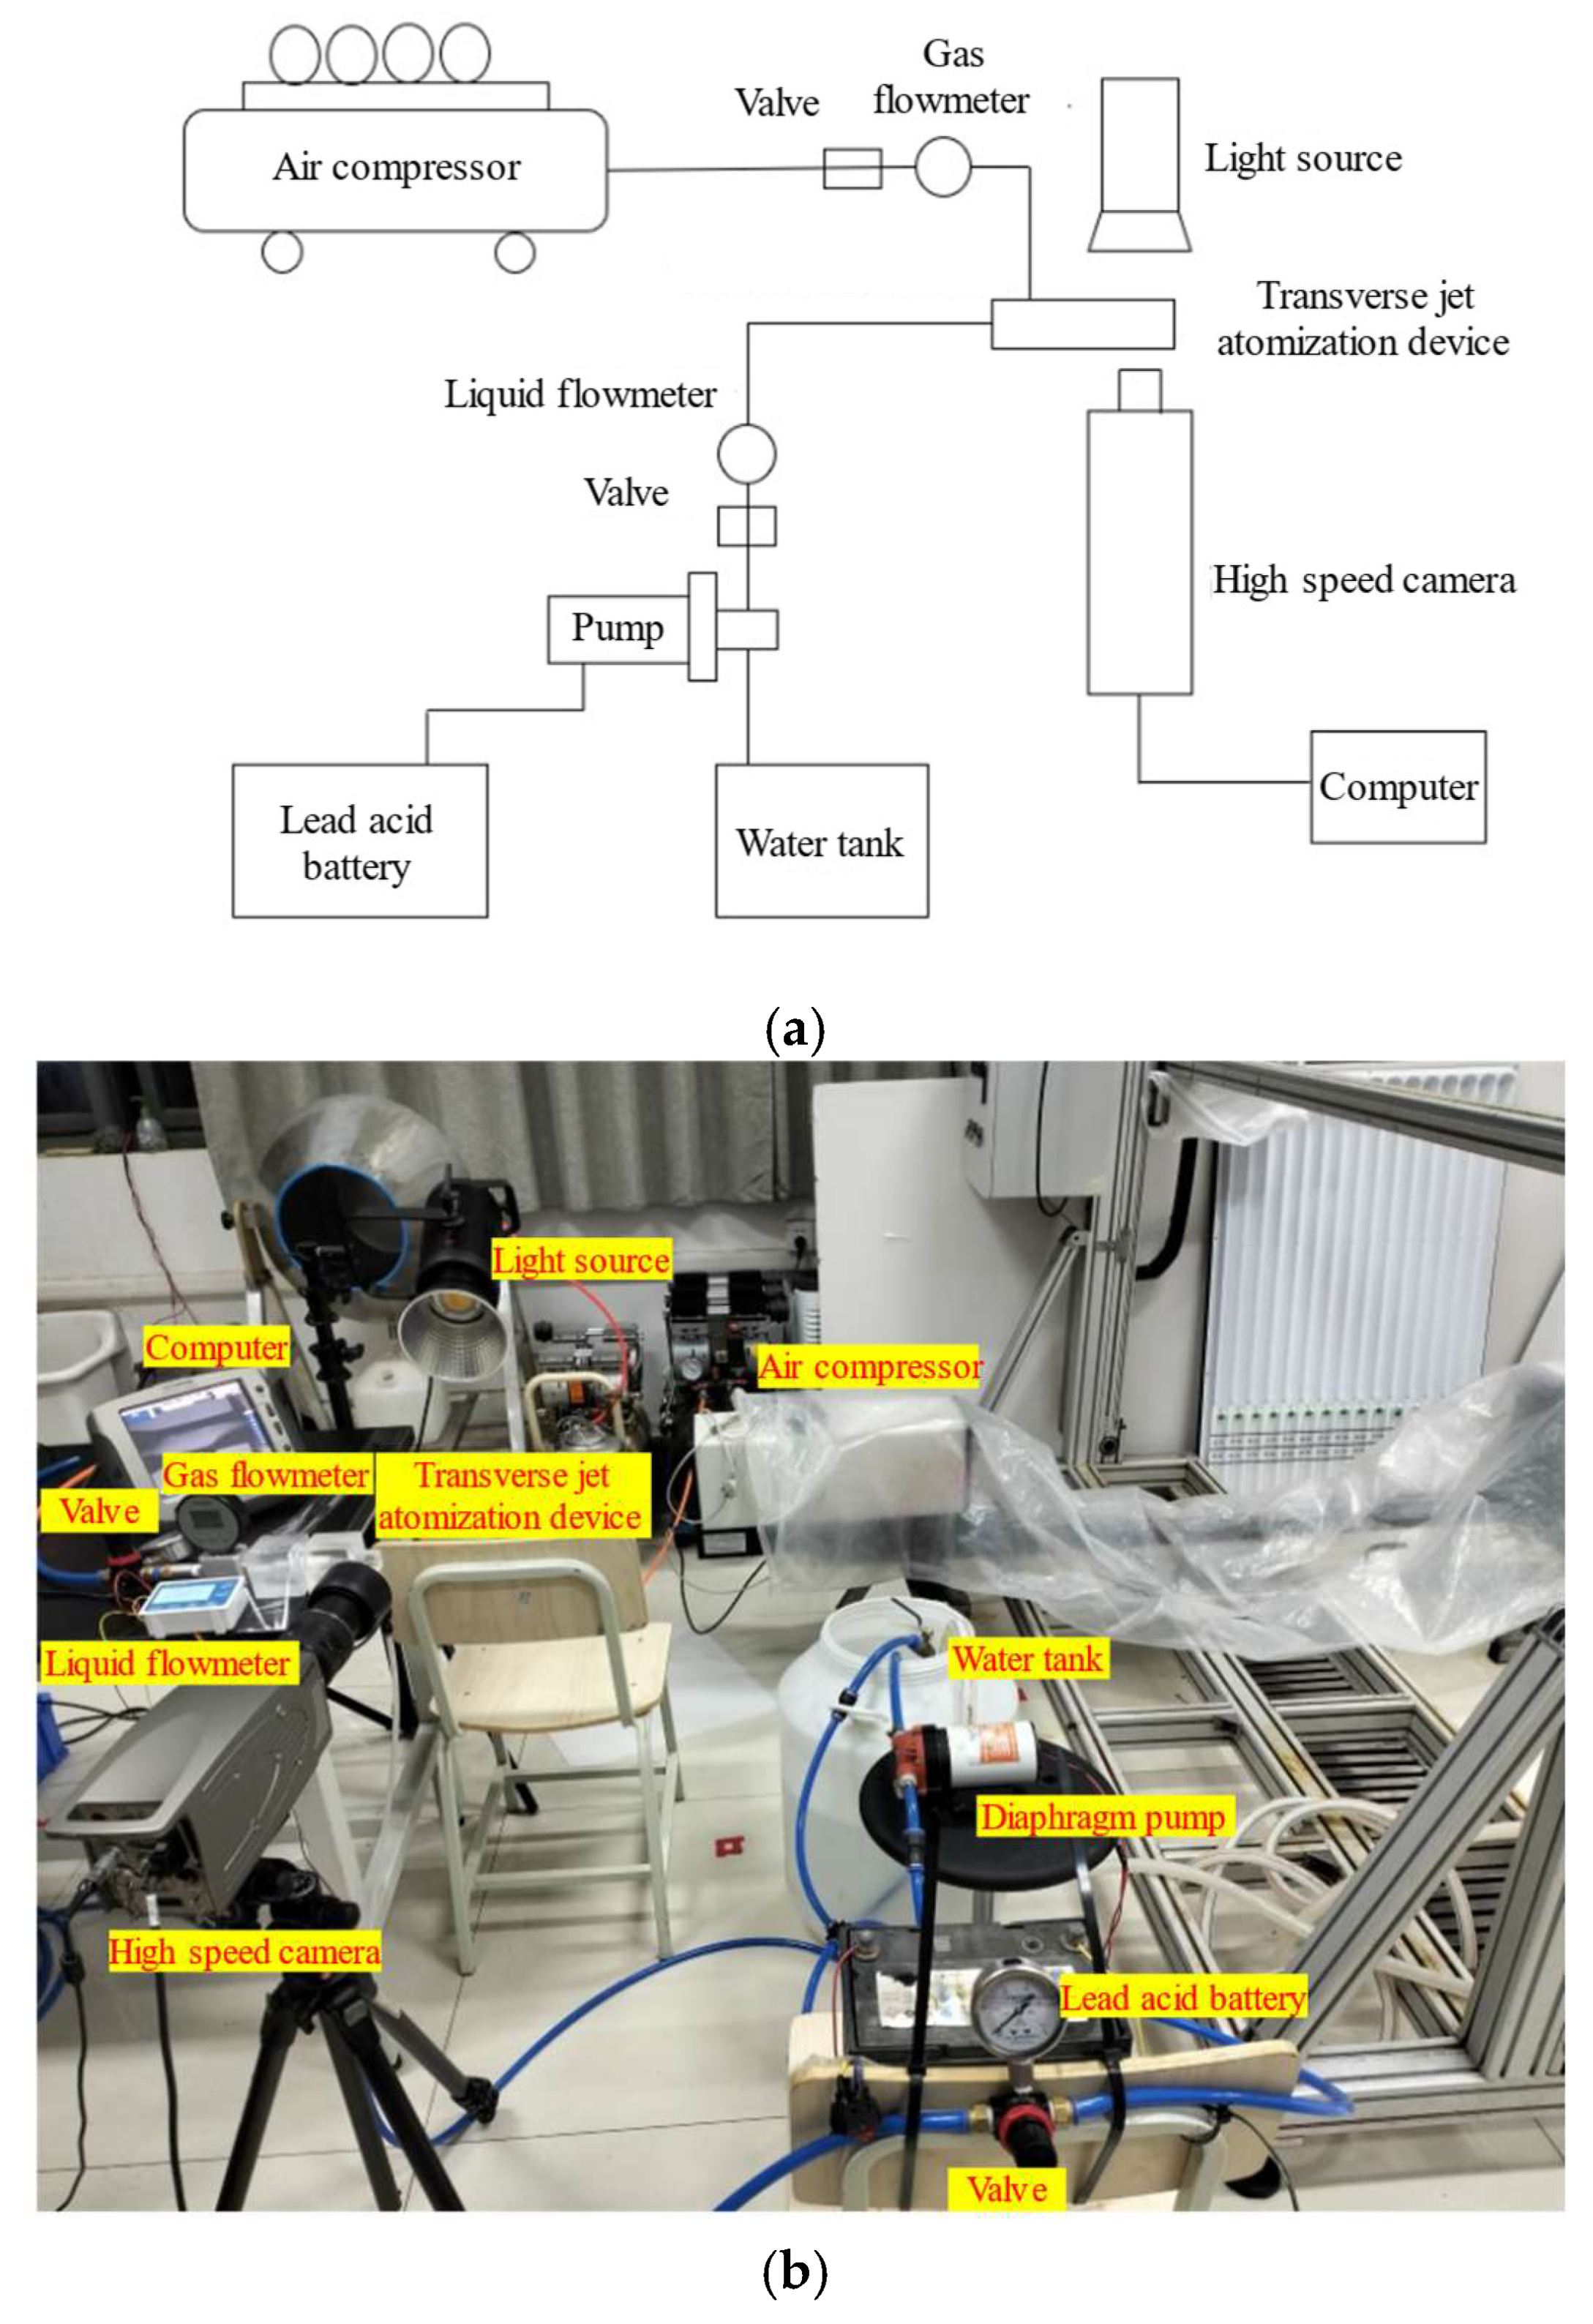
The visualization setup consists of an imaging system and a transverse jet atomization system, with the experimental setup depicted in Figure 4. The imaging system comprises a high-speed camera (i-Speed TR, Olympus Co., Shinjuku, Tokyo, Japan), a host computer, and a light source (Godox SL150II, 150 W, Shenniu, Shenzhen, China). High-speed imaging technology was employed to capture the flow characteristic of the transverse jet. The captured images were processed using Image-Pro (Plus 6.0) software to extract the jet characteristics.
In the transverse jet atomization system, the atomization device is powered by both the air compressor (Model: S1600W*2-60 L, 300 L, 7 bar, Outstanding; Taizhou, China) and the diaphragm pump (Model: SFDP1-013-100-22, 0–5 L/min, outlet pressure: 0–6.9 bar, Seaflo; Xiamen, China), which provide compressed airflow and liquid jet flow, respectively. The gas flow meter (AMS2106, 0–300 L/min, Chongqing, China) and valve (AR2000, 0–0.4 MPa, Airtac, Taiwan, China) are installed between the atomization device and the compressor, while the liquid flow meter (ZJ-LCD-M, 0–1000 L/min, Dijiang, Guangzhou, China) and valve are placed between the atomization device and the diaphragm pump to enable precise control and monitoring of airflow and liquid flow rates. The diaphragm pump is powered by a lead–acid battery (12 V, Luotuo, Xiangyang, China), which pumps water from the tank (250 L, Linfeng, Jinan, China) to the atomization device.

2.2.3. Transverse Jet Atomization Test System

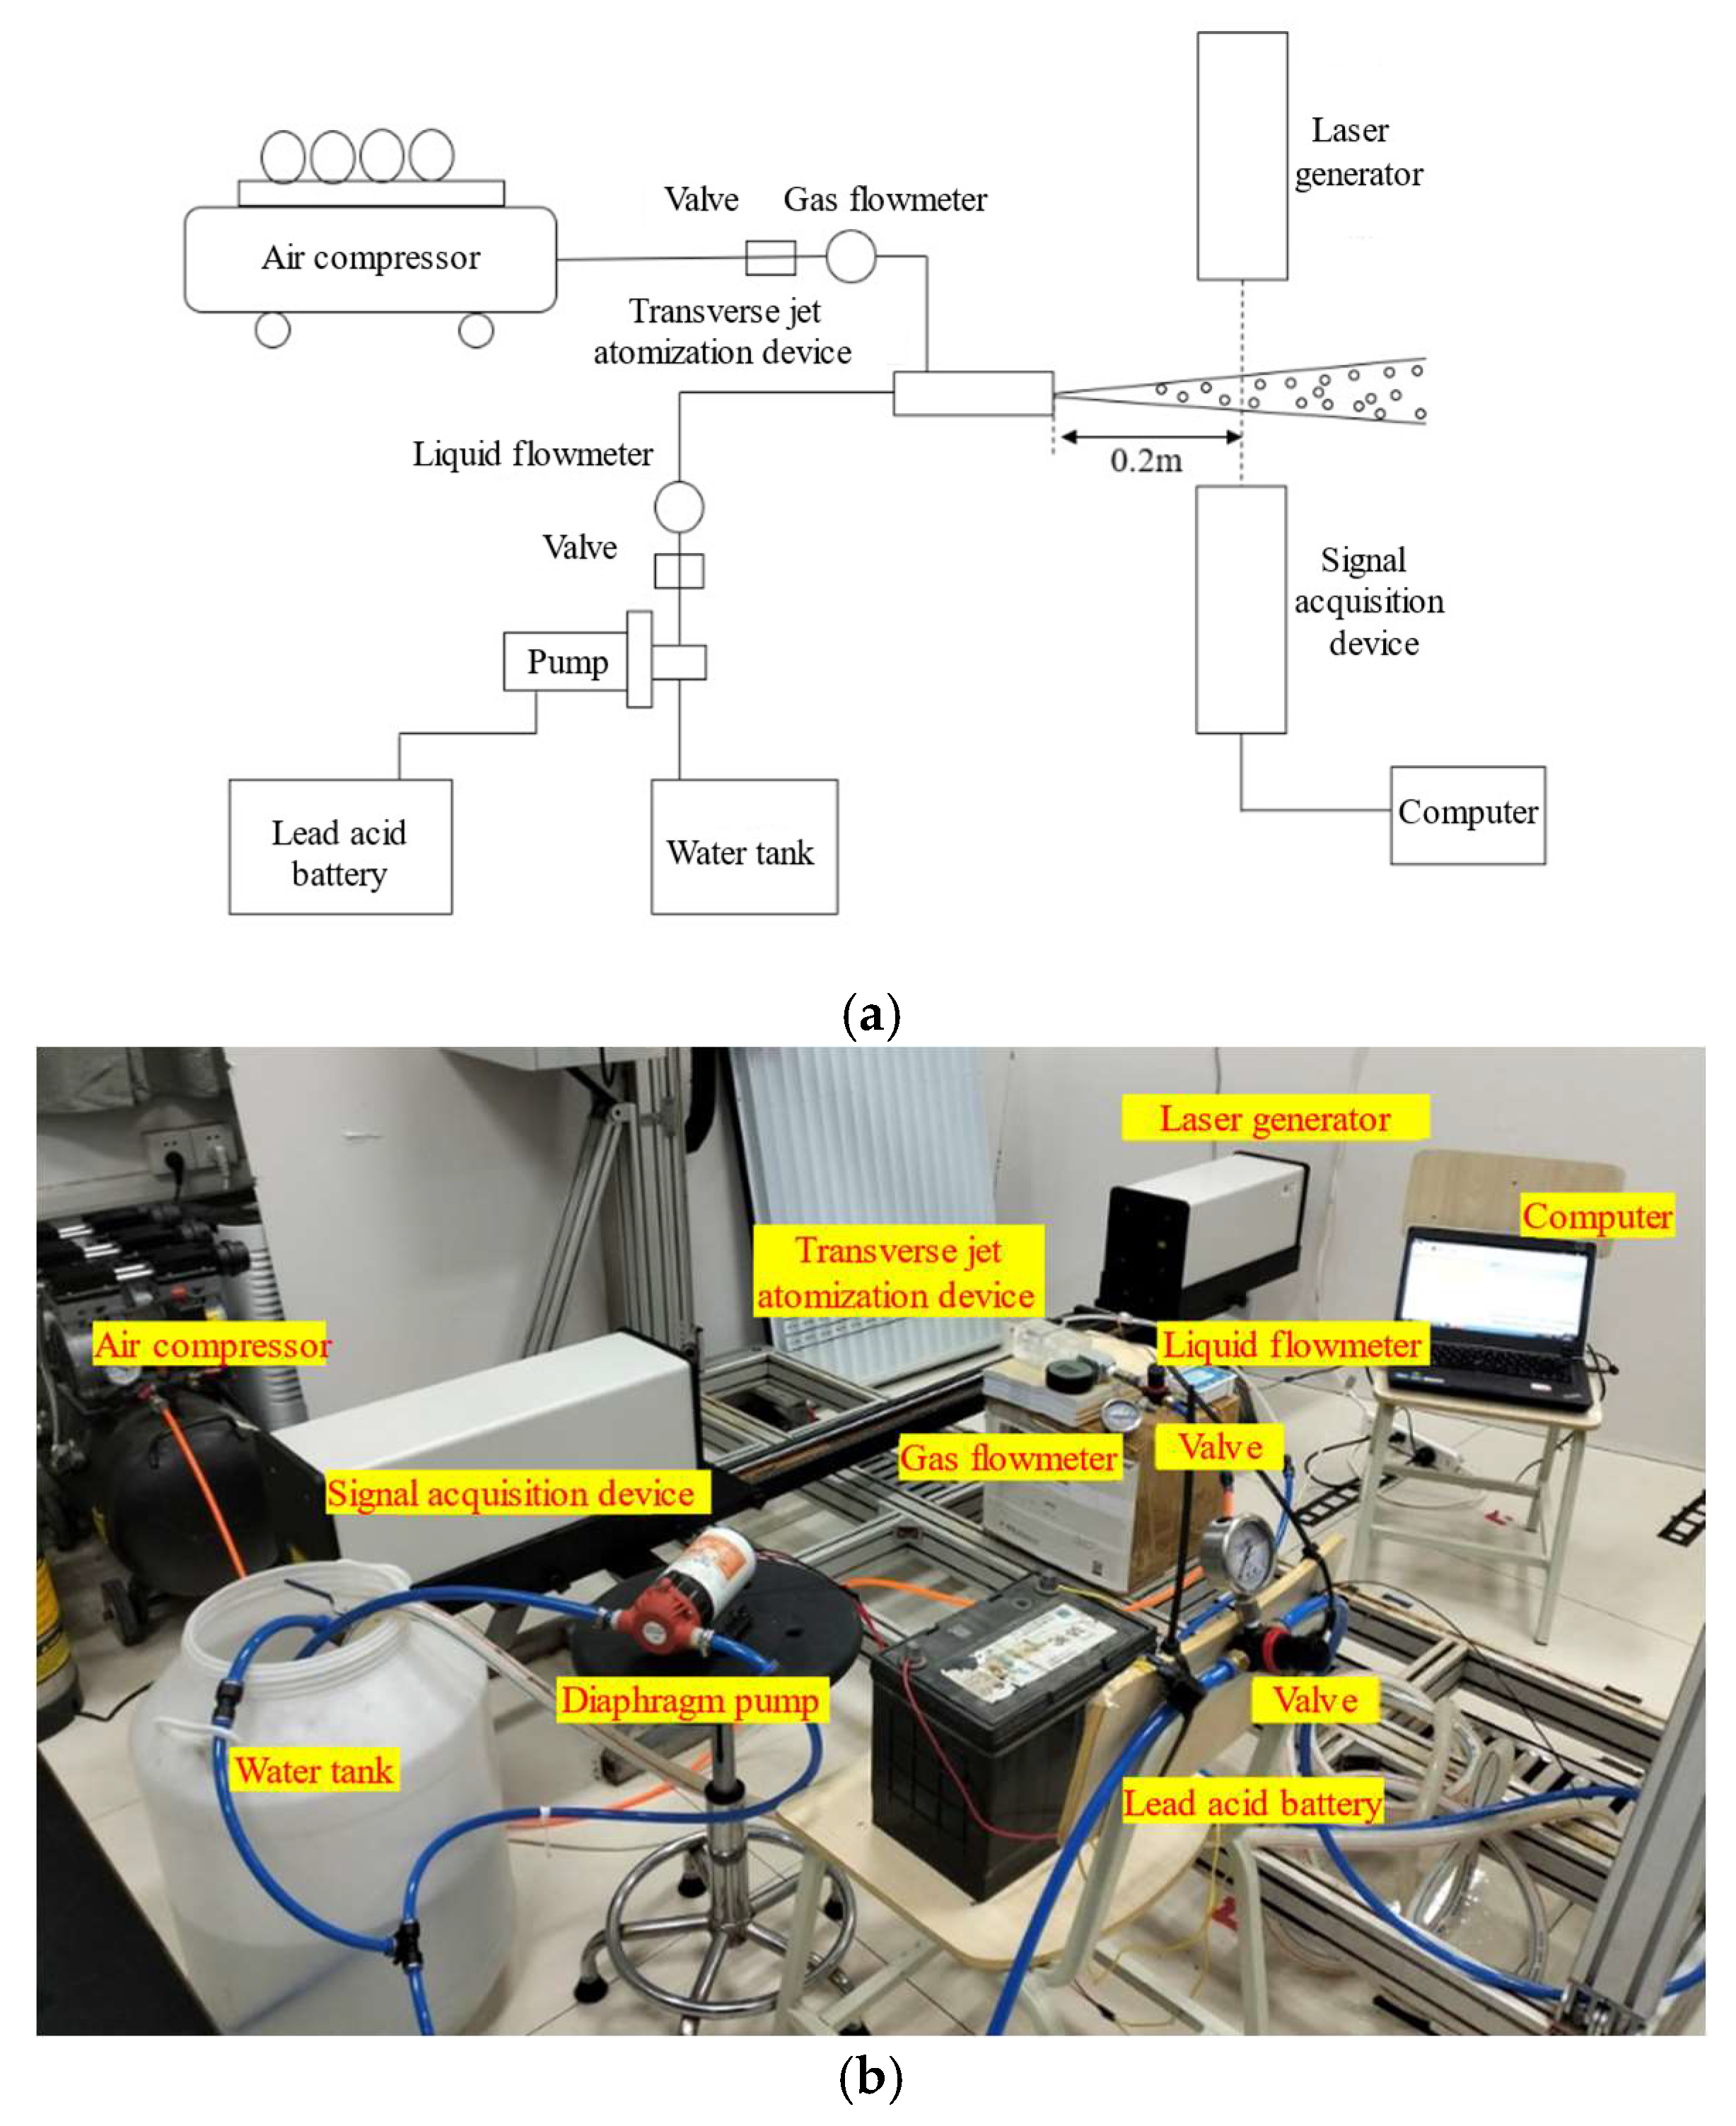
Droplet size is a key parameter for assessing the performance of transverse jet atomization. In this study, a laser particle size analyzer was used to perform atomization tests, and the experimental setup is shown in Figure 5.
The transverse jet atomization test system comprises two main components: the particle size measurement system and the transverse jet atomization system, which aligns with the visualization test system. The particle size measurement system primarily consists of a laser particle size analyzer (OMEC DP-02, 0.5–1500 µm, Guangzhou, China) and accompanying analysis software (OMEK, Spray Sizer System). The laser particle size analyzer comprises a laser generator and a signal acquisition device. The software can obtain droplet size information, including D10, VMD, and D90. In this experiment, the transverse jet atomization device is positioned on the centerline of the collimated laser generator and the signal acquisition device, at the same horizontal level as the emitted laser beam, maintaining a distance of 0.2 m to ensure that the sprayed droplets pass through the laser beam successfully.

2.3. Experimental Design

To investigate the effects of factors such as liquid incidence angle (θ) and the Weber number of liquid and gas (Wel, Wea) on the penetration depth and atomization effect of transverse jets, the experimental parameters for the visualization and atomization tests are set as the liquid incidence angle, gas flow rate Qa, and liquid flow rate Ql, as shown in Table 1.
The gas medium used is air (ρa = 1.17 kg/m3), while the liquid is tap water (ρl = 996 kg/m3; surface tension σ = 7.2 × 10⁻² N/m). When the gas medium is air, in the temperature range of 240 K ≤ T ≤ 2000 K and a pressure range of p < 10 × 105 Pa, it can be approximated as an ideal gas. And the tap water is treated as an incompressible fluid. The flow rates of the high-velocity airflow and liquid jets are measured using both gas flow meters and liquid flow meters. The velocities of these jets are calculated using Equation (16).
v j = Q j S j j = a , l
To systematically study the influence of liquid incidence angles (θ = 30°, 45°, 60°, 90°) on the atomization characteristics of transverse jets, this research uses Wea and Wel as controlled variables. A total of 16 experimental conditions were tested, and the experimental parameters are presented in Table 2. To minimize the influence of environmental factors and more accurately observe the flow characteristics of the liquid jet, this experiment was conducted in a closed laboratory with no wind, humidity maintained at 47% ± 5%, and temperature kept at 25 °C ± 2 °C.

2.4. Data Process

The high-speed imaging system was configured with a spatial resolution of 528 × 400 pixels and an exposure time of 2.16 μs, effectively minimizing motion blur during image capture. A total of 10,000 images were recorded over 3 s for each test condition. From these, 50 randomly selected frames were overlaid to enhance image clarity and statistical reliability. A diffuser made of acrylic was positioned between the backlight and the jet to provide uniform illumination across the field of view. This configuration ensures accurate capture of jet morphology and droplet structures for subsequent analysis. In the visualization tests and atomization tests, each test was repeated three times, and the mean value was used as the experimental result for analysis.
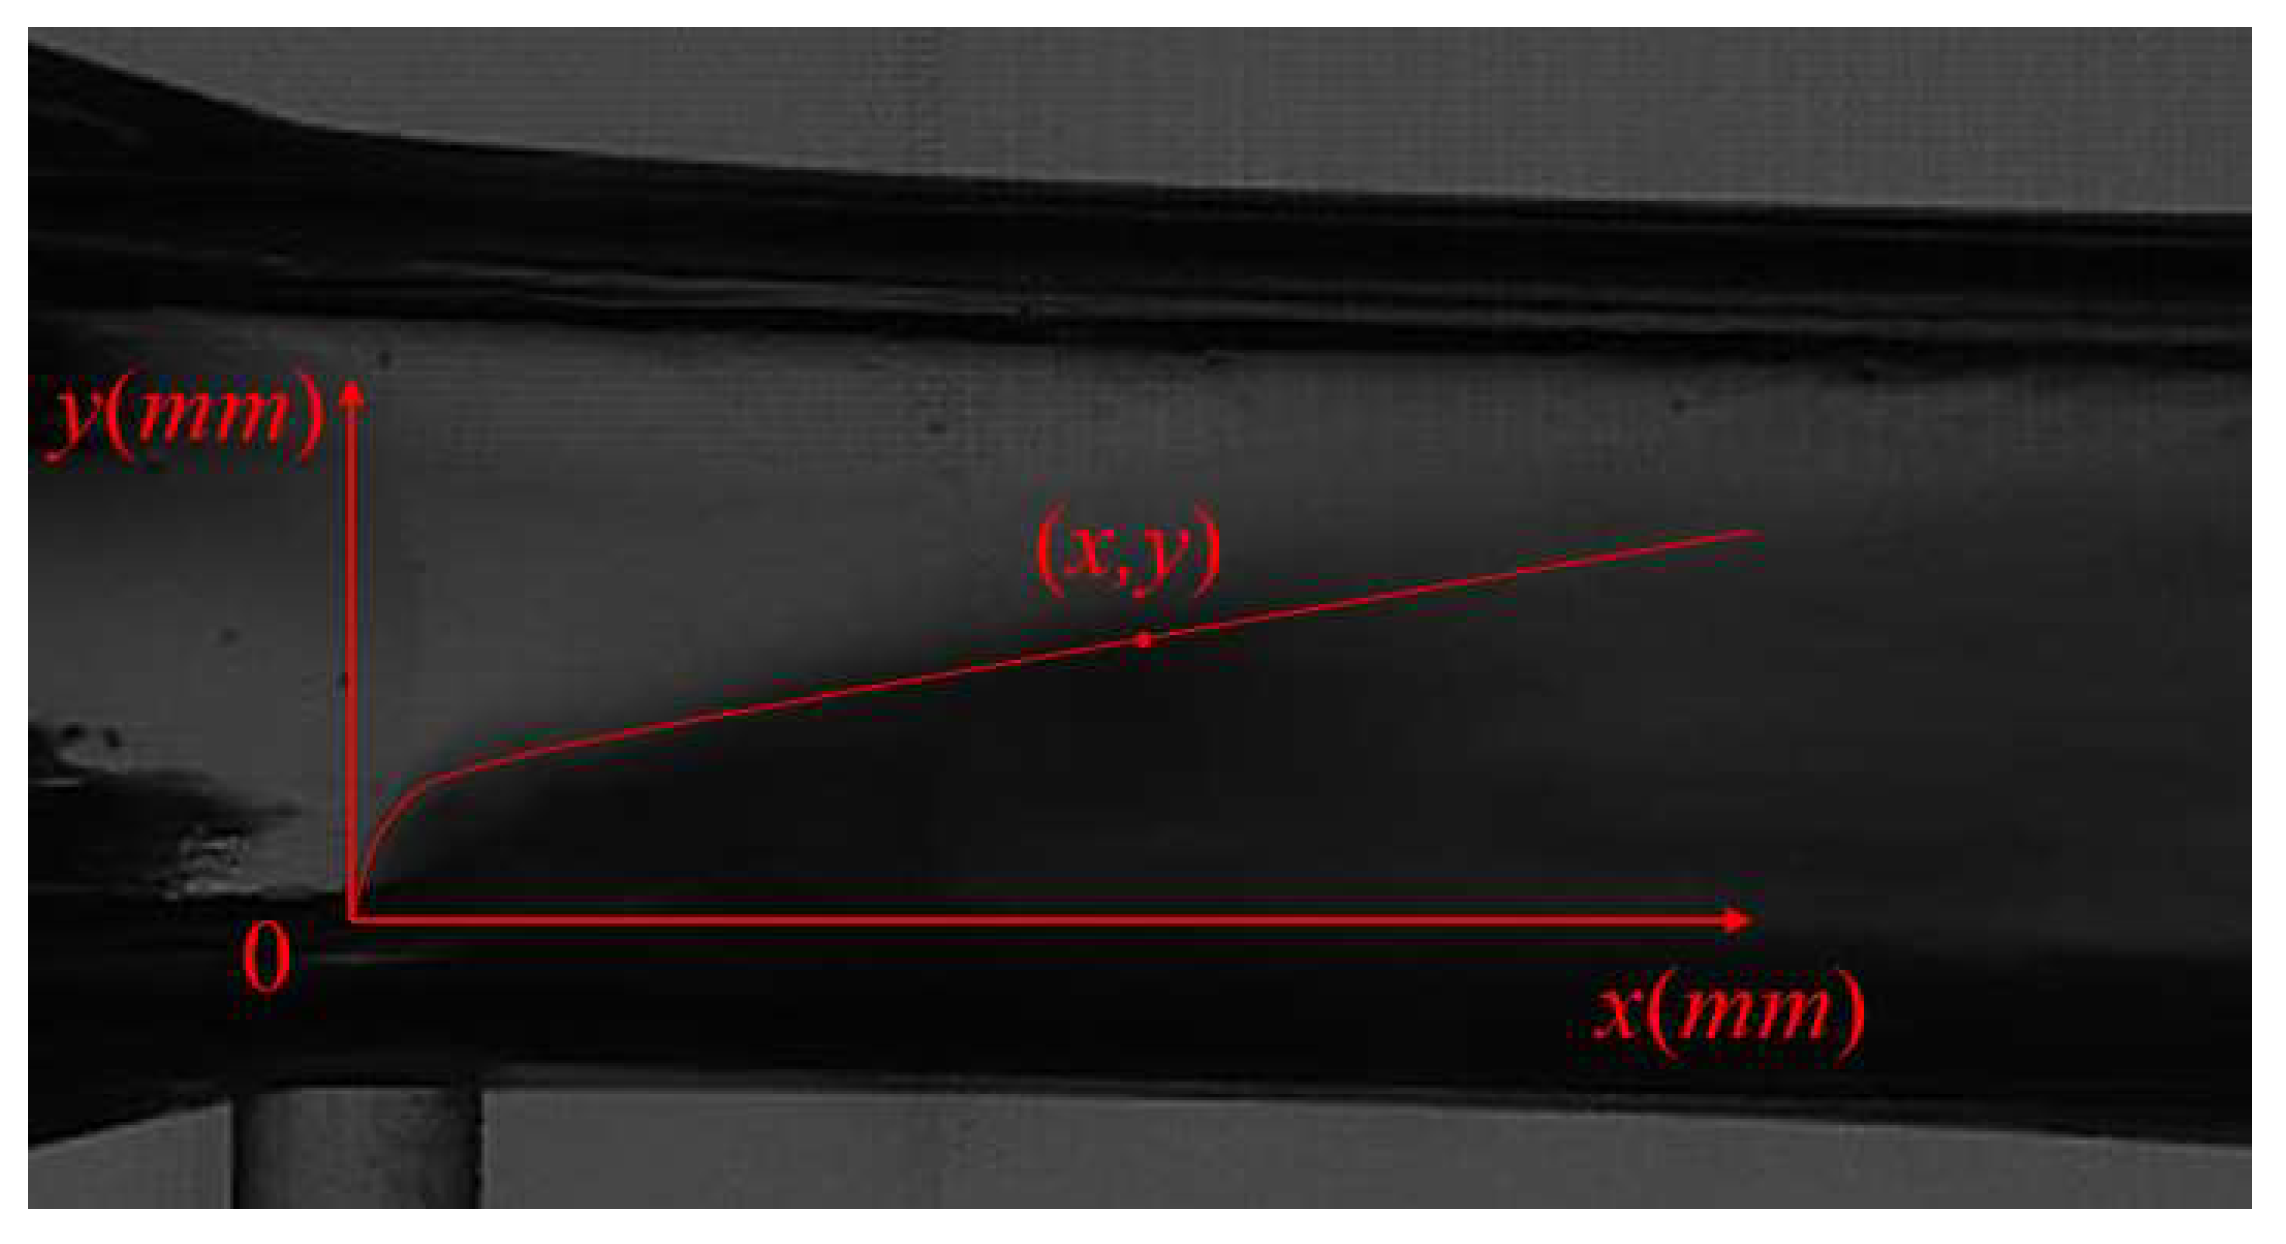
Figure 6 illustrates a schematic diagram of visualization test data processing. The coordinate origin is set at the center of the liquid inlet orifice, with the x-axis aligned with the direction of crossflow and the y-axis perpendicular to this direction, establishing the coordinate system and plotting the boundary curves.

3. Results and Discussion

3.1. Results and Analysis of Visualization Test

3.1.1. Effect of Weber Number on Penetration Depth

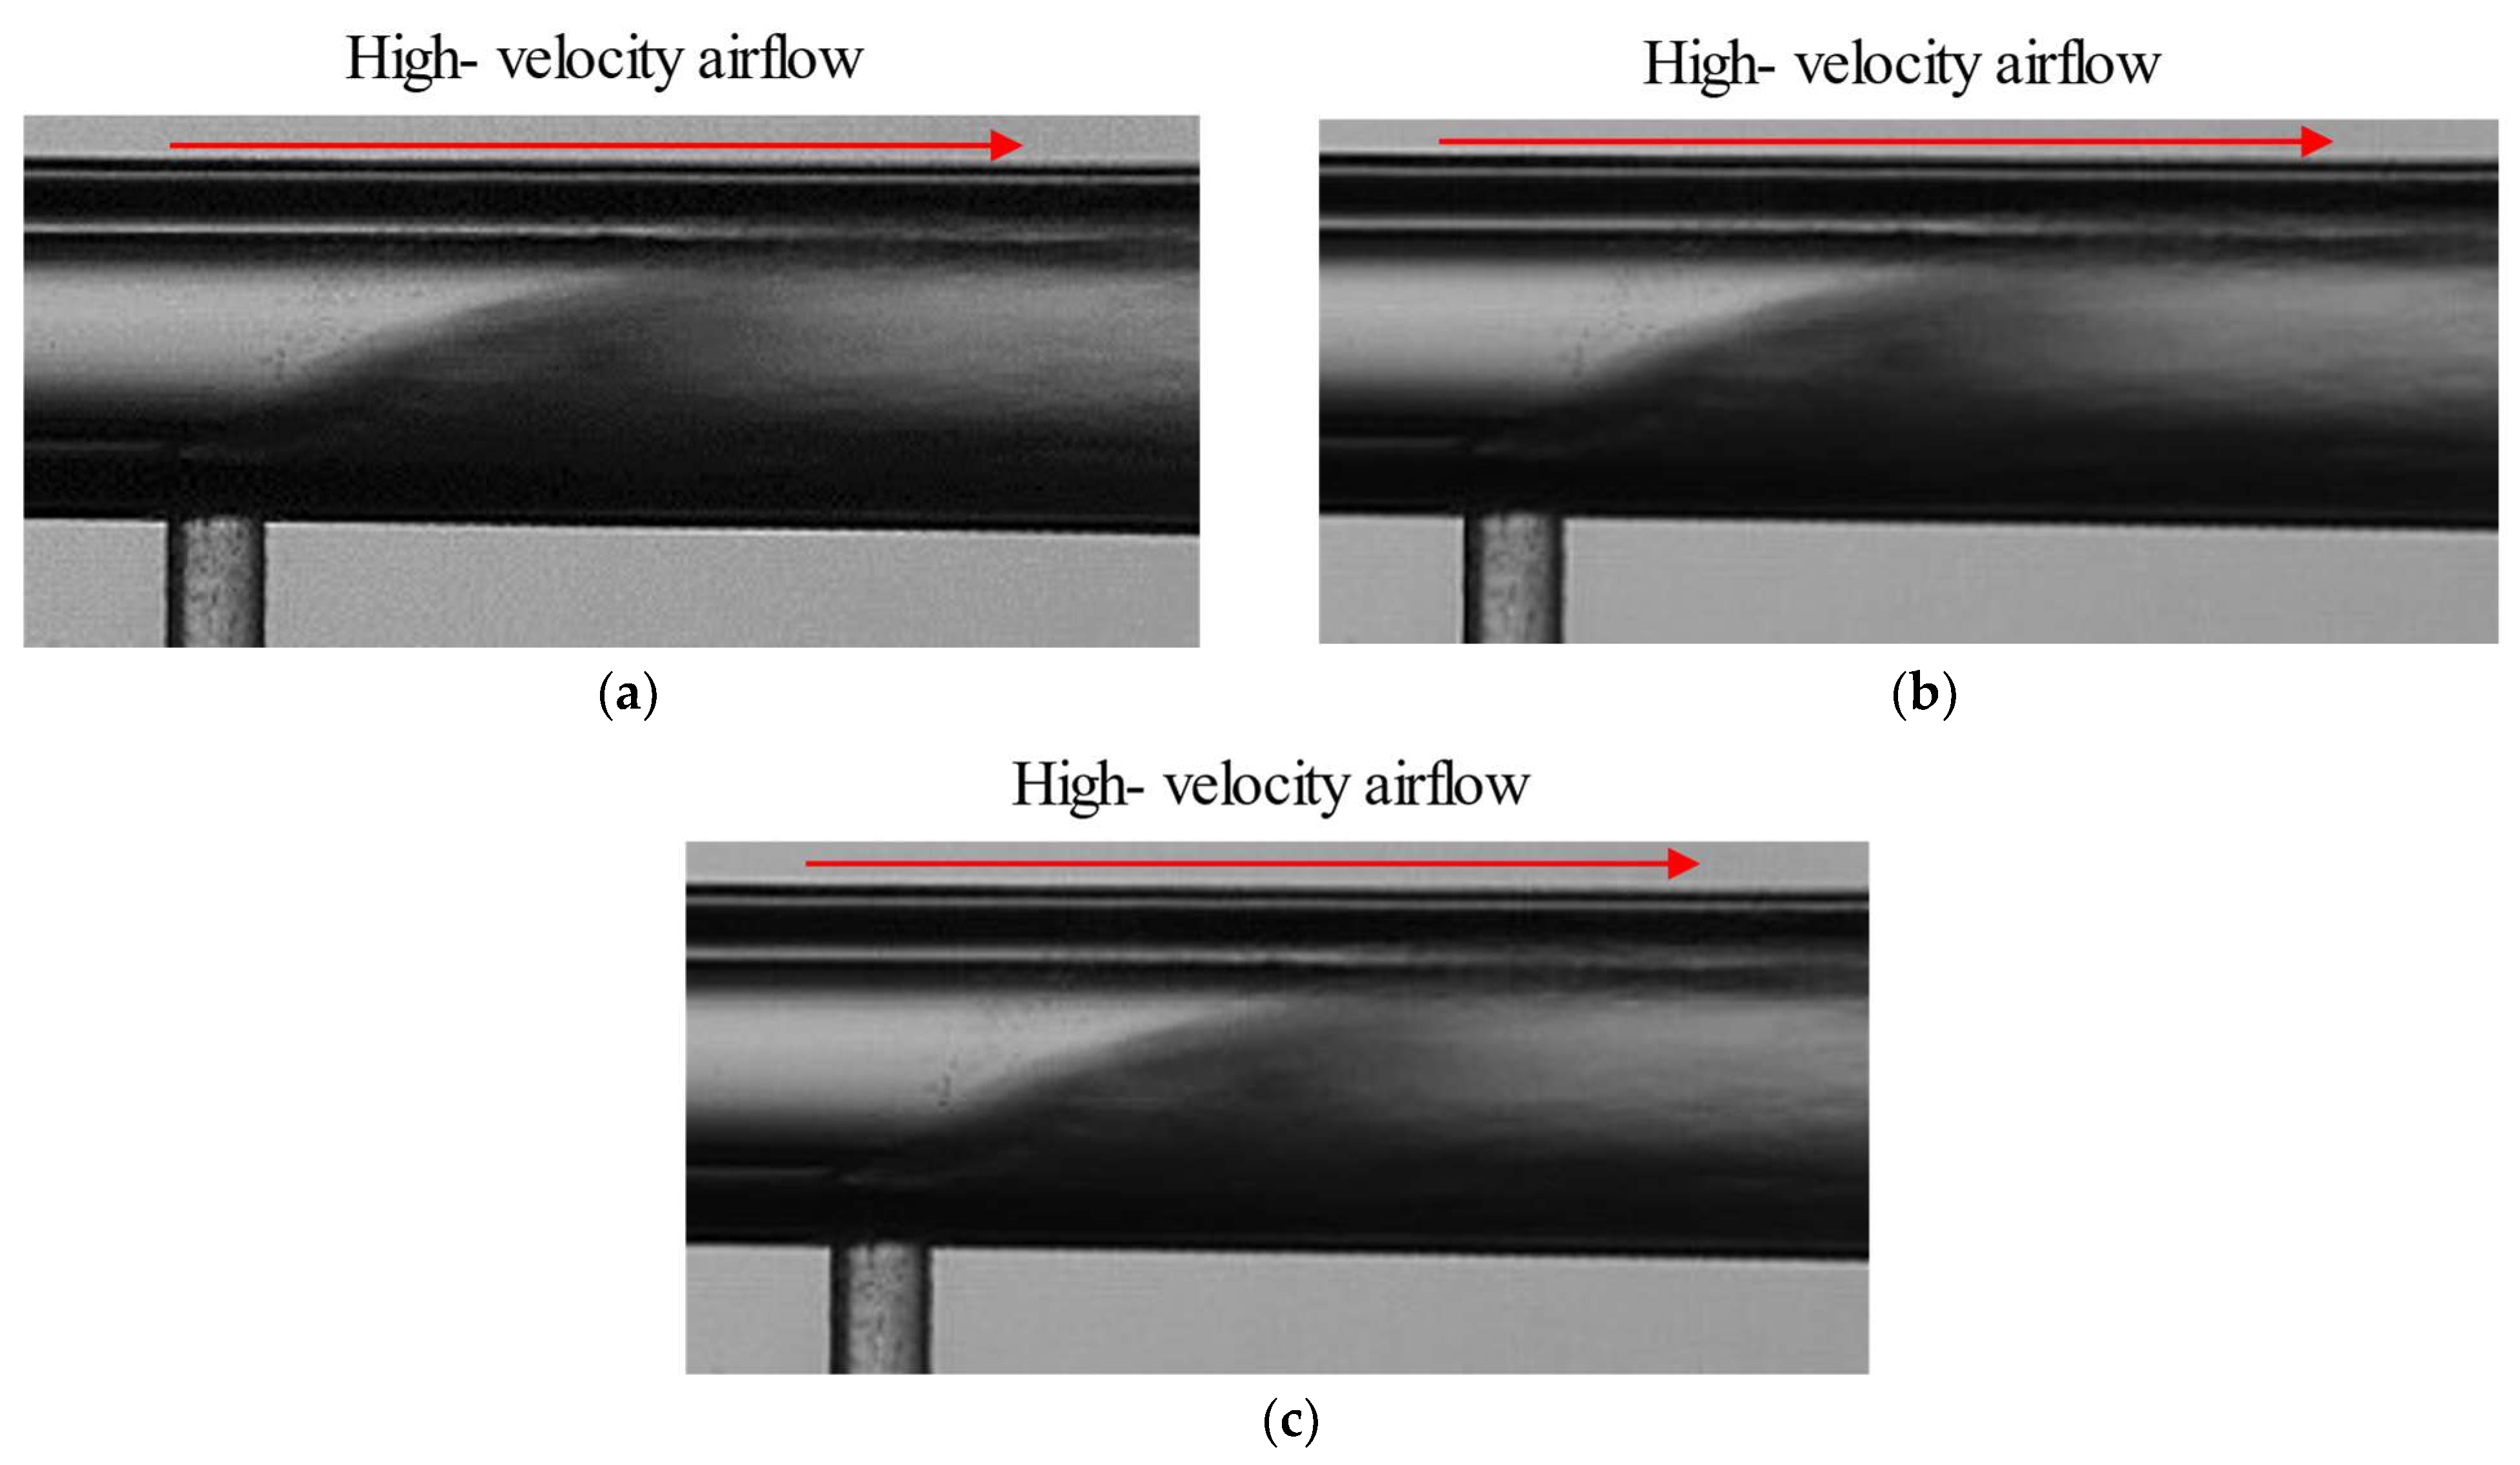
To investigate the influence of Wea and Wel on penetration depth, the experimental results at a liquid incidence angle of 90° are taken as an example. A comparative analysis of the results from Tests 3, 13, and 15 is shown in Figure 7. The Wel for Tests 3 and 15 are the same (Wel = 331.39), while the Wea for Tests 13 and 15 are equal (Wea = 1914.09).
The images of penetration depth for transverse jets in Tests 3 and 15, shown in Figure 7, indicate that when the Wel are constant, an increase in Wea leads to a decrease in penetration depth. Conversely, the penetration depth images for Tests 13 and 15 show that when the Wea are constant, an increase in Wel results in increased penetration depth.
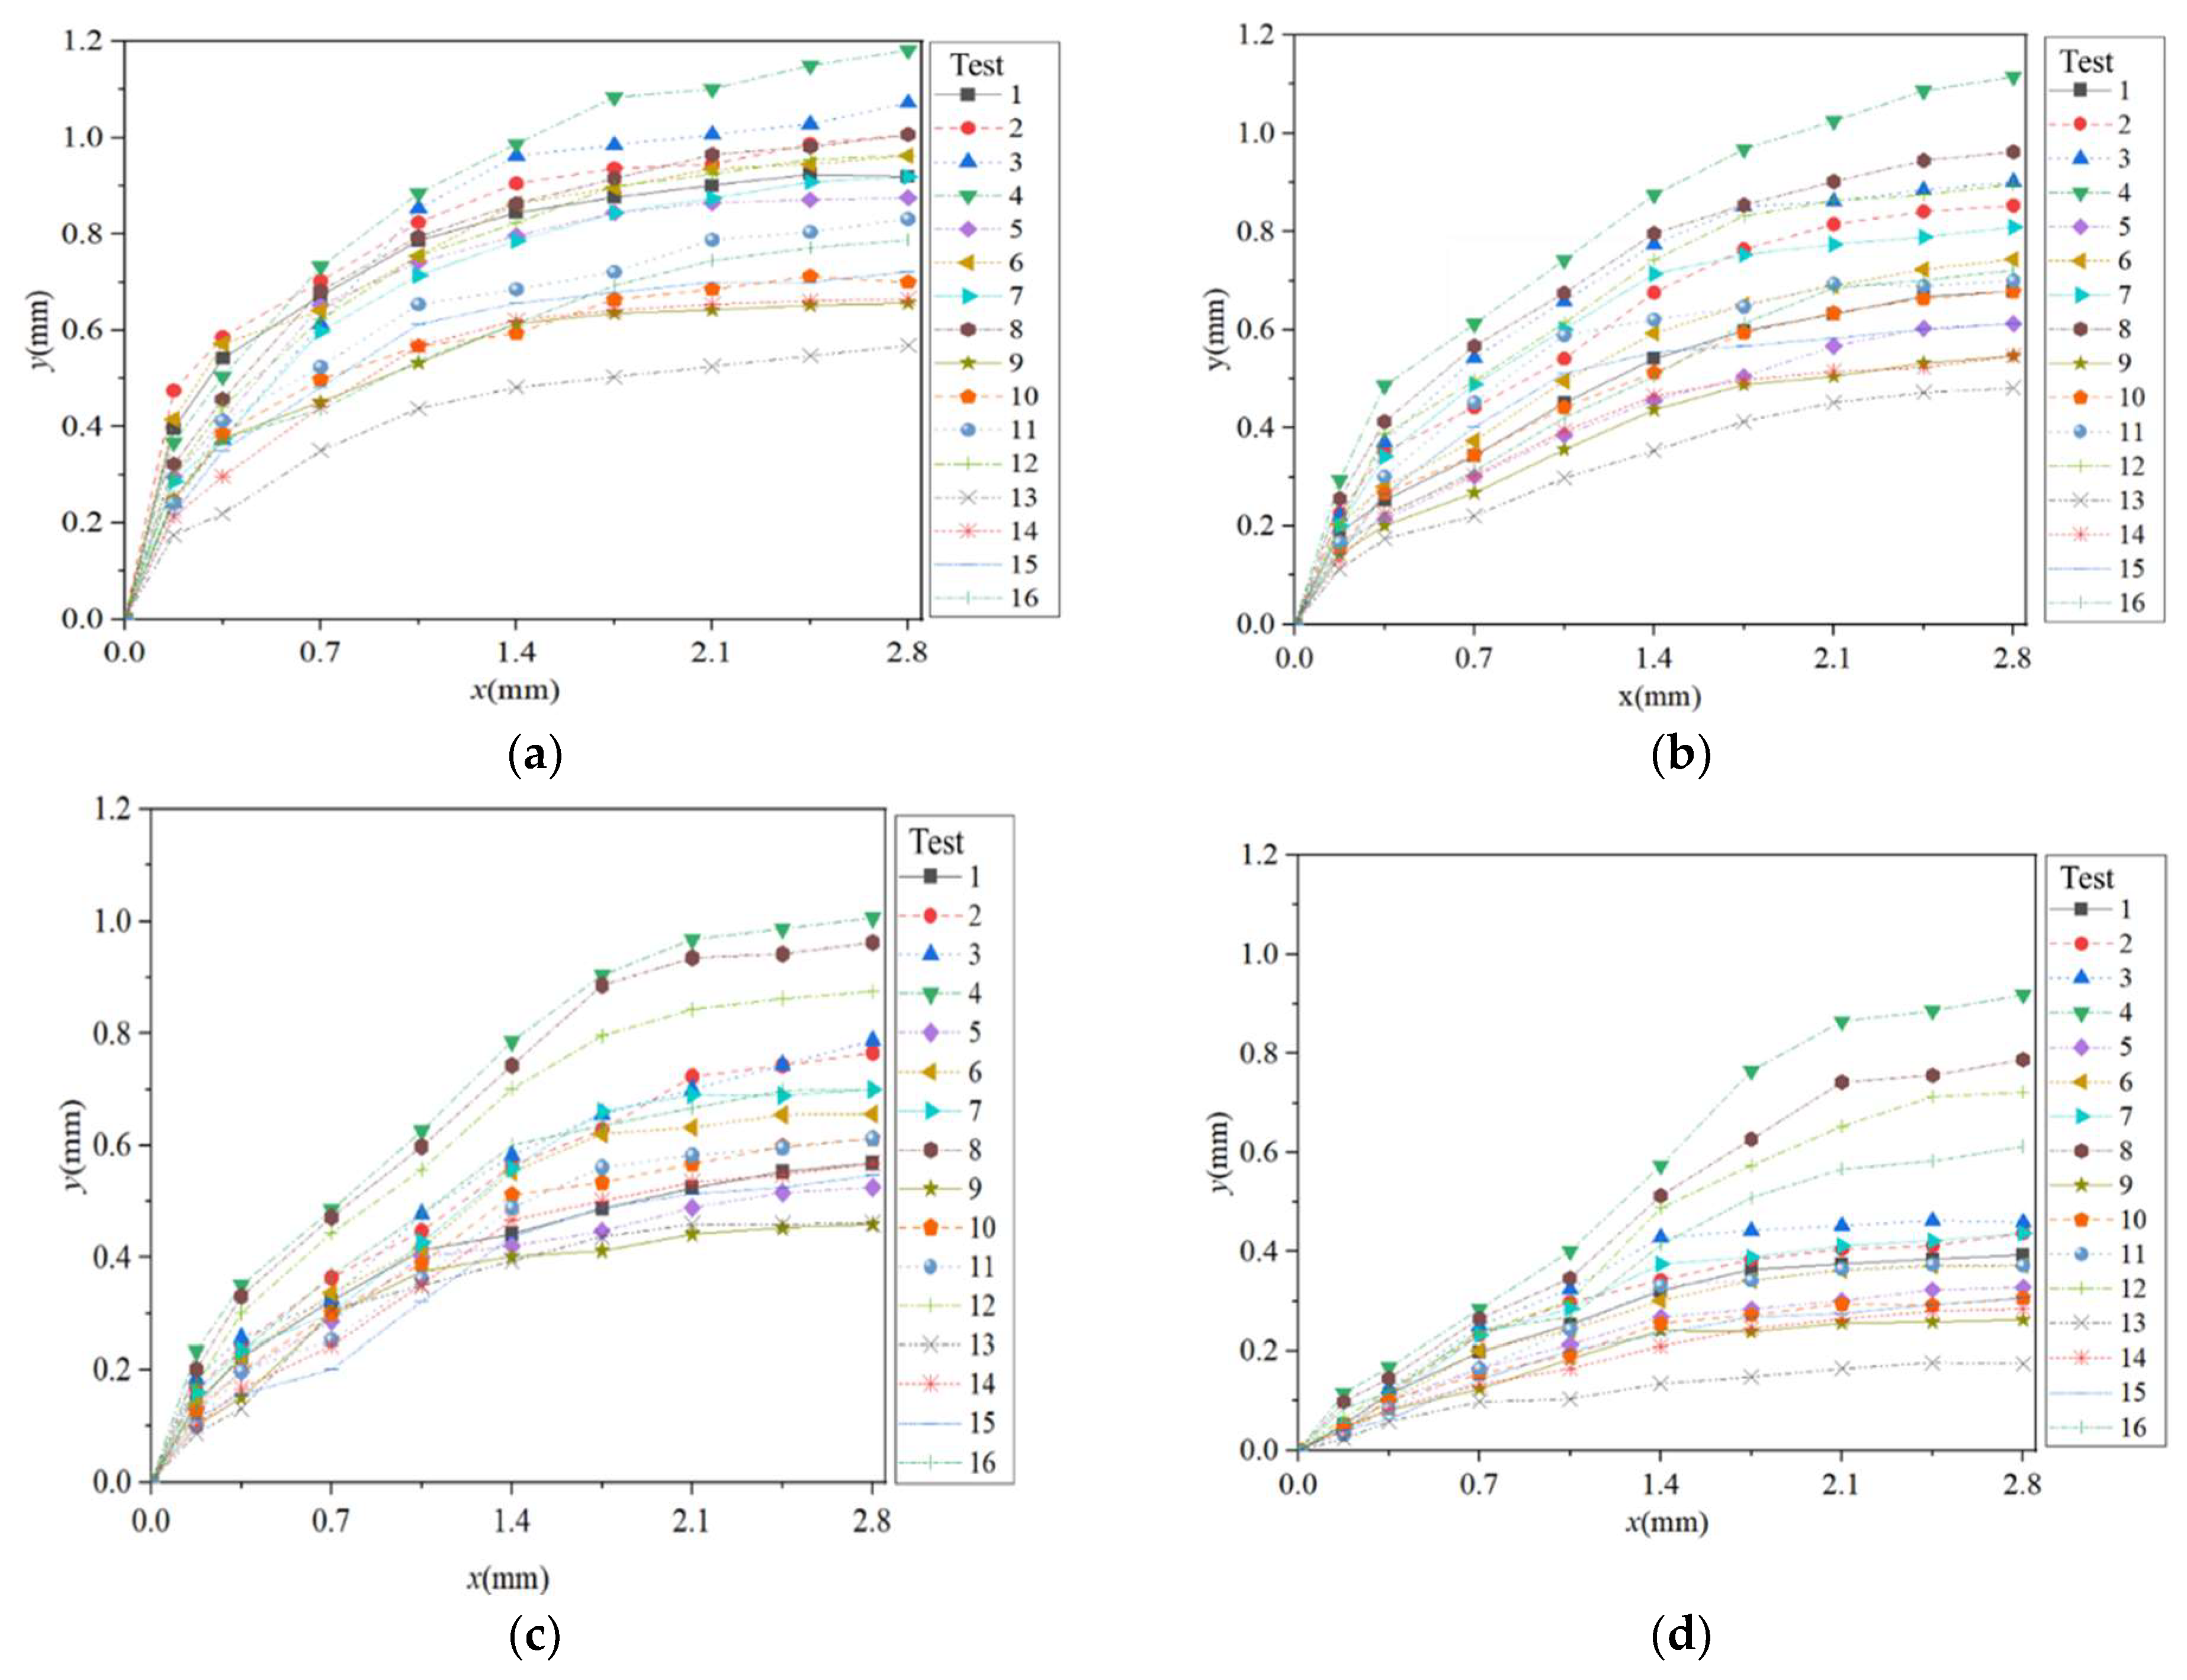
To clearly illustrate the penetration depth results for each test, the boundary curves representing the atomization penetration depth of the transverse jets are presented in Figure 8. When Wea remains constant and Wel increases from 36.82 to 331.39, the increase in jet momentum delays the jet’s bending, thus enhancing the penetration depth [30]. Conversely, when Wel is constant and Wea increases from 418.02 to 1914.09, the dynamic pressure from the crossflow on the jet column causes transverse expansion of the jet, increasing the airflow’s impingement force on the liquid jet and reducing the penetration depth.

3.1.2. Effect of Incidence Angle on Penetration Depth

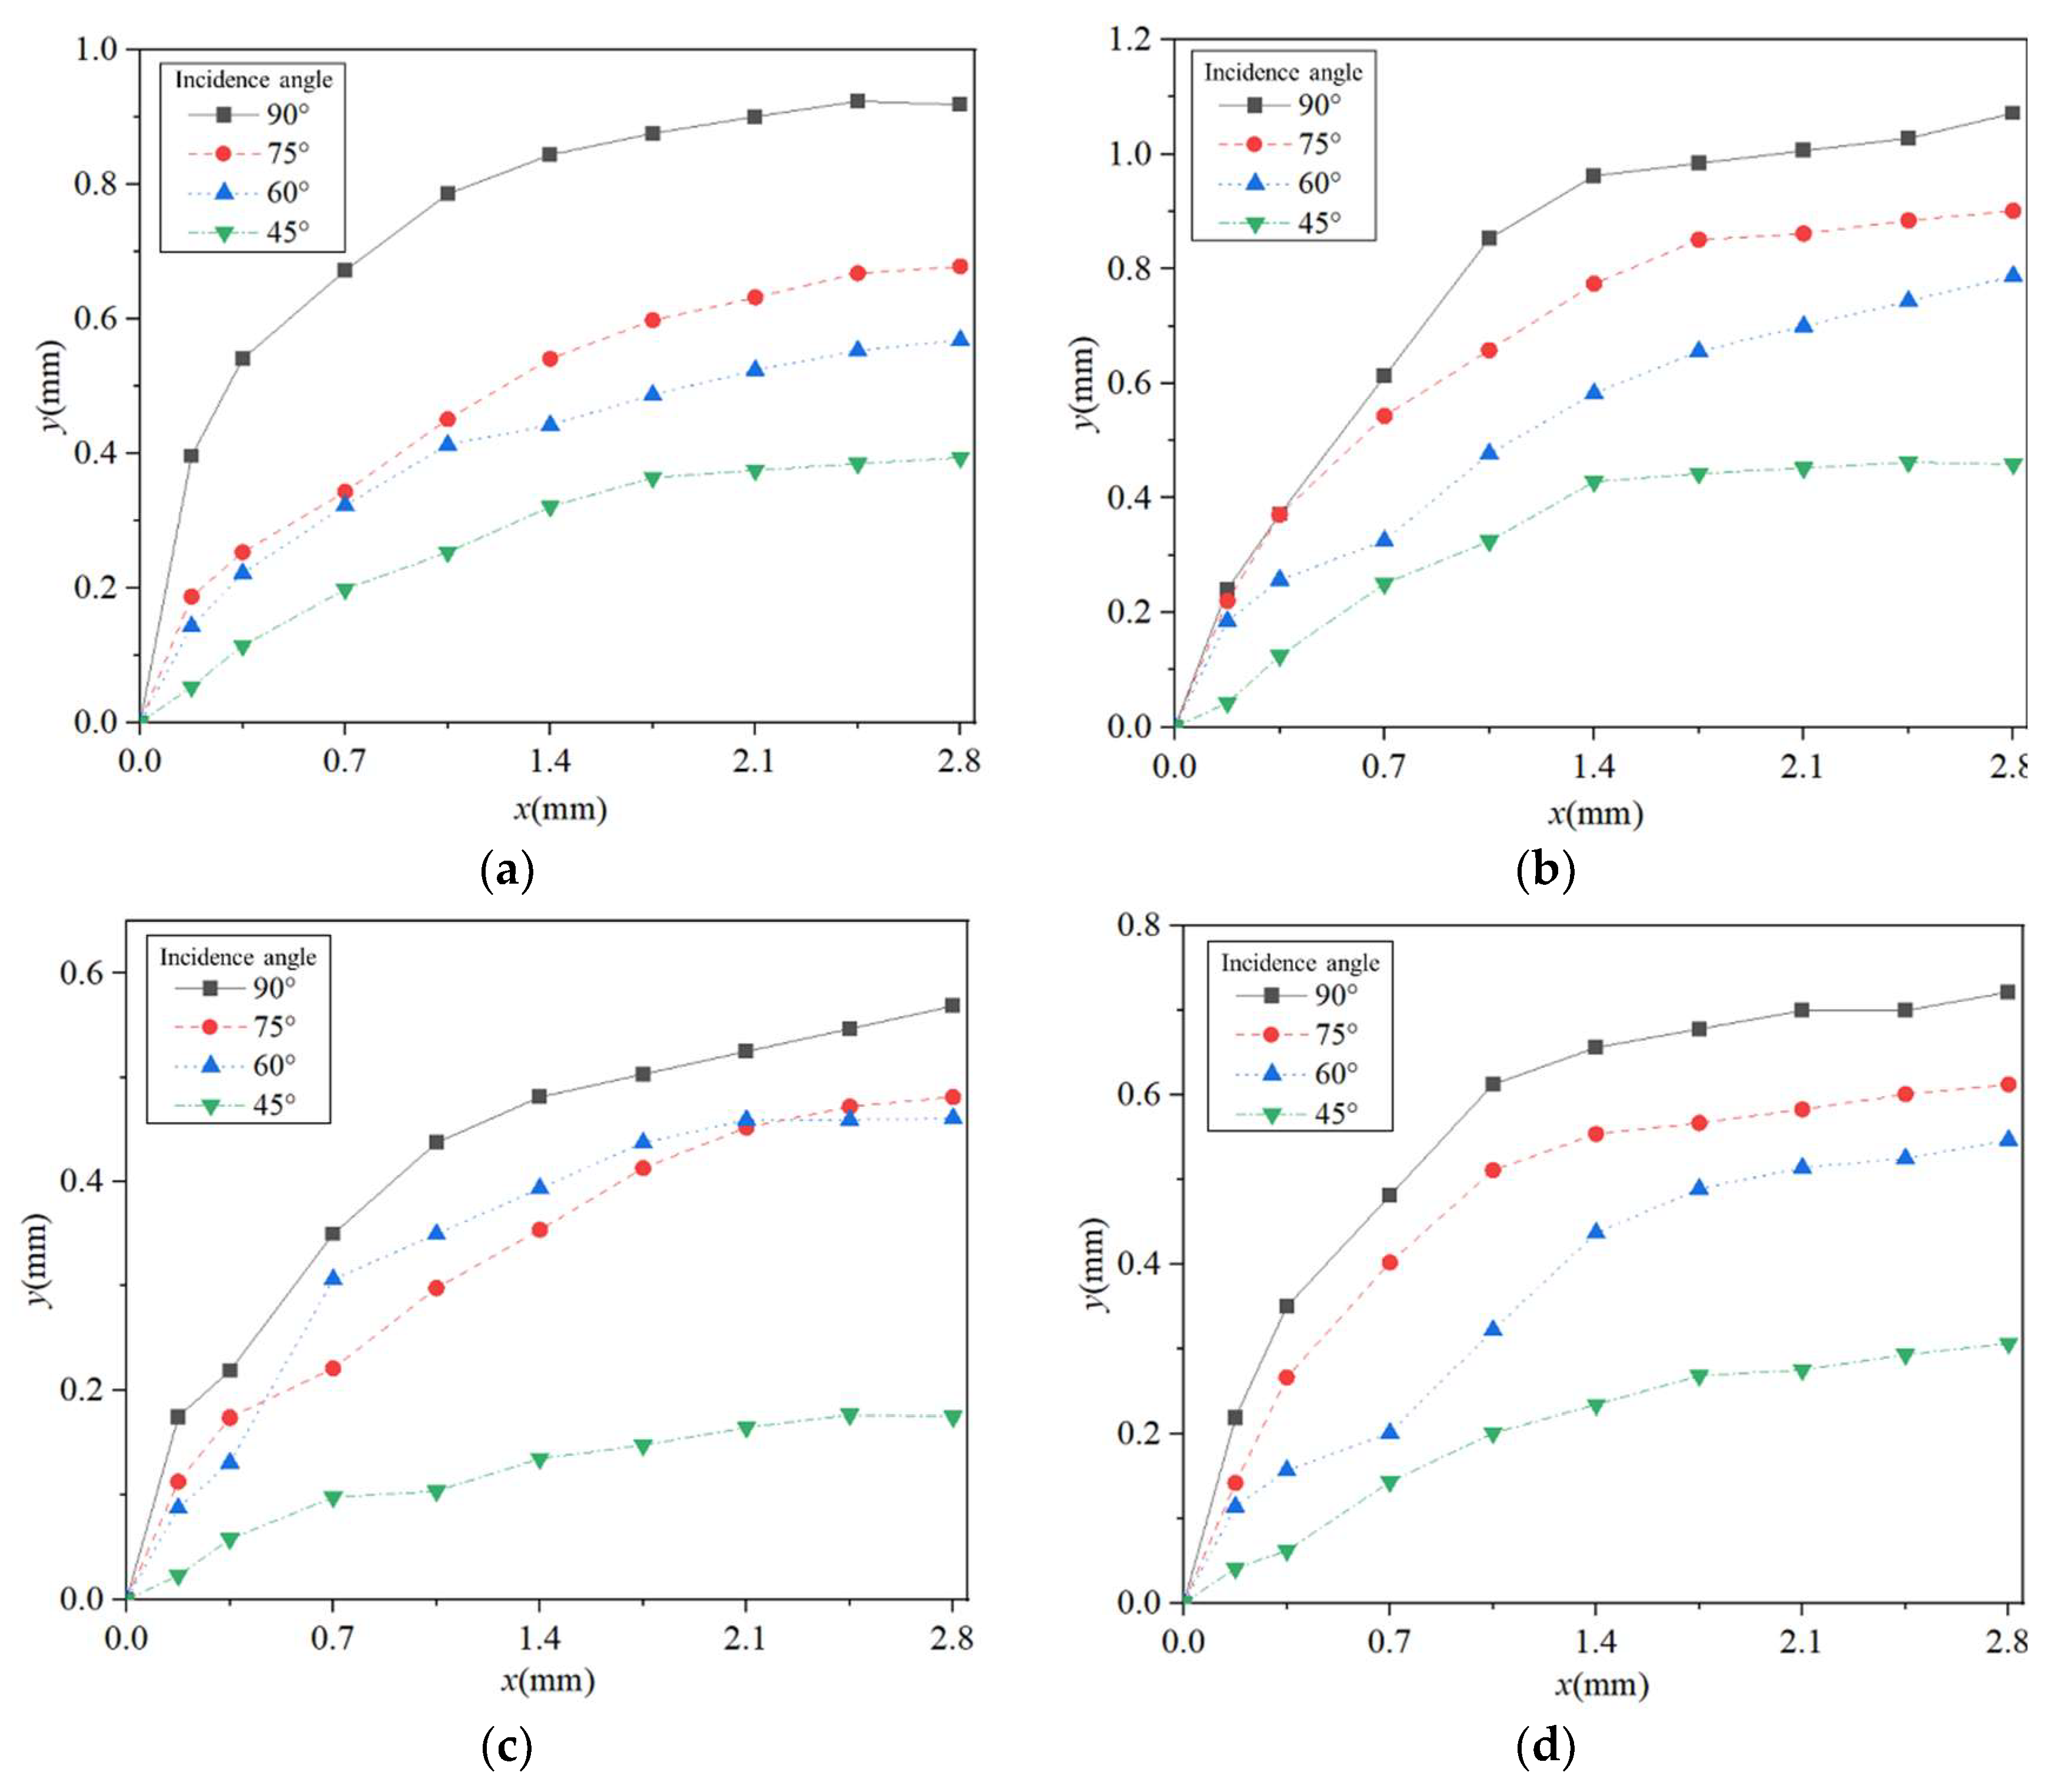
This study aims to reveal the regulatory mechanism of liquid incidence angles on penetration depth through a comparative analysis of typical tests. Boundary curves for Tests 1, 3, 13, and 15 at different liquid incidence angles are plotted in Figure 9. The results show that a larger liquid incidence angle leads to a greater penetration depth. This occurs primarily because a reduced injection angle decreases the relative velocity difference between the liquid and airflow, thereby diminishing the influence of shear stress and the resulting shear fragmentation zone, which decrease penetration depth [31].
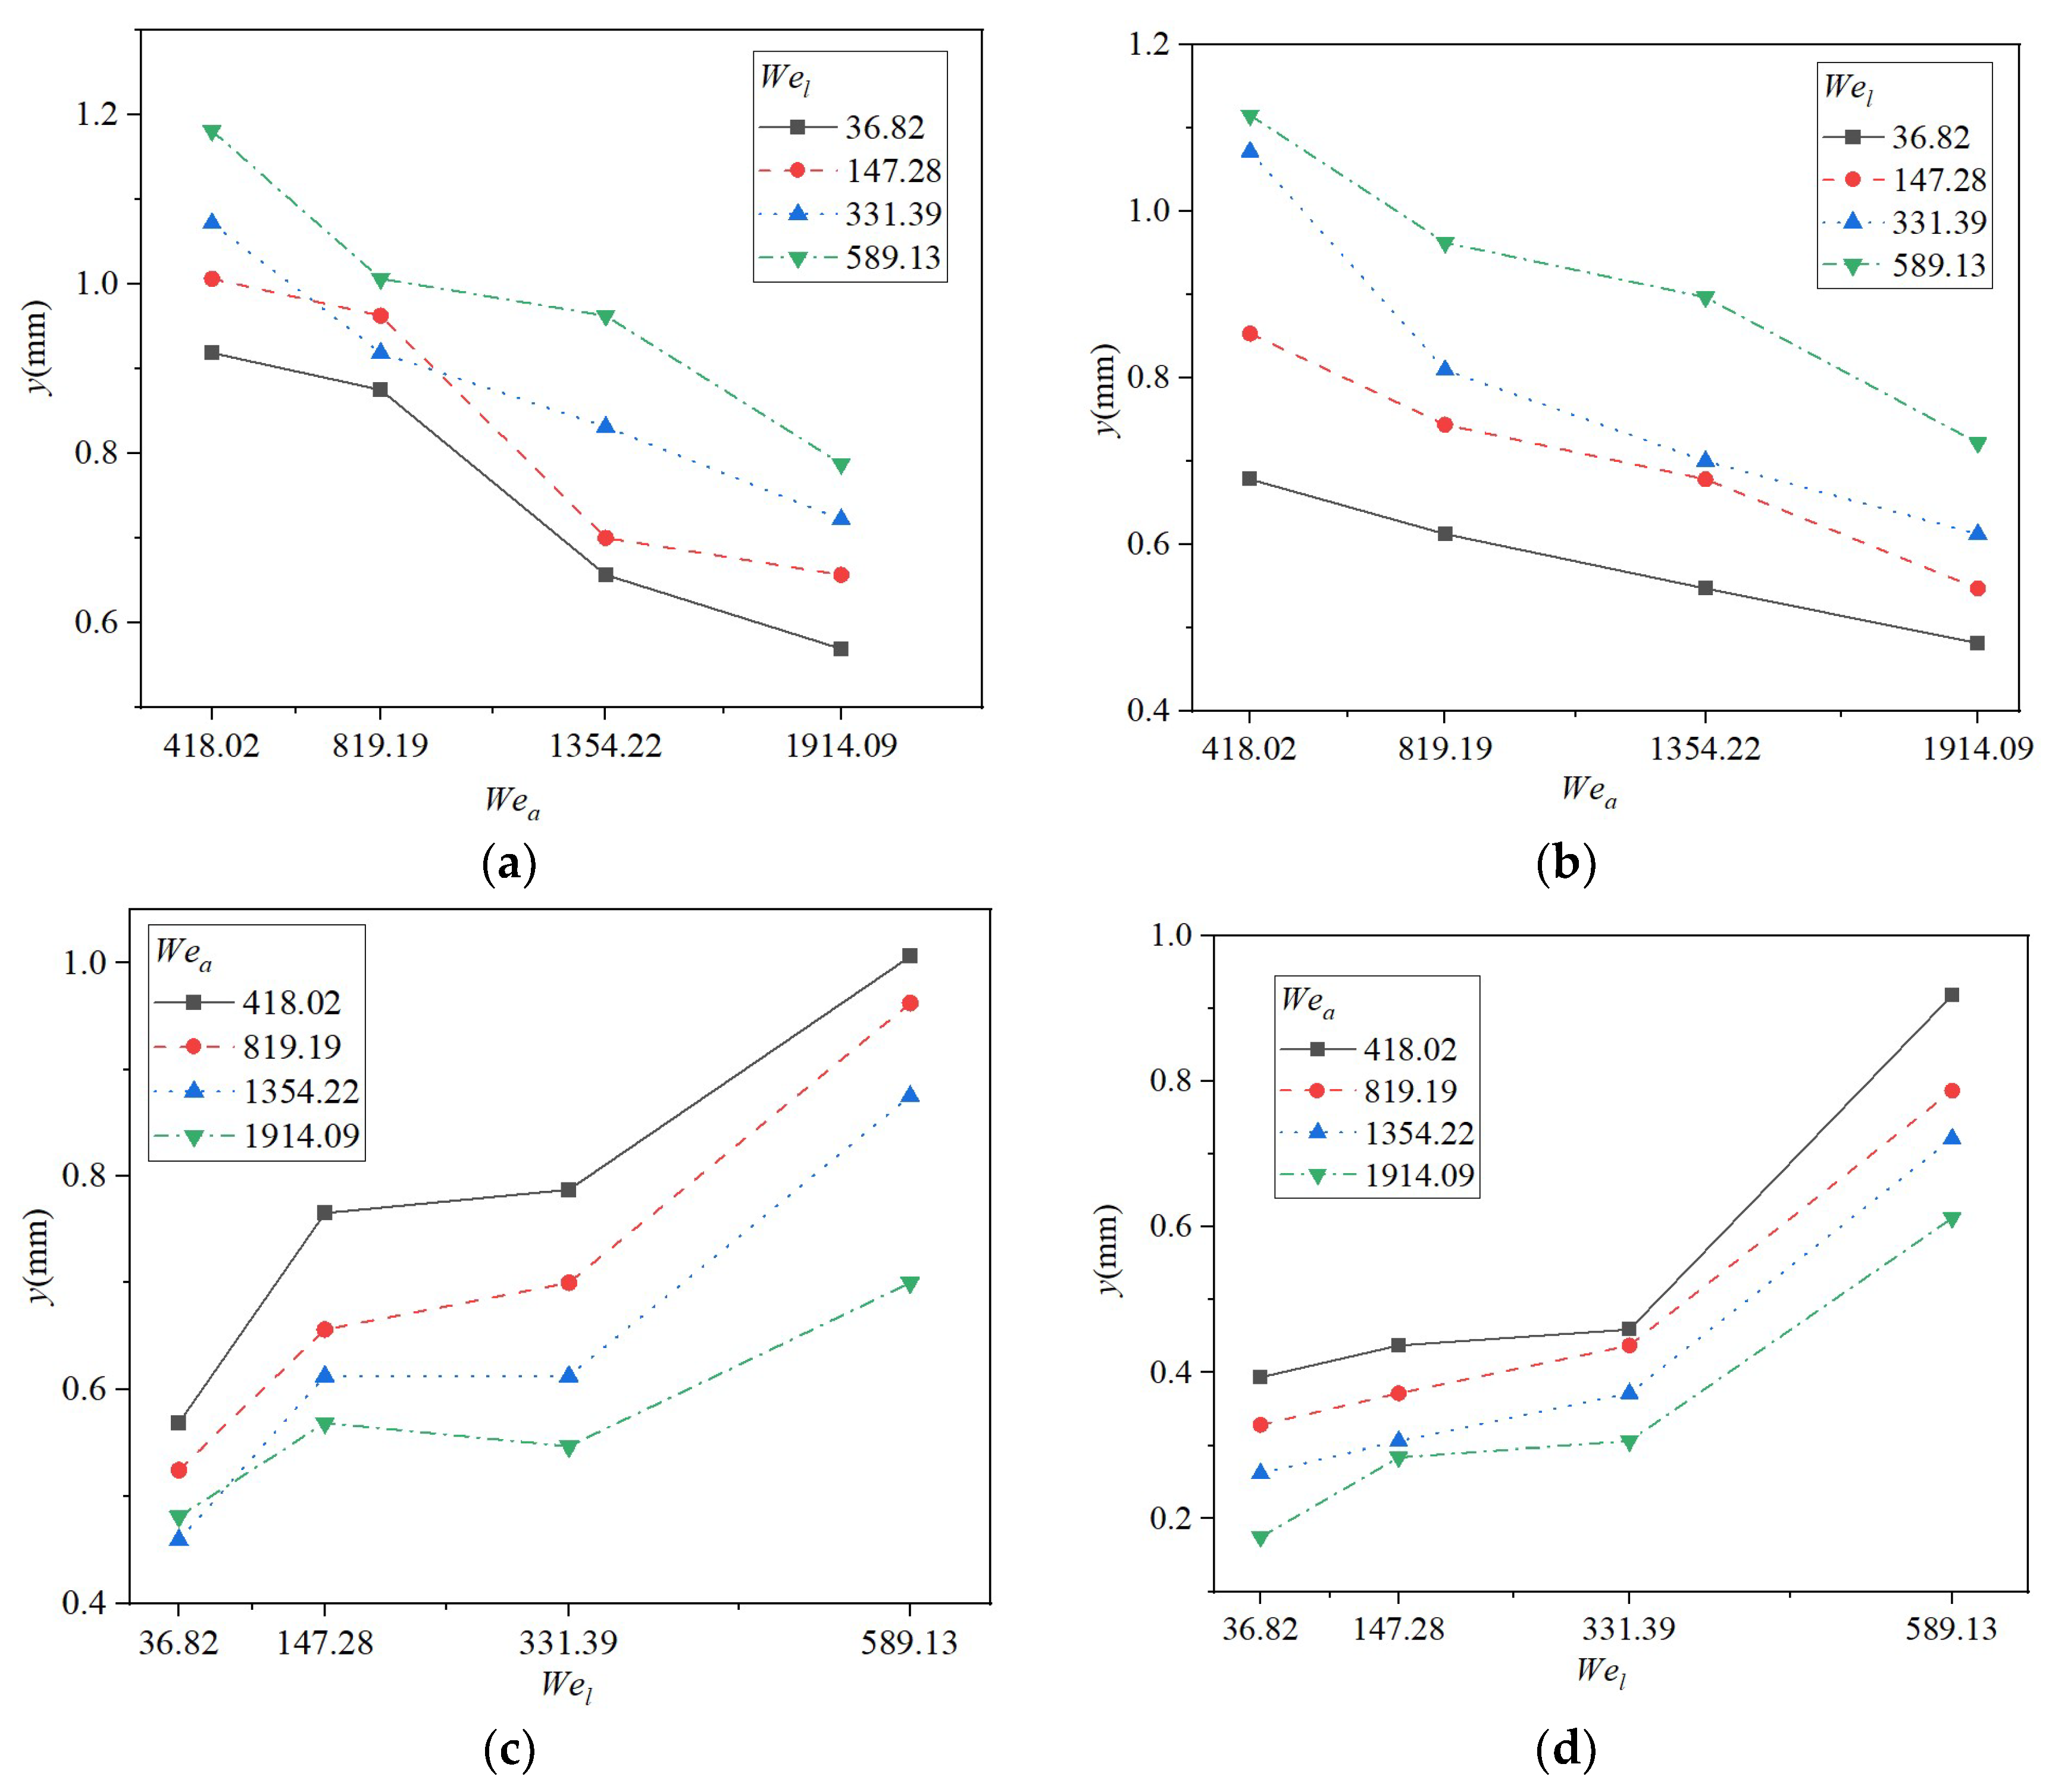
As shown in Figure 9, when x = 2.80 mm, the boundary curves for each condition tend to stabilize. To comprehensively analyze the influence of Weber numbers on penetration depth, the penetration depth at x = 2.80 mm for each test is selected for study. Figure 10 presents the curves illustrating the effects of liquid incidence angle and We on penetration depth. As the liquid We increases, the penetration depth basically exhibits an upward trend. Notably, when Wel rises from 147.28 to 331.39, the penetration depth exhibits a gentle growth rate. Conversely, as Wea increases, the penetration depth decreases, showing an approximate linear correlation.

3.2. Model Construction and Validation

3.2.1. Penetration Depth Model at an Incidence Angle of 90°

Taking Test 13 as an example, the penetration depth model for a liquid incidence angle of 90° is fitted based on the simplified curve Equation (10) and modified penetration depth curve Equation (11), as illustrated in Figure 11. The simplified penetration depth curve Equation (10) obtains an R2 value of 0.966, while the modified penetration depth curve Equation (11) results in an R2 value of 0.983. In comparison, the modified penetration depth curve model is more accurate than the simplified model.
A validation of the modified penetration depth model was performed. Table 3 presents a comparison of the coefficients of determination (R2) for the simplified and modified models. Statistical analysis reveals that the R2 for the simplified model ranges from 0.846 to 0.979 with a mean value of 0.927, whereas the R2 for the modified model increases to a range of 0.960 to 0.995 with a mean value of 0.982. This indicates that the modified penetration depth curve model more accurately describes the motion trajectory of the liquid jet.
In Table 3, the parameters C, α, and β of the modified penetration depth curve model vary across 16 tests. To minimize errors, the average values of C, α, and β (0.81, 0.07, and 0.37) are used as exponents in the penetration depth curve model, establishing the modified penetration depth model at an incidence angle of 90°:
y d = 0.81 q 0.07 ( x d ) 0.37 ,
Taking Tests 3 and 15 as examples, the relationship between y / d and q 0.07 ( x d ) 0.37 is illustrated in Figure 12. The penetration depth model at an incidence angle of 90° (Equation (17)) was experimentally validated using the 16 tests in Table 2, with R2 for each test summarized in Table 4.
Statistical validation results in Table 4 demonstrate excellent agreement between the Equation (17) and test data. R2 ranges from 0.947 to 0.992, with a mean value of 0.974. This strong correlation confirms the model’s capability to describe the trajectory of the liquid jet.

3.2.2. Penetration Depth Model at an Incidence Angle of θ

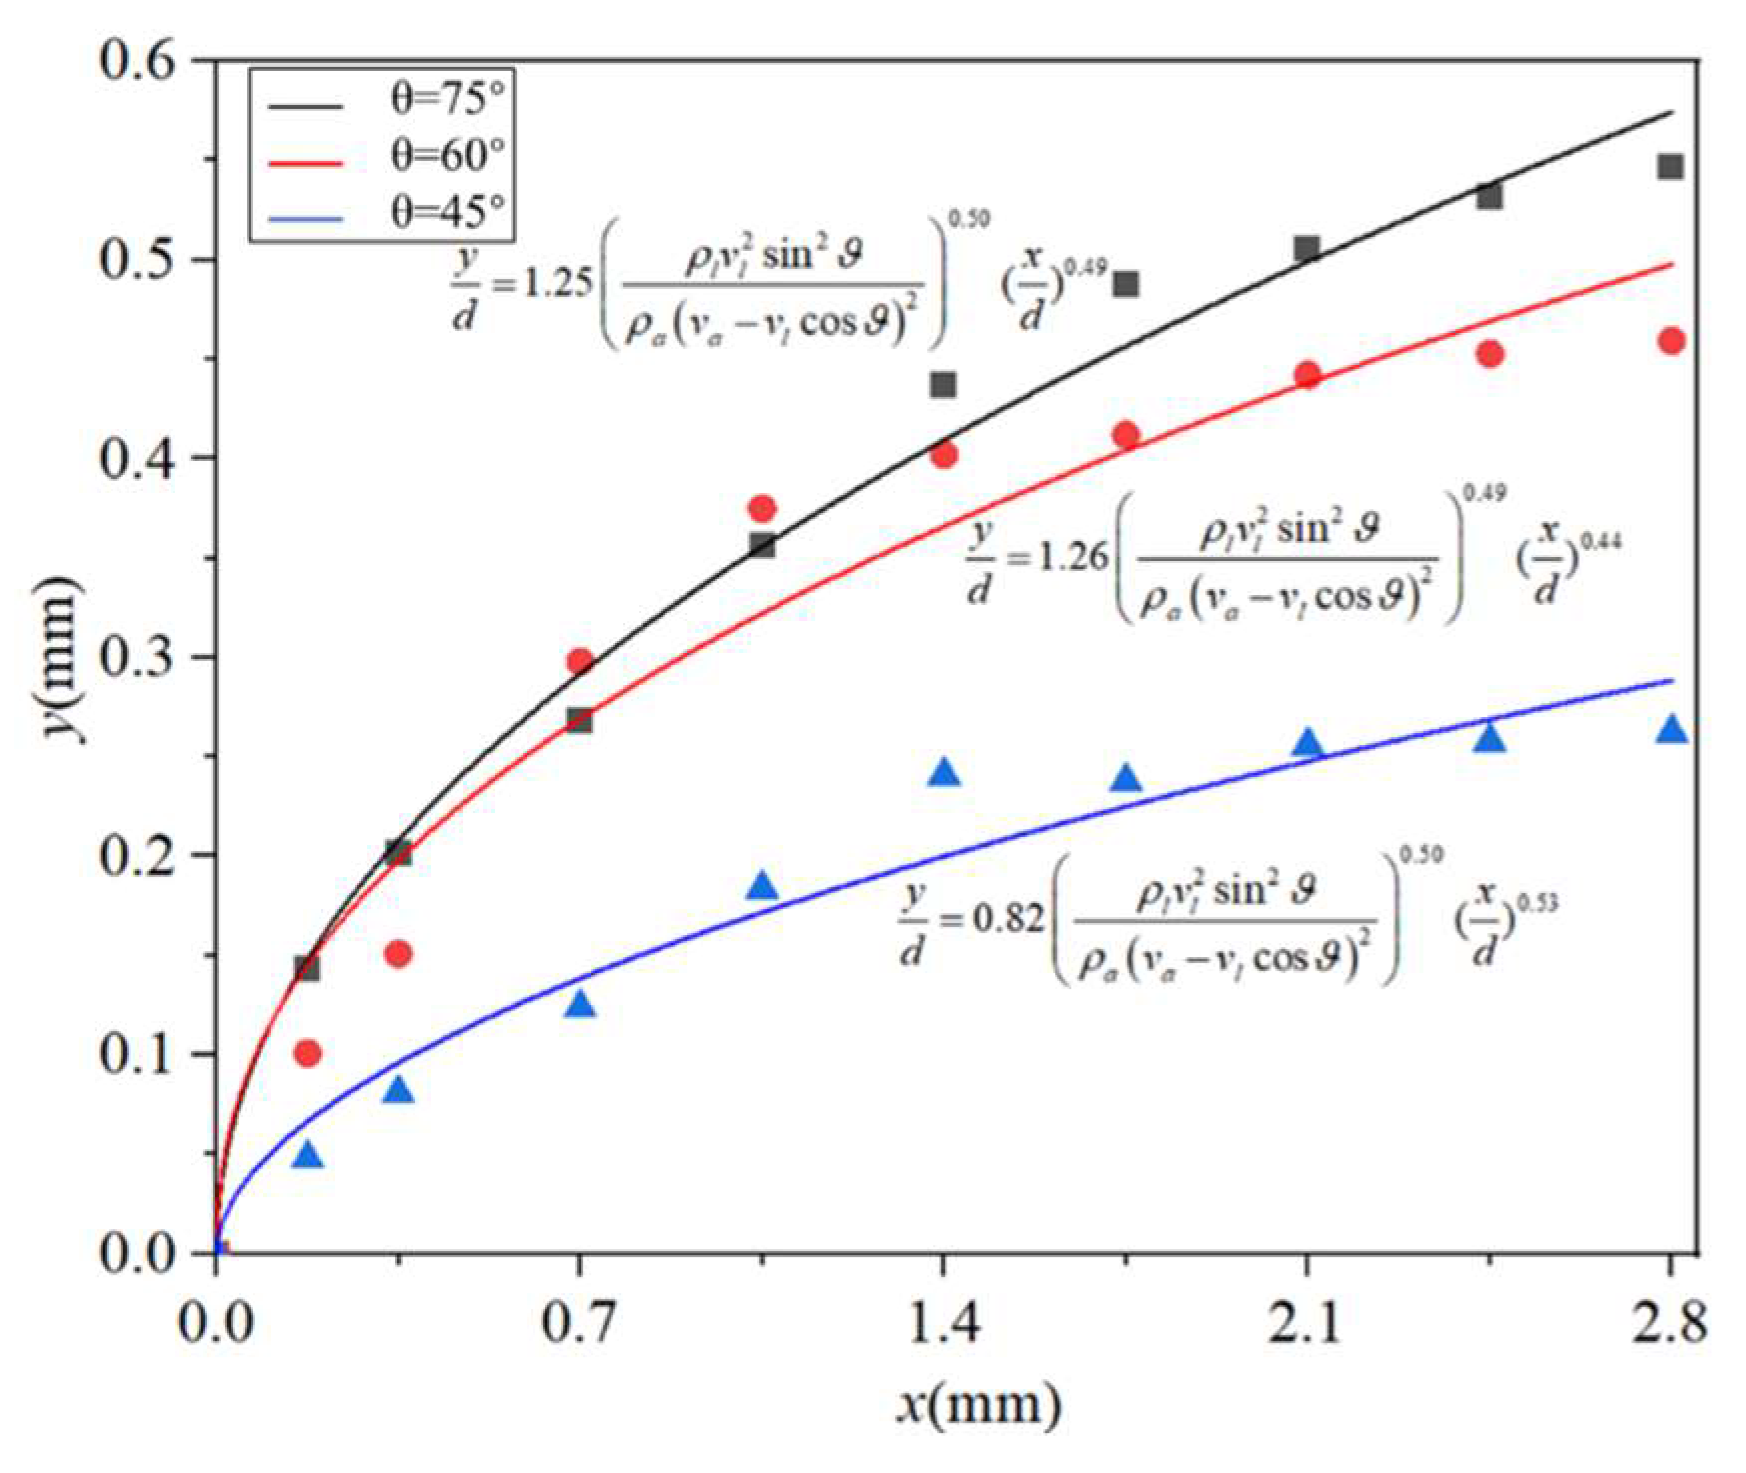
The penetration depth data corresponding to liquid injection angles of 45°, 60°, and 75° were fitted using the penetration depth curve model for the liquid incidence angle θ (Equation (15)). Test 9 was used to perform the curve fitting, as shown in Figure 13.
As shown in Figure 13, it can be observed that the penetration depth curve models for liquid incidence angles of 75°, 60°, and 45° are given by Equations (18)–(20), with corresponding R2 values of 0.990, 0.956, and 0.958, indicating a high degree of fit.
y d = 1.25 ρ l v l 2 sin 2 ϑ ρ a v a v l cos ϑ 2 0.50 ( x d ) 0.49 ,
y d = 1.26 ρ l v l 2 sin 2 ϑ ρ a v a v l cos ϑ 2 0.49 ( x d ) 0.44
y d = 0.82 ρ l v l 2 sin 2 ϑ ρ a v a v l cos ϑ 2 0.50 ( x d ) 0.53
Similarly, the data for the other tests were fitting, and the parameters of the penetration depth model are shown in Table 5.
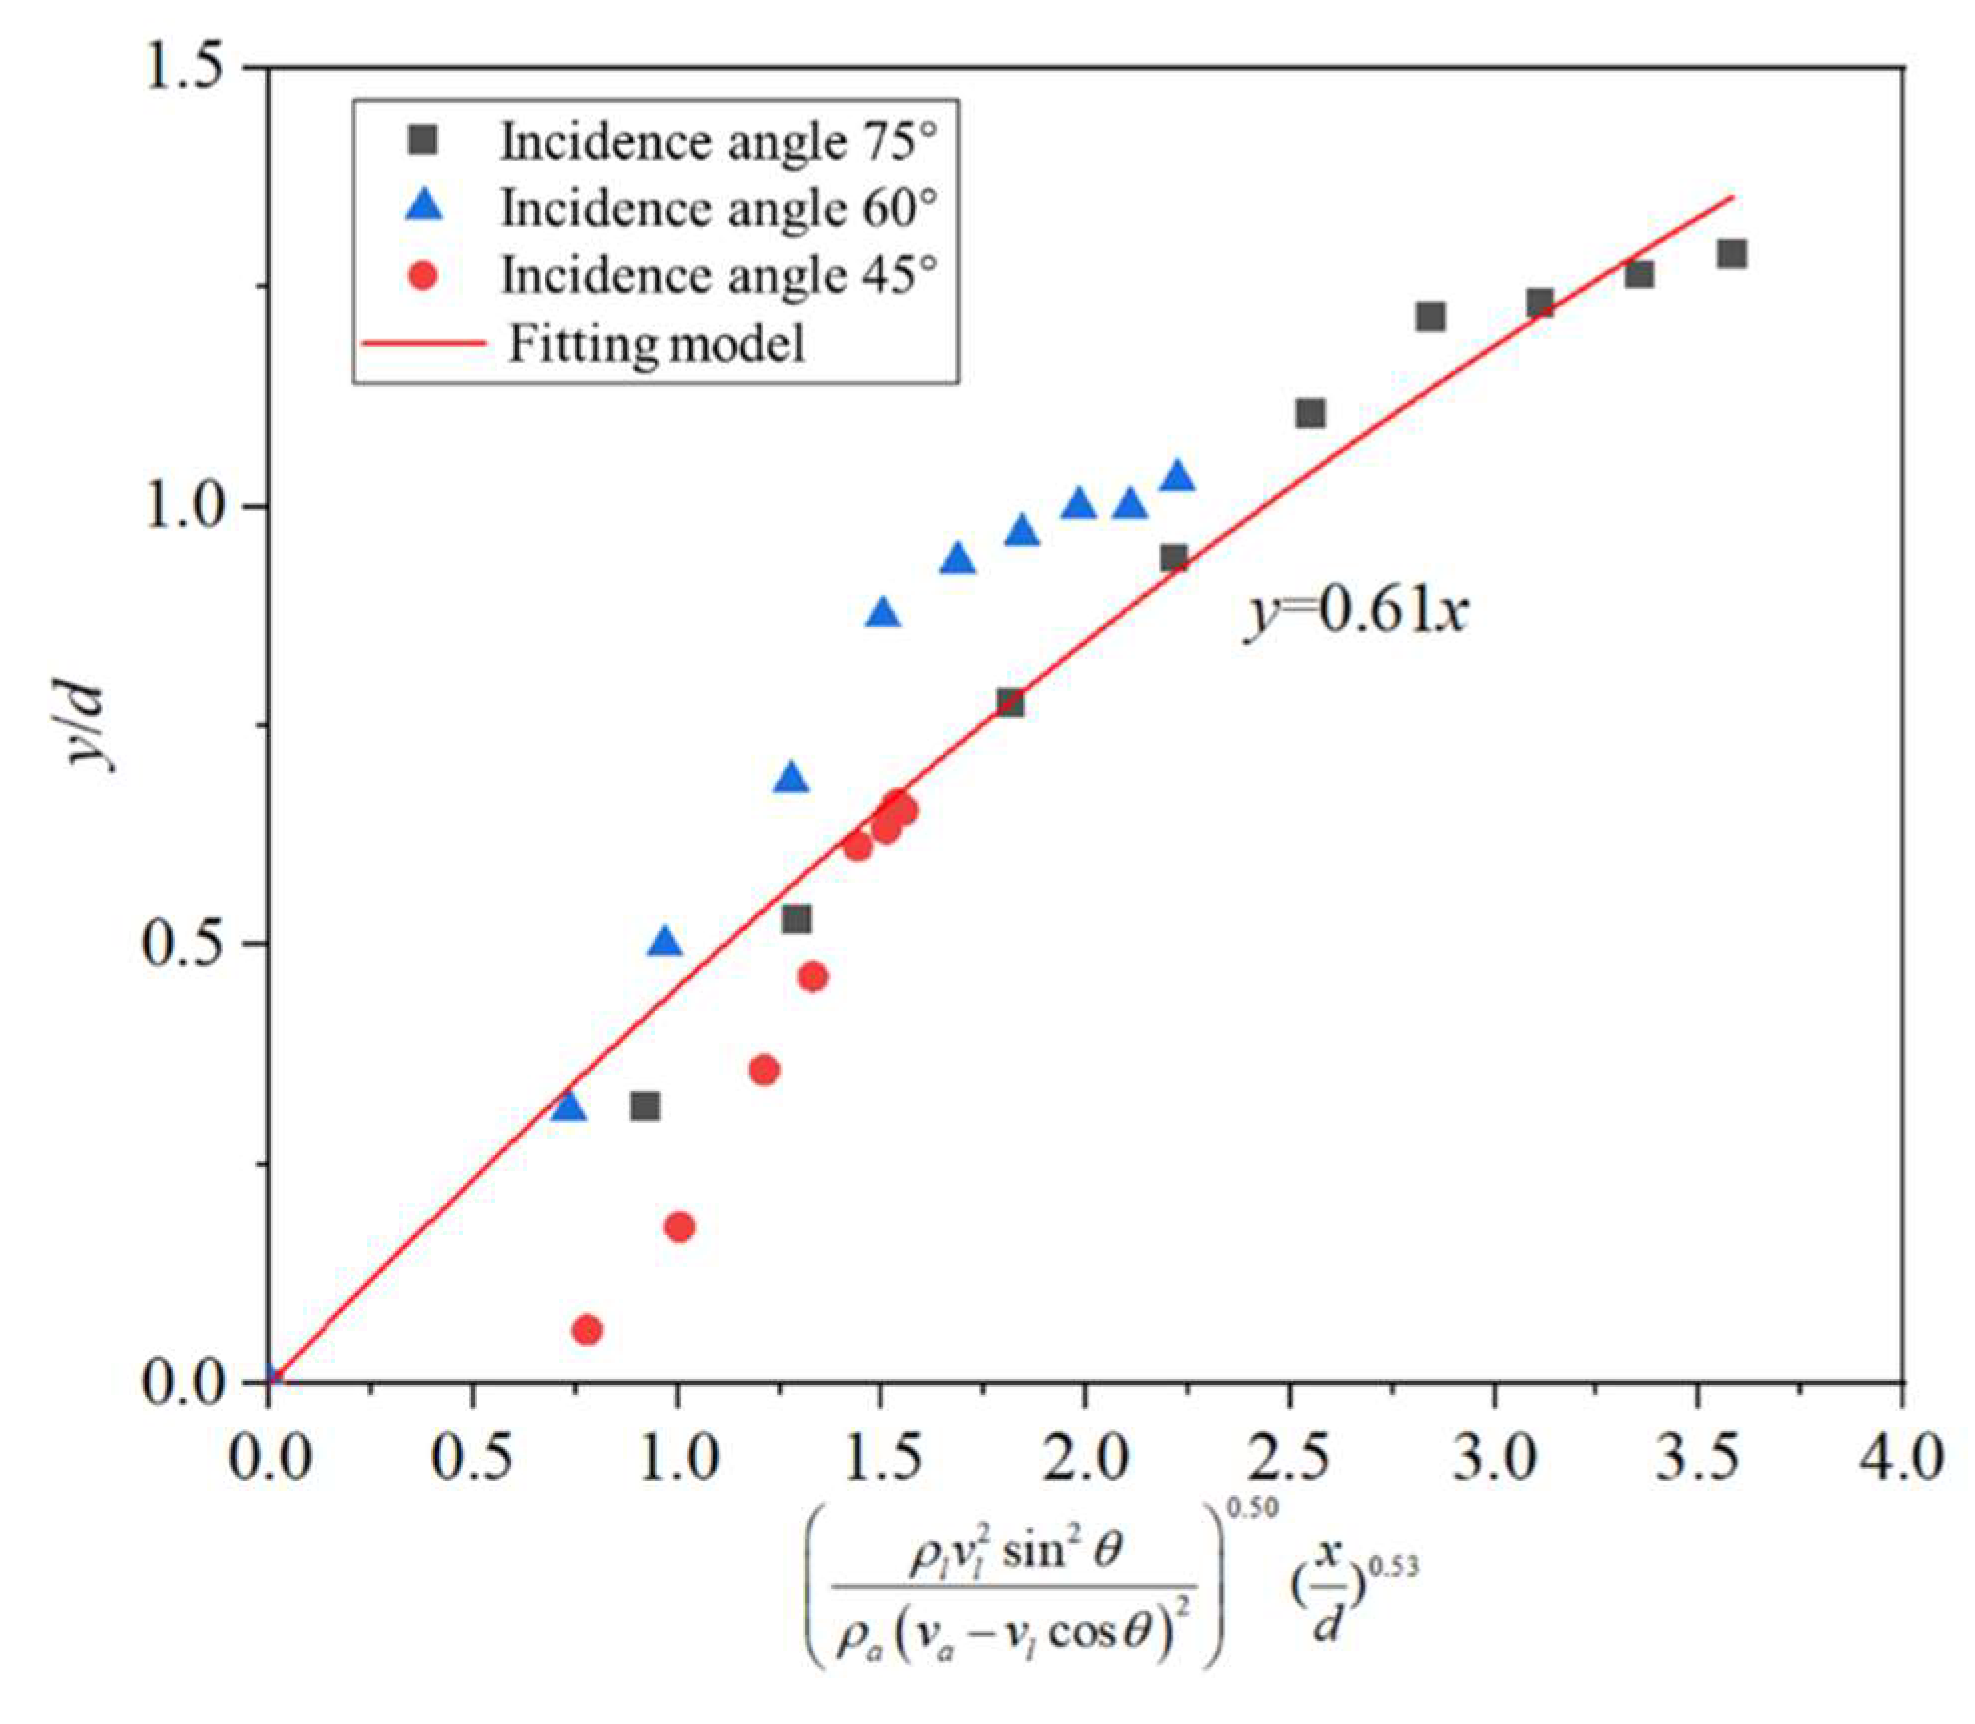
According to Table 5, the empirical coefficients C, α, and β vary under different operating conditions. To reduce errors, the average values of C, α, and β (0.61, 0.50, and 0.53, respectively) are used as coefficients in the penetration depth model for liquid injection angles θ. The model is as follows:
y d = 0.61 ρ l v l 2 sin 2 ϑ ρ a v a v l cos ϑ 2 0.50 ( x d ) 0.53
The penetration depth model was validated using results from different liquid incidence angles. Taking Test 3 as an example, the relationship between y / d and ρ l v l 2 sin 2 ϑ ρ a v a v l cos ϑ 2 0.50 ( x d ) 0.53 is shown in Figure 14, with R2 values of 0.991, 0.964, and 0.938. The parameters of the penetration depth model for specific tests are shown in Table 6.
Table 6 shows that for different liquid incidence angles, the minimum R2 value for the penetration depth model is 0.924, with an average of 0.969, indicating that the model is relatively accurate. The penetration depth model for liquid injection angles θ (Equation (21)) effectively describes the motion trajectory of liquid jets injected into a gas flow at different incidence angles. It should be noted that the current model assumes subsonic, non-turbulent inlet conditions, and its applicability beyond the tested Weber number range or under highly turbulent or compressible flows has not been assessed in this study.

3.3. Results and Analysis of Atomization Test

Droplet size is one of the key parameters for evaluating the atomization performance of transverse jets. In this study, the droplet volume median diameter (VMD) was employed as the key indicator of droplet size to represent overall atomization performance. And the experimental data of atomization tests are shown in Table 7. Within the experimental parameter range, the maximum VMD is 137.25 μm, while the minimum value is below 16.5 μm.
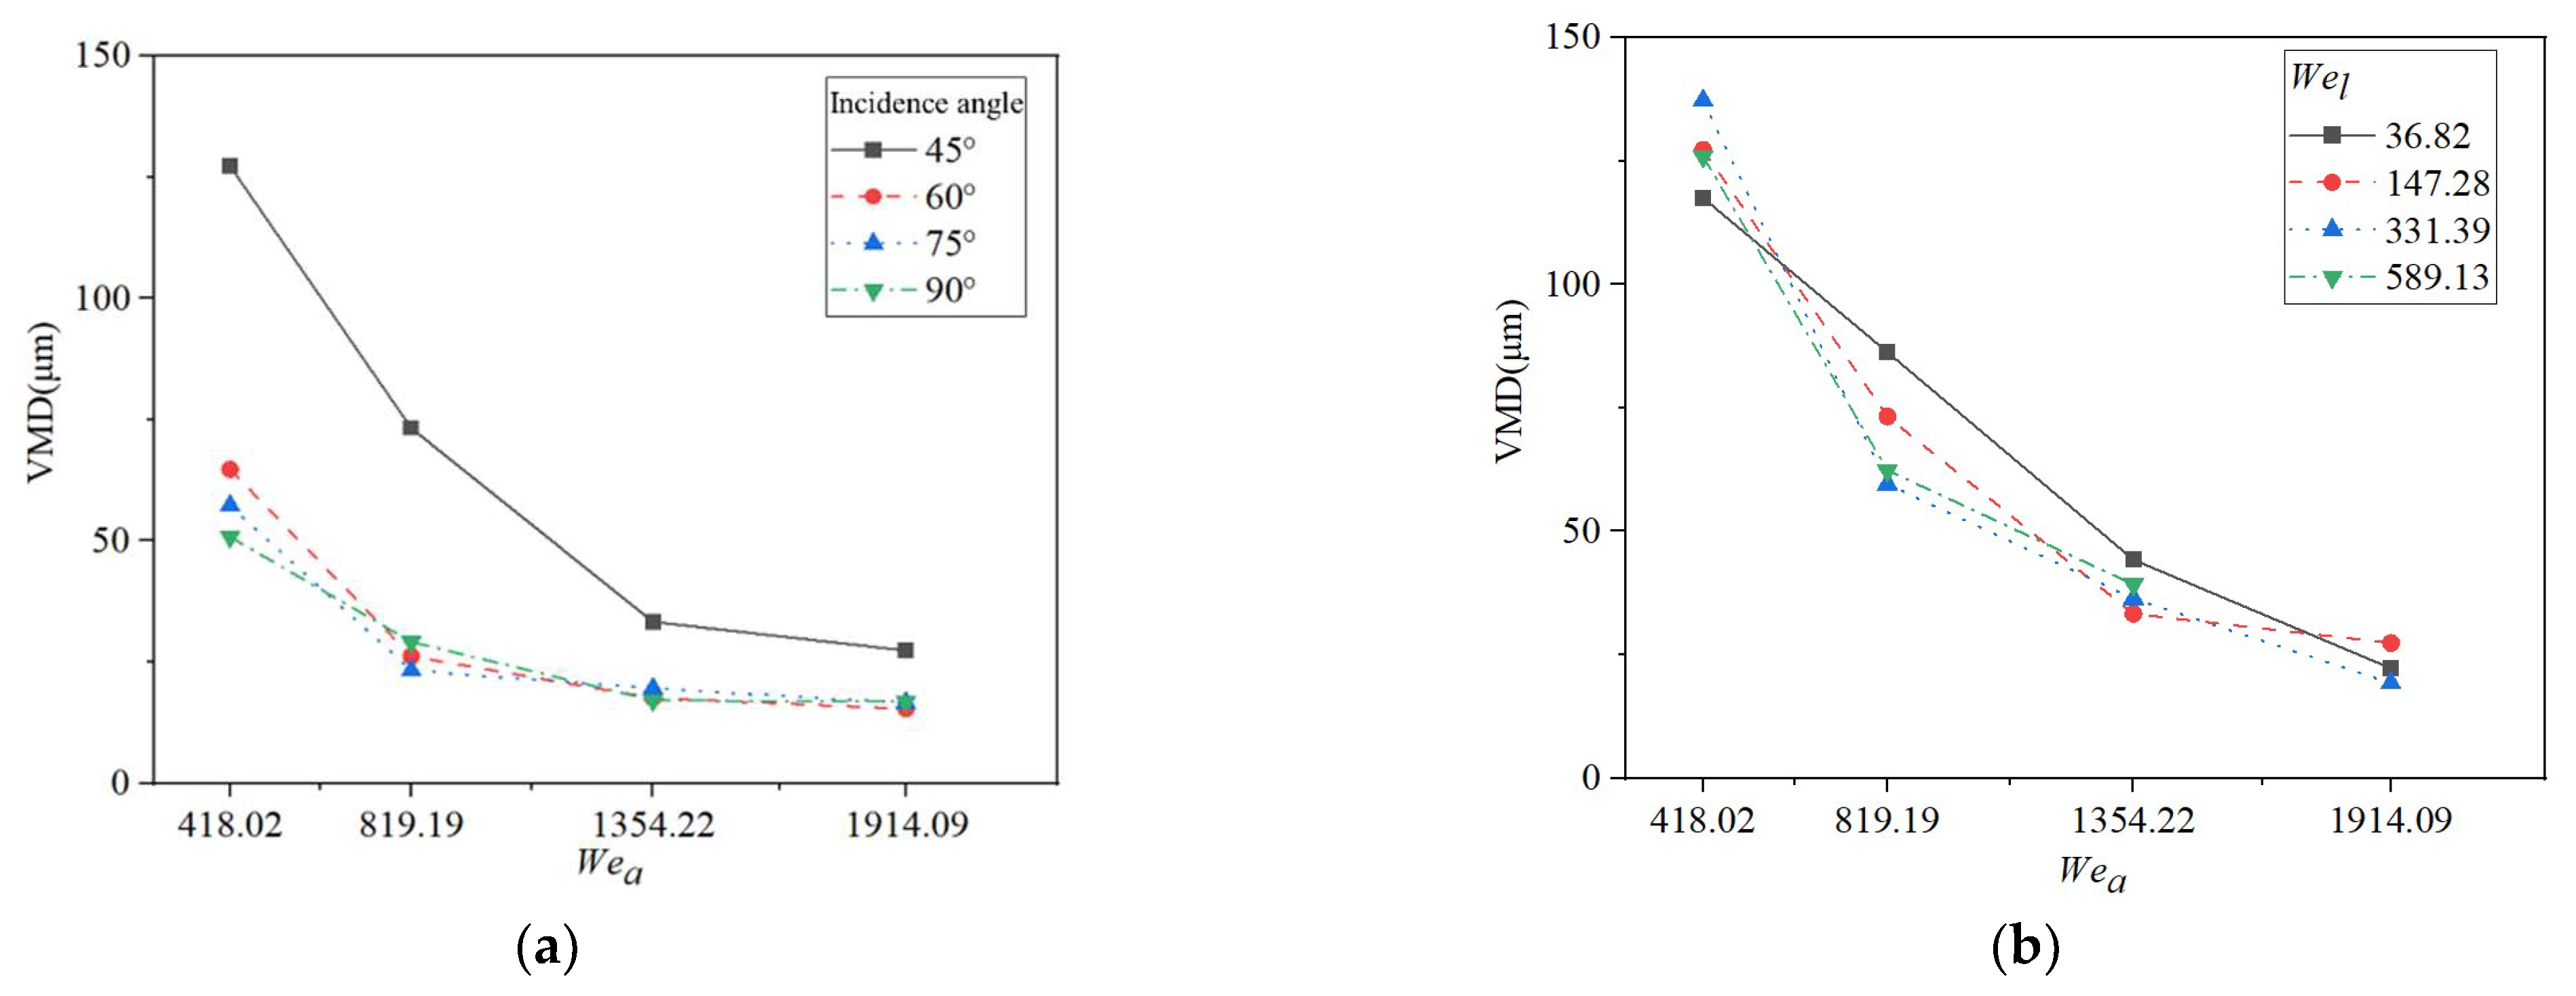
To investigate the relationship between VMD and Wea, the trend of VMD with respect to Wea was plotted using a liquid Weber number of Wel = 147.28 and a liquid incidence angle of 45°, as shown in Figure 15.
As Wea increases, the VMD decreases, with an approximately 83.09% reduction in the VMD as Wea increases. The breakup process of the liquid is primarily caused by the interaction between aerodynamic forces, liquid viscosity, and surface tension. An increase in Wea enhances the crossflow velocity, intensifying the disturbance and shear forces on the liquid jet, which promotes more complete atomization and a reduction in droplet size. Similar conclusions were drawn by Kasmaiee and Chang et al. [32,33], who found that an increase in Wea alters the dominant wave type of jet breakup, thereby increasing the instability of the liquid jet and producing smaller droplets.
When the droplet VMD is smaller than 50 μm, the influence of Wea on the VMD decreases. The main reason for this is that when the VMD is small, the cohesion of the droplets increases. Additionally, when Wea is sufficiently large, the component velocity of the liquid jet in the airflow direction becomes negligible, which reduces the impact of Wea on the VMD.
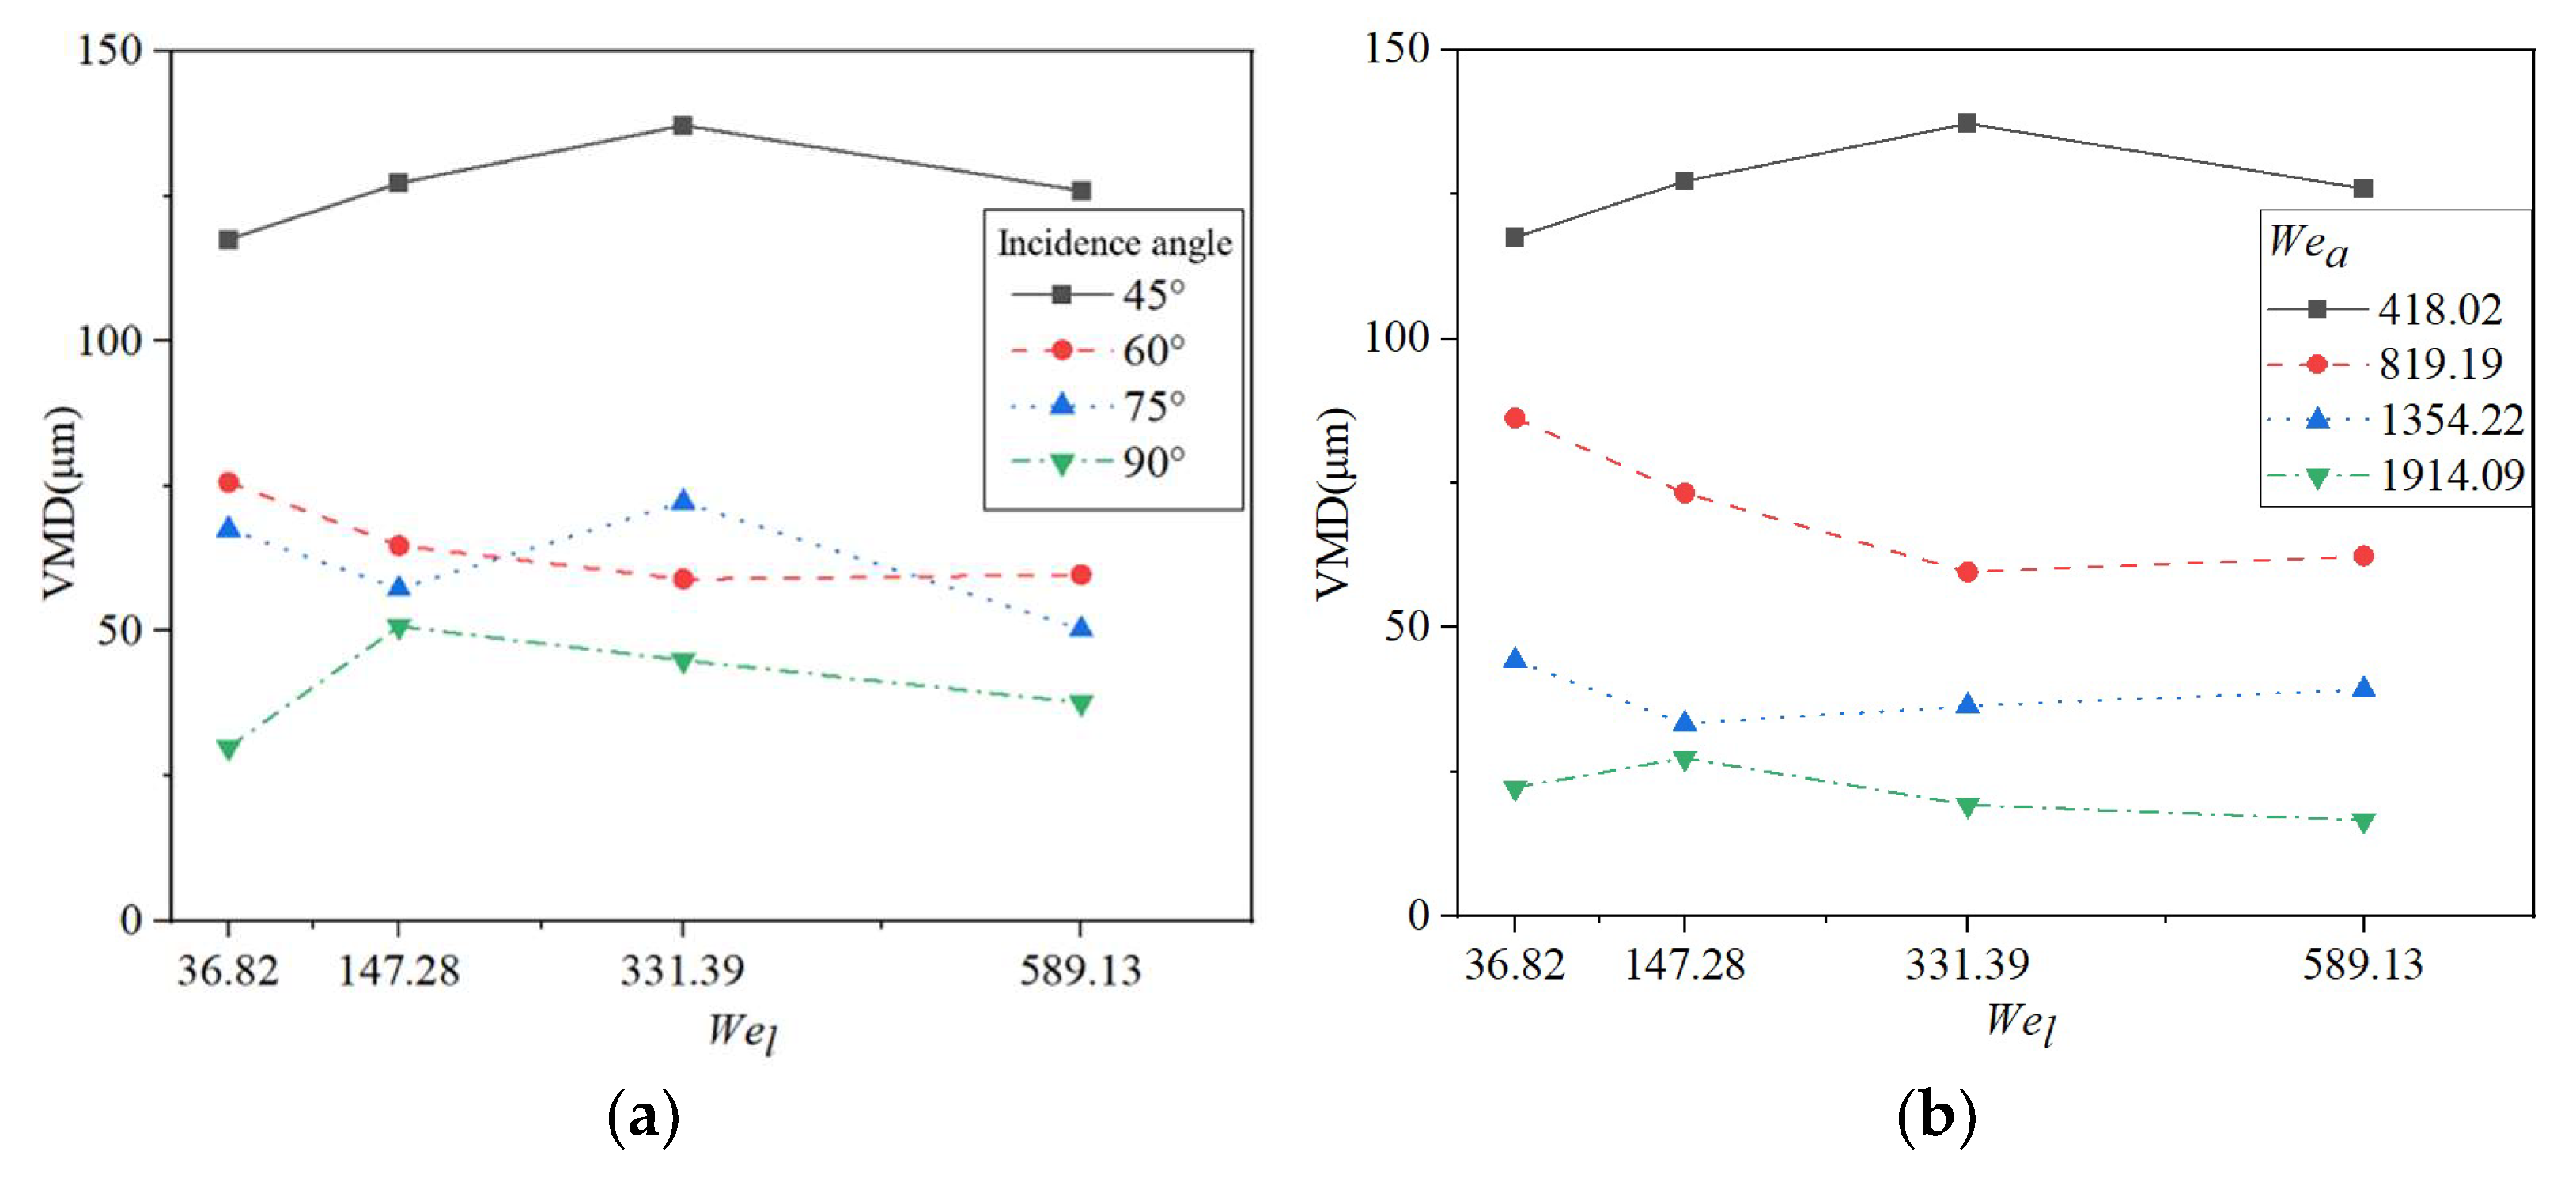
To study the effect of Wel on the VMD, the trend of VMD variation with Wel was plotted using a Wea = 418.02 and a liquid incidence angle of 45°, as shown in Figure 16.
As illustrated in Figure 16, a non-monotonic relationship is observed between VMD and Wel, with some cases showing an initial increase followed by a decrease, and others exhibiting the opposite trend. This behavior suggests that the VMD is influenced by two competing atomization mechanisms, whose dominance varies with the flow regime.
Increasing jet velocity enhances the liquid jet’s inertia, leading to greater stability and delayed onset of primary breakup. In this regime, surface tension and liquid inertia suppress the development of instabilities, allowing the jet to maintain coherence over a longer distance, which favors the formation of larger droplets and an increase in the VMD [32]. However, the higher relative velocity between the gas and liquid phases intensifies aerodynamic shear, promoting instabilities along the liquid–gas interface. These instabilities accelerate surface wave growth and ligament formation, thereby facilitating a more effective primary and secondary breakup. This results in finer droplets and a reduction in the VMD [34]. Therefore, the observed non-monotonic trends of the VMD with Wel reflect the dynamic balance between inertial stabilization and shear-induced disruption, which varies depending on the specific injection and crossflow conditions.
To investigate the effect of liquid incidence angle on the VMD, the trend of VMD variation with liquid incidence angle was plotted using a Wea = 819.19 and a Wel = 147.28, as shown in Figure 17.
As the liquid incidence angle increases, the VMD decreases, mainly due to the reduction in the component velocity of the liquid jet in the airflow direction, which weakens the disturbance and shear force of the airflow on the jet. When the liquid injection angle increased from 45° to 60°, the VMD decreased significantly by approximately 42.96%. However, when the incidence angle increased from 60° to 90°, the decrease in the VMD was smaller or almost negligible. The main reason is that the increase in the VMD enhances the cohesion of the droplets, making them more difficult to atomize and break up.

4. Conclusions

This study experimentally investigated the atomization and penetration characteristics of liquid jets in subsonic crossflows under varying Weber numbers and liquid incidence angles. The following conclusions can be drawn:
Visualization tests of transverse jets were conducted to investigate the effects of the gas Weber number (Wea), liquid Weber number (Wel), and liquid incidence angle (θ) on jet penetration depth. The study shows that an increase in Wel results in a greater penetration depth. Conversely, Wea has the opposite effect on penetration depth. A decrease in θ leads to a reduction in penetration depth.
A modified penetration depth model incorporating the incidence angle θ was developed. The model was validated against 16 test cases, yielding a determination coefficient (R2) ranging from 0.947 to 0.992, with an average of 0.974, demonstrating high accuracy and reliability. Further studies involving statistical validation of the parameter effects are planned to enhance the generalizability of the proposed model.
Droplet atomization performance was assessed using the volume median diameter (VMD). As Wea increased, the VMD decreased by approximately 83.09% (from 137.25 μm to 16.58 μm), indicating enhanced atomization. In contrast, reducing the incidence angle from 90° to 45° resulted in a 42.96% increase in the VMD due to diminished shear breakup efficiency.
The penetration depth model and droplet generation patterns provide theoretical guidance for air-assisted atomization nozzle design optimization. This research is of significant importance for the development of spraying technologies in agriculture, particularly for the design and optimization of atomization nozzles in precision agriculture.

Author Contributions

M.W.: Formal analysis, investigation, validation, writing—original draft. S.D.: Conceptualization, methodology, writing—review and editing, supervision. R.Y.: Investigation, formal analysis. M.O.: Formal analysis, supervision. G.W.: Investigation, validation. C.H.: Conceptualization. X.F.: Conceptualization, project administration. W.J.: Investigation, supervision. All authors have read and agreed to the published version of the manuscript.

Funding

This research was funded by the Priority Academic Program Development of Jiangsu Higher Education Institutions (grant number: PAPD-2023-87) and the research and demonstration of mechanization technology and equipment for key links in the production of wine grapes and yellow flowers (grant number: 8331203012).

Institutional Review Board Statement

Not applicable.

Data Availability Statement

The data presented in this study are available within the article.

Acknowledgments

The authors thank the School of Agricultural Engineering of Jiangsu University for its facilities and support.

Conflicts of Interest

The authors declare no conflicts of interest.

References

  1. Peters, J. An Experimental Study of the Primary Breakup of a Liquid Jet in a Turbulent Low Speed Crossflow. Master’s Thesis, University of Manitoba, Winnipeg, MB, Canada, 2023. [Google Scholar]
  2. Yue, J.; Chao, C.; Hong, L.; Xiang, Q. Influences of nozzle parameters and low-pressure on jet breakup and droplet characteristics. Int. J. Agric. Biol. Eng. 2016, 9, 22–32. [Google Scholar]
  3. Zhou, D.; Chang, J.; Tang, C.; He, L. Review on research progress in liquid jet in crossflow. Int. Commun. Heat Mass Transf. 2023, 148, 107003. [Google Scholar] [CrossRef]
  4. Fu, Q.F.; Yao, M.W.; Yang, L.J.; Xie, L. Atomization model of liquid jets exposed to subsonic crossflows. AIAA J. 2020, 58, 2347–2351. [Google Scholar] [CrossRef]
  5. Jiang, Y.; Li, H.; Hua, L.; Zhang, D.; Issaka, Z. Experimental study on jet breakup morphologies and jet characteristic parameters of non-circular nozzles under low-intermediate pressures. Appl. Eng. Agric. 2019, 35, 617–632. [Google Scholar] [CrossRef]
  6. Lee, I.C.; Kang, Y.S.; Moon, H.J.; Jang, S.P.; Kim, J.K.; Koo, J. Spray jet penetration and distribution of modulated liquid jets in subsonic cross-flows. J. Mech. Sci. Technol. 2010, 24, 1425–1431. [Google Scholar] [CrossRef]
  7. Inamura, T. Trajectory of a liquid jet traversing subsonic airstreams. J. Propuls. Power 2000, 16, 155–157. [Google Scholar] [CrossRef]
  8. Kasmaiee, S.; Tadjfar, M.; Kasmaiee, S. Pressure swirl nozzles with different discharge orifice shapes injecting into transverse airflow. Phys. Fluids 2025, 37, 013357. [Google Scholar] [CrossRef]
  9. Jiang, Y.; Li, H.; Hua, L.; Zhang, D. Three-dimensional flow breakup characteristics of a circular jet with different nozzle geometries. Biosyst. Eng. 2020, 193, 216–231. [Google Scholar] [CrossRef]
  10. Xiang, Q.; Qureshi, W.A.; Tunio, M.H.; Solangi, K.A.; Xu, Z.; Lakhiar, I.A. Low-pressure drop size distribution characterization of impact sprinkler jet nozzles with and without aeration. Agric. Water Manag. 2021, 243, 106458. [Google Scholar] [CrossRef]
  11. Dighe, S.; Gadgil, H. Effect of transverse acoustic forcing on the characteristics of impinging jet atomization. At. Sprays 2019, 29, 79–103. [Google Scholar] [CrossRef]
  12. Nishimoto, S.; Nakaya, S.; Lee, J.; Tsue, M. Effects of the penetration height of ethylene transverse jets on flame stabilization behavior in a Mach 2 supersonic crossflow. Proc. Combust. Inst. 2023, 39, 3117–3126. [Google Scholar] [CrossRef]
  13. Thomas, R.H.; Schetz, J.A. Distributions across the plume of transverse liquid and slurry jets in supersonic airflow. AIAA J. 1985, 23, 1892–1901. [Google Scholar] [CrossRef]
  14. Amini, G.; Dolatabadi, A. Capillary instability of elliptic liquid jets. Phys. Fluids 2011, 23, 084109. [Google Scholar] [CrossRef]
  15. Jiang, Y.; Li, H.; Chen, C.; Xiang, Q. Calculation and verification of formula for the range of sprinklers based on jet breakup length. Int. J. Agric. Biol. Eng. 2018, 11, 49–57. [Google Scholar] [CrossRef]
  16. Xie, M.; Wang, W.; Yu, B.; He, M.; Wu, S.; Huang, X.; Liu, H. Primary breakup model development for trajectory prediction of liquid jets in subsonic crossflow. Phys. Fluids 2024, 36, 033357. [Google Scholar] [CrossRef]
  17. Kong, L.; Lan, T.; Chen, J.; Wang, K.; Sun, H. Breakup processes and droplet characteristics of liquid jets injected into low-speed air crossflow. Processes 2020, 8, 676. [Google Scholar] [CrossRef]
  18. Wu, R.; Sun, C.; Gui, Y. Numerical analysis of atomization characteristics of fuel-jet in crossflow. AIP Adv. 2024, 14, 085115. [Google Scholar] [CrossRef]
  19. Liao, J.; Luo, X.; Wang, P.; Zhou, Z.; O’donnell, C.C.; Zang, Y.; Hewitt, A.J. Analysis of the influence of different parameters on droplet characteristics and droplet size classification categories for air induction nozzle. Agronomy 2020, 10, 256. [Google Scholar] [CrossRef]
  20. Hussain, Z.; Liu, J.; Chauhdary, J.N.; Zhao, Y. Evaluating the effect of operating pressure, nozzle size and mounting height on droplet characteristics of rotating spray plate sprinkler. Irrig. Sci. 2024, 1–16. [Google Scholar] [CrossRef]
  21. Liu, H.; Guo, Y.; Lin, W. Numerical simulations of spray jet in sup ersonic crossflows using an Eulerian approach with an SMD model. Int. J. Multiph. Flow 2016, 82, 49–64. [Google Scholar] [CrossRef]
  22. Yu, S.; Yin, B.; Bi, Q.; Jia, H.; Chen, C. The influence of elliptical and circular orifices on the transverse jet characteristics at supersonic crossflow. Acta Astronaut. 2021, 185, 124–131. [Google Scholar] [CrossRef]
  23. Tunio, M.H.; Gao, J.; Qureshi, W.A.; Sheikh, S.A.; Chen, J.; Chandio, F.A.; Lakhiar, I.A.; Solangi, K.A. Effects of droplet size and spray interval on root-to-shoot ratio, photosynthesis efficiency, and nutritional quality of aeroponically grown butterhead lettuce. Int. J. Agric. Biol. Eng. 2022, 15, 79–88. [Google Scholar]
  24. Gong, C.; Li, D.; Kang, C. Effect of oil-based emulsion on air bubbles in the spray sheet produced through the air-induction nozzle. Pest Manag. Sci. 2022, 78, 5347–5357. [Google Scholar] [CrossRef]
  25. Wu, M.; Ou, M.; Zhang, Y.; Jia, W.; Dai, S.; Wang, M.; Dong, X.; Wang, X.; Jiang, L. Development and Evaluation of a Monodisperse Droplet-Generation System for Precision Herbicide Application. Agriculture 2024, 14, 1885. [Google Scholar] [CrossRef]
  26. Jalili, B.; Jalili, P.; Ommi, F.; Ganji, D.D. Experimental study on the nozzle-shape effect on liquid jet characteristics in gaseous crossflow. Front. Mech. Eng. 2023, 9, 1207894. [Google Scholar] [CrossRef]
  27. Jalili, B.; Jalili, P. Numerical analysis of airflow turbulence intensity effect on liquid jet trajectory and breakup in two-phase cross flow. Alex. Eng. J. 2023, 68, 577–585. [Google Scholar] [CrossRef]
  28. Kumar, R.; Mukhopadhyay, S. Liquid Jet in Cross Flow Modeling Under Different Weber Numbers. In Proceedings of the ICTEA: International Conference on Thermal Engineering, Tashkent, Uzbekistan, 28 May–1 June 2024; Volume 1. [Google Scholar]
  29. Mashayek, A.; Jafari, A.; Ashgriz, N. Improved model for the penetration of liquid jets in subsonic crossflows. AIAA J. 2008, 46, 2674–2686. [Google Scholar] [CrossRef]
  30. Pourrousta, M.; Larimi, M.M.; Biglarian, M.; Hedayati, P. Liquid Jet Breakup and Penetration in a Gas Cross-Flow-An Experimental Study. Exp. Tech. 2024, 48, 449–459. [Google Scholar] [CrossRef]
  31. Kasmaiee, S.; Tadjfar, M. Influence of injection angle on liquid jet in crossflow. Int. J. Multiph. Flow 2022, 153, 104128. [Google Scholar] [CrossRef]
  32. Kasmaiee, S.; Tadjfar, M.; Kasmaiee, S.; Ahmadi, G. Linear stability analysis of surface waves of liquid jet injected in transverse gas flow with different angles. Theor. Comput. Fluid Dyn. 2024, 38, 107–138. [Google Scholar] [CrossRef]
  33. Chang, J.; He, L.; Chen, L.; Shen, Z.; Chuah, L.F.; Bokhari, A.; Klemeš, J.J.; Han, N. Numerical simulation of liquid jet atomization in subsonic crossflow. Energy 2022, 257, 124676. [Google Scholar] [CrossRef]
  34. Zhang, Y.; Tian, Y.; Le, J. Review of atomization characteristics of liquid jets in crossflow. Phys. Fluids 2024, 36, 021302. [Google Scholar] [CrossRef]
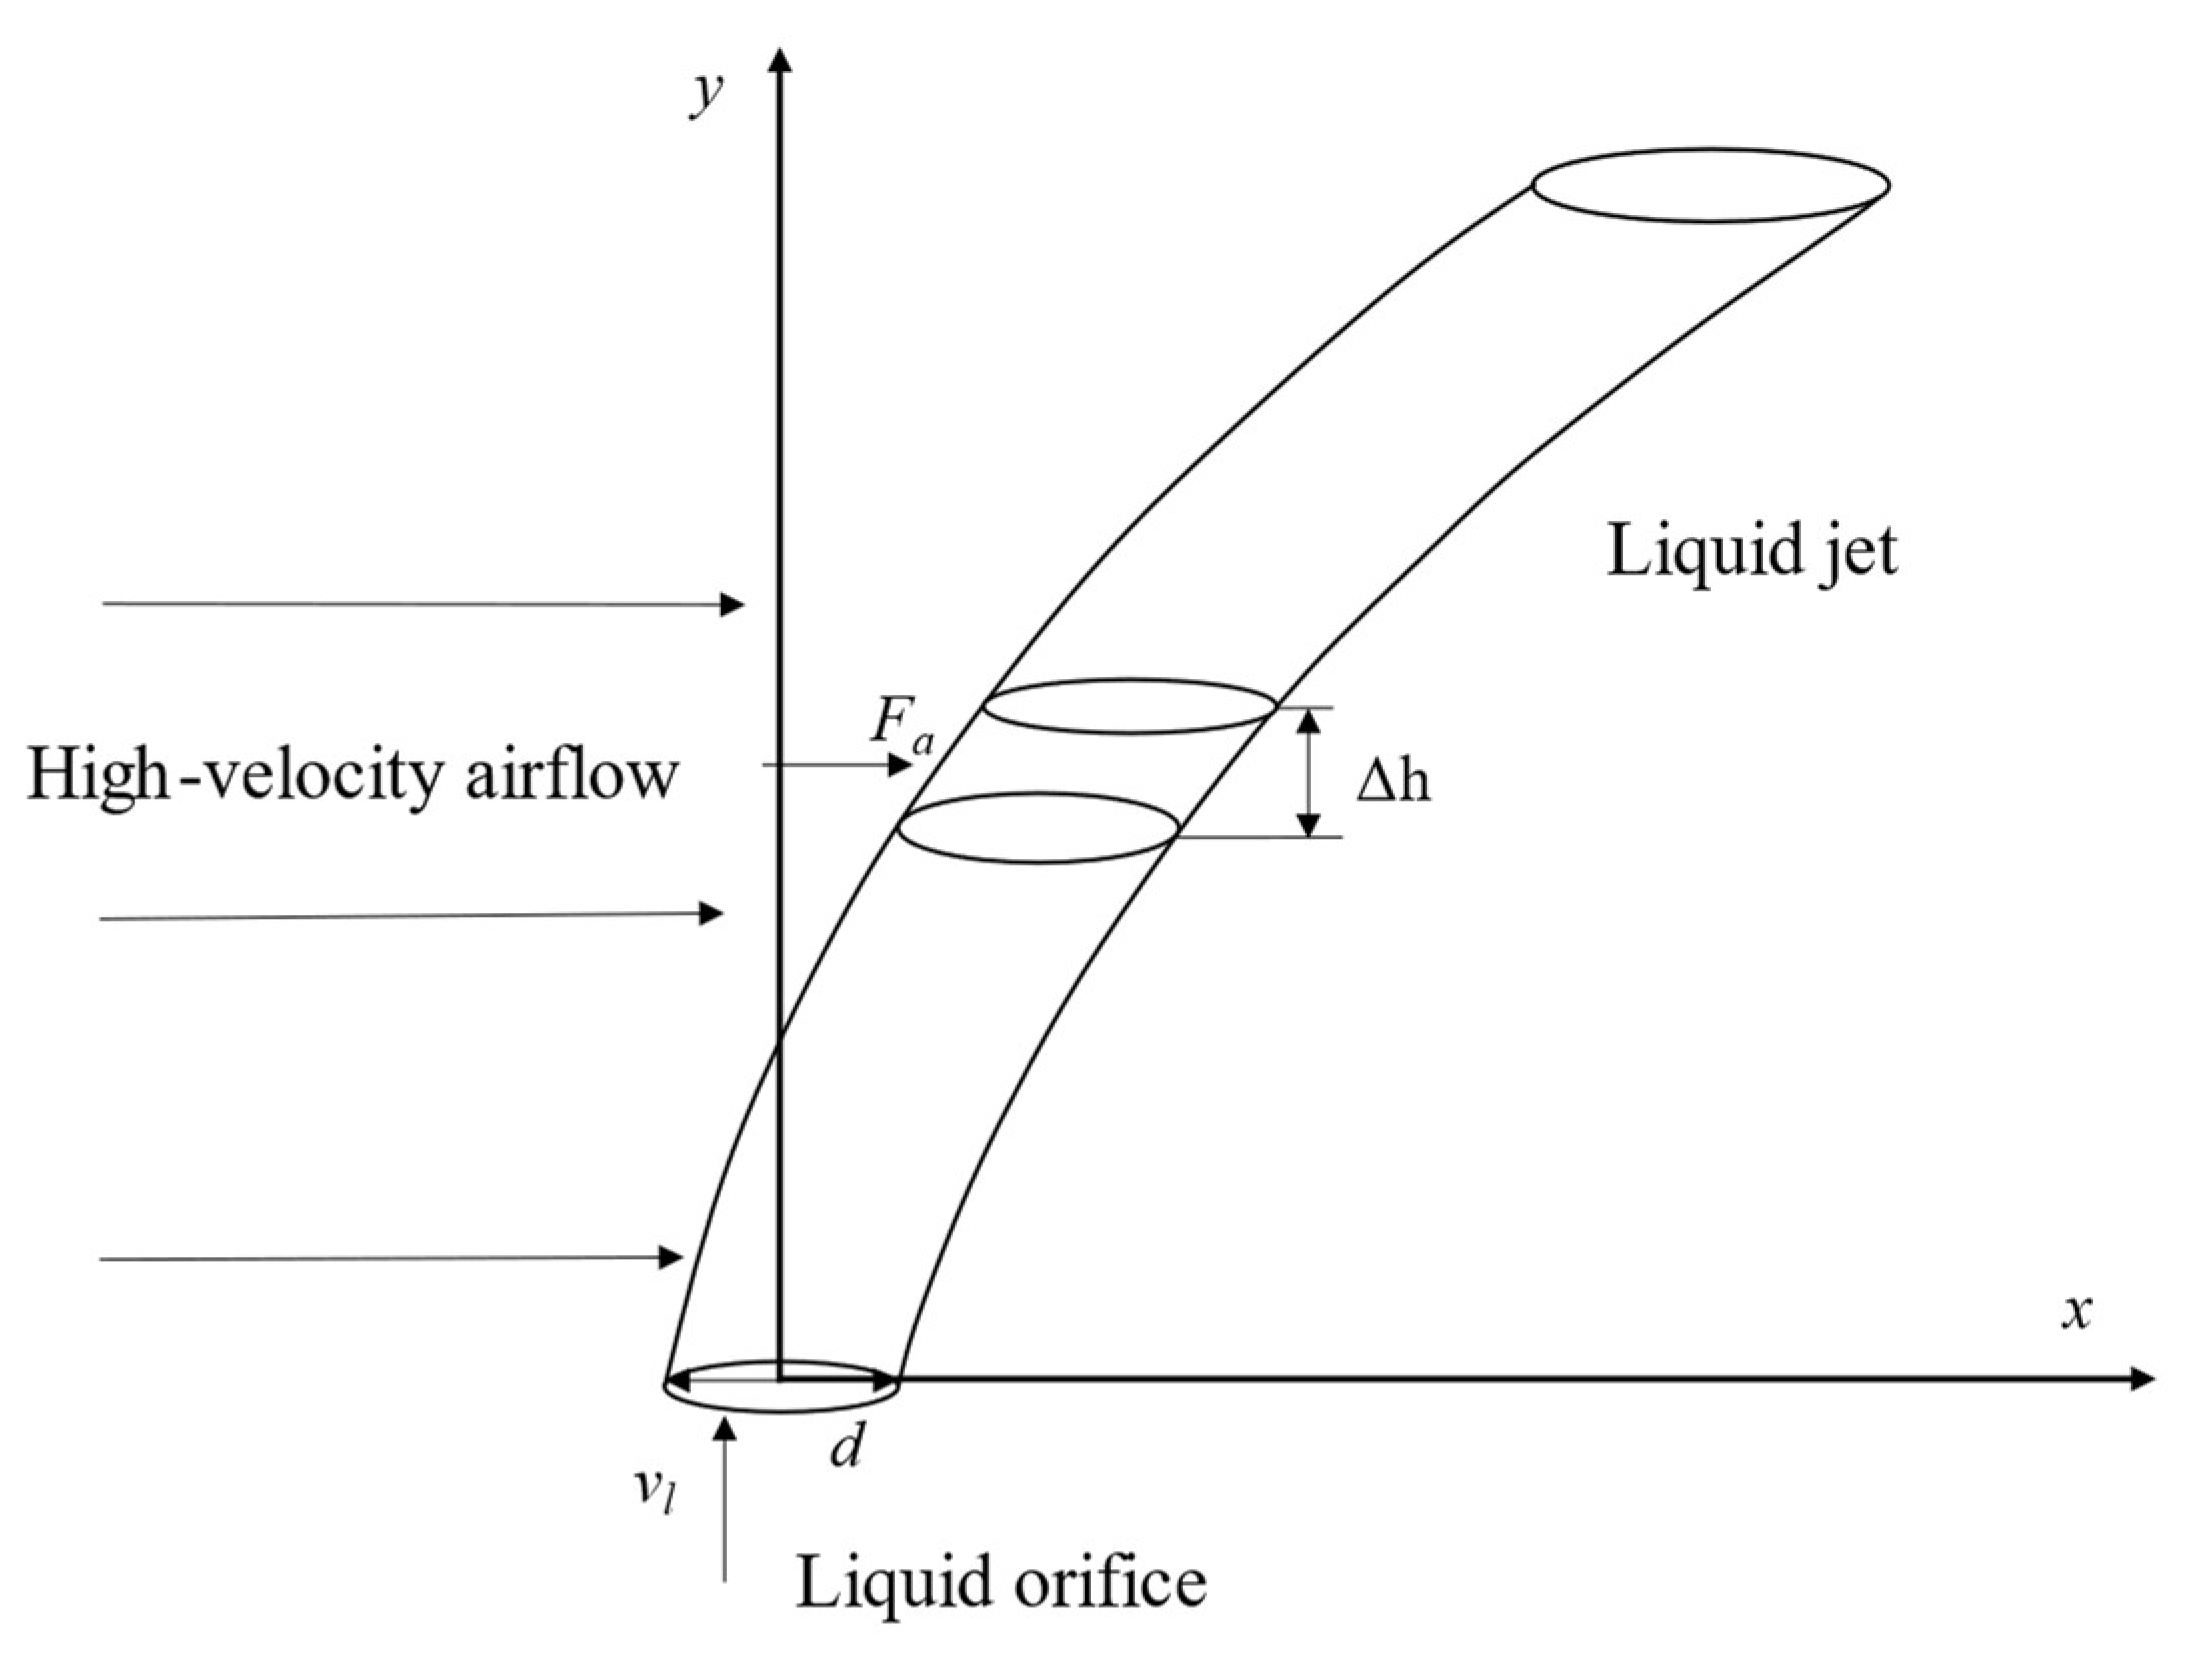
Figure 1. Transverse jet penetration depth mode.
Agriculture 15 01037 g001
Figure 2. Transverse jet penetration depth model of liquid incidence angle θ.
Agriculture 15 01037 g002
Figure 3. Transverse jet atomization device. (a) Device schematic diagram; (b) physical picture of the device. The yellow arrow represents the direction of airflow. The red arrow indicates the direction of the jet flow.
Agriculture 15 01037 g003
Figure 4. Visualization test system. (a) Schematic diagram of the test system; (b) test system installation diagram.
Agriculture 15 01037 g004
Figure 5. Transverse jet atomization test system. (a) Schematic diagram of the test system; (b) test system installation diagram.
Agriculture 15 01037 g005
Figure 6. Schematic diagram of visualization test data processing.
Agriculture 15 01037 g006
Figure 7. Penetration depth images at an incidence angle of 90°. (a) Test 3; (b) Test 13; (c) Test 15. The arrow indicates airflow detection.
Agriculture 15 01037 g007
Figure 8. Boundary curves. (a) Incidence angle θ = 90°; (b) incidence angle θ = 75°; (c) incidence angle θ = 60°; (d) incidence angle θ = 45°.
Agriculture 15 01037 g008
Figure 9. Boundary curves. (a) Test 1; (b) Test 3; (c) Test 13; (d) Test 15.
Agriculture 15 01037 g009
Figure 10. Effects of We on penetration depth. (a) Incidence angle θ = 90°; (b) incidence angle θ = 75°; (c) incidence angle θ = 60°; (d) incidence angle θ = 45°.
Agriculture 15 01037 g010
Figure 11. Penetration depth model at an incidence angle of 90°. (a) The fitting curve based on Equation (10); (b) the fitting curve based on Equation (11).
Agriculture 15 01037 g011
Figure 12. Model validation at an incidence angle of 90°.
Agriculture 15 01037 g012
Figure 13. Penetration depth curve fitting of Test 9.
Agriculture 15 01037 g013
Figure 14. Model validation.
Agriculture 15 01037 g014
Figure 15. Trends of VMD variation with Wea. (a) Wel = 147.28; (b) incidence angle θ = 45°.
Agriculture 15 01037 g015
Figure 16. Trends of VMD variation with Wel. (a) Wea = 418.02; (b) incidence angle θ = 45°.
Agriculture 15 01037 g016
Figure 17. Trends of VMD variation with incidence angle. (a) Wel = 147.28; (b) Wea = 819.19.
Agriculture 15 01037 g017
Table 1. Experimental parameters considered in the tests.
Q a (L/min) Q l (L/min)θ (°)
500.04545
700.09060
900.13575
1100.18090
Table 2. Table of specific parameters of the test.
Case
Number
Q a (L/min) v a (m/s) W e a Q l (L/min) v l (m/s) W e l q
15092.60418.020.0451.9536.82 0.38
25092.60418.020.0903.90147.28 1.51
35092.60418.020.1355.85331.39 3.40
45092.60418.020.1807.80589.13 6.04
570129.63819.190.0451.9536.82 0.19
670129.63819.190.0903.90147.28 0.77
770129.63819.190.1355.85331.39 1.73
870129.63819.190.1807.80589.13 3.08
990166.671354.220.0451.9536.82 0.12
1090166.671354.220.0903.90147.28 0.47
1190166.671354.220.1355.85331.39 1.05
1290166.671354.220.1807.80589.13 1.86
13110203.701914.090.0451.9536.82 0.08
14110203.701914.090.0903.90147.28 0.33
15110203.701914.090.1355.85331.39 0.74
16110203.701914.090.1807.80589.13 1.32
Table 3. Penetration depth curve model and R2.
Case
Number
Simplified Penetration Depth Curve ModelR2Modified Penetration Depth Curve ModelR2
1 y d = 1.26 q 0.5 ( x d ) 0.5 0.856 y d = 0.97 q 0.02 ( x d ) 0.28 0.987
2 y d = 0.76 q 0.5 ( x d ) 0.5 0.846 y d = 0.79 q 0.07 ( x d ) 0.27 0.994
3 y d = 0.46 q 0.5 ( x d ) 0.5 0.955 y d = 0.83 q 0.05 ( x d ) 0.45 0.960
4 y d = 0.38 q 0.5 ( x d ) 0.5 0.968 y d = 0.91 q 0.03 ( x d ) 0.39 0.989
5 y d = 1.67 q 0.5 ( x d ) 0.5 0.910 y d = 0.92 q 0.06 ( x d ) 0.34 0.968
6 y d = 0.90 q 0.5 ( x d ) 0.5 0.879 y d = 0.96 q 0.02 ( x d ) 0.29 0.992
7 y d = 0.56 q 0.5 ( x d ) 0.5 0.960 y d = 0.77 q 0.07 ( x d ) 0.39 0.983
8 y d = 0.46 q 0.5 ( x d ) 0.5 0.946 y d = 0.87 q 0.04 ( x d ) 0.37 0.984
9 y d = 1.58 q 0.5 ( x d ) 0.5 0.894 y d = 0.79 q 0.09 ( x d ) 0.31 0.981
10 y d = 0.84 q 0.5 ( x d ) 0.5 0.916 y d = 0.74 q 0.09 ( x d ) 0.33 0.985
11 y d = 0.64 q 0.5 ( x d ) 0.5 0.952 y d = 0.74 q 0.08 ( x d ) 0.37 0.986
12 y d = 0.57 q 0.5 ( x d ) 0.5 0.956 y d = 0.84 q 0.05 ( x d ) 0.38 0.985
13 y d = 1.57 q 0.5 ( x d ) 0.5 0.966 y d = 0.68 q 0.13 ( x d ) 0.40 0.983
14 y d = 0.96 q 0.5 ( x d ) 0.5 0.926 y d = 0.69 q 0.11 ( x d ) 0.37 0.965
15 y d = 0.69 q 0.5 ( x d ) 0.5 0.924 y d = 0.69 q 0.10 ( x d ) 0.36 0.969
16 y d = 0.52 q 0.5 ( x d ) 0.5 0.979 y d = 0.81 q 0.10 ( x d ) 0.41 0.995
Table 4. R2 of the penetration depth model at an incidence angle of 90°.
Test12345678
R20.9610.9610.9470.9880.9660.9730.9820.984
Test910111213141516
R20.9710.980.9860.9850.9810.9650.9680.992
Table 5. Penetration depth curve model parameters and R2.
TestIncidence Angle of 75°Incidence Angle of 60°Incidence Angle of 45°
C α β R 2 C α β R 2 C α β R 2
10.870.490.480.9920.820.480.450.9920.650.520.570.972
20.550.540.470.9900.500.350.560.9940.350.620.560.970
30.410.530.430.9790.330.480.550.9920.260.460.550.939
40.360.520.440.9950.340.490.520.9870.290.380.810.979
51.060.500.500.9961.070.490.450.9850.760.510.560.978
60.670.480.470.9930.650.520.520.9760.430.540.570.967
70.520.570.420.9770.440.430.550.9720.330.940.570.959
80.450.530.430.9910.460.480.530.9840.360.250.790.983
91.250.500.490.9901.260.490.440.9560.820.500.530.958
100.770.490.490.9930.760.510.530.9830.460.510.550.973
110.590.230.400.9620.480.690.590.9740.360.590.620.949
120.530.540.460.9820.540.470.530.9840.420.410.630.982
131.260.510.530.9921.480.500.480.9520.620.510.560.980
140.780.480.440.9820.810.520.580.9770.480.530.600.988
150.620.360.400.9590.500.580.600.9720.340.550.610.973
160.450.330.580.9910.530.320.510.9760.450.800.730.981
Table 6. R2 of the penetration depth model for liquid injection angles θ.
Test12345678
θ75°0.9880.9850.9910.9830.9950.9880.9570.973
60°0.9810.9930.9640.9870.9850.9760.9720.984
45°0.9710.9690.9380.9250.9770.9650.9570.935
Test910111213141516
θ75°0.9870.9910.9330.9740.9920.9690.9270.987
60°0.9440.9830.9710.9840.9470.9750.9670.942
45°0.9580.9730.9400.9240.9800.9820.9660.963
Table 7. VMD data of the transverse jet atomization test (unit: μm).
Incidence Angle (°)WelWea
418.02819.191354.221914.09
4536.82117.5586.2844.2522.26
147.28127.2773.2533.3027.37
331.39137.2559.5836.3719.28
589.13125.9762.3539.2416.58
6036.8275.6532.8716.7414.35
147.2864.7626.2117.5615.37
331.3958.9139.0717.1714.26
589.1359.7436.8130.3816.37
7536.8267.5434.2621.2512.85
147.2857.2623.2519.5716.59
331.3972.2527.2616.3614.29
589.1350.2732.5920.1717.64
9036.8229.9318.3916.8914.36
147.2850.8329.1717.1216.85
331.3944.9530.6417.2315.26
589.1337.6827.7317.6614.37
Disclaimer/Publisher’s Note: The statements, opinions and data contained in all publications are solely those of the individual author(s) and contributor(s) and not of MDPI and/or the editor(s). MDPI and/or the editor(s) disclaim responsibility for any injury to people or property resulting from any ideas, methods, instructions or products referred to in the content.