4.2.1. Coffee Cherries Motion Analysis
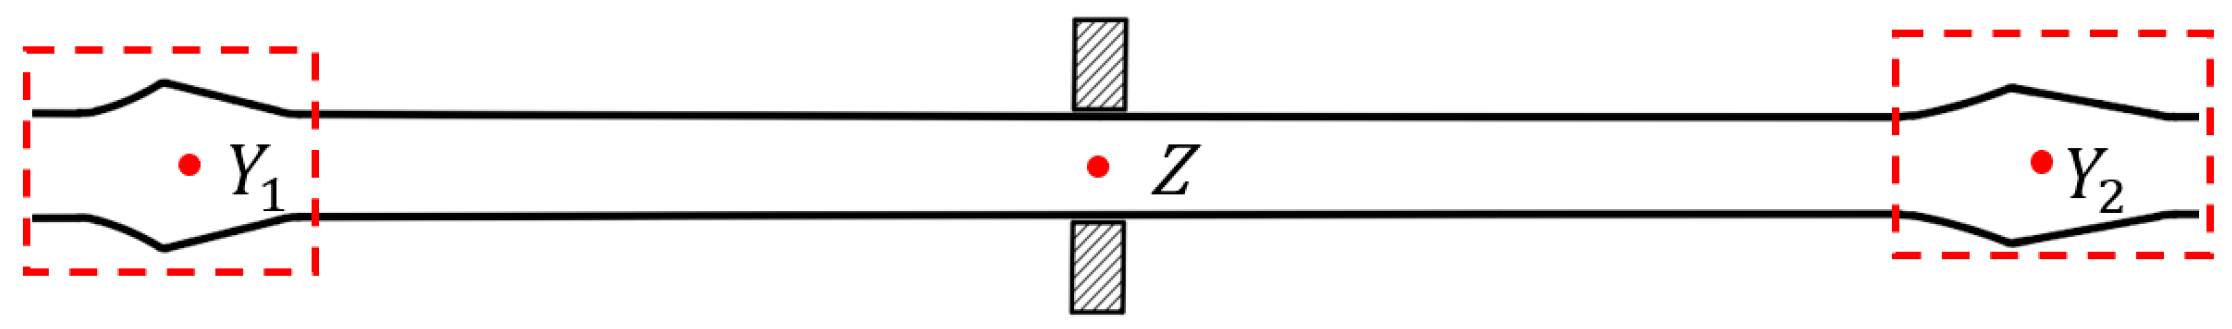
The analysis of the high-velocity dynamic video revealed that the coffee cherries underwent two extreme positions and one intermediate transition position during its motion (
Figure 13). States 1 and 3 represent the moments when the fruit reaches its maximum velocity, with these extreme positions being symmetrically related to the connection point,
, between the branch and fruit stem, as illustrated in
Figure 14. In State 1, the fruit velocity (
) was positive, whereas in State 3,
became negative. However, at these two extreme positions, the absolute velocity values were nearly equal.
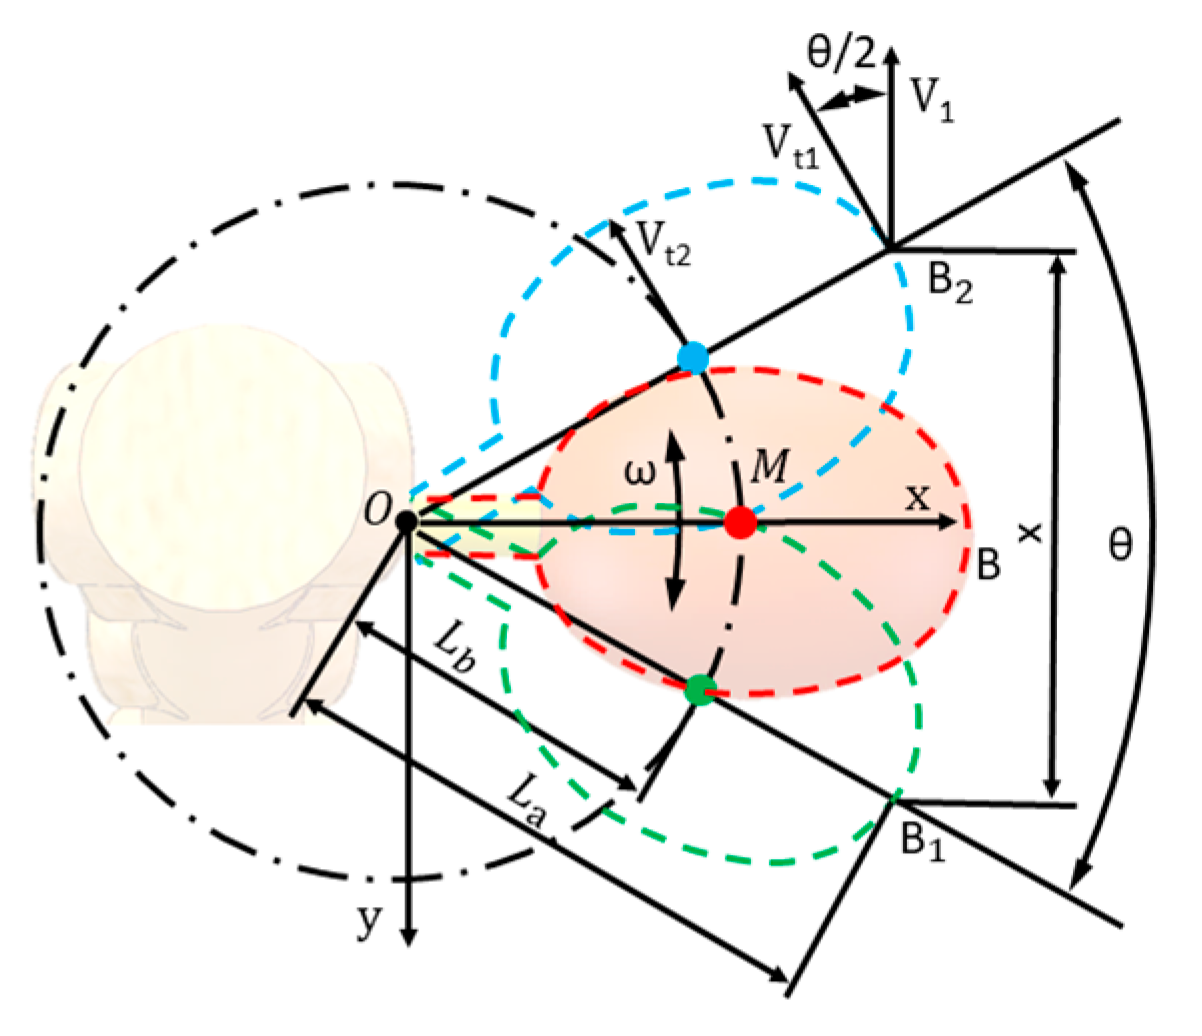
Because the coffee cherry’s stem is a flexible structure, it can exert a tensile force that constrains the movement of the fruit under external vibration. High-velocity video analysis confirmed this interaction, indicating that the stem remained under constant tension during the motion. Consequently, the long axis of the fruit remained collinear with the stem throughout its movement.
Based on this observation, when the coffee cherries reached their maximum velocity, their instantaneous motion could be inferred to be circular, with the connection point O as the center and
as the radius. This analysis established a relative motion relationship between the coffee cherries, stem, and branch (
Figure 14).
The analysis of the high-velocity camera footage facilitated the identification of the moment when the velocity of the marker point of the coffee cherries reached its maximum. The displacement relationship between the root of the fruit peduncle and velocity marker point at this moment is illustrated in
Figure 15.
Using the extreme displacement relationships of the coffee cherries shown in
Figure 14 and
Figure 15, the maximum movement displacement (
) of the coffee cherries relative to the branch at the peak velocity can be determined as follows:
where
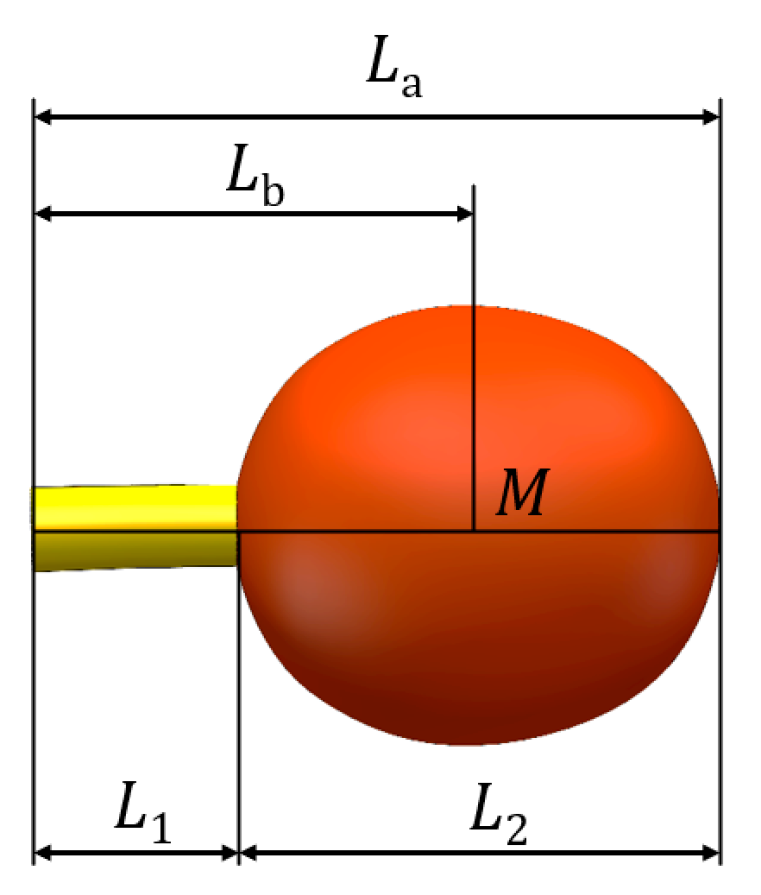
Using the pedicel length (
L1) and long-axis length (
L2) data from
Table 2 for the three maturity stages of coffee cherries, along with the coffee cherries motion relationship diagram, the angle (
) between the fruit in State 1 and State 2 can be determined as follows:
Using High-Velocity Video Tracking Software V1.0 to analyze the high-velocity dynamic video, the velocity (
) of the coffee cherries at their maximum velocity was obtained. Combined with the coffee cherries motion relationship diagram shown in
Figure 14, the linear velocity (
) of the marker point on the coffee cherries can be determined as follows:
The angular velocity of the coffee cherries at the moment of maximum velocity,
ω is
The linear velocity of the coffee cherries center of mass,
, is as follows:
The centripetal acceleration at the center of mass M of the coffee cherries,
, is as follows:
At the maximum velocity, the coffee cherries underwent instantaneous circular motion and experienced centrifugal force. Detachment occurred when the centrifugal force exceeded the binding force between the pedicel and fruit. The theoretical detachment force (
Fn) of a coffee cherry can be calculated as follows:
4.2.2. Test Results and Analysis of Vibration Frequency and Amplitude Parameters
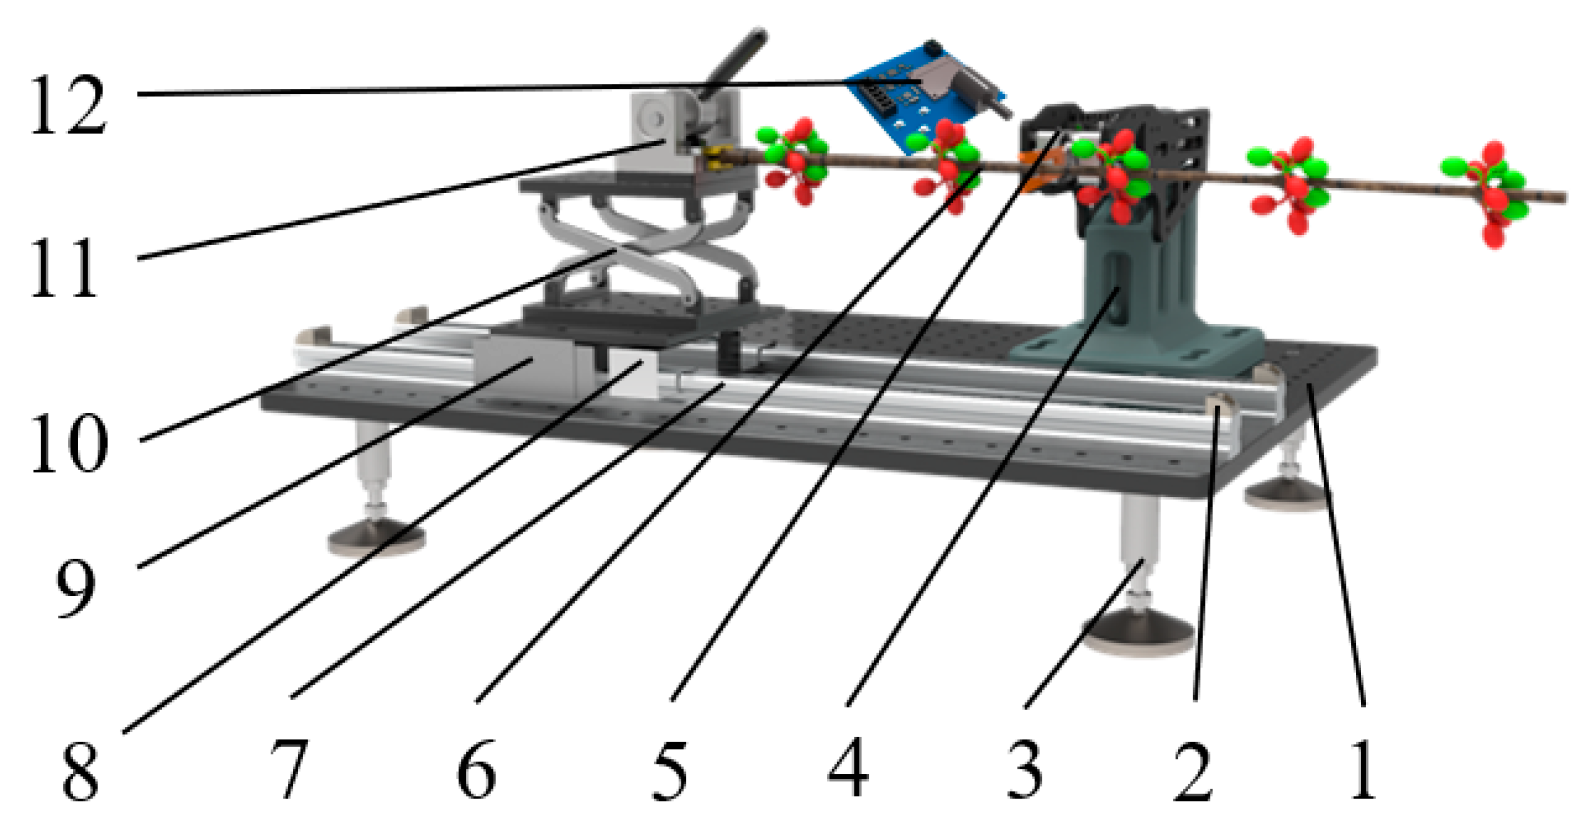
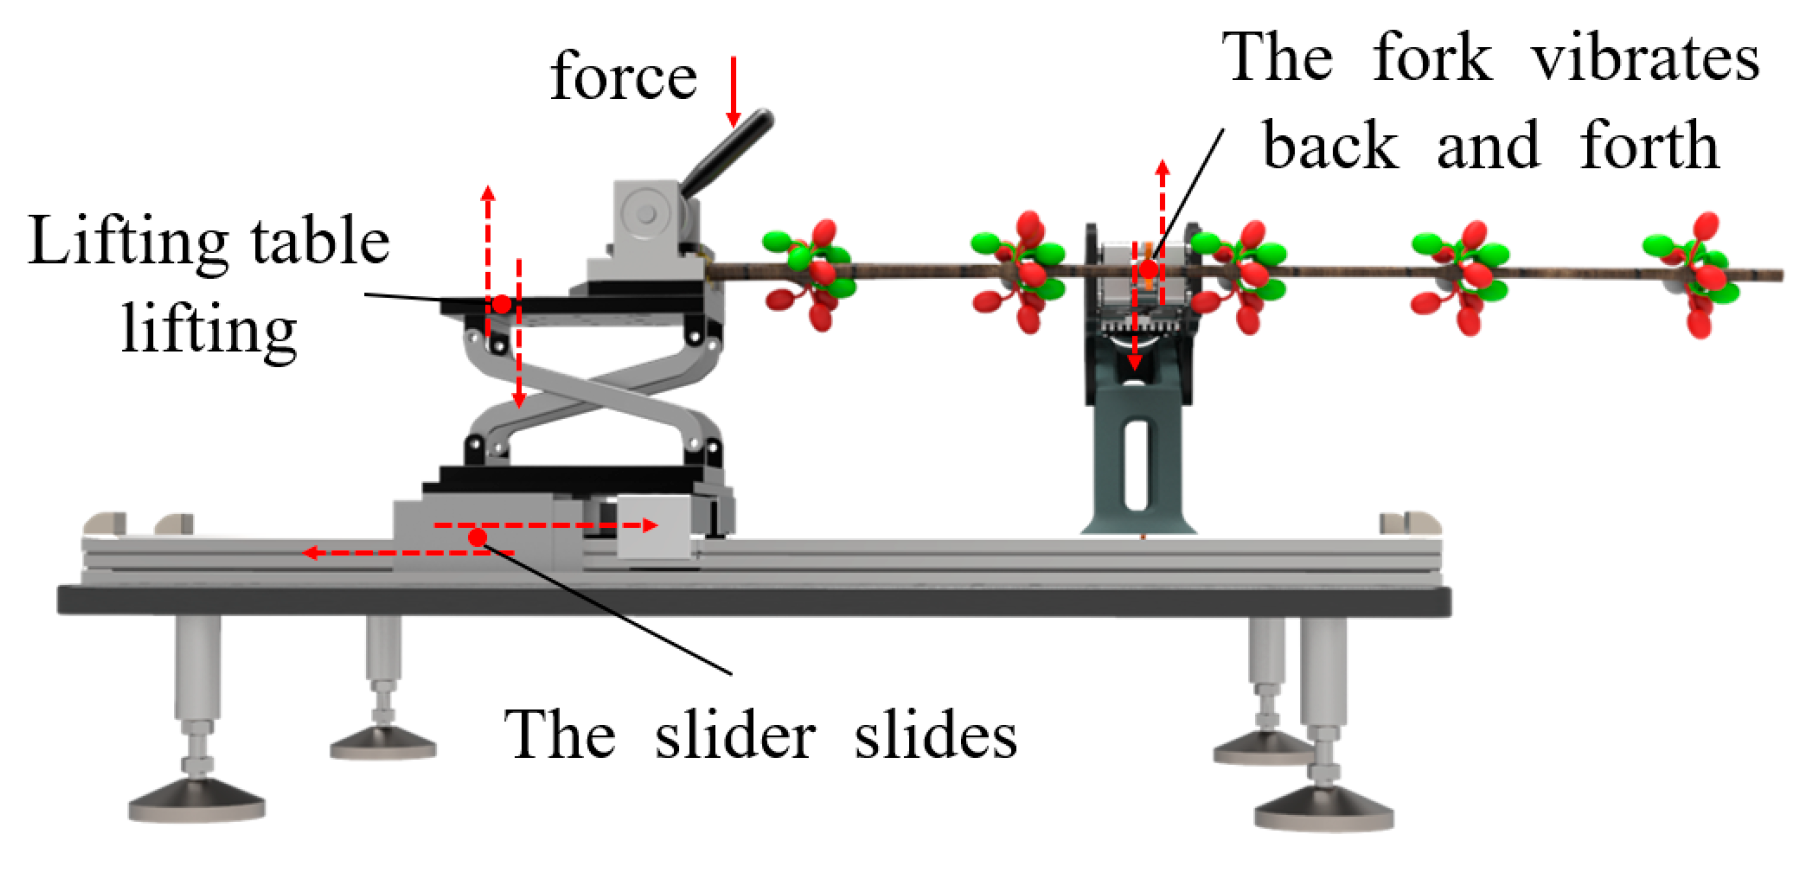
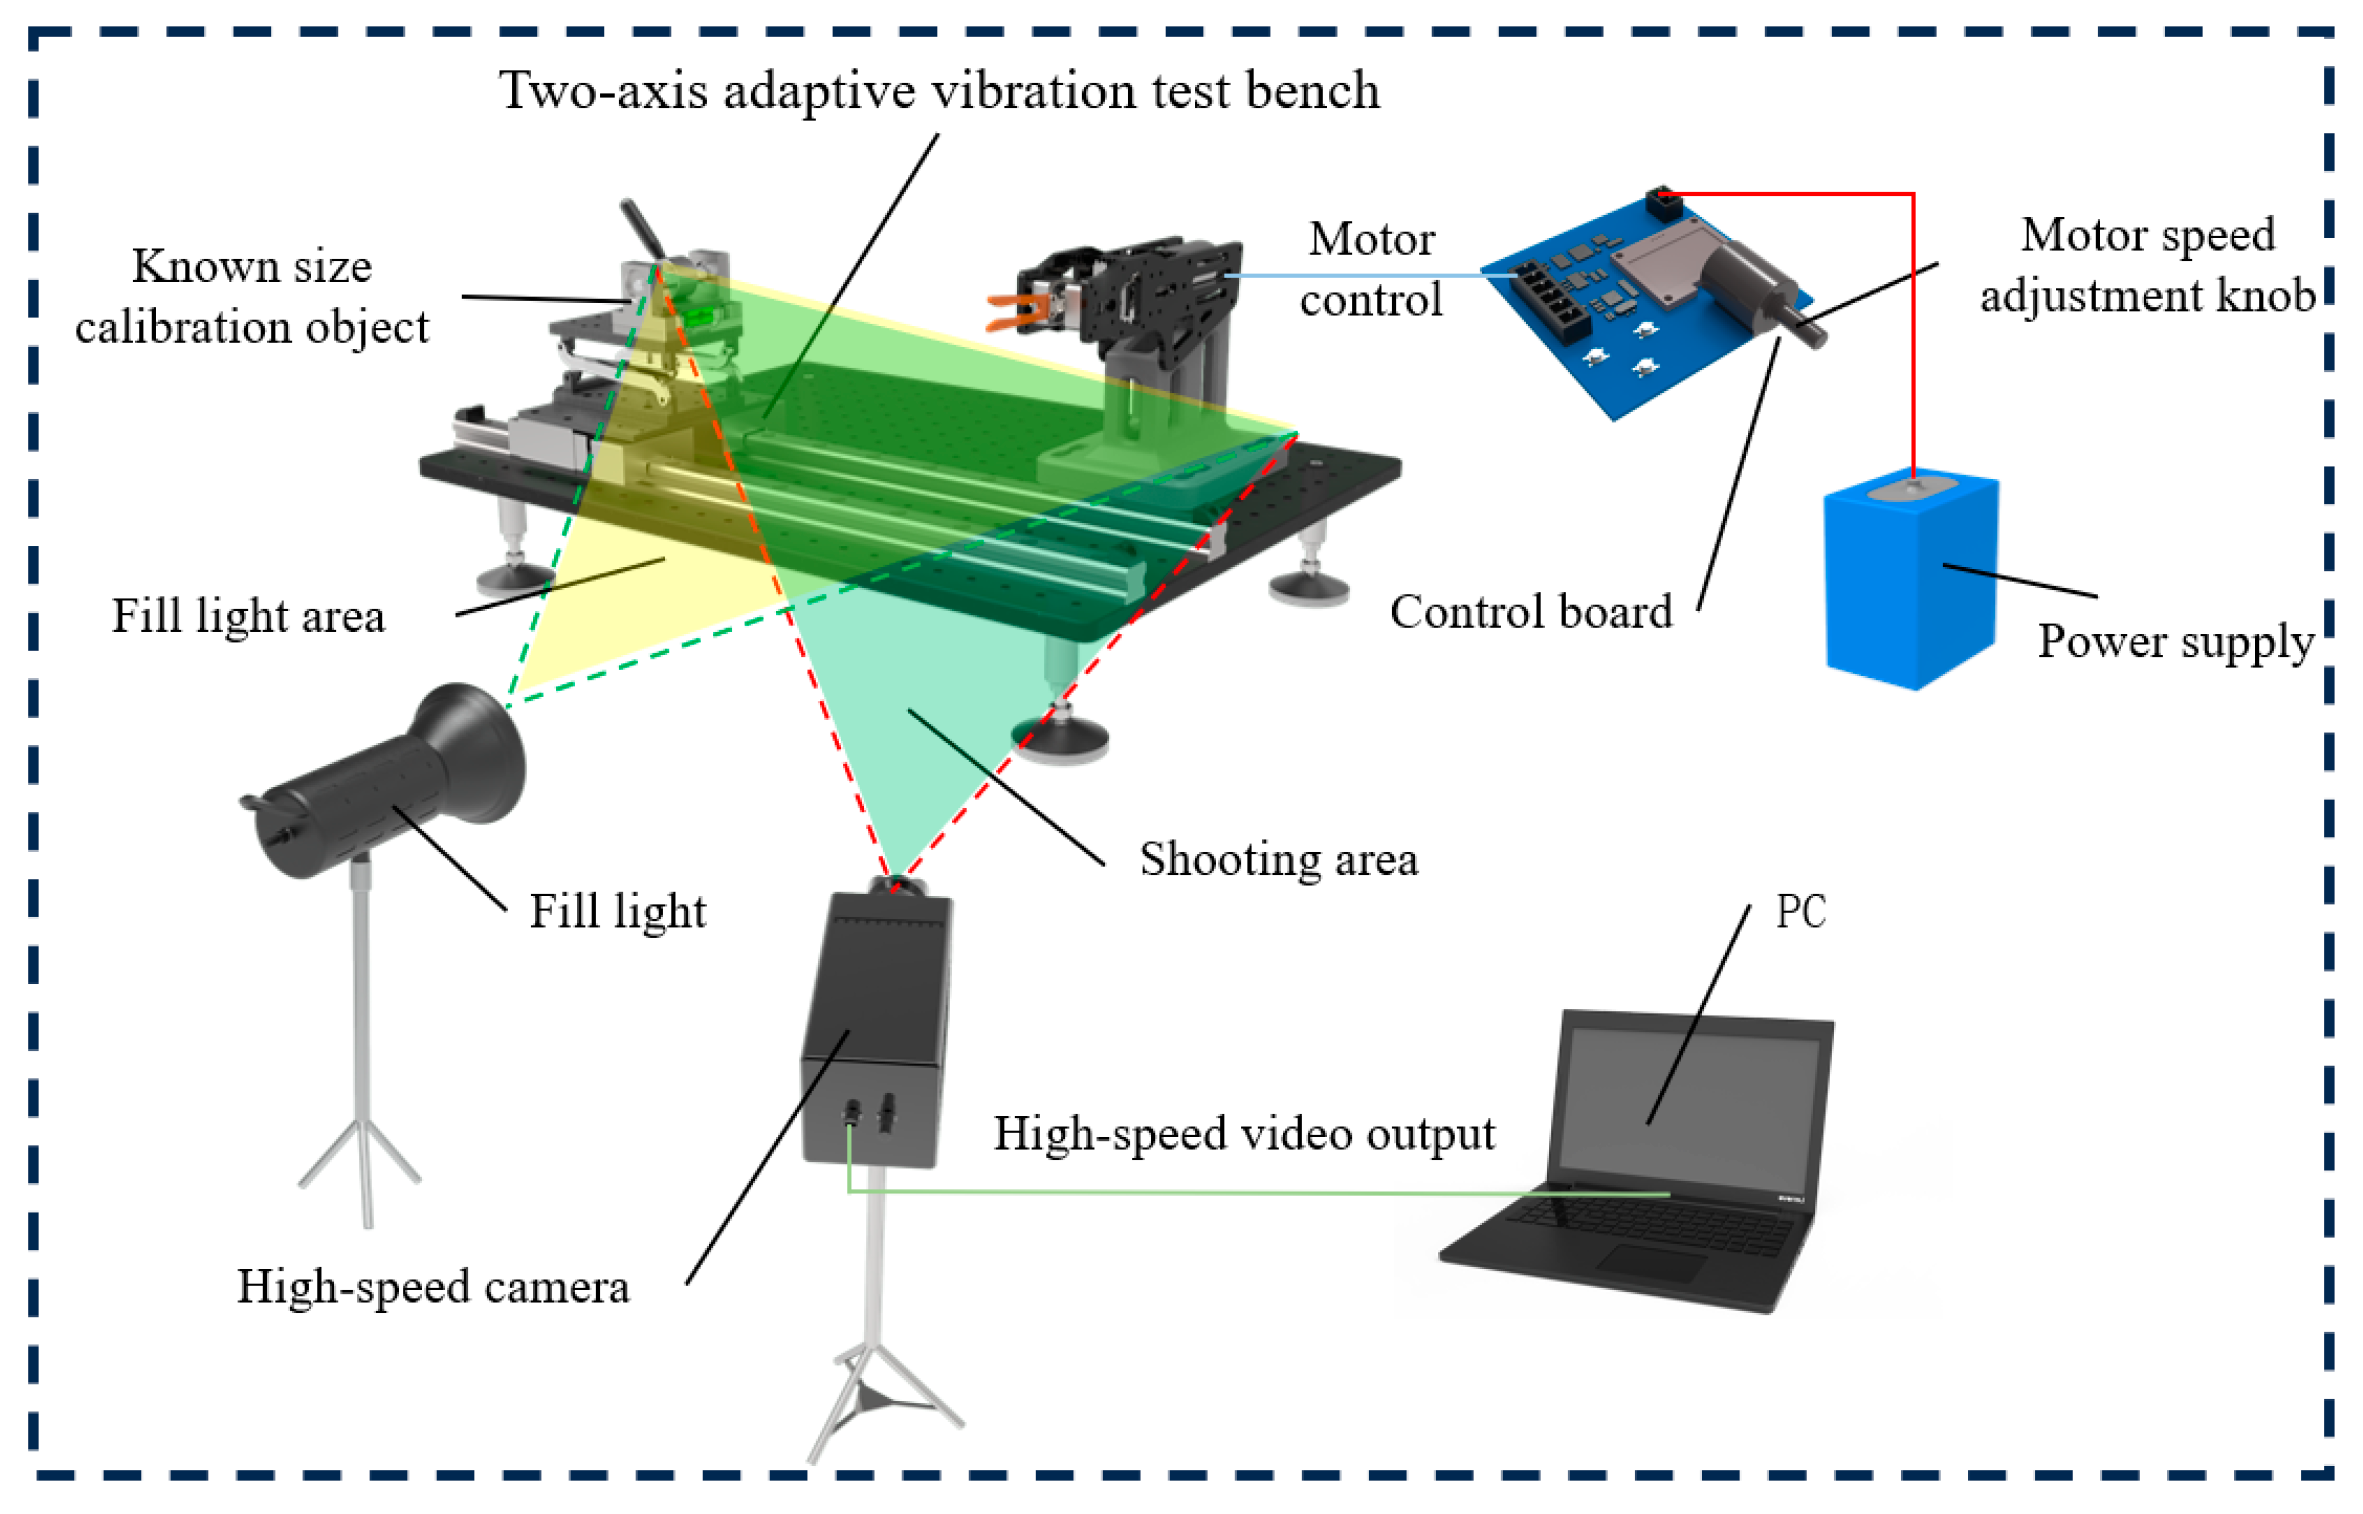
The test for determining the optimal combination of vibration frequency and amplitude aimed to identify the optimal vibration parameters. A high-velocity dynamic monitoring system was used as the test equipment, and coffee branches with uniform thickness and consistent maturity with the attached fruits were selected as test samples. To ensure consistency, branch length was standardized at 495 mm with six Y-shaped nodes, each bearing one unripe (green) fruit, one half-ripe fruit, and one ripe fruit.
The excitation force was applied at Vibration Position 2 for 1 s, with the vibration frequency and amplitude selected as the test factors, and the theoretical detachment rate of the fruits at different maturity levels was used as the evaluation index. A factorial experiment was designed with 25 groups, with each testing six samples. Before each test, the positions of green, half-ripe, and ripe fruits were recorded and marked with green, yellow, and red dots, respectively (
Figure 16).
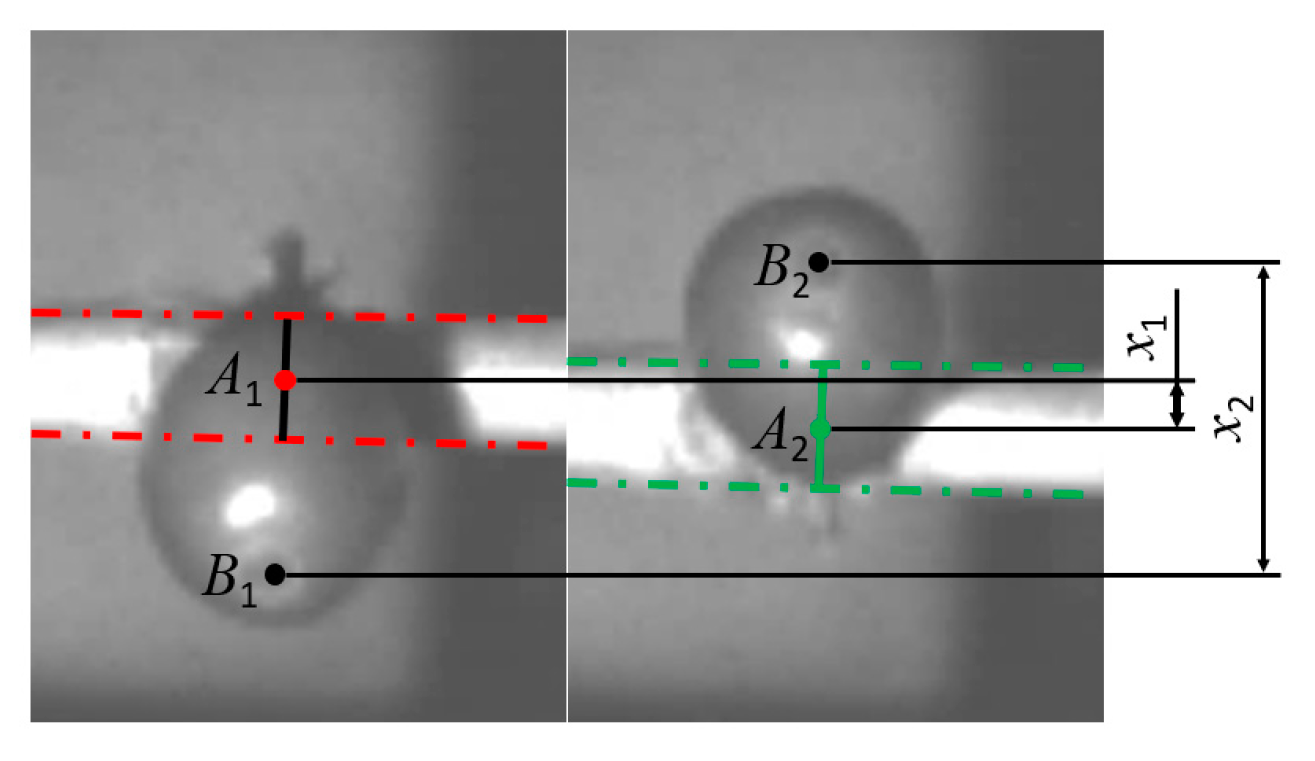
After the test, a high-velocity video analysis was performed using the high-velocity video target-tracking measurement software V1.0. The fruit tips were marked at their recorded positions for green, half-ripe, and ripe fruits, and the velocity (
v1), displacement (
x1), and displacement (
x2) at the connection point between the fruit stem and the branch were recorded. These data were then substituted into the theoretical detachment force calculation formula (Equation (11)) to determine the theoretical detachment force for each maturity level. The experimental design and calculation results for the theoretical detachment force of green, half-ripe, and ripe fruits are presented in
Table 7,
Table 8 and
Table 9, respectively.
The theoretical detachment rate calculation formulas for green, semi-ripe, and ripe coffee cherries were as follows:
where
η1 represents the theoretical shedding rate of green fruits (%).
represents the theoretical detachment rate of semi-ripe coffee cherries (%).
denotes the theoretical detachment rate of ripe coffee cherries (%).
n1 denotes the number of green coffee cherries for which the theoretical detachment force exceeded the actual detachment force.
n2 denotes the number of semi-ripe coffee cherries for which the theoretical detachment force exceeded the actual detachment force.
n3 denotes the number of ripe coffee cherries for which the theoretical detachment force exceeded the actual detachment force.
The actual detachment force ranges for green, half-ripe, and ripe coffee cherries were 4.26–5.28, 3.09–4.33, and 2.51–3.27 N, respectively. Based on different theoretical detachment force thresholds, the detachment conditions at various maturity levels were determined as follows: when the theoretical detachment force exceeded 4.26 N, all green, half-ripe, and ripe fruits were detached; when it exceeded 3.09 N, only half-ripe and ripe fruits were detached; and when it exceeded 2.51 N, only ripe fruits were detached. The theoretical detachment numbers for each fruit type were recorded in
Table 7,
Table 8 and
Table 9 by comparing the theoretical detachment forces in
Table 7,
Table 8 and
Table 9 with the actual detachment force ranges. These values were then substituted into Formulas (12)–(14) to calculate the theoretical detachment rates for each maturity level; the results are presented in
Table 10.
Based on the data in
Table 10, the theoretical detachment rates for green, half-ripe, and ripe fruits are plotted in
Figure 17. The figure revealed that as the amplitude increased from 3.26 to 16.84 mm, the theoretical detachment rate of green fruits gradually increased. Similarly, the detachment rates of the half-ripe and ripe fruits exhibited stage-wise growth as the amplitude increased from 3.26 to 13.48 mm. However, when the amplitude exceeded 13.48 mm and reached 16.84 mm, the detachment rates of half-ripe and ripe fruits began to decline. This suggested that while a moderate increase in amplitude continuously enhanced the harvesting rate of green fruits, half-ripe and ripe fruits had an optimal amplitude beyond which the detachment rate decreased.
When the amplitude was 3.26 mm, the theoretical detachment rates for green and ripe fruits remained at zero, indicating that these maturity stages could not detach. When the amplitude increased and the vibration frequency reached 65 Hz, the theoretical detachment rate of the ripe fruit suddenly increased to 16.67%. However, this remained too low to meet coffee-harvesting requirements. As the amplitude increased to 6.74 mm, the detachment rates for green, half-ripe, and ripe fruits increased significantly, reaching maximum theoretical harvesting rates of 16.67% for green fruit, 33.33% for half-ripe fruit, and 50.00% for ripe fruit. Despite this increase, the detachment rate of ripe fruits remained insufficient to meet the harvesting requirements.
At an amplitude of 10.10 mm, the theoretical harvesting rates for all three fruit maturity stages showed significant improvement, with maximum detachment rates of 33.33% for green fruit, 50.00% for half-ripe fruit, and 83.33% for ripe fruit. At this point, the ripe fruit detachment rate reached 83.33%, meeting coffee-harvesting requirements. When the amplitude increased to 13.48 mm, the detachment rate for green fruit remained unchanged, whereas that for half-ripe fruit increased significantly to 83.33%, and the rate for ripe fruit remained at 83.33%. The high detachment rate of half-ripe fruits exceeded the acceptable harvesting requirements. At an amplitude of 16.84 mm, the detachment rate for green fruit increased to 66.67%, whereas the rates for ripe and half-ripe fruits decreased to 66.67%. Although the harvesting rates of green and half-ripe fruits were high, the decrease in ripe fruit detachment made this amplitude unsuitable for coffee harvesting.
A further analysis of
Figure 17 indicated that at an amplitude of 10.10 mm and a vibration frequency of 55 Hz, the theoretical detachment rate for green fruit was at its minimum of 16.67%, for half-ripe fruit it was at its minimum of 33.33%, and for ripe fruit it was at its maximum of 83.33%. At this point, the detachment rates for green and half-ripe fruits remained below 33.33%, whereas the rate for ripe fruit reached its statistical maximum, meeting the coffee-harvesting requirements. Therefore, the optimal vibration parameters for coffee harvesting were the frequency of 55 Hz and the amplitude of 10.10 mm (The optimal vibration parameters are highlighted in green in the figure).


