

Multimodal Feature-Driven Deep Learning for the Prediction of Duck Body Dimensions and Weight

 , , ,
, , ,
Abstract
1. Introduction
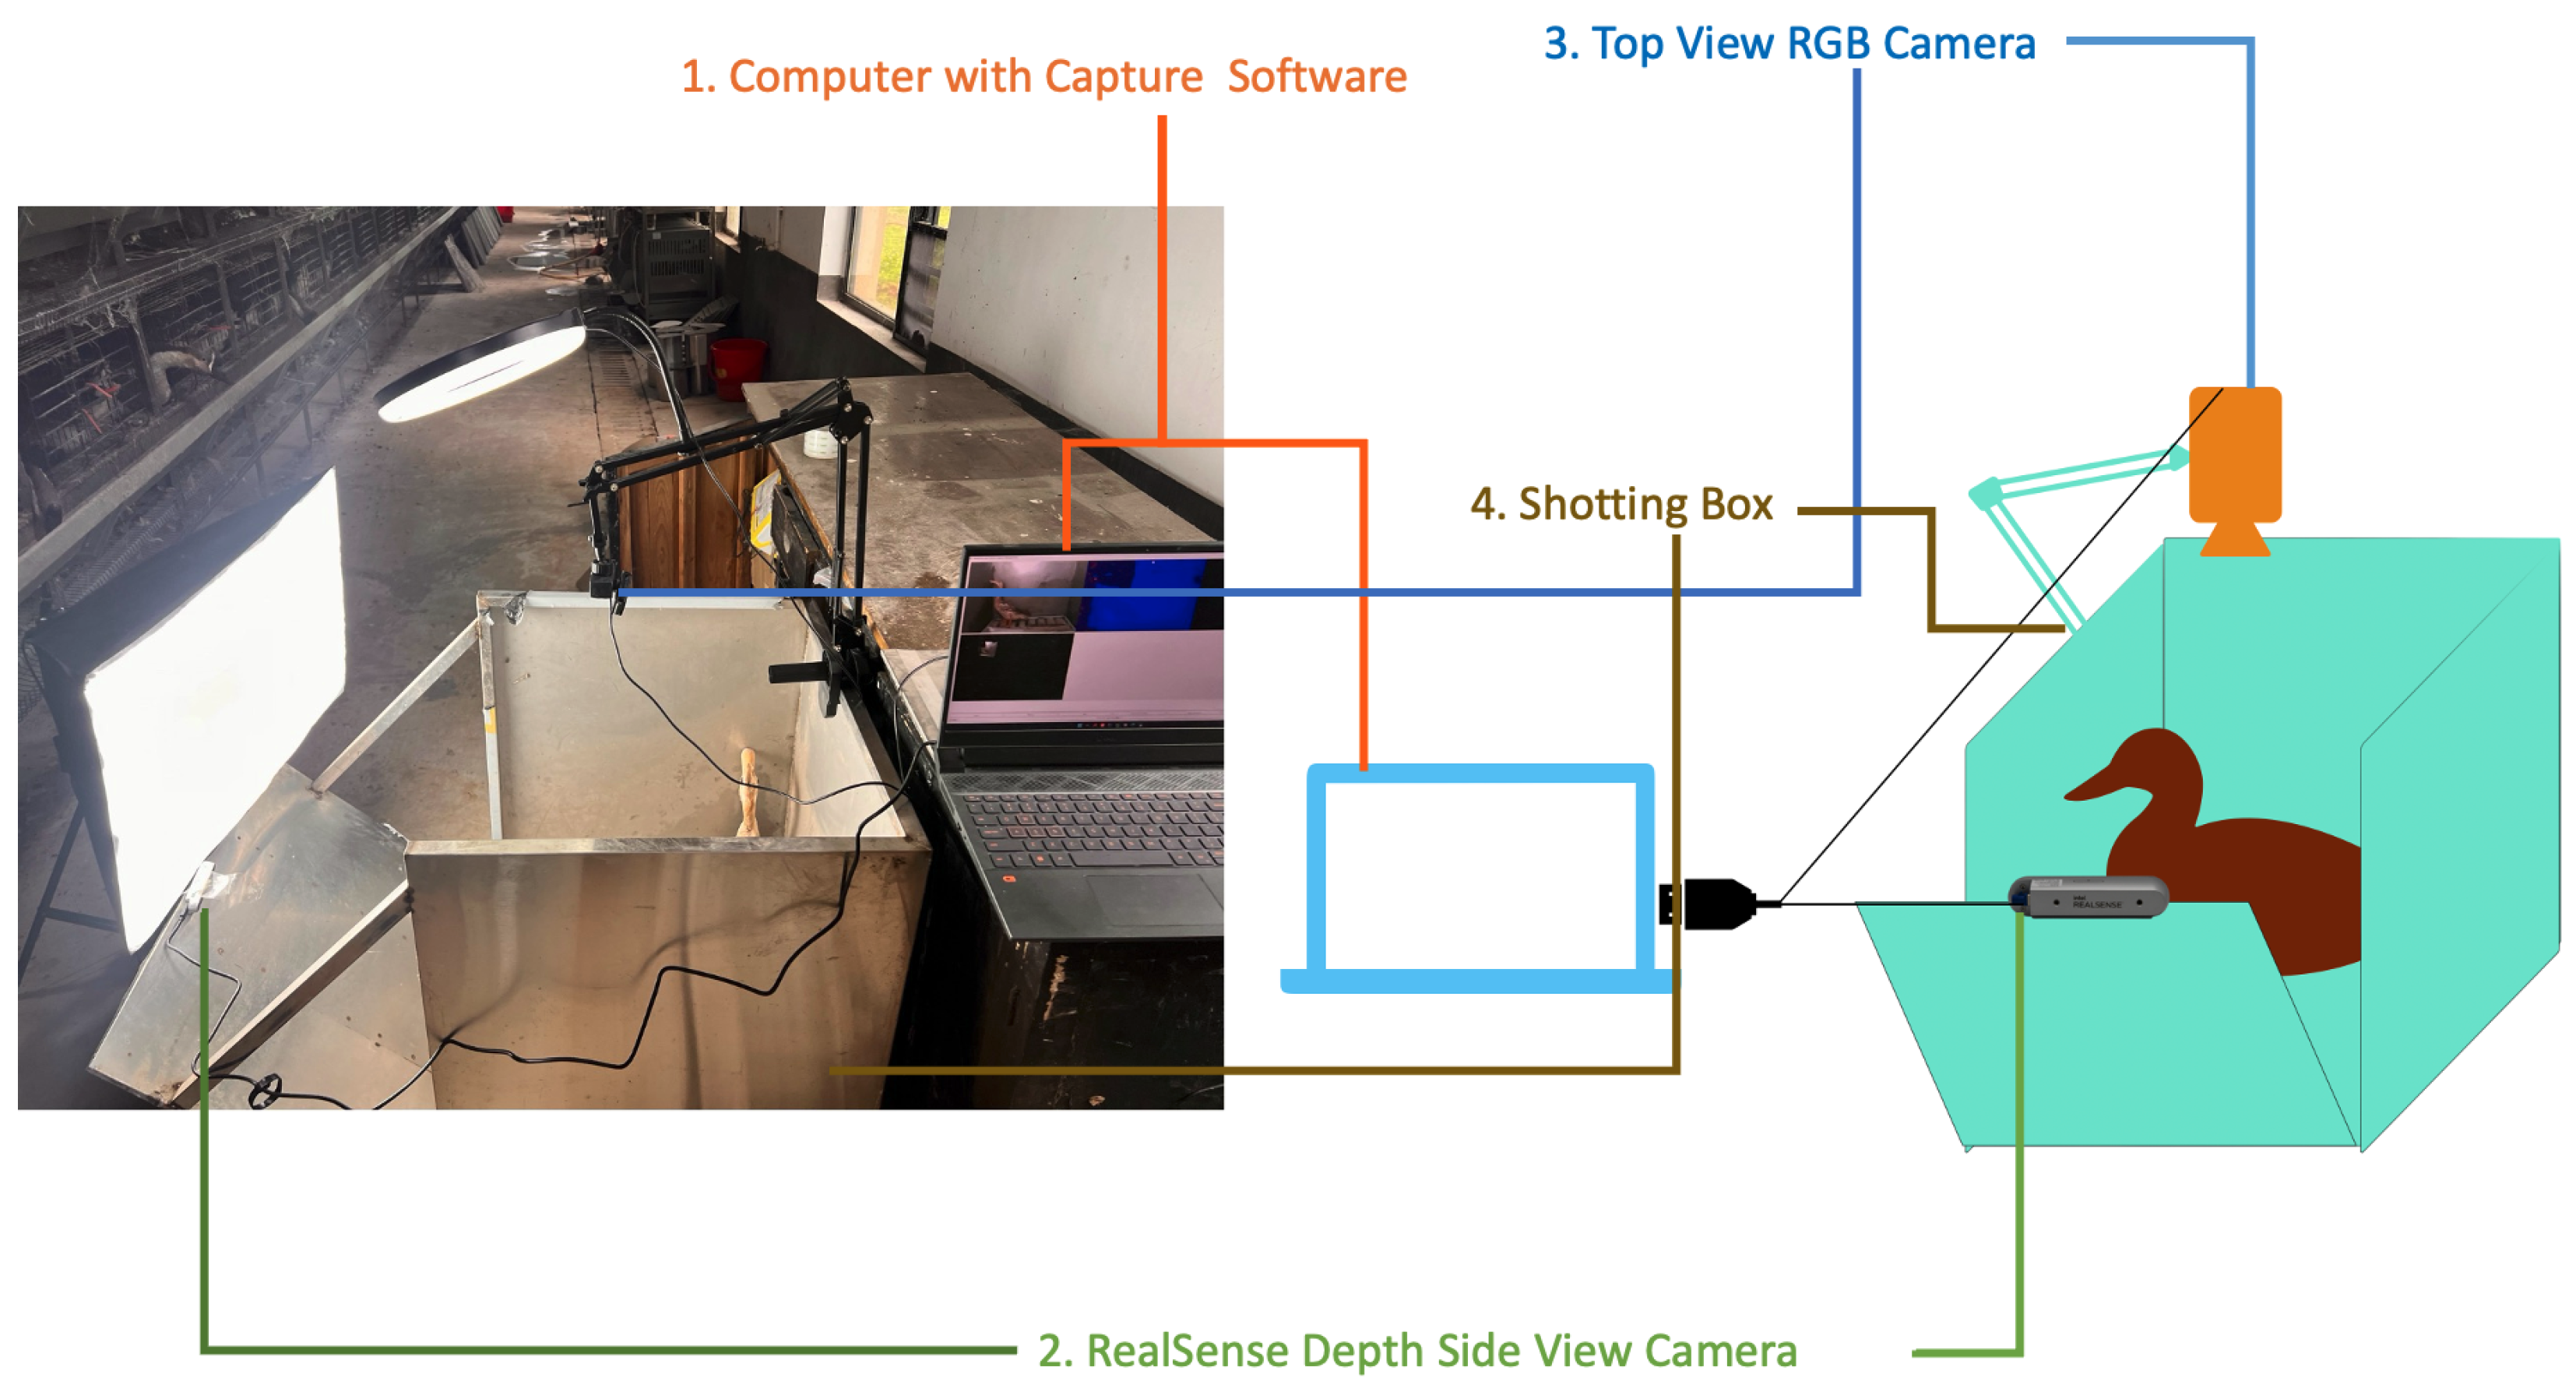
- To propose a comprehensive hardware–software integrated multidimensional and multi-view visual data acquisition scheme for ducks, which is utilized to collect a dataset of duck visual data along with their corresponding body dimensions and weight.
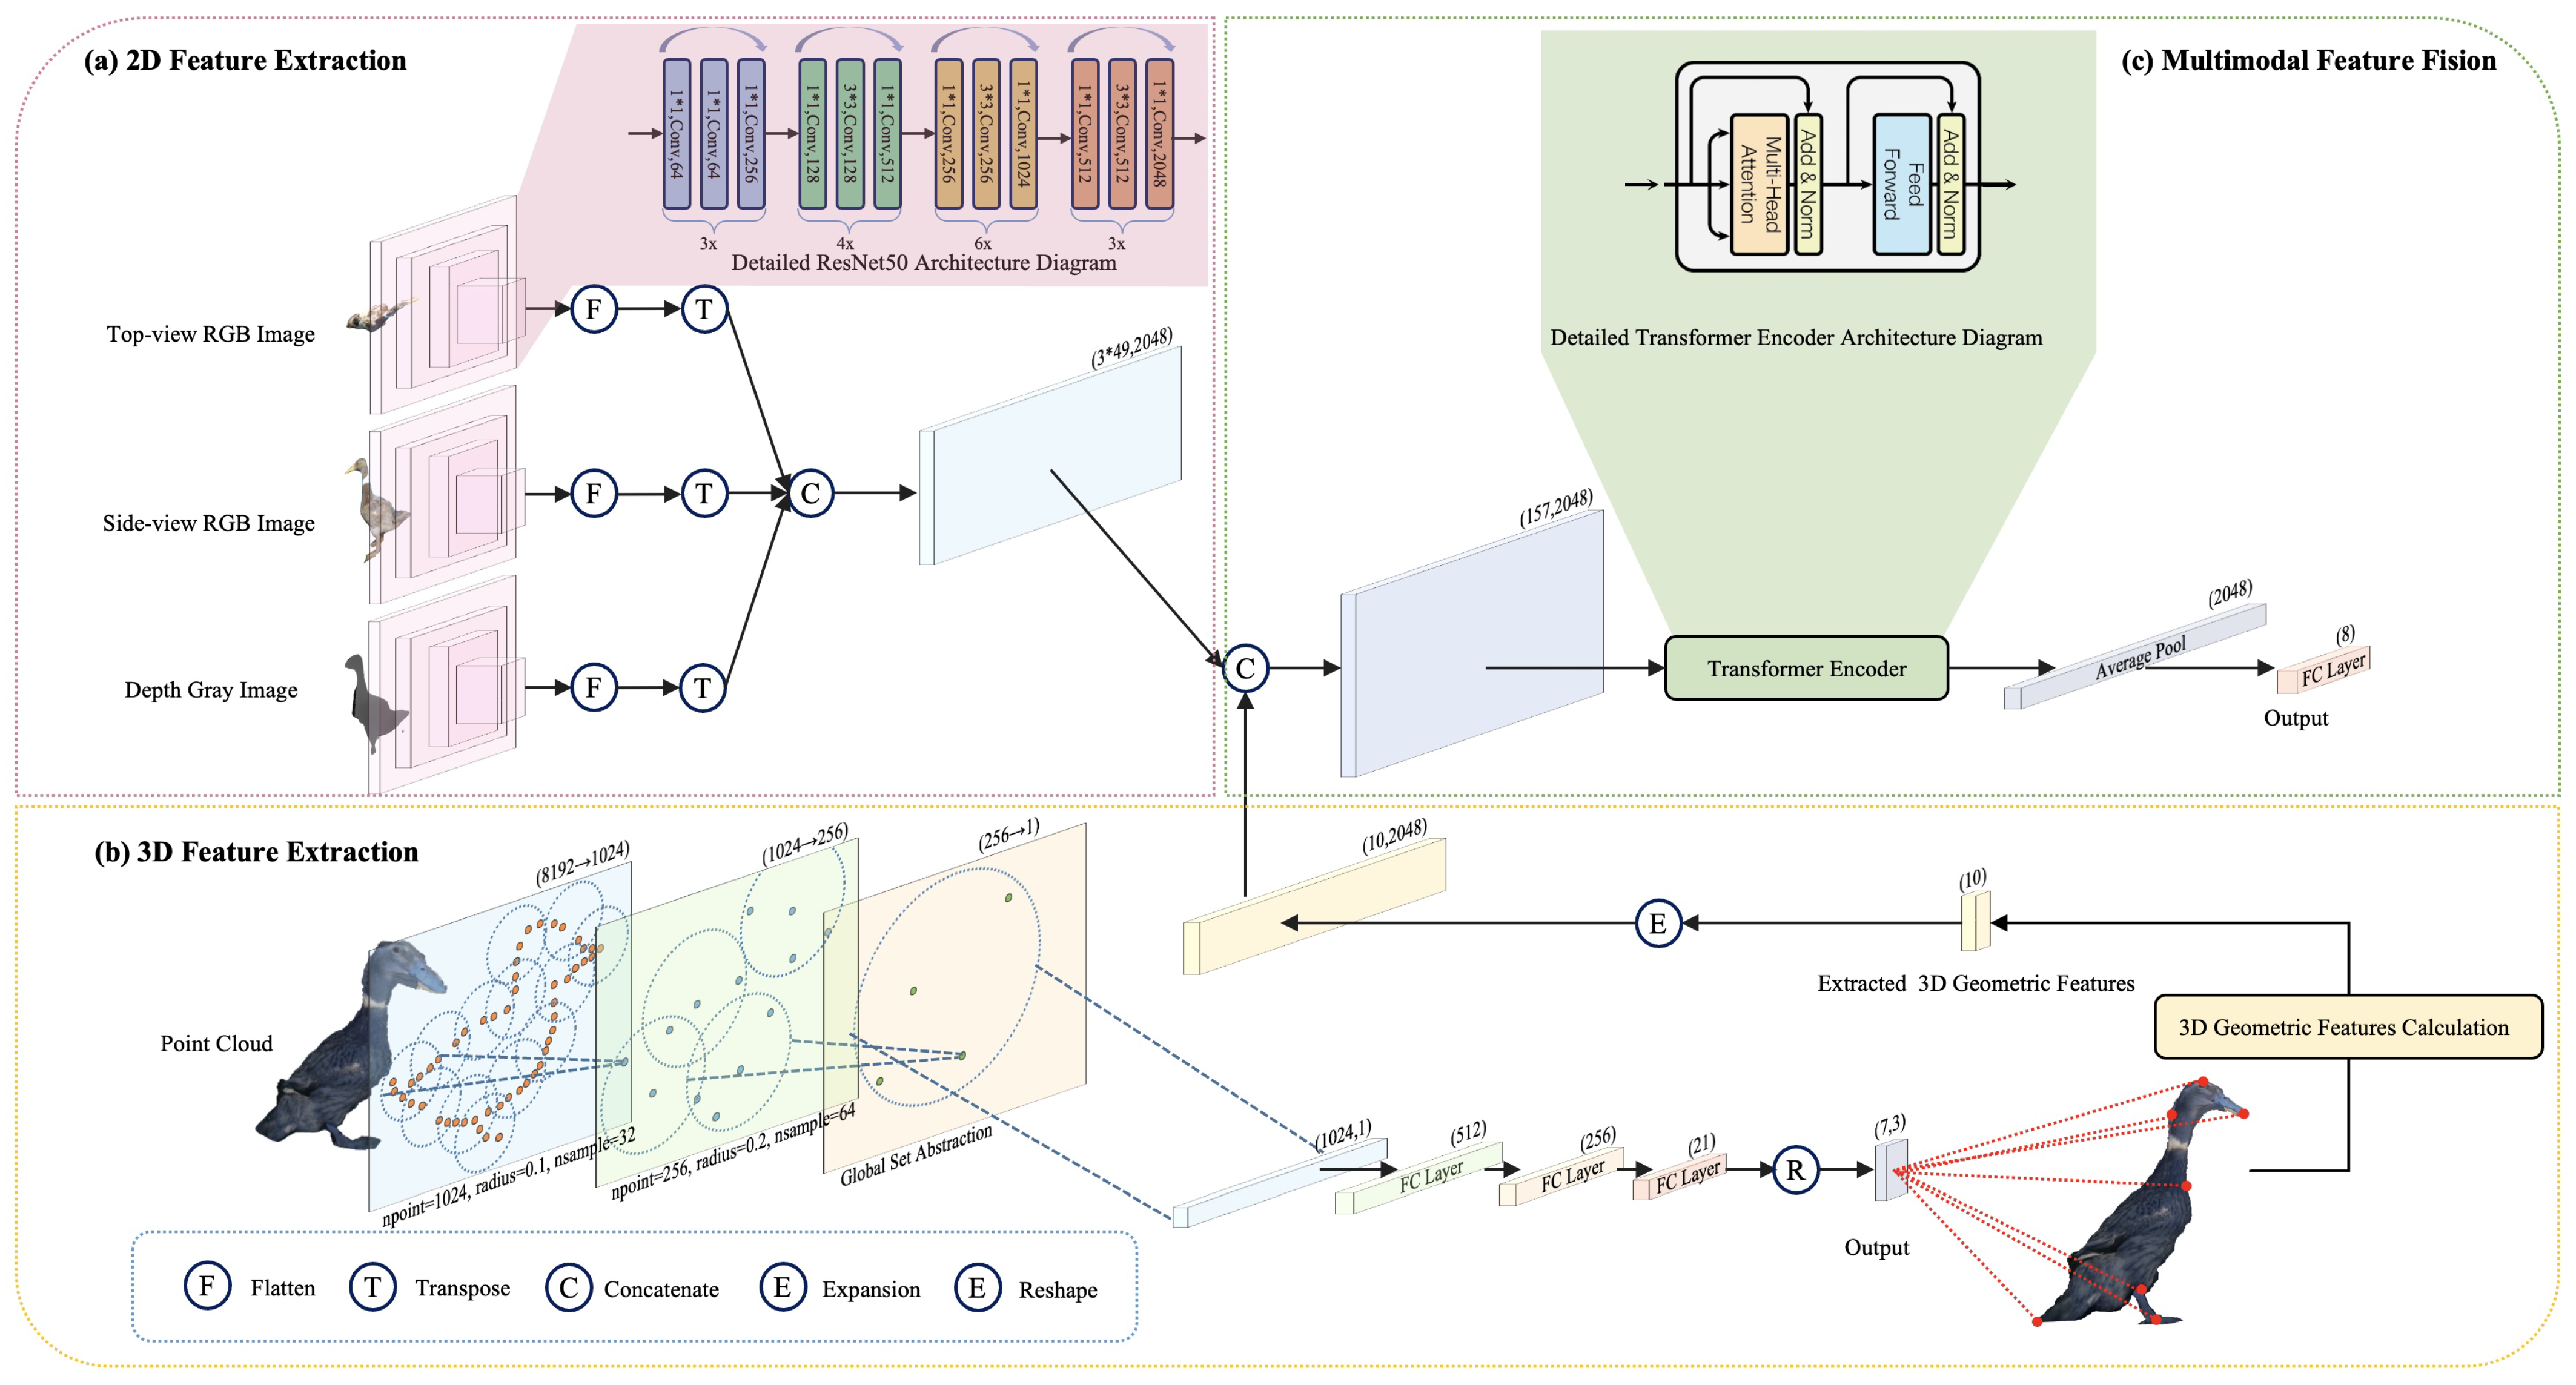
- To propose a method combining PointNet++ to identify key points in the point cloud and compute the 3D geometric features of the duck.
- To propose a deep learning model combining 2D convolutional features and 3D geometric features to predict the body dimensions and weight of the duck.
- To evaluate the performance and effectiveness of the model and discuss potential avenues for future improvements.
2. Data Processing
2.1. Dataset Description
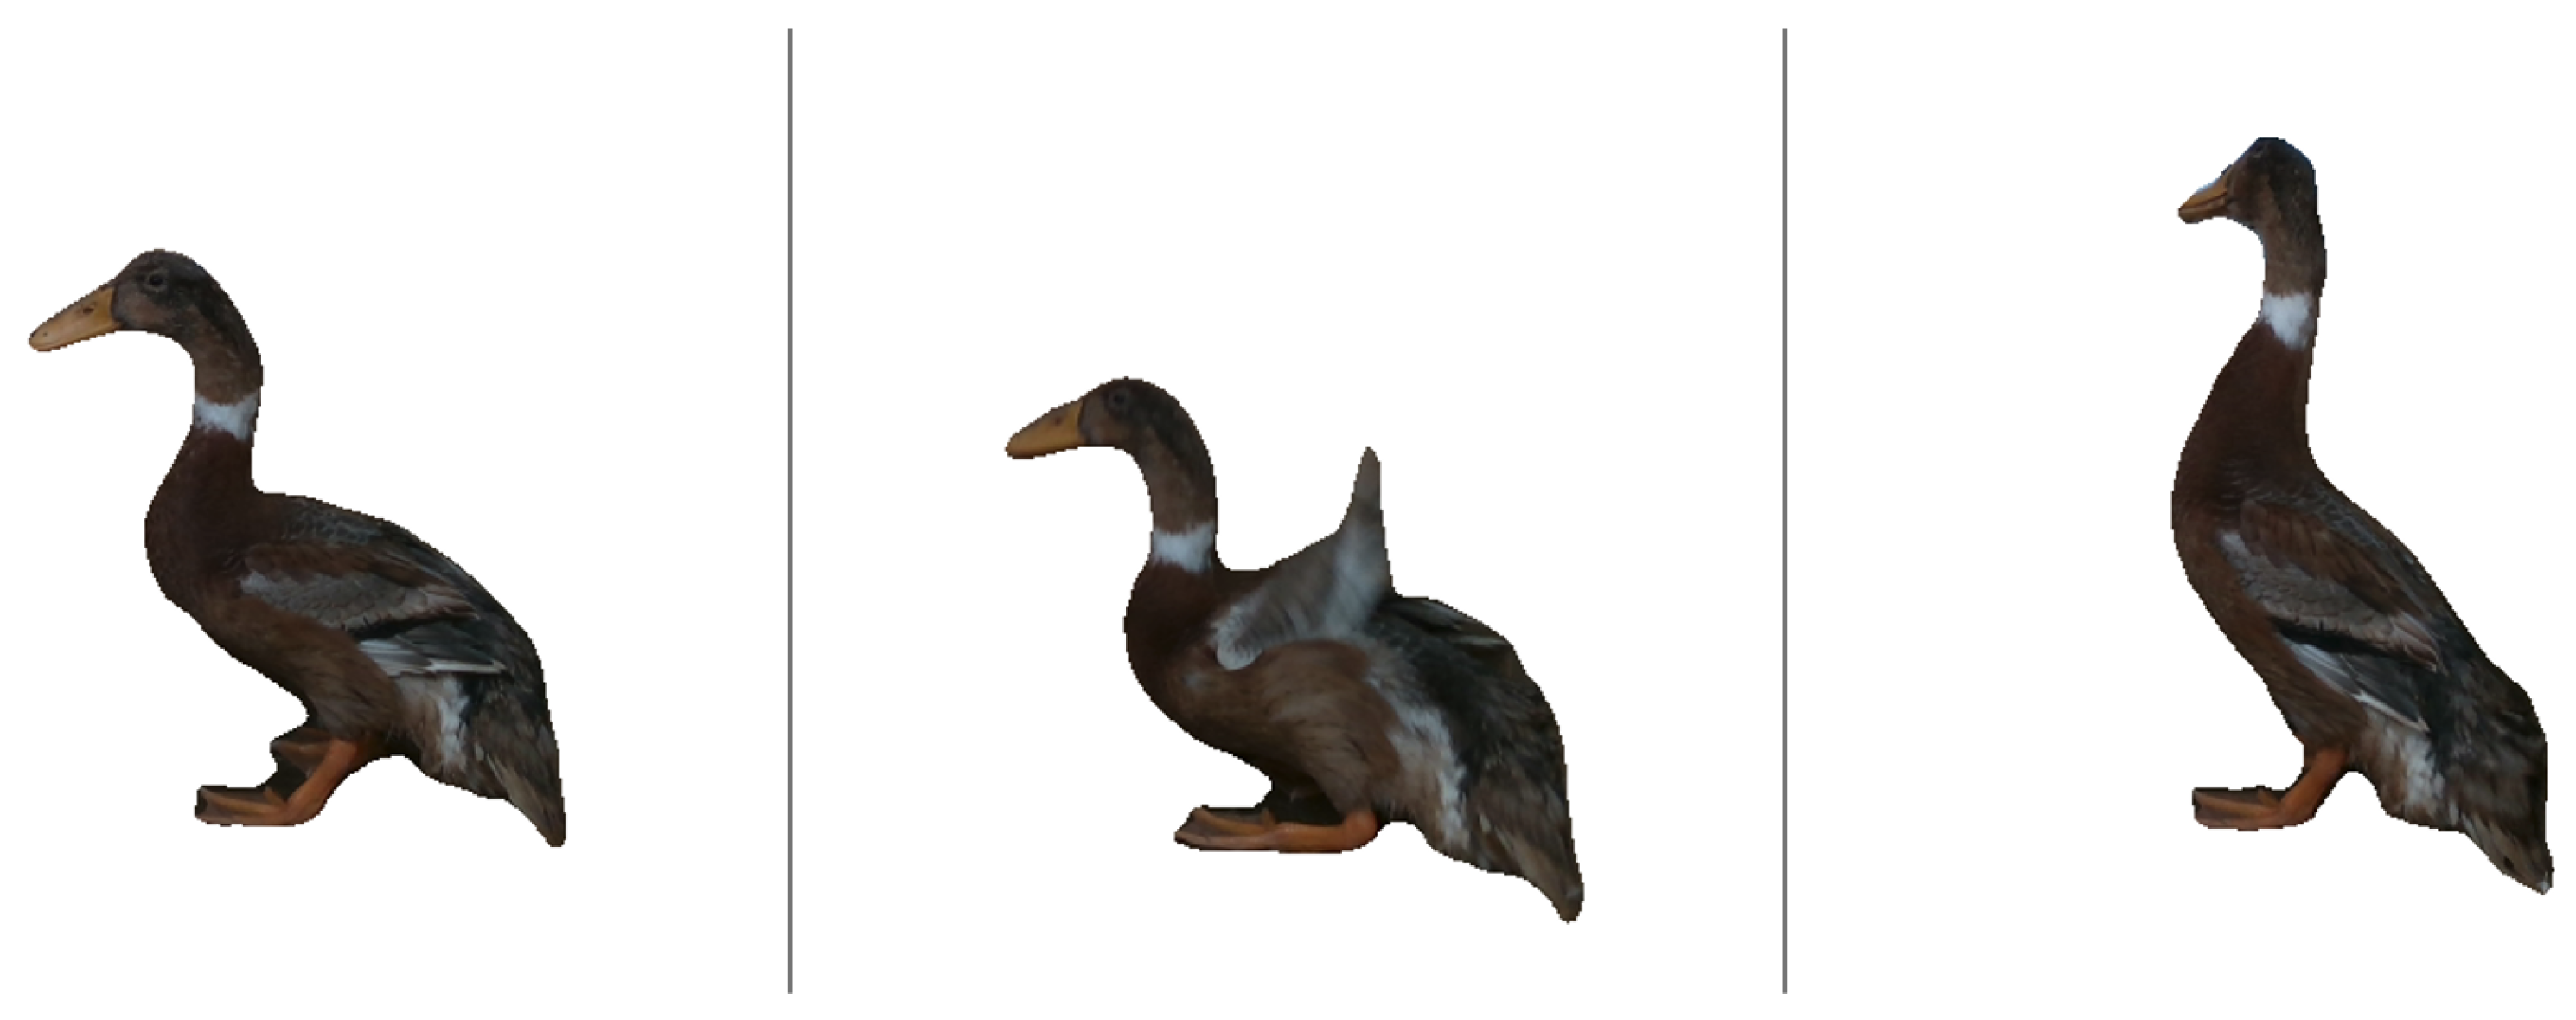
2.2. Collection Method
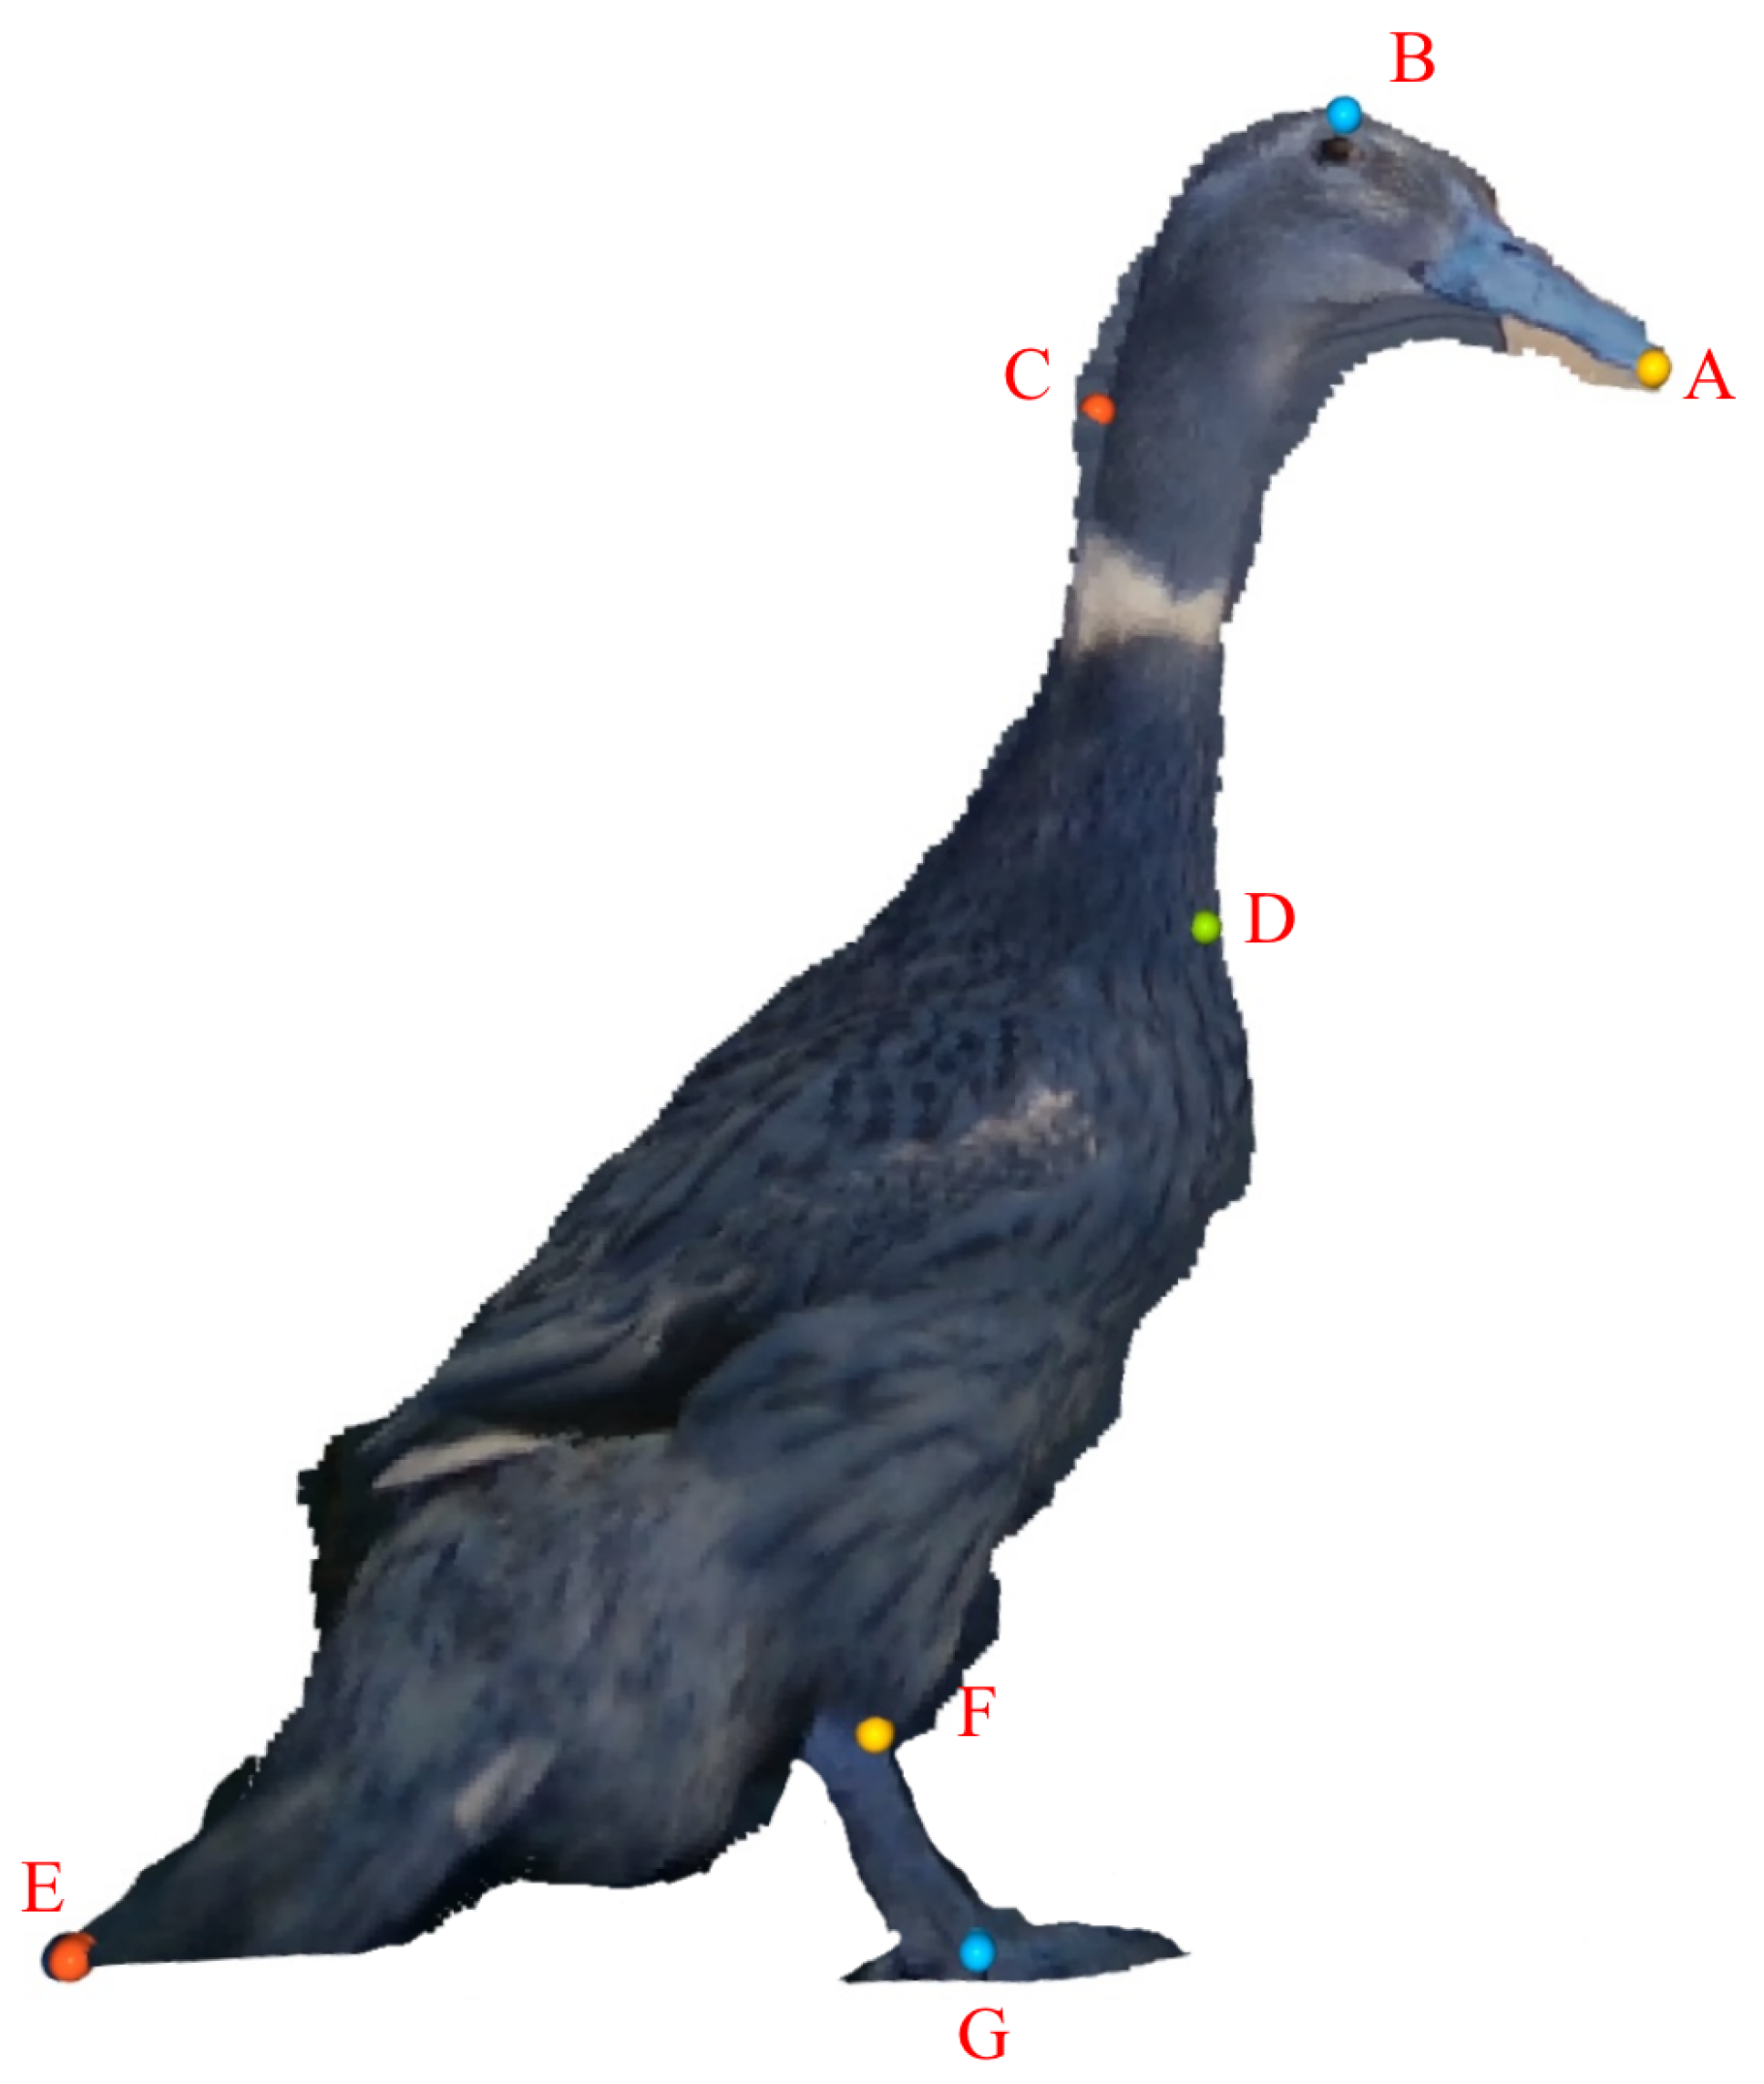
2.3. Features Extraction
- Point A: Located at the foremost tip of the duck’s beak.
- Point B: At the highest point of the duck’s head.
- Point C: At the most prominent point where the duck’s neck curves towards the tail.
- Point D: At the junction between the duck’s neck and chest.
- Point E: Located at the very end of the duck’s tail.
- Point F: At the top of the duck’s foot.
- Point G: At the bottom of the duck’s foot.
- Distances between points:
- Distance between points A and B.
- Distance between points B and C.
- Distance between points C and D.
- Distance between points D and E.
- Distance between points E and F.
- Distance between points F and G.
- Angles formed by points:
- Angle between points A, B, and C.
- Angle between points B, C, and D.
- Angle between points C, D, and E.
- Angle between points D, E, and F.
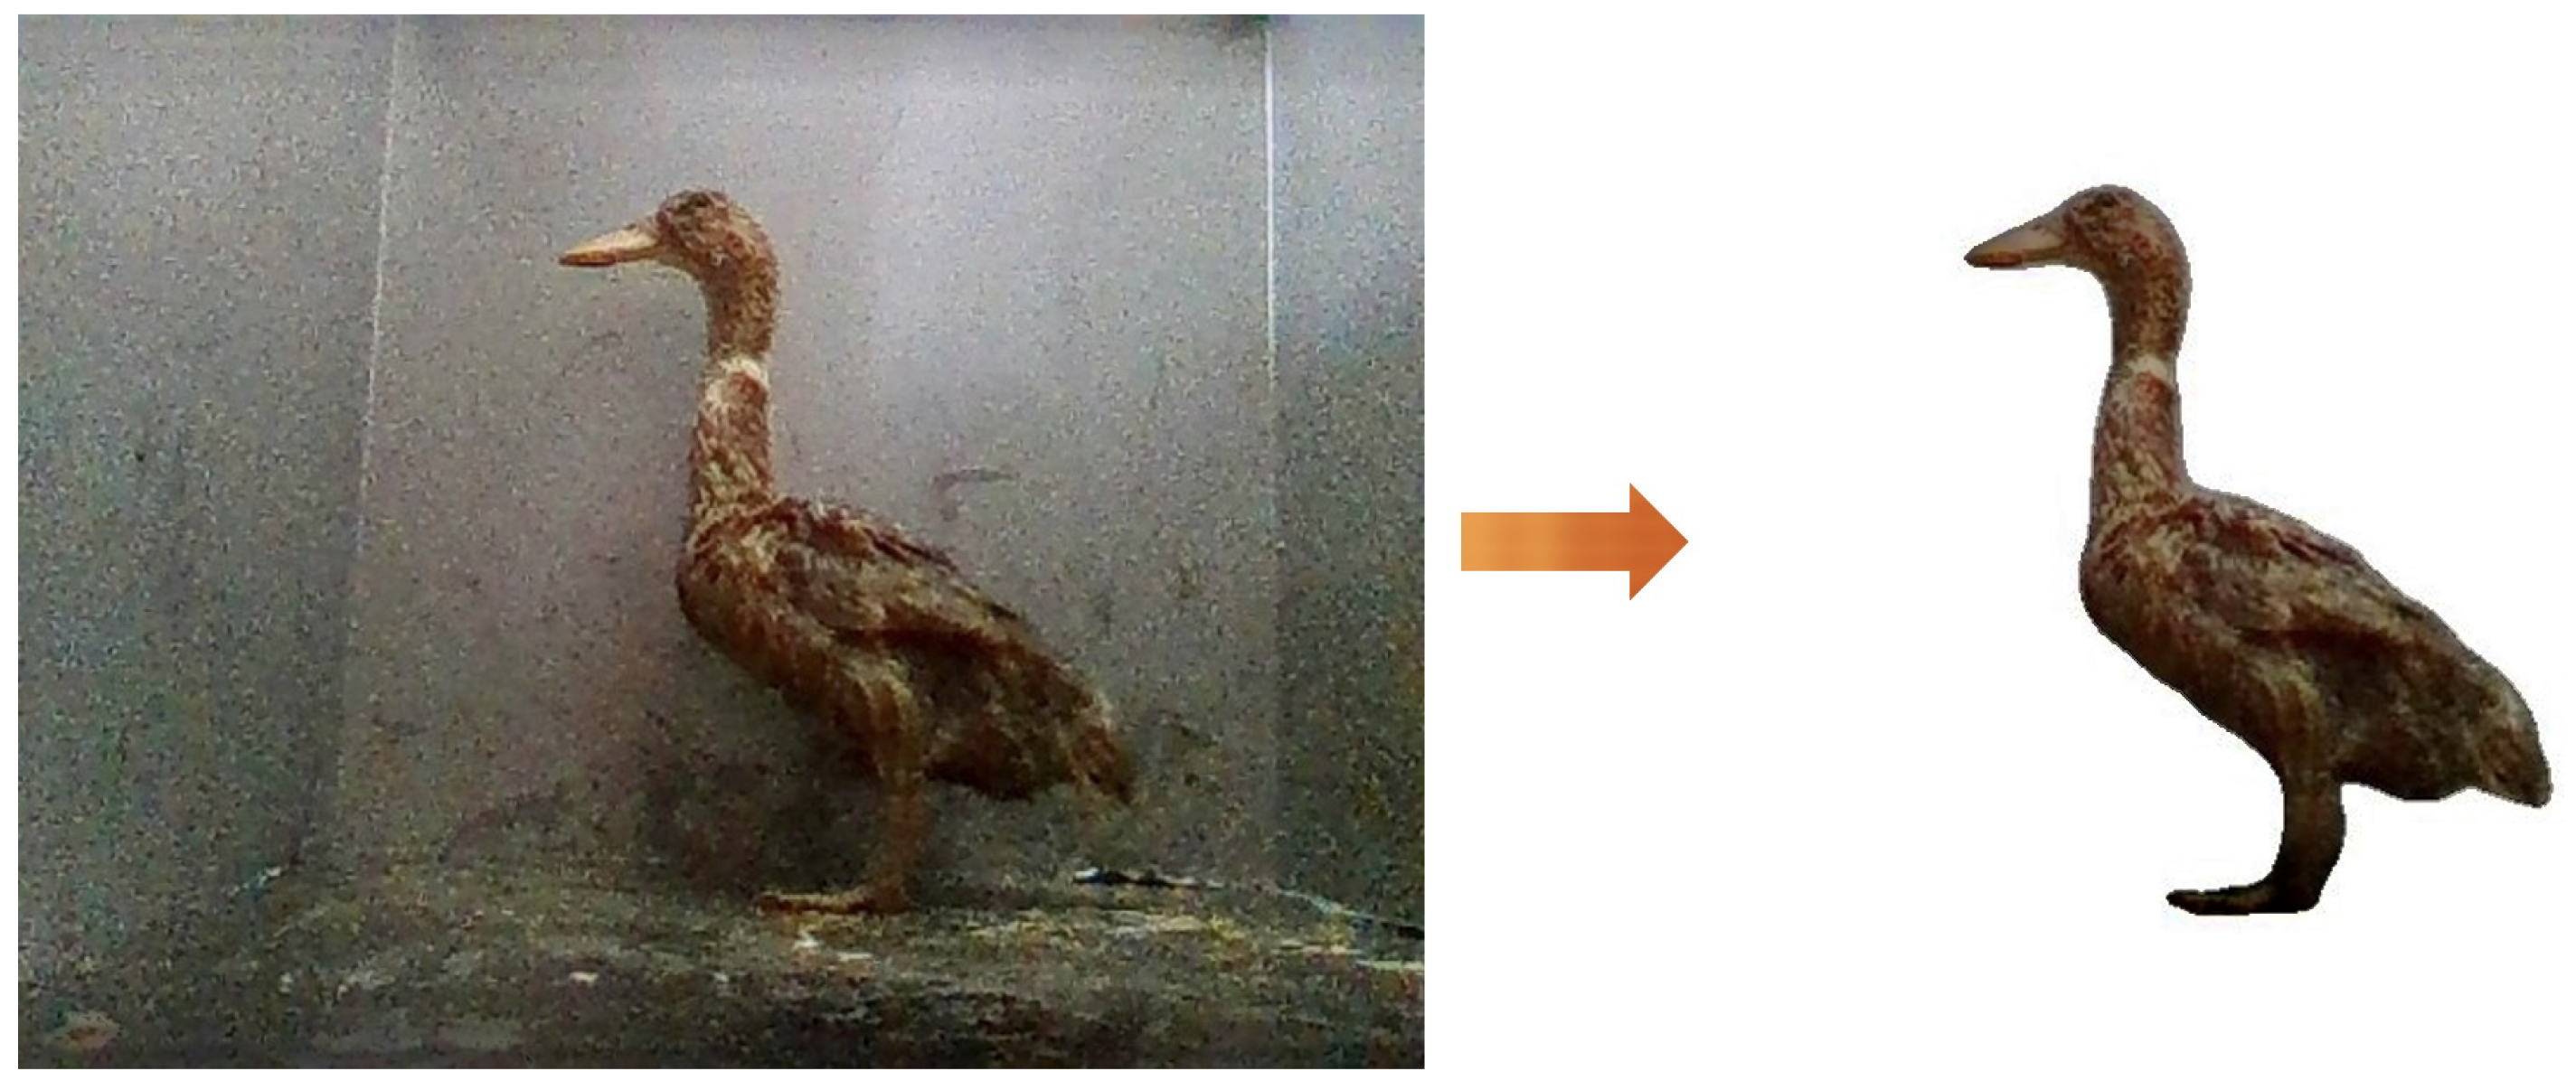
2.4. Data Prepossessing
3. Method
4. Results and Discussions
4.1. Results
4.2. Discussion
5. Conclusions
Author Contributions
Funding
Institutional Review Board Statement
Data Availability Statement
Acknowledgments
Conflicts of Interest
References
- Teguia, A.; Ngandjou, H.M.; Defang, H.; Tchoumboue, J. Study of the live body weight and body characteristics of the African Muscovy duck (Caraina moschata). Trop. Anim. Health Prod. 2008, 40, 5–10. [Google Scholar] [CrossRef] [PubMed]
- Kokoszyński, D.; Wasilewski, R.; Saleh, M.; Piwczyński, D.; Arpášová, H.; Hrnčar, C.; Fik, M. Growth Performance, Body Measurements, Carcass and Some Internal Organs Characteristics of Pekin Ducks. Animals 2019, 9, 963. [Google Scholar] [CrossRef] [PubMed]
- Abd Aziz, N.S.N.; Mohd Daud, S.; Dziyauddin, R.A.; Adam, M.Z.; Azizan, A. A Review on Computer Vision Technology for Monitoring Poultry Farm—Application, Hardware, and Software. IEEE Access 2021, 9, 12431–12445. [Google Scholar] [CrossRef]
- Zhuang, X.; Zhang, T. Detection of sick broilers by digital image processing and deep learning. Biosyst. Eng. 2019, 179, 106–116. [Google Scholar] [CrossRef]
- Duan, E.; Han, G.; Zhao, S.; Ma, Y.; Lv, Y.; Bai, Z. Regulation of Meat Duck Activeness through Photoperiod Based on Deep Learning. Animals 2023, 13, 3520. [Google Scholar] [CrossRef] [PubMed]
- Wang, J.; Xu, G.; Yan, F.; Wang, J.; Wang, Z. Defect transformer: An efficient hybrid transformer architecture for surface defect detection. Measurement 2023, 211, 112614. [Google Scholar] [CrossRef]
- Vaswani, A.; Shazeer, N.; Parmar, N.; Uszkoreit, J.; Jones, L.; Gomez, A.N.; Kaiser, L.u.; Polosukhin, I. Attention is All you Need. In Proceedings of the Advances in Neural Information Processing Systems, Long Beach, CA, USA, 4–9 December 2017; Guyon, I., Luxburg, U.V., Bengio, S., Wallach, H., Fergus, R., Vishwanathan, S., Garnett, R., Eds.; Curran Associates, Inc.: New York, NY, USA, 2017; Volume 30. [Google Scholar]
- Dosovitskiy, A.; Beyer, L.; Kolesnikov, A.; Weissenborn, D.; Zhai, X.; Unterthiner, T.; Dehghani, M.; Minderer, M.; Heigold, G.; Gelly, S.; et al. An Image is Worth 16 × 16 Words: Transformers for Image Recognition at Scale. arXiv 2010, arXiv:2010.11929. [Google Scholar]
- Lin, X.; Yan, Q.; Wu, C.; Chen, Y. Judgment Model of Cock Reproductive Performance based on Vison Transformer. In Proceedings of the 2022 5th International Conference on Sensors, Signal and Image Processing, SSIP ’22, Nanjing, China, 28–30 October 2022; Association for Computing Machinery: New York, NY, USA, 2023; pp. 37–42. [Google Scholar] [CrossRef]
- He, P.; Chen, Z.; He, Y.; Chen, J.; Hayat, K.; Pan, J.; Lin, H. A reliable and low-cost deep learning model integrating convolutional neural network and transformer structure for fine-grained classification of chicken Eimeria species. Poult. Sci. 2023, 102, 102459. [Google Scholar] [CrossRef]
- Ma, W.; Sun, Y.; Qi, X.; Xue, X.; Chang, K.; Xu, Z.; Li, M.; Wang, R.; Meng, R.; Li, Q. Computer-Vision-Based Sensing Technologies for Livestock Body Dimension Measurement: A Survey. Sensors 2024, 24, 1504. [Google Scholar] [CrossRef] [PubMed]
- Zhang, L.; Wu, P.; Wuyun, T.; Jiang, X.; Xuan, C.; Ma, Y. Algorithm of sheep body dimension measurement and its applications based on image analysis. Comput. Electron. Agric. 2018, 153, 33–45. [Google Scholar] [CrossRef]
- Du, A.; Guo, H.; Lu, J.; Su, Y.; Ma, Q.; Ruchay, A.; Marinello, F.; Pezzuolo, A. Automatic livestock body measurement based on keypoint detection with multiple depth cameras. Comput. Electron. Agric. 2022, 198, 107059. [Google Scholar] [CrossRef]
- Rusu, R.B.; Cousins, S. 3D is here: Point Cloud Library (PCL). In Proceedings of the 2011 IEEE International Conference on Robotics and Automation, Shanghai, China, 9–13 May 2011; pp. 1–4. [Google Scholar] [CrossRef]
- Huang, L.; Guo, H.; Rao, Q.; Hou, Z.; Li, S.; Qiu, S.; Fan, X.; Wang, H. Body Dimension Measurements of Qinchuan Cattle with Transfer Learning from LiDAR Sensing. Sensors 2019, 19, 5046. [Google Scholar] [CrossRef] [PubMed]
- Qi, C.R.; Yi, L.; Su, H.; Guibas, L.J. PointNet++: Deep Hierarchical Feature Learning on Point Sets in a Metric Space. In Proceedings of the Advances in Neural Information Processing Systems, Long Beach, CA, USA, 4–9 December 2017; Guyon, I., Luxburg, U.V., Bengio, S., Wallach, H., Fergus, R., Vishwanathan, S., Garnett, R., Eds.; Curran Associates, Inc.: Red Hook, NY, USA, 2017; Volume 30. [Google Scholar]
- Ronneberger, O.; Fischer, P.; Brox, T. U-net: Convolutional networks for biomedical image segmentation. In Proceedings of the Medical Image Computing and Computer-Assisted Intervention*—MICCAI 2015: 18th International Conference, Munich, Germany, 5–9 October 2015; Proceedings, Part III 18. Springer: Berlin/Heidelberg, Germany, 2015; pp. 234–241. [Google Scholar]
- He, K.; Zhang, X.; Ren, S.; Sun, J. Deep Residual Learning for Image Recognition. arXiv 2015, arXiv:1512.03385. [Google Scholar]
- Simonyan, K.; Zisserman, A. Very Deep Convolutional Networks for Large-Scale Image Recognition. In Proceedings of the 3rd International Conference on Learning Representations, ICLR 2015, San Diego, CA, USA, 7–9 May 2015. [Google Scholar]
- Chollet, F. Xception: Deep learning with depthwise separable convolutions. In Proceedings of the IEEE Conference on Computer Vision and Pattern Recognition, Honolulu, HI, USA, 21–26 July 2017; pp. 1251–1258. [Google Scholar]
- Liu, Z.; Lin, Y.; Cao, Y.; Hu, H.; Wei, Y.; Zhang, Z.; Lin, S.; Guo, B. Swin Transformer: Hierarchical Vision Transformer using Shifted Windows. arXiv 2021, arXiv:2103.14030. [Google Scholar]
- Ma, W.; Qi, X.; Sun, Y.; Gao, R.; Ding, L.; Wang, R.; Peng, C.; Zhang, J.; Wu, J.; Xu, Z.; et al. Computer Vision-Based Measurement Techniques for Livestock Body Dimension and Weight: A Review. Agriculture 2024, 14, 306. [Google Scholar] [CrossRef]
- Hao, H.; Jincheng, Y.; Ling, Y.; Gengyuan, C.; Sumin, Z.; Huan, Z. An improved PointNet++ point cloud segmentation model applied to automatic measurement method of pig body size. Comput. Electron. Agric. 2023, 205, 107560. [Google Scholar] [CrossRef]


| Parameter | Unit | Definition |
|---|---|---|
| Weight | g | The overall weight of the duck. |
| Body Diagonal Length | cm | The diagonal length from the tip of the beak to the tail. |
| Neck Length | cm | The length of the duck’s neck, from the base to the head. |
| Semi-Diving Length | cm | The depth the duck’s body when it enters the water while diving. |
| Keel Length | cm | The length of the duck’s keel bone, influencing chest development. |
| Chest Width | cm | The width of the duck’s chest, indicating chest development. |
| Chest Depth | cm | The vertical distance from the back to the abdomen, reflecting chest depth. |
| Tibia Length | cm | The length of the duck’s tibia, associated with its mobility. |
| Hyperparameter | Value |
|---|---|
| Learning Rate | 1 |
| Batch Size | 32 |
| Optimizer | Adam |
| Weight Decay | 1 |
| Epochs | 50 |
| Learning Rate Scheduler | StepLR |
| Loss Function | MSE |
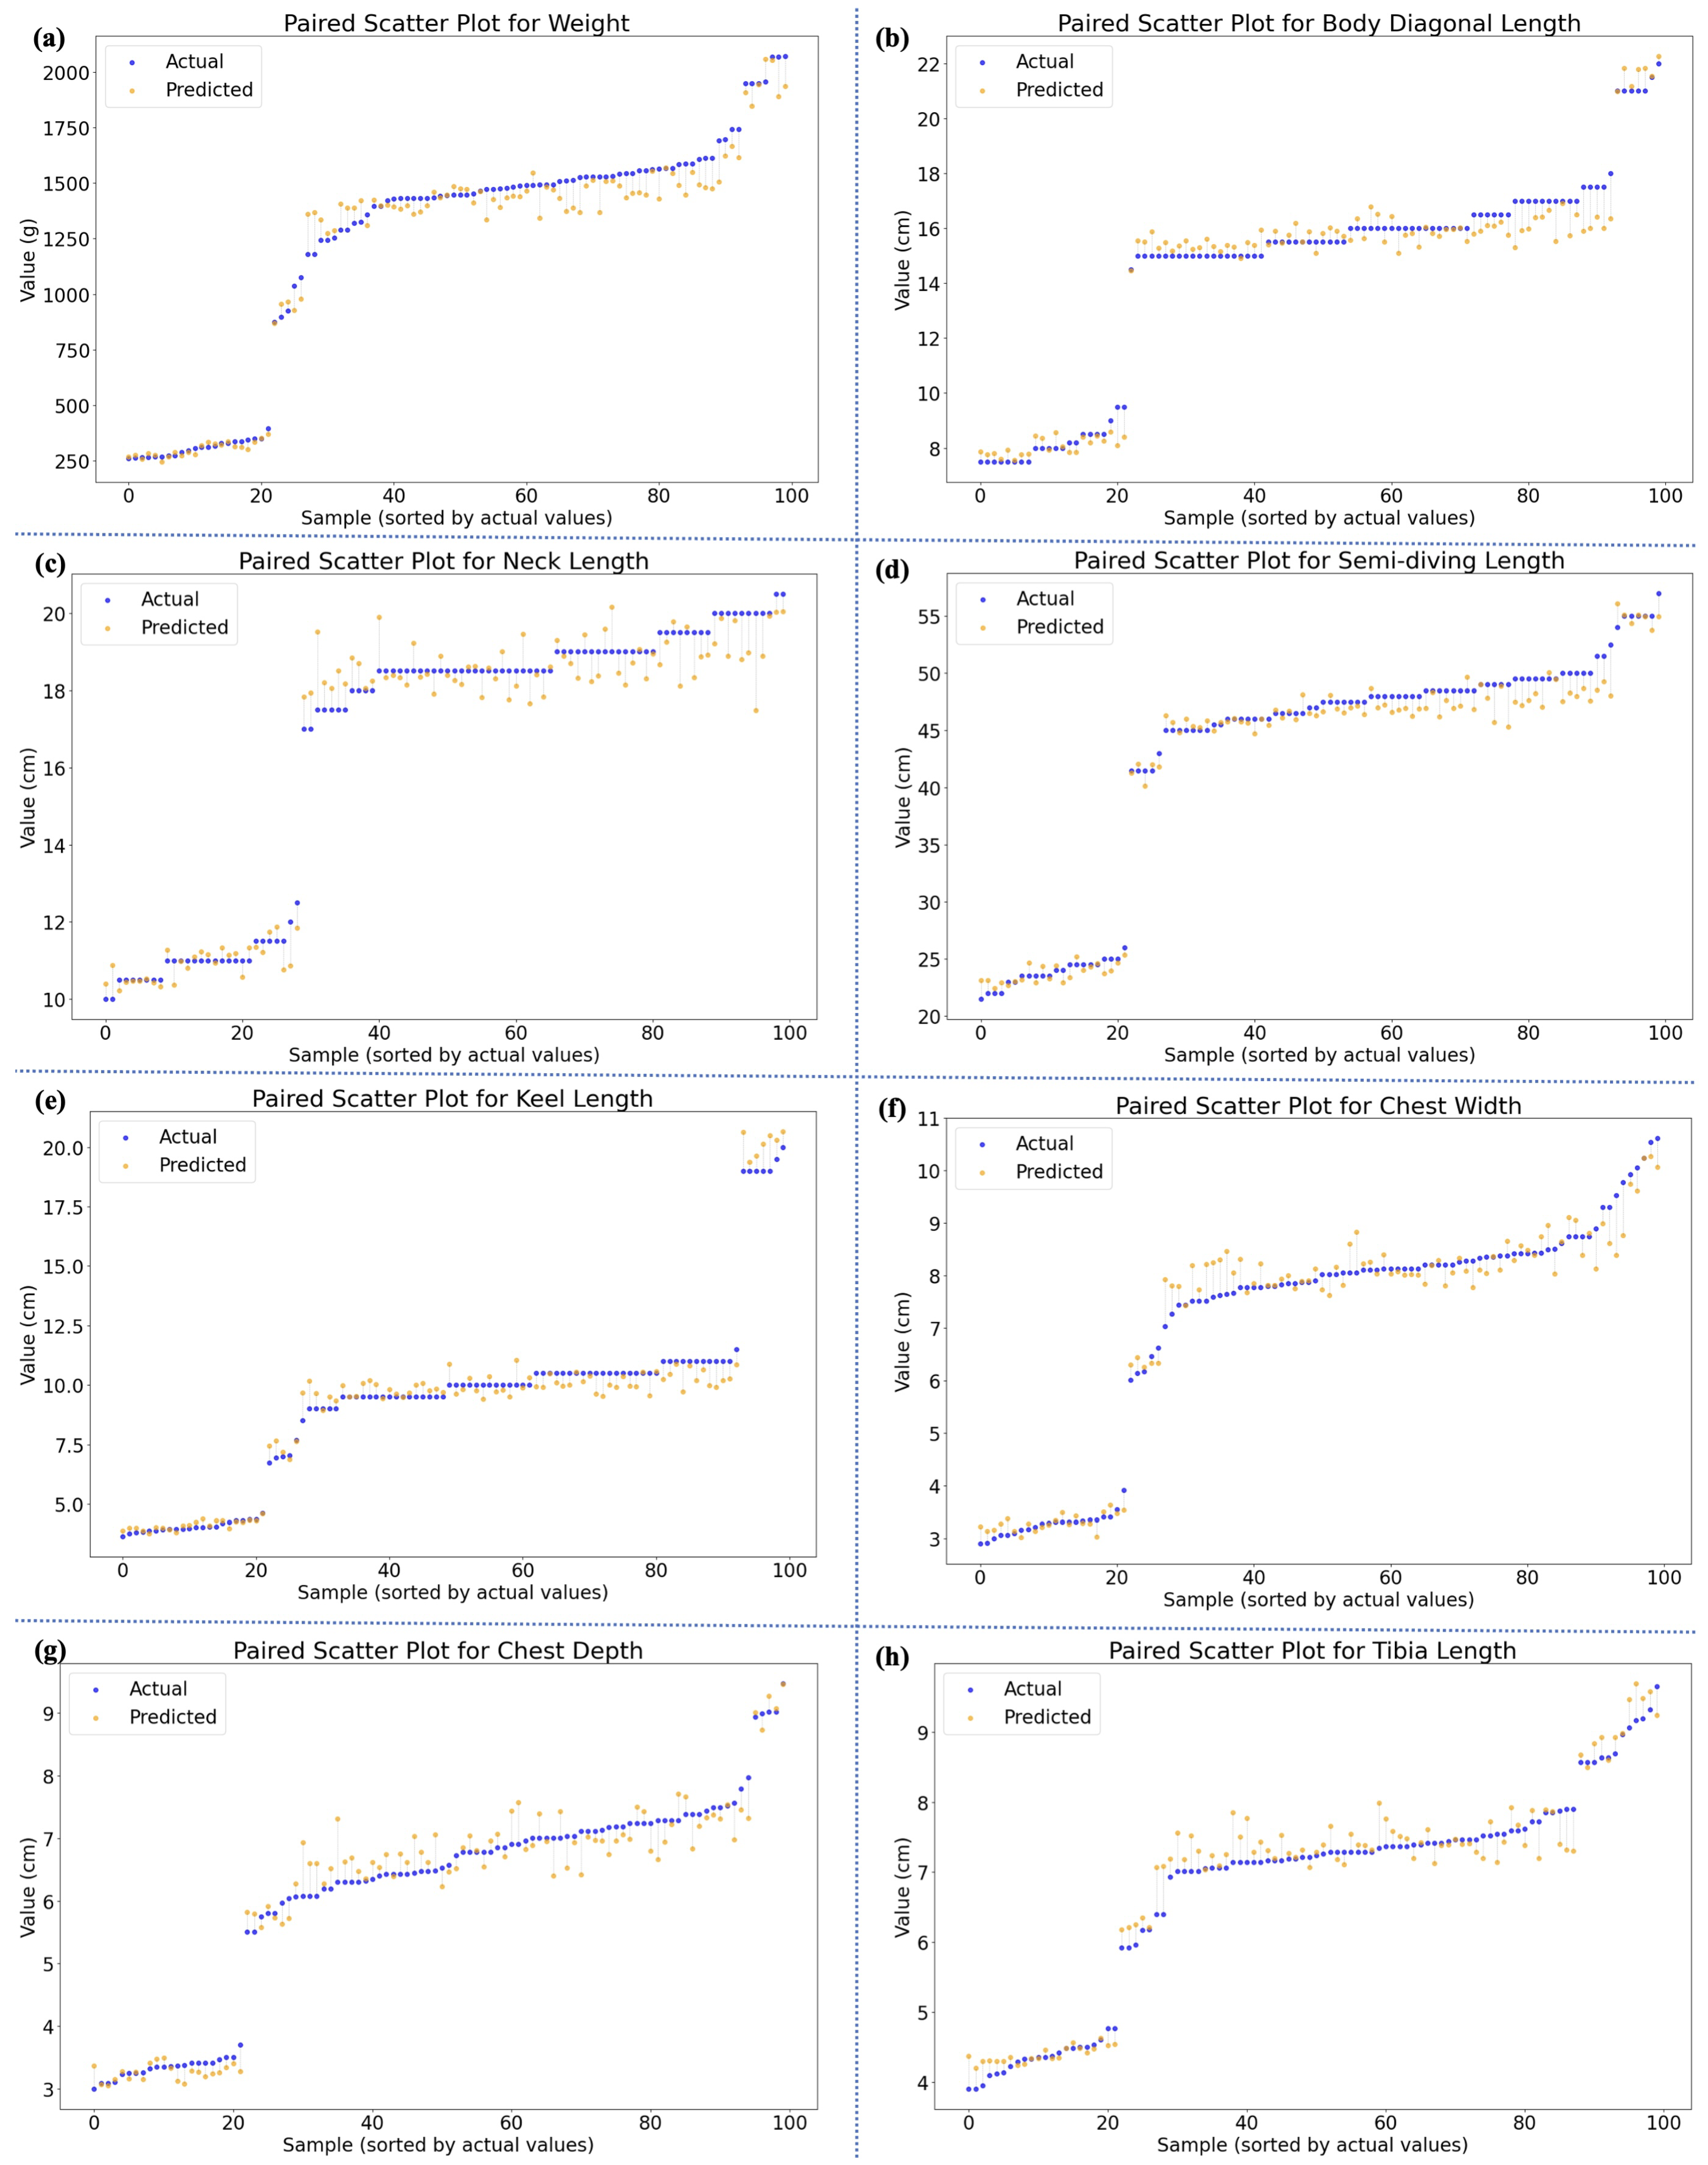
| Morphometric Parameters | R2 ↑ | MAPE (%) ↓ | RMSE ↓ | MAE ↓ |
|---|---|---|---|---|
| Weight (g) | 0.952 | 10.49 | 135.0 | 96.63 |
| Body Diagonal Length (cm) | 0.968 | 5.17 | 0.813 | 0.651 |
| Neck Length (cm) | 0.927 | 5.89 | 1.120 | 0.804 |
| Semi-Diving Length (cm) | 0.966 | 4.32 | 2.298 | 1.687 |
| Keel Length (cm) | 0.973 | 6.77 | 0.773 | 0.577 |
| Chest Width (cm) | 0.952 | 6.34 | 0.563 | 0.387 |
| Chest Depth (cm) | 0.931 | 6.92 | 0.517 | 0.385 |
| Tibia Length (cm) | 0.955 | 4.74 | 0.381 | 0.297 |
| Overall (Body Dimensions) | 0.953 | 5.73 | 0.924 | 0.684 |
| Model | Body Dimensions Avg. | Weight | ||||||
|---|---|---|---|---|---|---|---|---|
| R2↑ | MAPE (%)↓ | RMSE↓ | MAE↓ | R2↑ | MAPE (%)↓ | RMSE↓ | MAE↓ | |
| VGG16 + GFE + TE | 0.928 | 7.53 | 1.045 | 0.789 | 0.935 | 18.29 | 150.2 | 117.53 |
| VGG19 + GFE + TE | 0.933 | 7.07 | 0.929 | 0.822 | 0.919 | 14.24 | 138.4 | 114.16 |
| ViT-L/16 + GFE + TE | 0.843 | 11.64 | 1.630 | 1.277 | 0.755 | 40.62 | 291.7 | 245.73 |
| ViT-B/16 + GFE + TE | 0.845 | 9.44 | 1.484 | 1.086 | 0.834 | 17.67 | 214.9 | 152.48 |
| Swin-T + GFE + TE | 0.943 | 6.32 | 0.962 | 0.692 | 0.922 | 12.58 | 138.2 | 97.24 |
| Xception + GFE + TE | 0.896 | 7.46 | 1.250 | 0.875 | 0.953 | 10.87 | 131.0 | 92.51 |
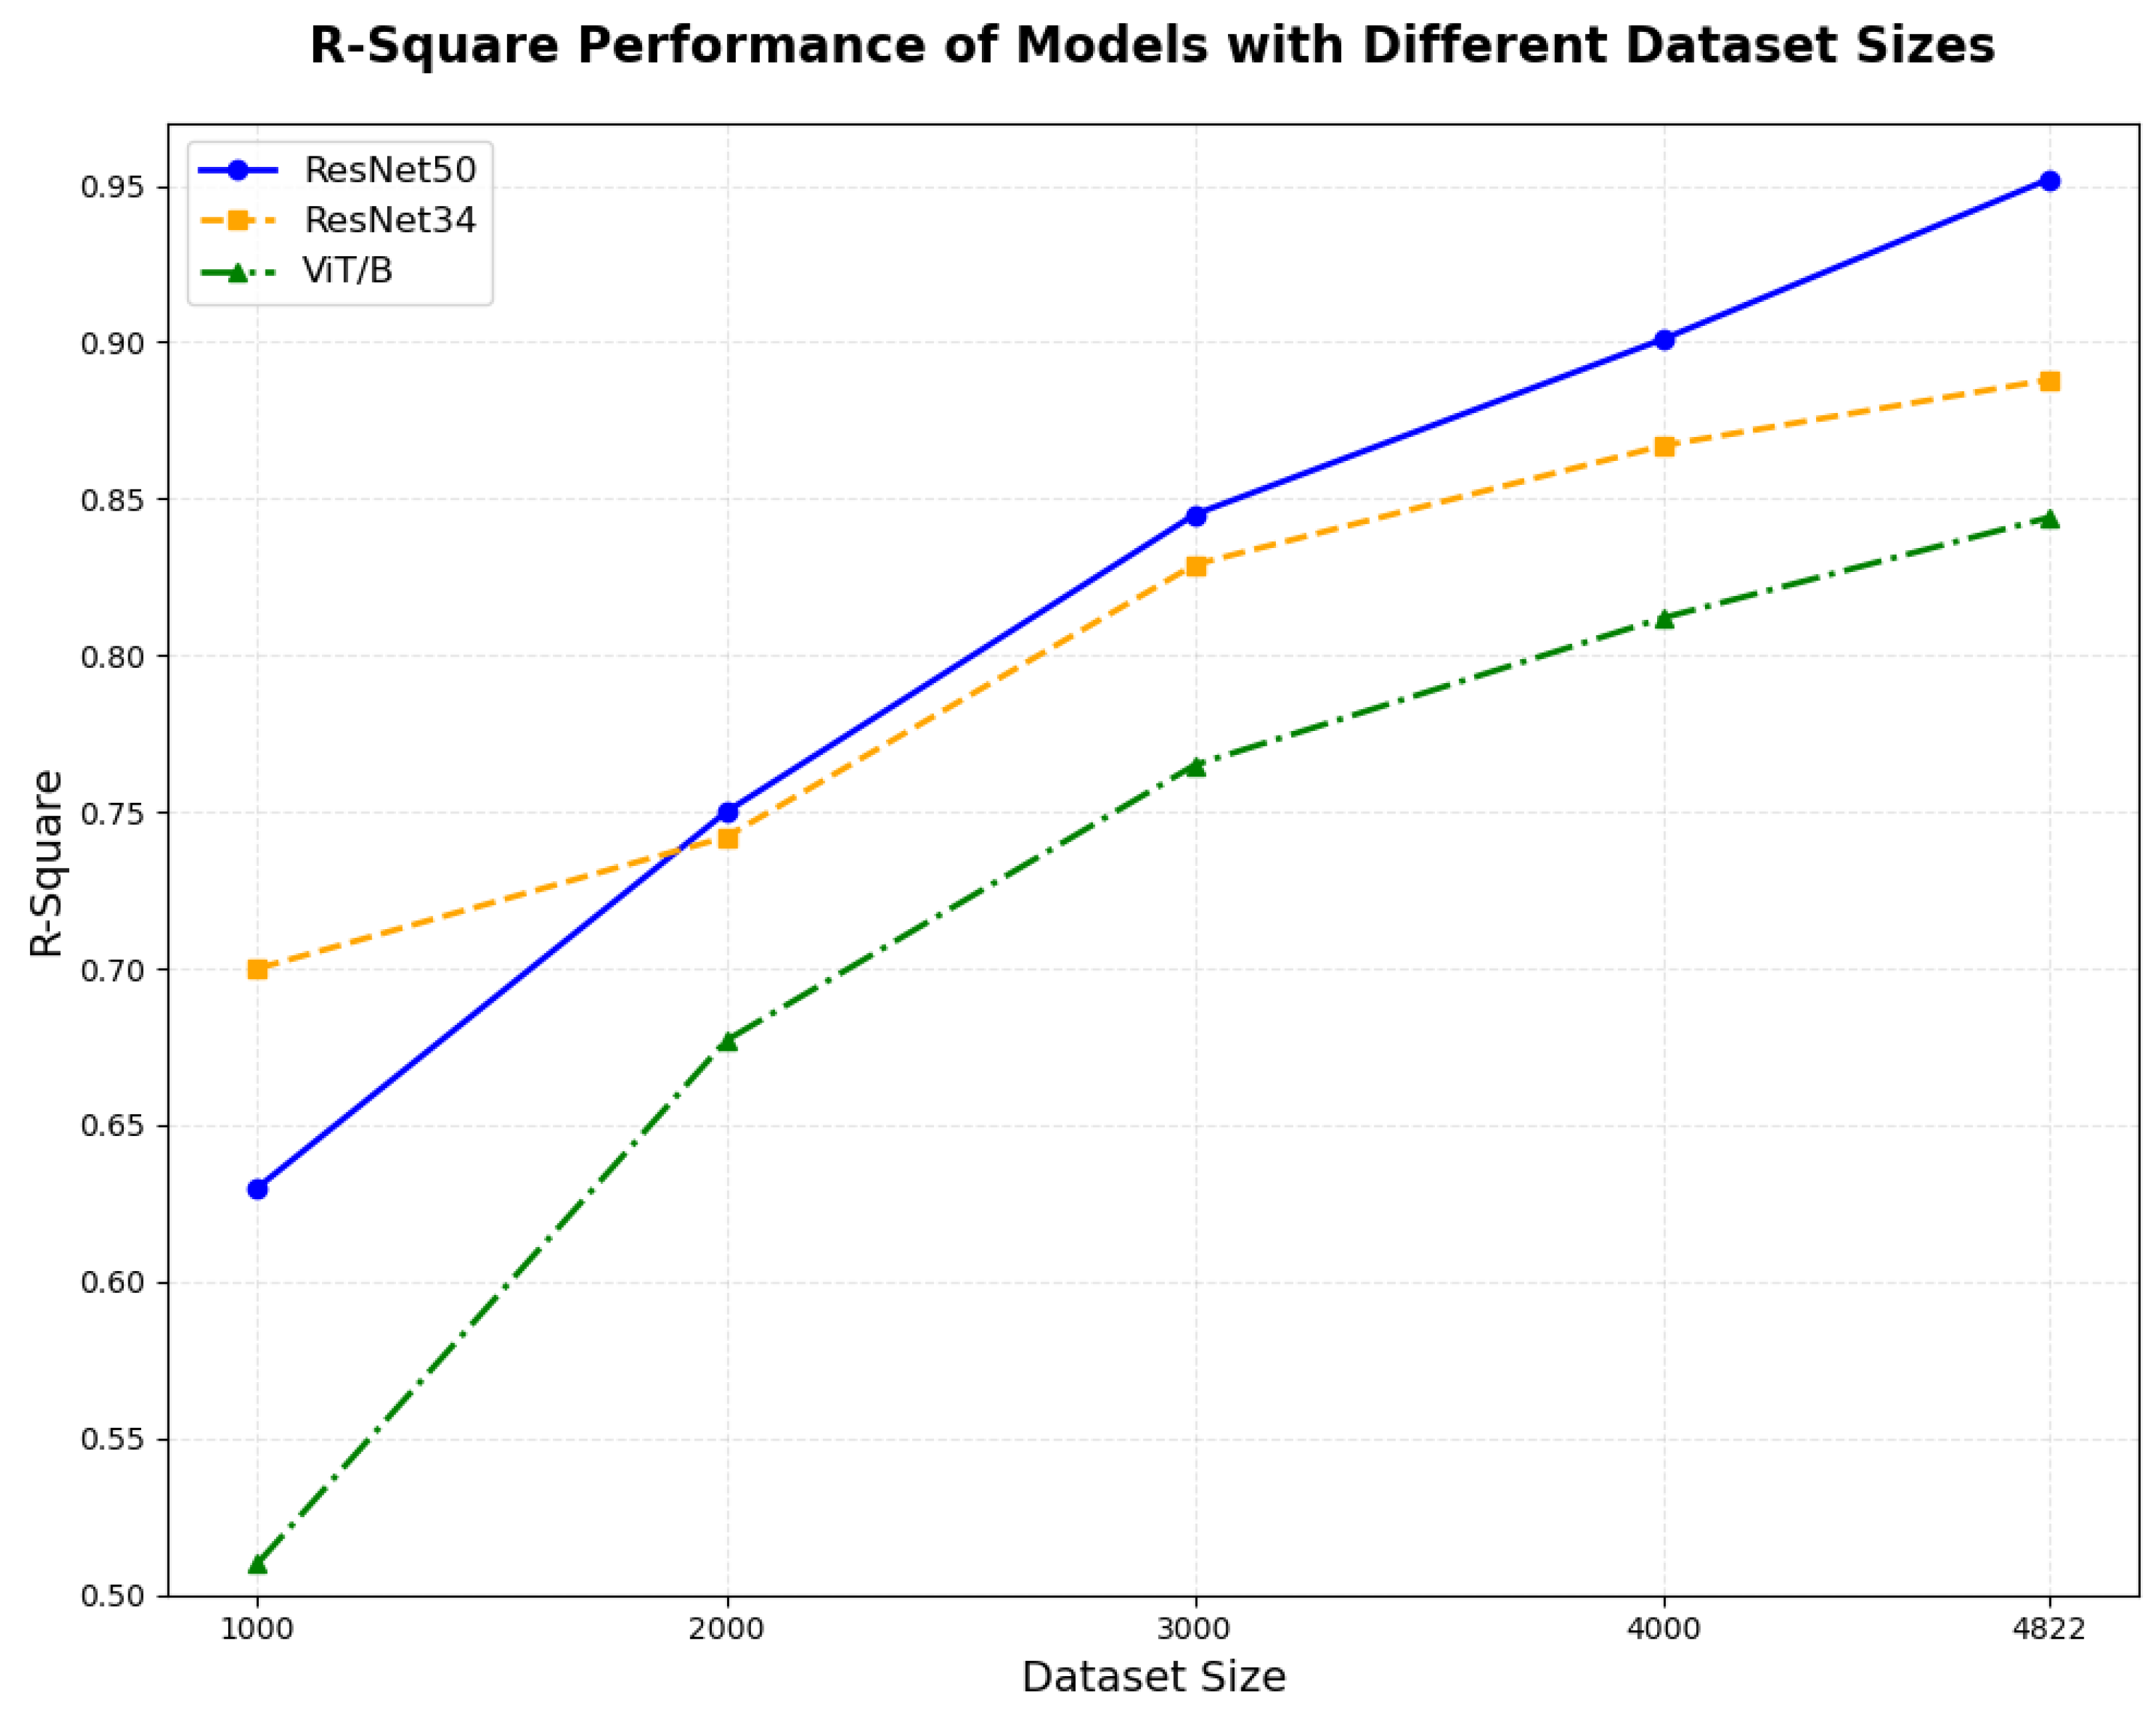
| ResNet34 + GFE + TE | 0.882 | 10.07 | 1.413 | 1.113 | 0.932 | 16.42 | 154.2 | 123.32 |
| ResNet101 + GFE + TE | 0.933 | 6.64 | 0.948 | 0.722 | 0.947 | 13.23 | 139.1 | 102.07 |
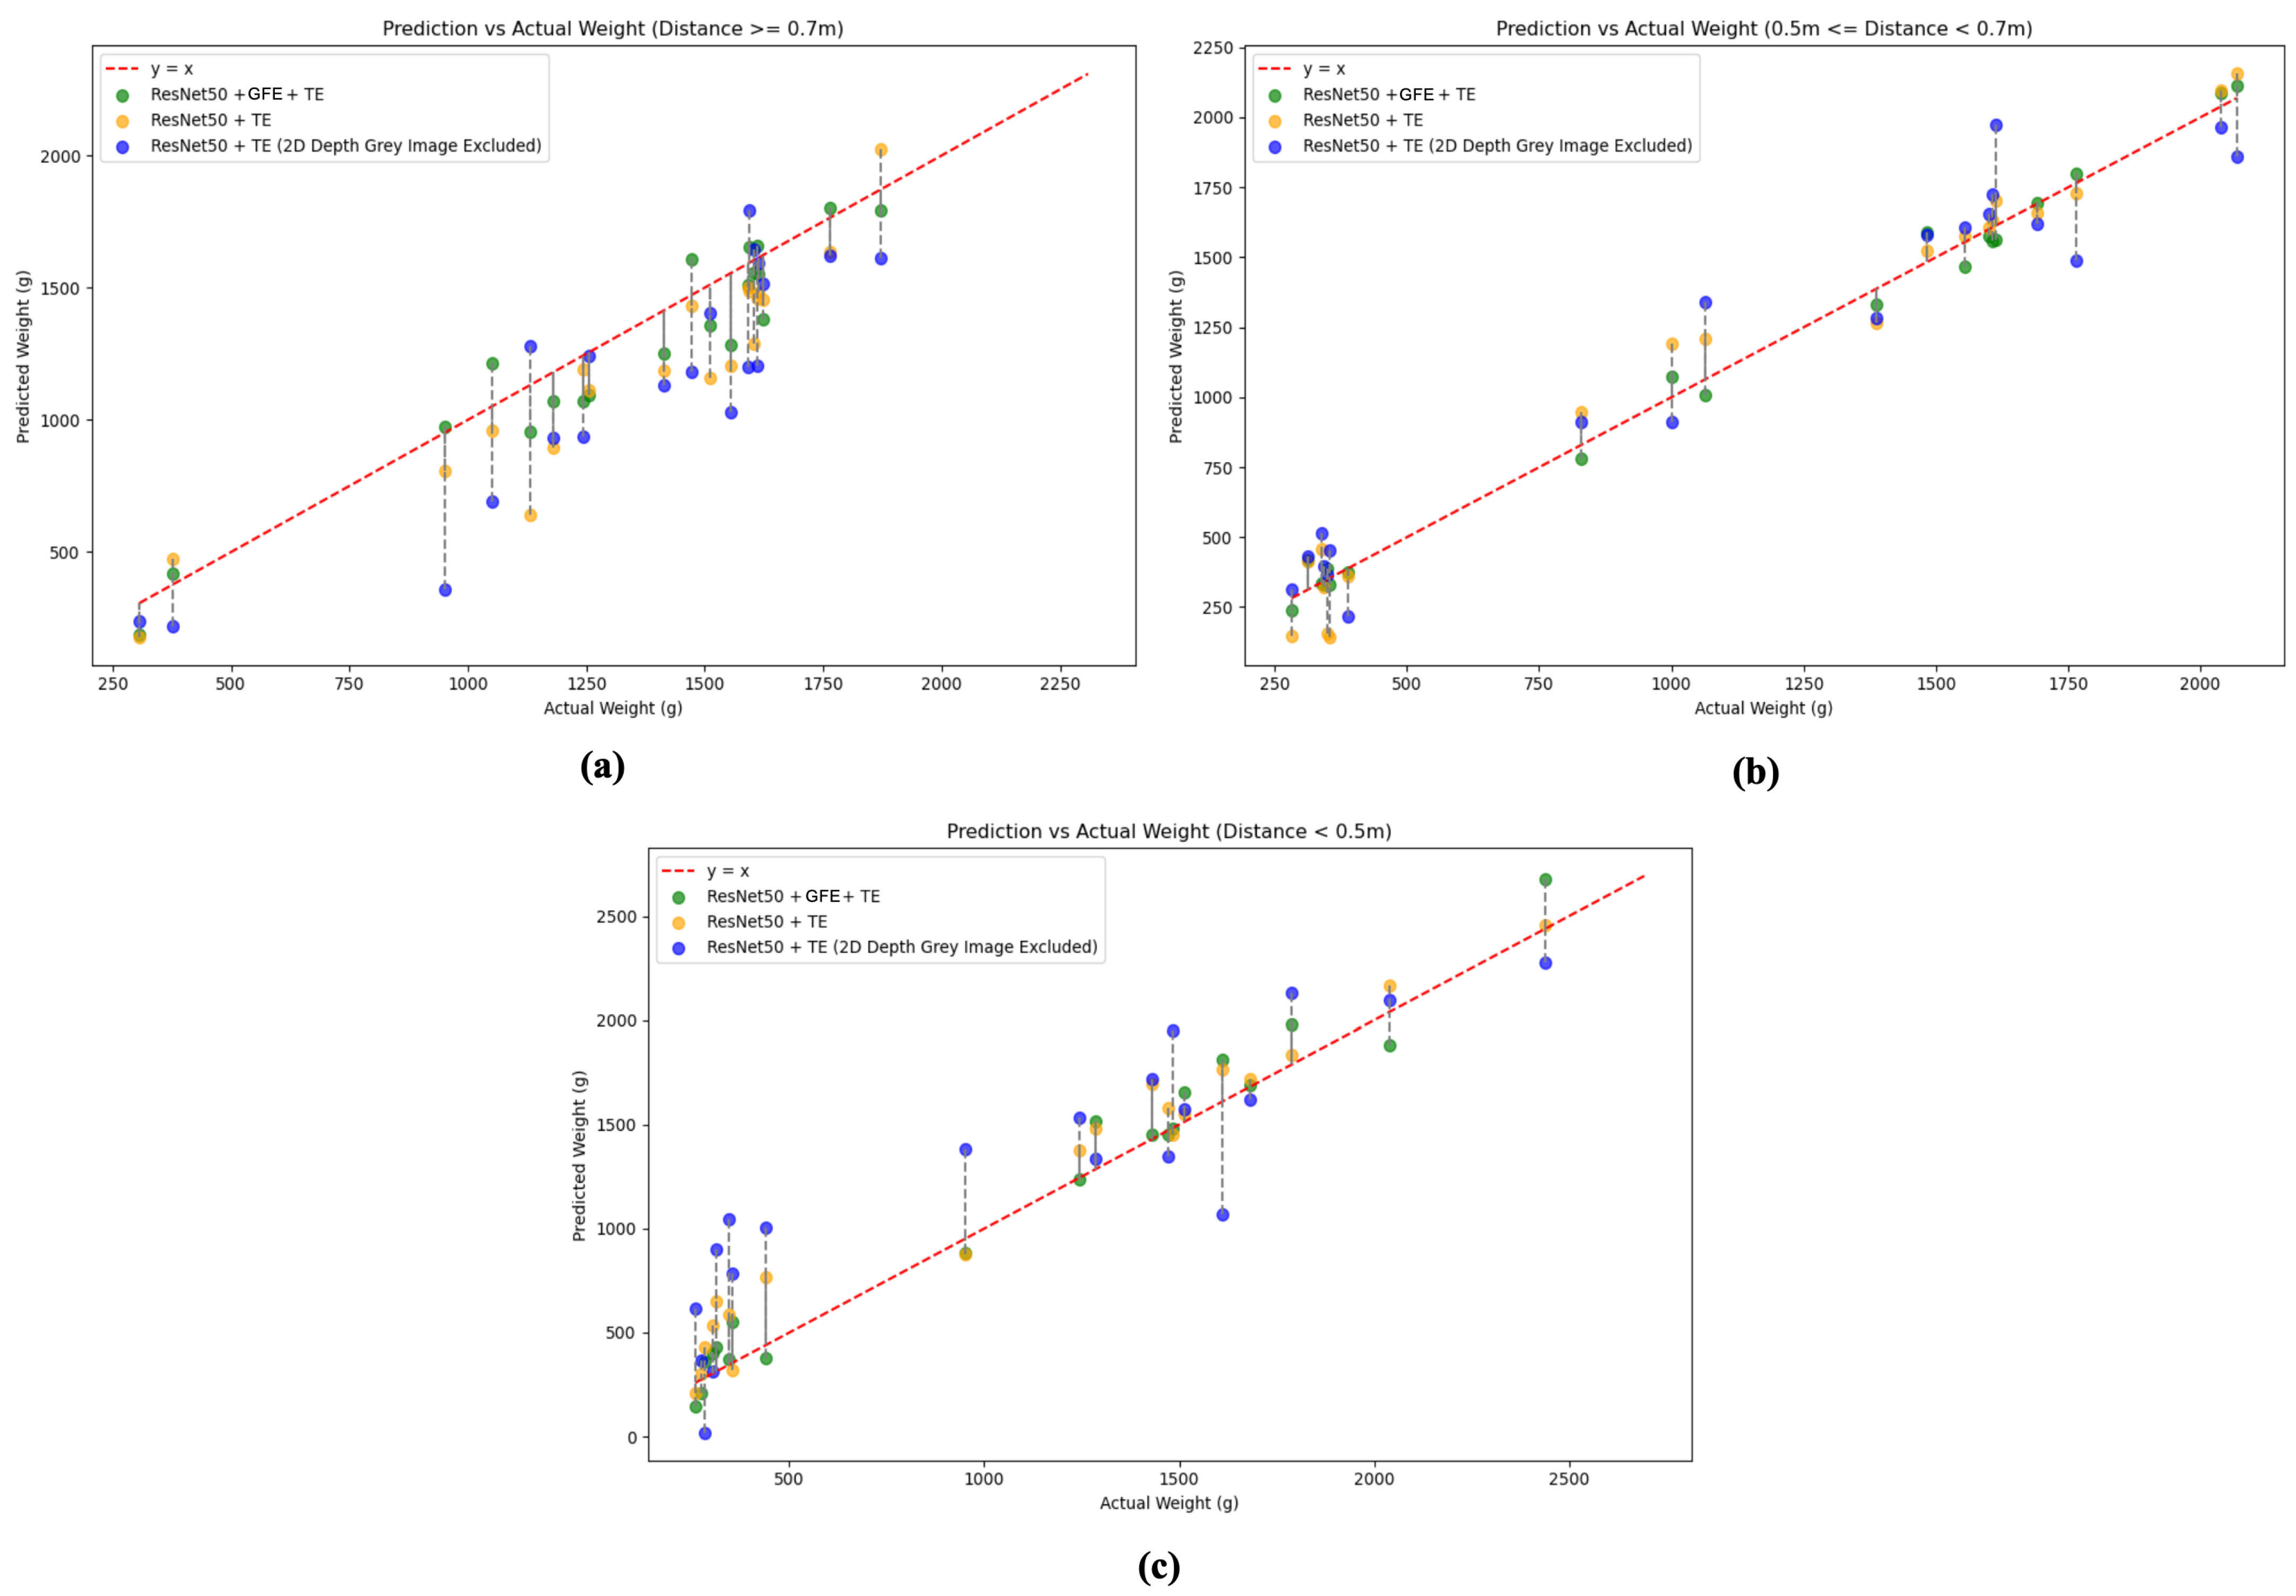
| ResNet50 + TE | 0.903 | 7.13 | 1.121 | 0.822 | 0.903 | 13.28 | 143.8 | 96.88 |
| ResNet50 + TE - DGI | 0.710 | 22.13 | 2.34 | 2.31 | 0.694 | 38.19 | 301.2 | 281.88 |
| ResNet50 Only | 0.808 | 15.21 | 2.081 | 1.918 | 0.850 | 30.14 | 307.8 | 267.45 |
| ResNet50 + GFE + TE | 0.953 | 5.73 | 0.924 | 0.684 | 0.952 | 10.53 | 135.0 | 96.65 |
Disclaimer/Publisher’s Note: The statements, opinions and data contained in all publications are solely those of the individual author(s) and contributor(s) and not of MDPI and/or the editor(s). MDPI and/or the editor(s) disclaim responsibility for any injury to people or property resulting from any ideas, methods, instructions or products referred to in the content. |
© 2025 by the authors. Licensee MDPI, Basel, Switzerland. This article is an open access article distributed under the terms and conditions of the Creative Commons Attribution (CC BY) license (https://creativecommons.org/licenses/by/4.0/).
Share and Cite
Xiao, W.; Han, Q.; Shu, G.; Liang, G.; Zhang, H.; Wang, S.; Xu, Z.; Wan, W.; Li, C.; Jiang, G.; et al. Multimodal Feature-Driven Deep Learning for the Prediction of Duck Body Dimensions and Weight. Agriculture 2025, 15, 1021. https://doi.org/10.3390/agriculture15101021
Xiao W, Han Q, Shu G, Liang G, Zhang H, Wang S, Xu Z, Wan W, Li C, Jiang G, et al. Multimodal Feature-Driven Deep Learning for the Prediction of Duck Body Dimensions and Weight. Agriculture. 2025; 15(10):1021. https://doi.org/10.3390/agriculture15101021
Chicago/Turabian StyleXiao, Wenbo, Qiannan Han, Gang Shu, Guiping Liang, Hongyan Zhang, Song Wang, Zhihao Xu, Weican Wan, Chuang Li, Guitao Jiang, and et al. 2025. "Multimodal Feature-Driven Deep Learning for the Prediction of Duck Body Dimensions and Weight" Agriculture 15, no. 10: 1021. https://doi.org/10.3390/agriculture15101021
APA StyleXiao, W., Han, Q., Shu, G., Liang, G., Zhang, H., Wang, S., Xu, Z., Wan, W., Li, C., Jiang, G., & Xiao, Y. (2025). Multimodal Feature-Driven Deep Learning for the Prediction of Duck Body Dimensions and Weight. Agriculture, 15(10), 1021. https://doi.org/10.3390/agriculture15101021