1. Introduction
Herbal medicines derived from plants have been extensively utilized in traditional medicine across East Asia. The herbal medicine market continues to expand, generating substantial economic value as scientific research validates their emotional, physical, and pharmacological effects on human health [
1]. Among these,
Z. jujuba, a versatile species within the
Zizyphus genus, is widely distributed across tropical and subtropical regions. Traditionally, it has been used for treating insomnia and promoting mental relaxation and is predominantly used in its dried form in East Asia [
2,
3,
4]. In contrast,
Z. mauritiana is a morphologically similar species that lacks scientific validation regarding its medicinal efficacy. Nevertheless,
Z. mauritiana is frequently marketed at a significantly higher price, resulting in common instances of adulteration and substitution [
5]. Although extensive research has been conducted on the chemical composition, administration methods, and safe dosage of herbal medicines [
6], the persistent misclassification of
Z. jujuba and
Z. mauritiana not only undermines consumer confidence in the herbal medicine market but also raises concerns about potential health risks associated with inaccurate prescriptions.
Despite significant advancements in artificial intelligence (AI) across various domains, many fields still rely on human expertise. In traditional herbal medicine, sensory evaluation remains a primary method for distinguishing authentic herbs from adulterants, heavily dependent on human experience [
7]. Expert herbalists with decades of accumulated knowledge classify various herbal medicines and identify those with high misclassification risks. However, the increasing demand for herbal medicine [
8] and the need for strict quality control [
9] contrast sharply with the declining number of skilled herbalists due to aging and succession challenges. This widening gap in professional expertise exacerbates misclassification and substitution risks in the herbal medicine market. The morphological similarities between
Z. jujuba and
Z. mauritiana make visual differentiation particularly challenging [
5], as accurate classification remains highly dependent on expert knowledge. Given the continuous decline in trained professionals, a quantitative and reliable classification technology is urgently needed to prevent herbal medicine misidentification and misuse.
Various technological approaches have been explored to quantify traditional sensory evaluation methods. Previous studies have employed chemical markers to differentiate herbal species by isolating and analyzing root-derived compounds [
10], while others have used DNA sequence analysis to classify
Saposhnikovia divaricata [
11] or applied multiplex polymerase chain reaction (PCR) for distinguishing
Angelica species [
12]. Although these chemical and genetic approaches provide quantitative classification criteria, they have inherent limitations, including their destructive nature, time-consuming procedures, and high costs. To overcome these constraints, deep learning models, which have demonstrated high accuracy in biological image classification [
13], have been increasingly applied to herbal medicine classification. A deep CNN-based crop disease classification model achieved accuracy up to 97.47% [
14]. Studies focusing specifically on herbal medicine classification have reported accuracy up to 89.4% for a model classifying 50 different herbal medicines using GoogLeNet [
15] and up to 92.5% for a model distinguishing 100 types of herbal medicines using EfficientNet [
16]. While these deep learning-based classification studies have shown significant improvements, their generalization performance remains limited, as they were trained on datasets containing background elements. Furthermore, achieving higher classification accuracy is crucial to preventing misidentification of herbal medicines in real-world applications. In addition to accuracy, inference time is a critical factor for the practical implementation of herbal medicine classification, particularly in trade-related scenarios such as imports and exports. A deep learning-based image classification model achieved up to 98% accuracy in classifying
Zizyphus species [
17]. However, the extensive number of parameters and large model size of transfer learning-based models render them impractical for field deployment.
To enhance trust in AI-based classification systems for food-related herbal medicines, XAI methods [
18] should be integrated to visualize and interpret the decision-making process of deep learning models. One strategy for improving classification accuracy involves incorporating additional feature information into these models. The performance of deep learning models is highly dependent on the quality and quantity of training data, and various studies have explored enhancement techniques by integrating additional spectral or depth data layers. For instance, augmenting RGB images with depth data improved classification accuracy by up to 4% compared to using RGB data alone [
19,
20]. Similarly, a study utilizing RGB-NIR multispectral images in a dual-channel CNN model demonstrated a 25% improvement in classification accuracy over single-channel CNN models [
21]. Another study combined RGB and hyperspectral data to classify 90 rice seed varieties, achieving 100% accuracy for certain species, such as GS55R [
22]. In a study on garlic origin traceability, researchers found that the fusion of ultraviolet and mid-infrared spectroscopy data yielded the best outcomes, with an accuracy of 100% [
23].
As demonstrated by these studies, augmenting RGB data with additional features significantly improves classification accuracy. However, acquiring such additional data requires expensive specialized equipment [
24], which is affected by environmental conditions and may not be feasible for on-site applications. Additionally, the inconsistent coloration of
Z. jujuba and
Z. mauritiana presents a significant challenge in classification. According to the Dispensatory on the Visual and Organoleptic Examination of Herbal Medicine [
25],
Z. jujuba typically exhibits a yellowish-brown to reddish-brown smooth surface, whereas
Z. mauritiana is generally yellowish-brown. While color differences can serve as a distinguishing feature, certain samples deviate from these standard color ranges. Some
Z. jujuba samples display relatively lighter hues, while some
Z. mauritiana samples appear darker.
Deep learning models trained on RGB data may excessively rely on color differences between classes, leading to overfitting [
26]. While this could yield high overall accuracy, models often struggle with samples that deviate in color from the majority. This limits their practical usability in real-world distribution settings. Without addressing this issue, such models cannot be reliably implemented for on-site classification in the herbal medicine market.
To overcome these limitations, this study proposes a deep learning-based classification system for distinguishing Z. jujuba and Z. mauritiana. This addresses key challenges such as cost, spatial-temporal constraints, and excessive dependence on color-based classification. To enhance the learning of surface shape features while reducing reliance on color, an additional channel derived from the RGB-based input is incorporated. Specifically, we employ a data preprocessing method utilizing an RGB-GE (5-channel) dataset that integrates grayscale and edge information in addition to conventional RGB (3-channel) data.
Compared to RGB data, this RGB-GE dataset amplifies image features and mitigates the deep learning model’s tendency to overfit to color information. To perform the classification, we utilized deep learning models such as basicCNN [
27,
28], DenseNet [
29], and InceptionV3 [
30]. Furthermore, we applied Gradient-weighted Class Activation Mapping (Grad-CAM) [
31], an XAI technique, to visually interpret the model’s decision-making process and enhance explainability. To assess the feasibility of the proposed approach for on-site authentication devices, the prediction time following image input was also measured. Through a comprehensive evaluation of various data preprocessing methods and deep learning models, this study aims to establish an optimal framework for herbal medicine classification.
2. Materials and Methods
This study developed a deep learning-based image classification system to distinguish between
Z. jujuba and
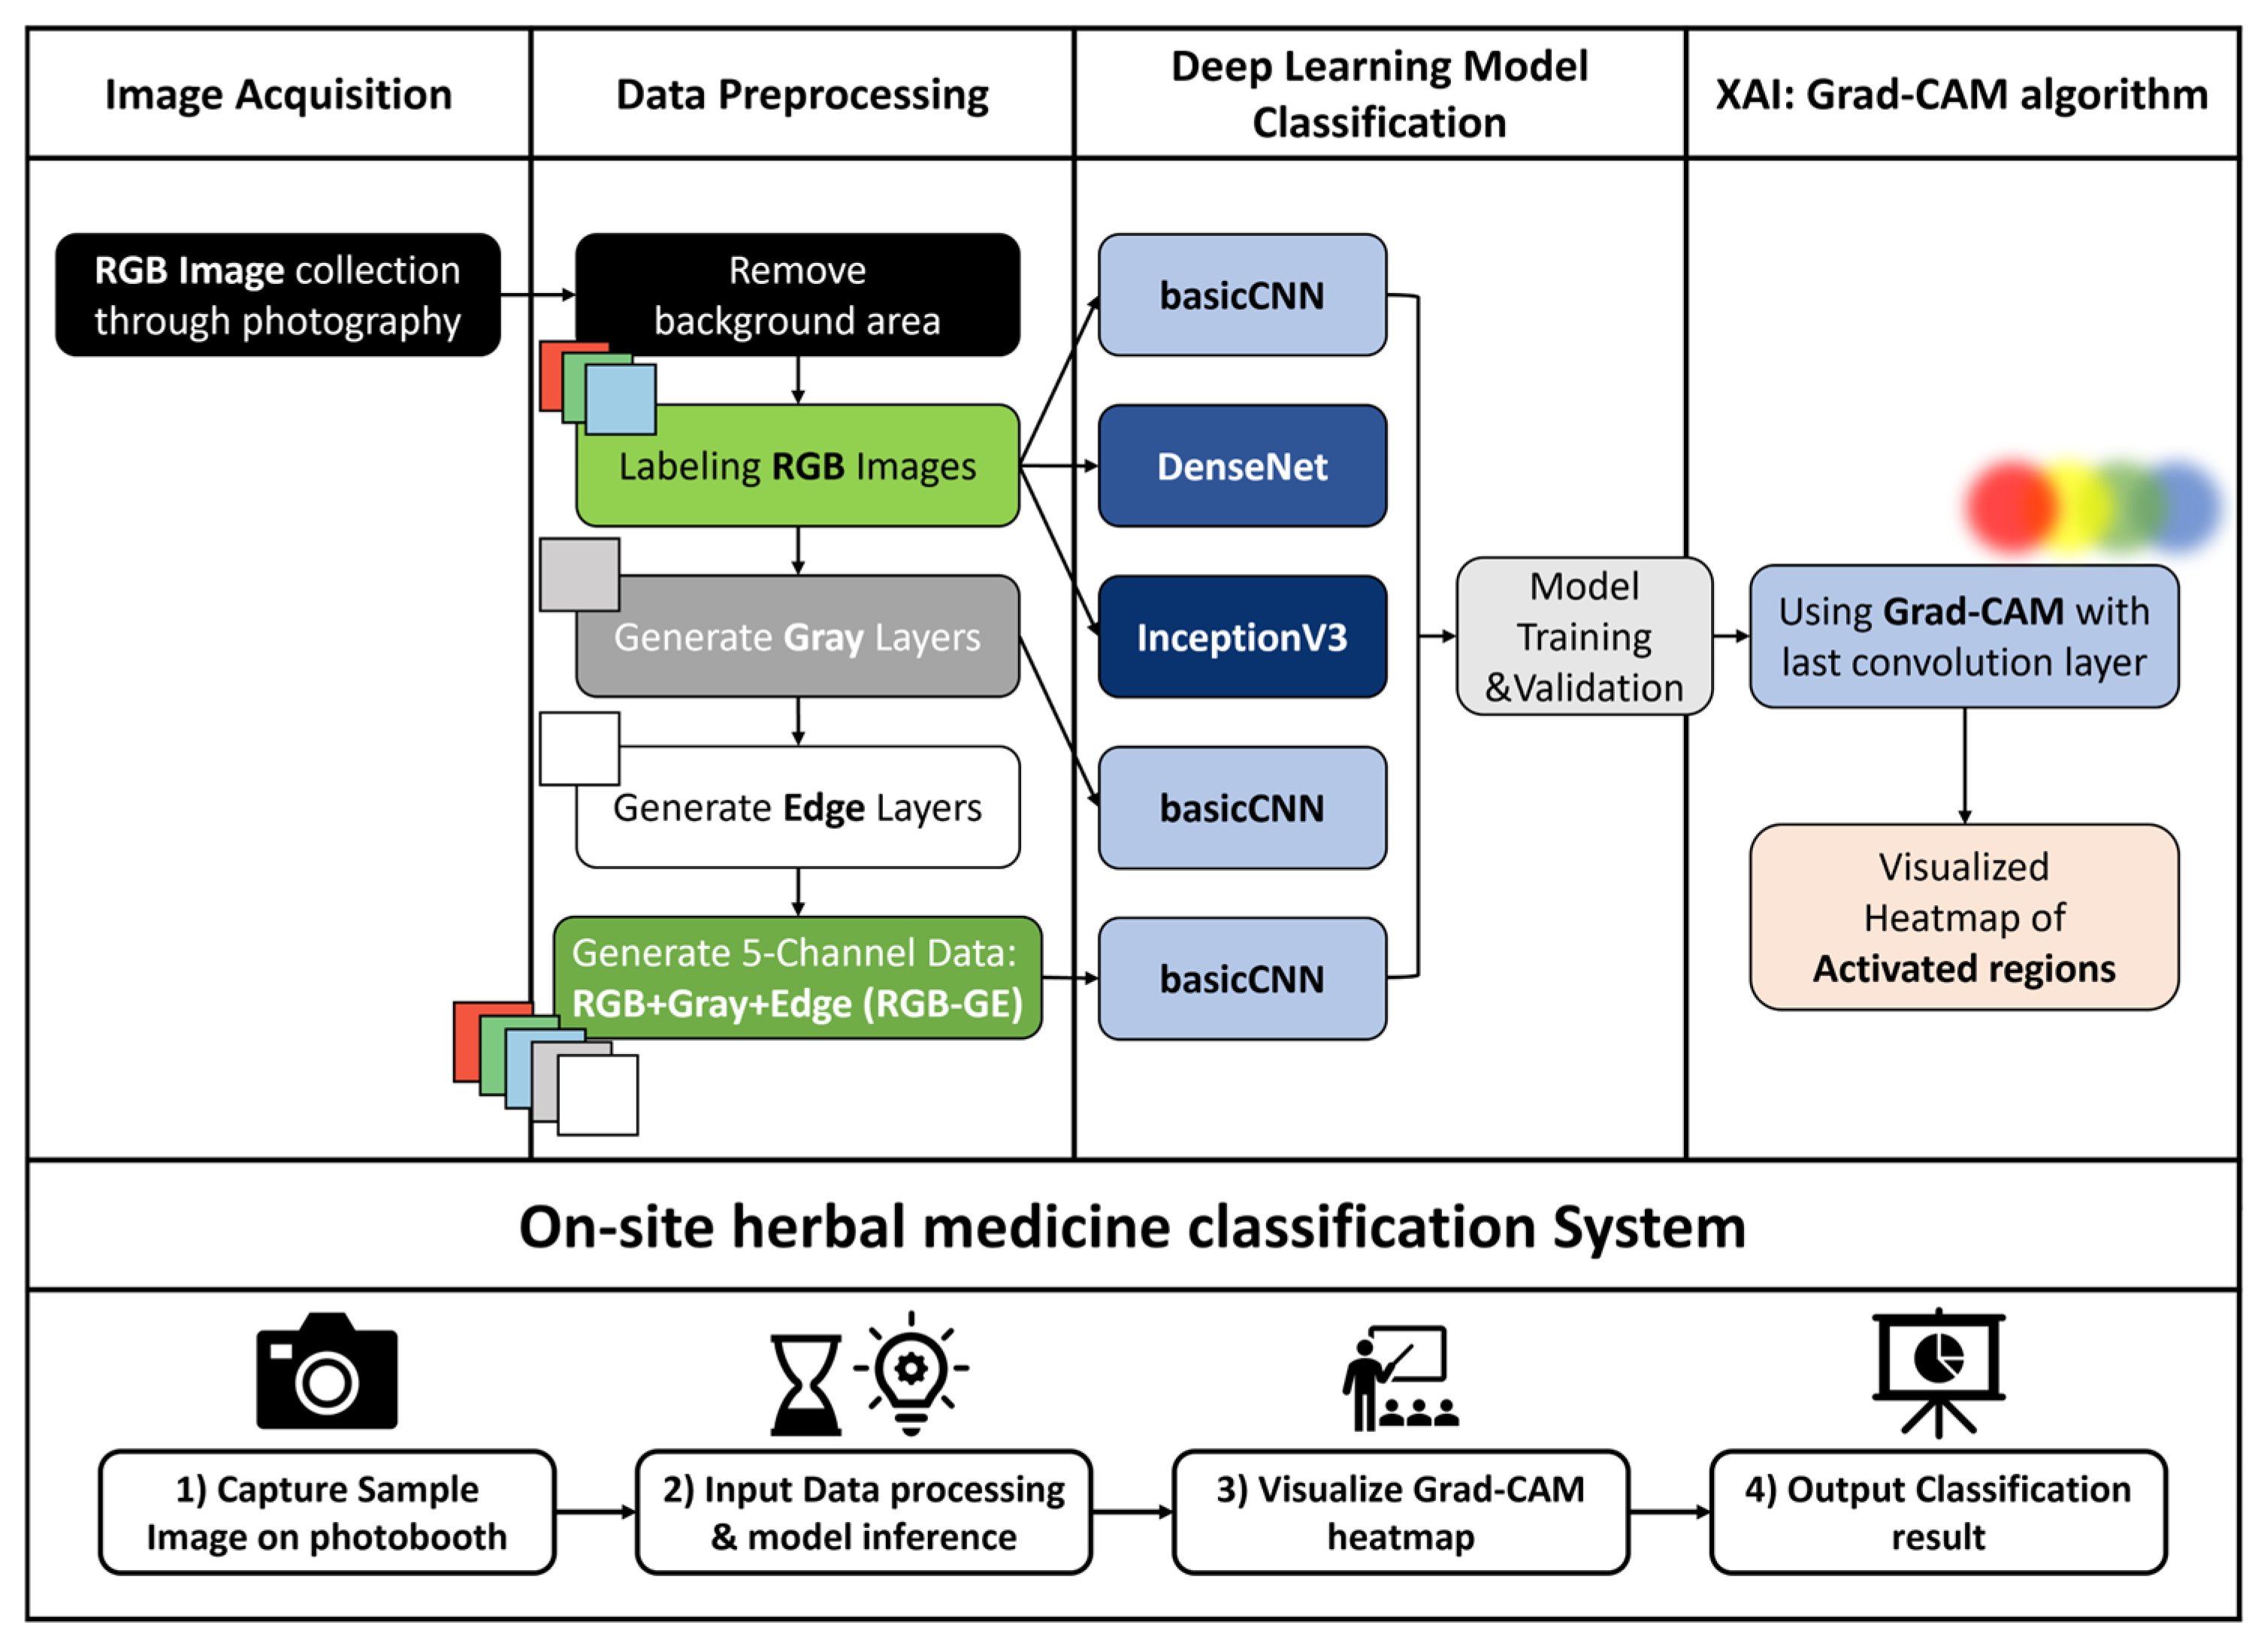
Z. mauritiana based on image features. A total of 1374 images per species were used for model training. Preprocessing steps, including background removal and additional channel generation, were applied prior to training. Three deep learning models were then trained and evaluated. Model performance was assessed using accuracy, precision, recall, F1-score, and confusion matrices. Finally, an on-site herbal medicine classification system was implemented using a Jetson Orin (NVIDIA Corporation, Santa Clara, CA, USA) computing device integrated with a photobox setup. This system incorporated XAI techniques to improve interpretability (
Figure 1).
2.1. Sample Collection and Data Acquisition
For this study,
Z. jujuba and
Z. mauritiana were selected as the target herbal medicines due to their highly similar color and morphological characteristics. The samples were obtained from the National Institute of Korean Medicine Development (NIKOM), where their botanical origins were verified.
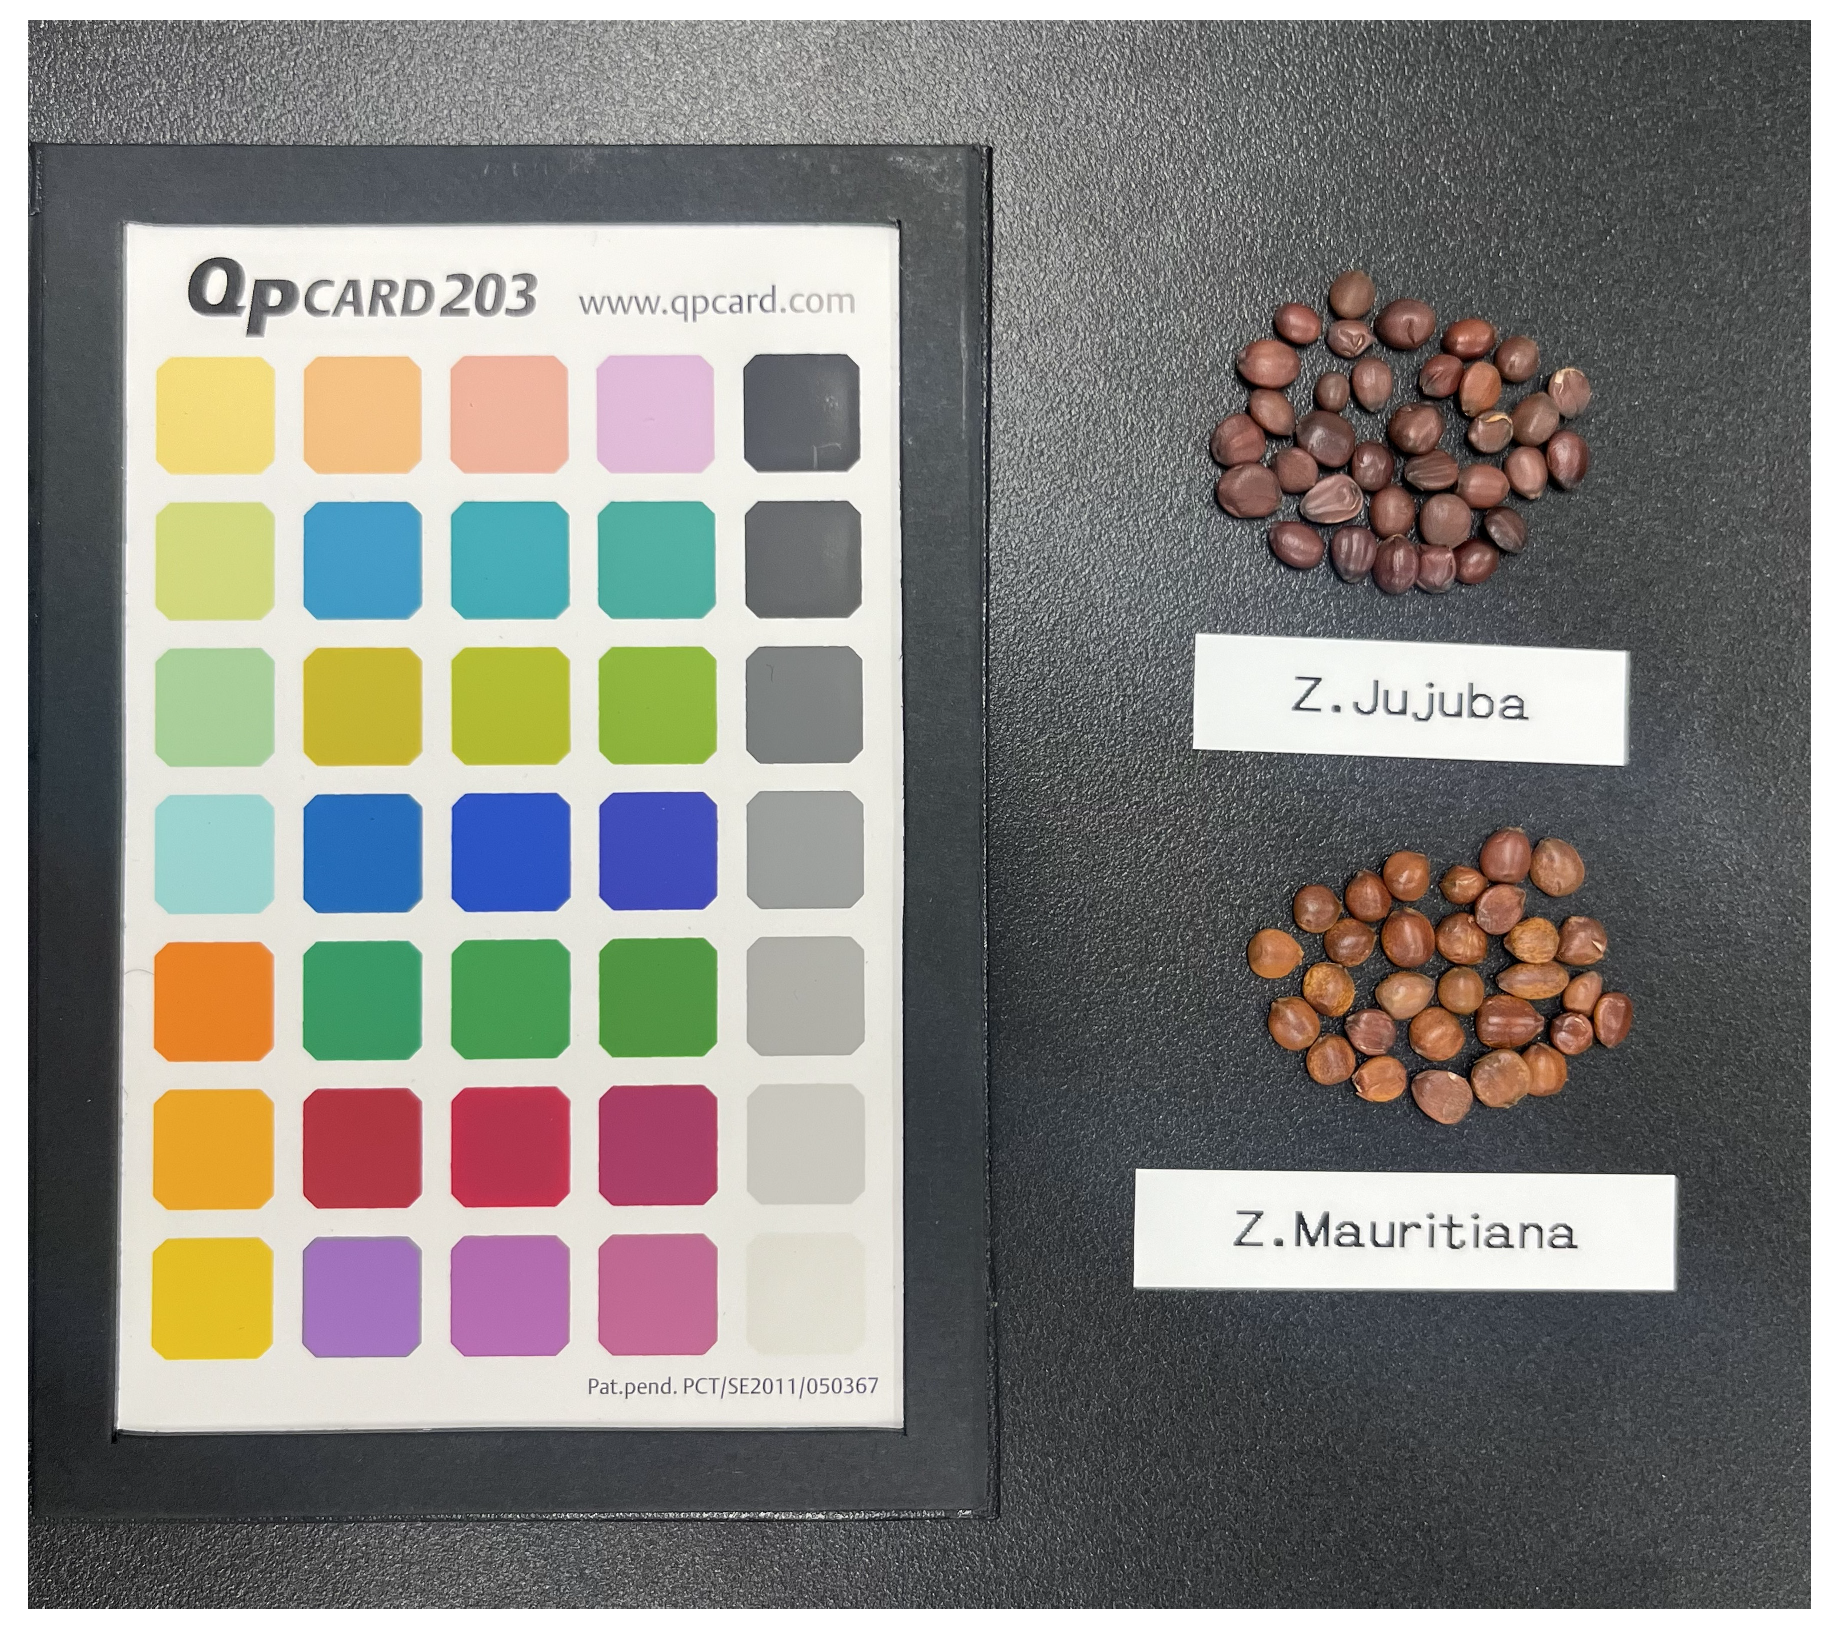
Figure 2 displays sample images of
Z. jujuba (a) and
Z. mauritiana (b) captured with a color reference card (QpCard 203, QPcard AB, Helsingborg, Sweden). To ensure balanced training, 687 samples from each species were used for data collection.
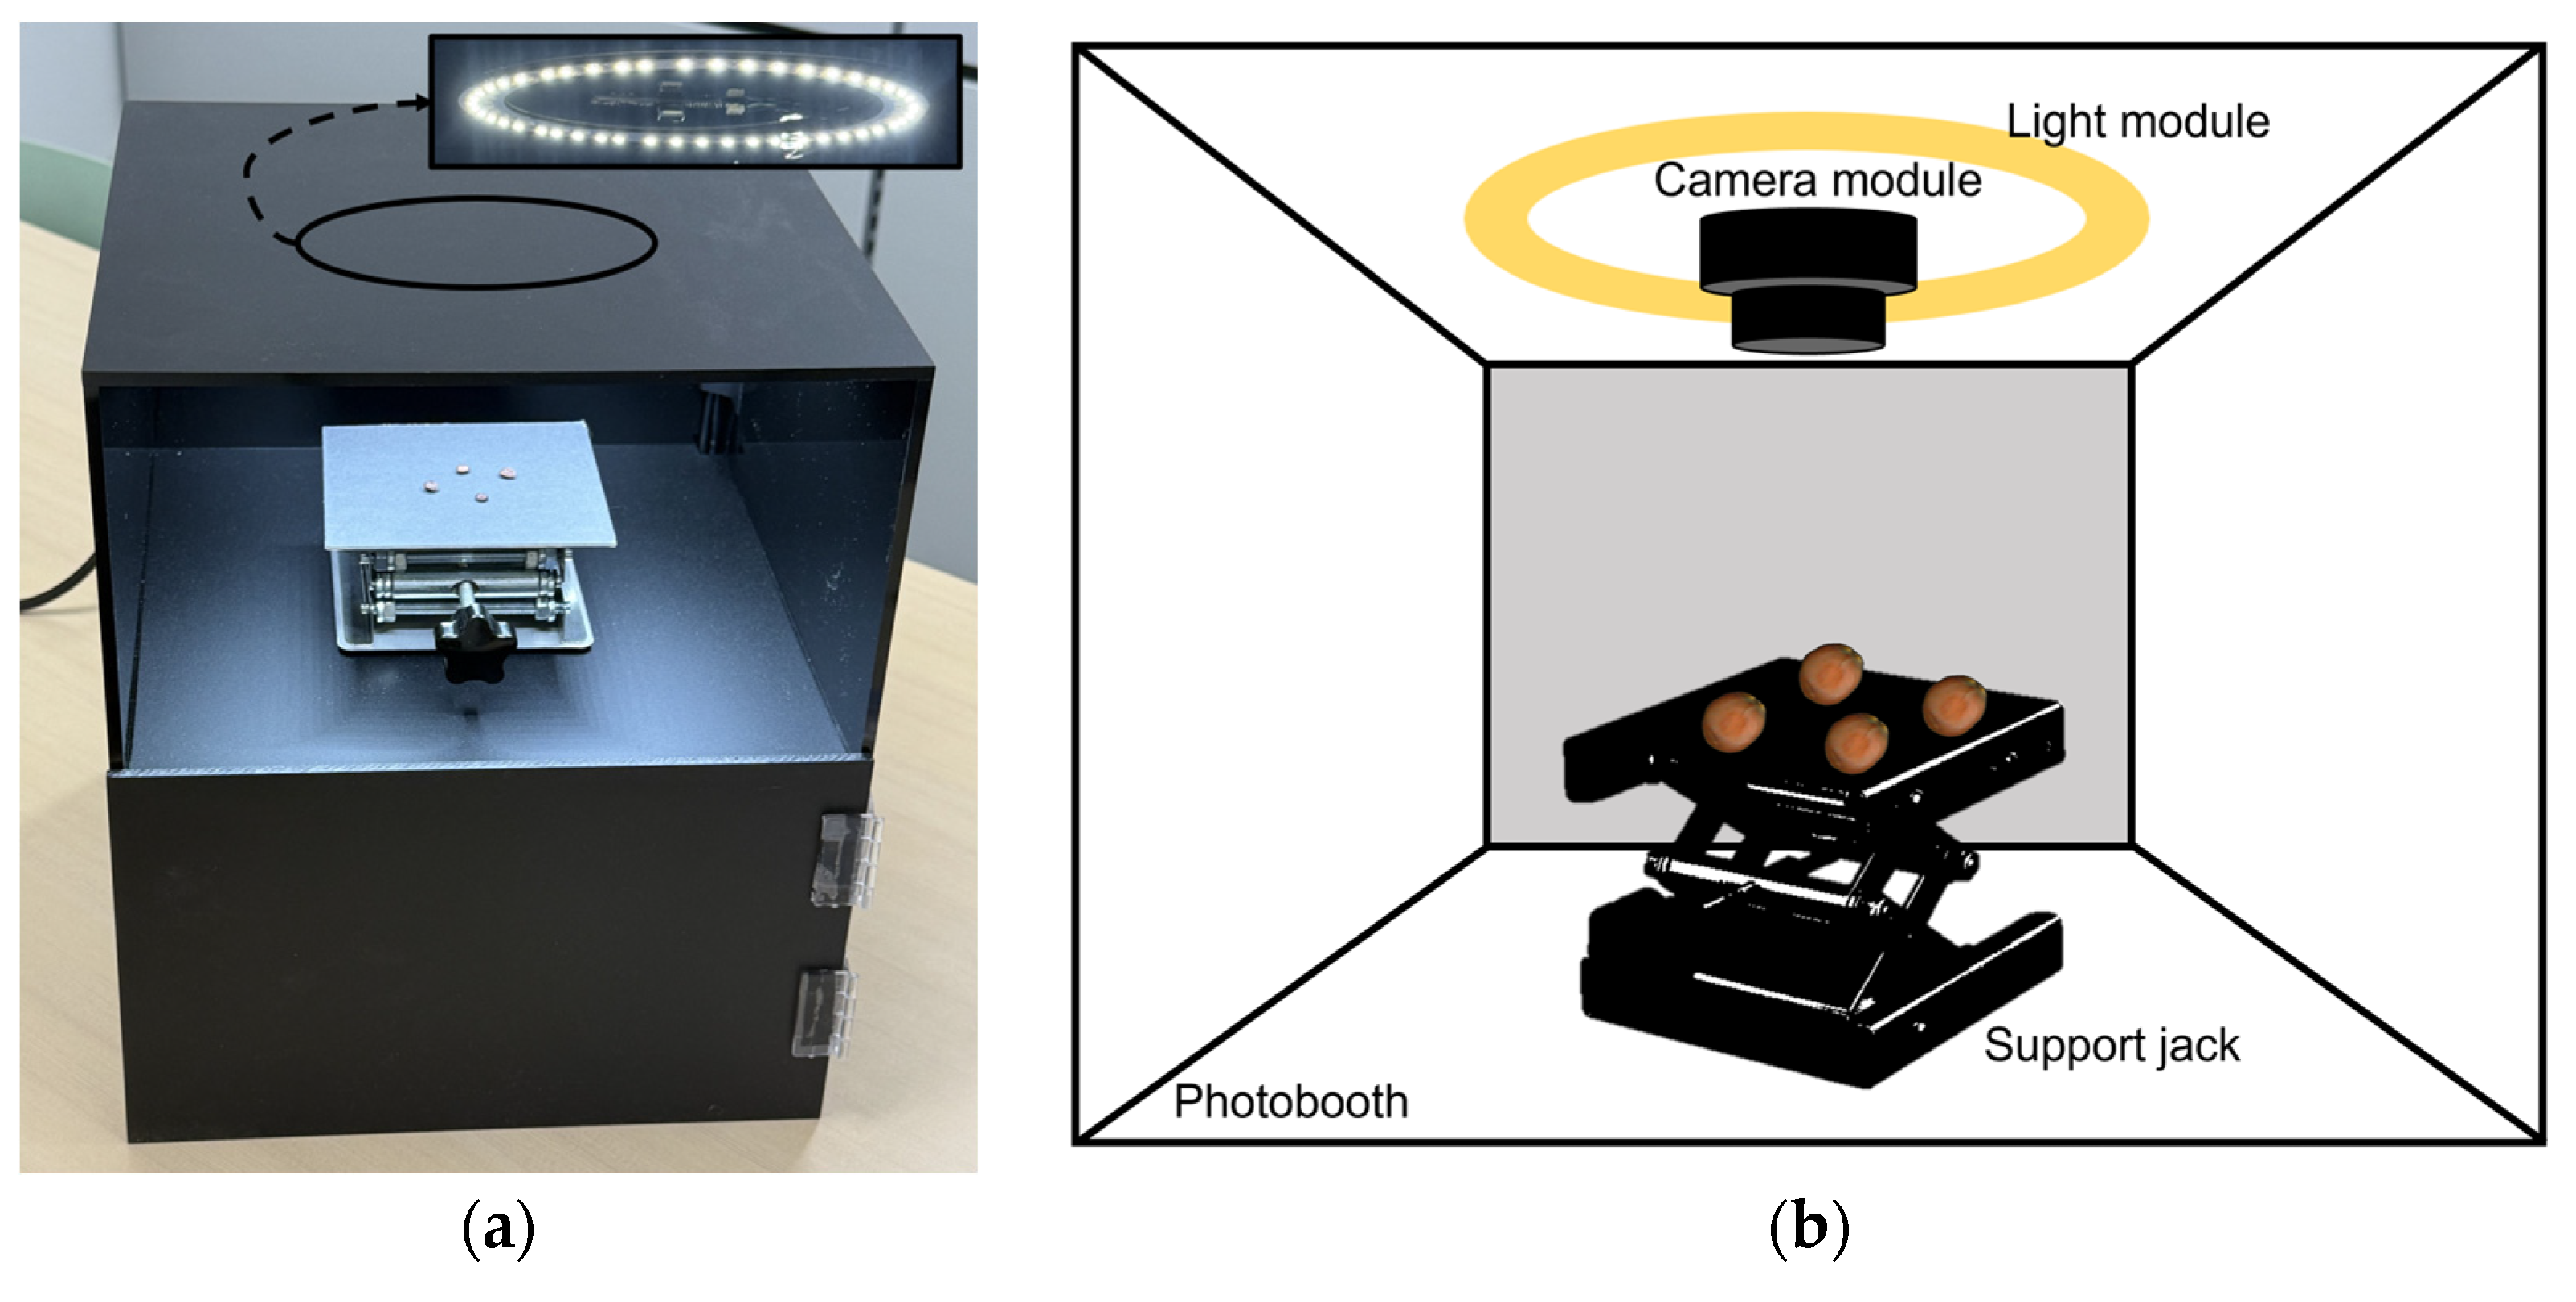
The image acquisition system comprised a custom-built enclosure with a 25-lumen LED light module integrated into the photo light box (PULUZ, Shenzhen, China) to ensure consistent illumination. A high-resolution camera module (ELP-USB16MP02-AF100, Shenzhen Ailipu Technology Co., Ltd., Shenzhen, China) was used to capture top-view images. A support jack was incorporated to adjust the camera height (
Figure 3). During image acquisition, each sample was photographed twice (front and back sides) at a resolution of 640 × 480 pixels and with a brightness setting of 25 lumens. A total of 1374 images (687 per class) were collected for model training without class imbalance.
2.2. Image Preprocessing
Images collected through the imaging device were preprocessed using a custom algorithm to automatically segment them into uniformly sized individual images. This enabled efficient processing even when multiple samples were captured simultaneously for rapid data collection (
Figure 4). First, to separate the sample regions from the background, the U2-Net-based background removal library Rembg (v2.31.0) [
32,
33] was employed to extract the samples. To individually segment the extracted sample regions, the ‘contourArea’ function from Python’s OpenCV library (v4.9.0) was used to detect contours delineating the boundaries between samples and background. Only contours exceeding a predefined size threshold of 500 pixels were recognized as valid samples.
Subsequently, for each detected sample, the ‘boundingRect’ function of OpenCV was applied to generate a minimum rectangular bounding box. This bounding box was then expanded into a square region, with its side length set to three times the longer dimension of the rectangle. This process of positioning detected samples within expanded square regions was iteratively performed to construct the training dataset, resulting in a total of 1374 images per class for Z. jujuba and Z. mauritiana.
2.3. Data Augmentation and Feature Extraction
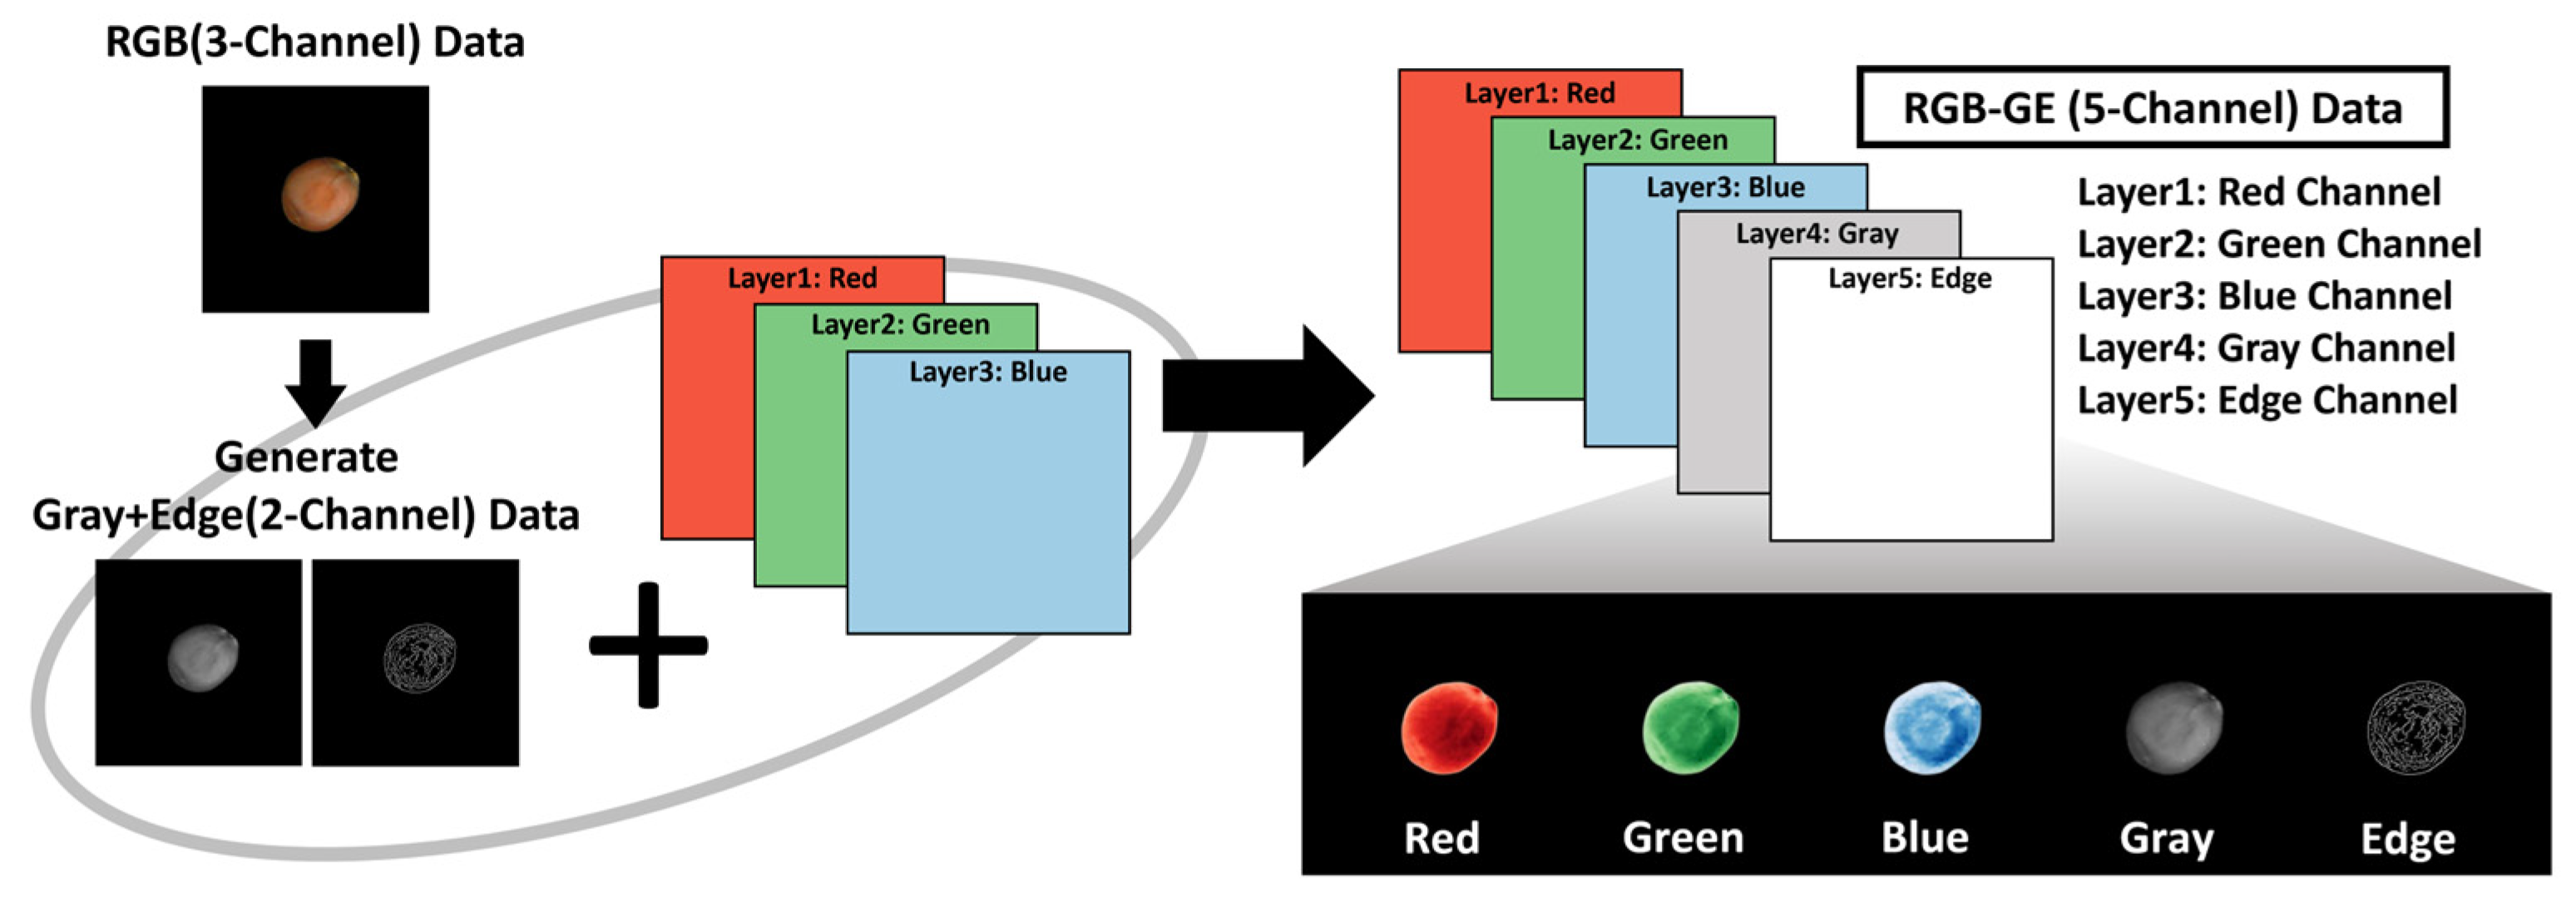
To enhance feature extraction, grayscale and edge detection were selected as complementary channels because traditional differentiation methods for
Z. jujuba and
Z. mauritiana rely primarily on color and surface texture patterns. These additional image channels were generated using OpenCV functions. RGB images were converted to grayscale via the ‘BGR2GRAY’ function, and Canny edge detection was applied to emphasize surface texture information. The grayscale and edge-detected images were then integrated with the original RGB images to construct RGB-GE images, thereby reducing over-reliance on color features while maximizing edge characteristics. This approach amplifies image features beyond standard RGB data (
Figure 5).
2.4. Image Classification Model Training
To evaluate the classification performance of deep learning-based models on the extracted dataset, a Convolutional Neural Network (CNN) was employed for training. In this study, three model architectures—basicCNN [
28], DenseNet [
29], and InceptionV3 [
30]—were utilized for experimentation (
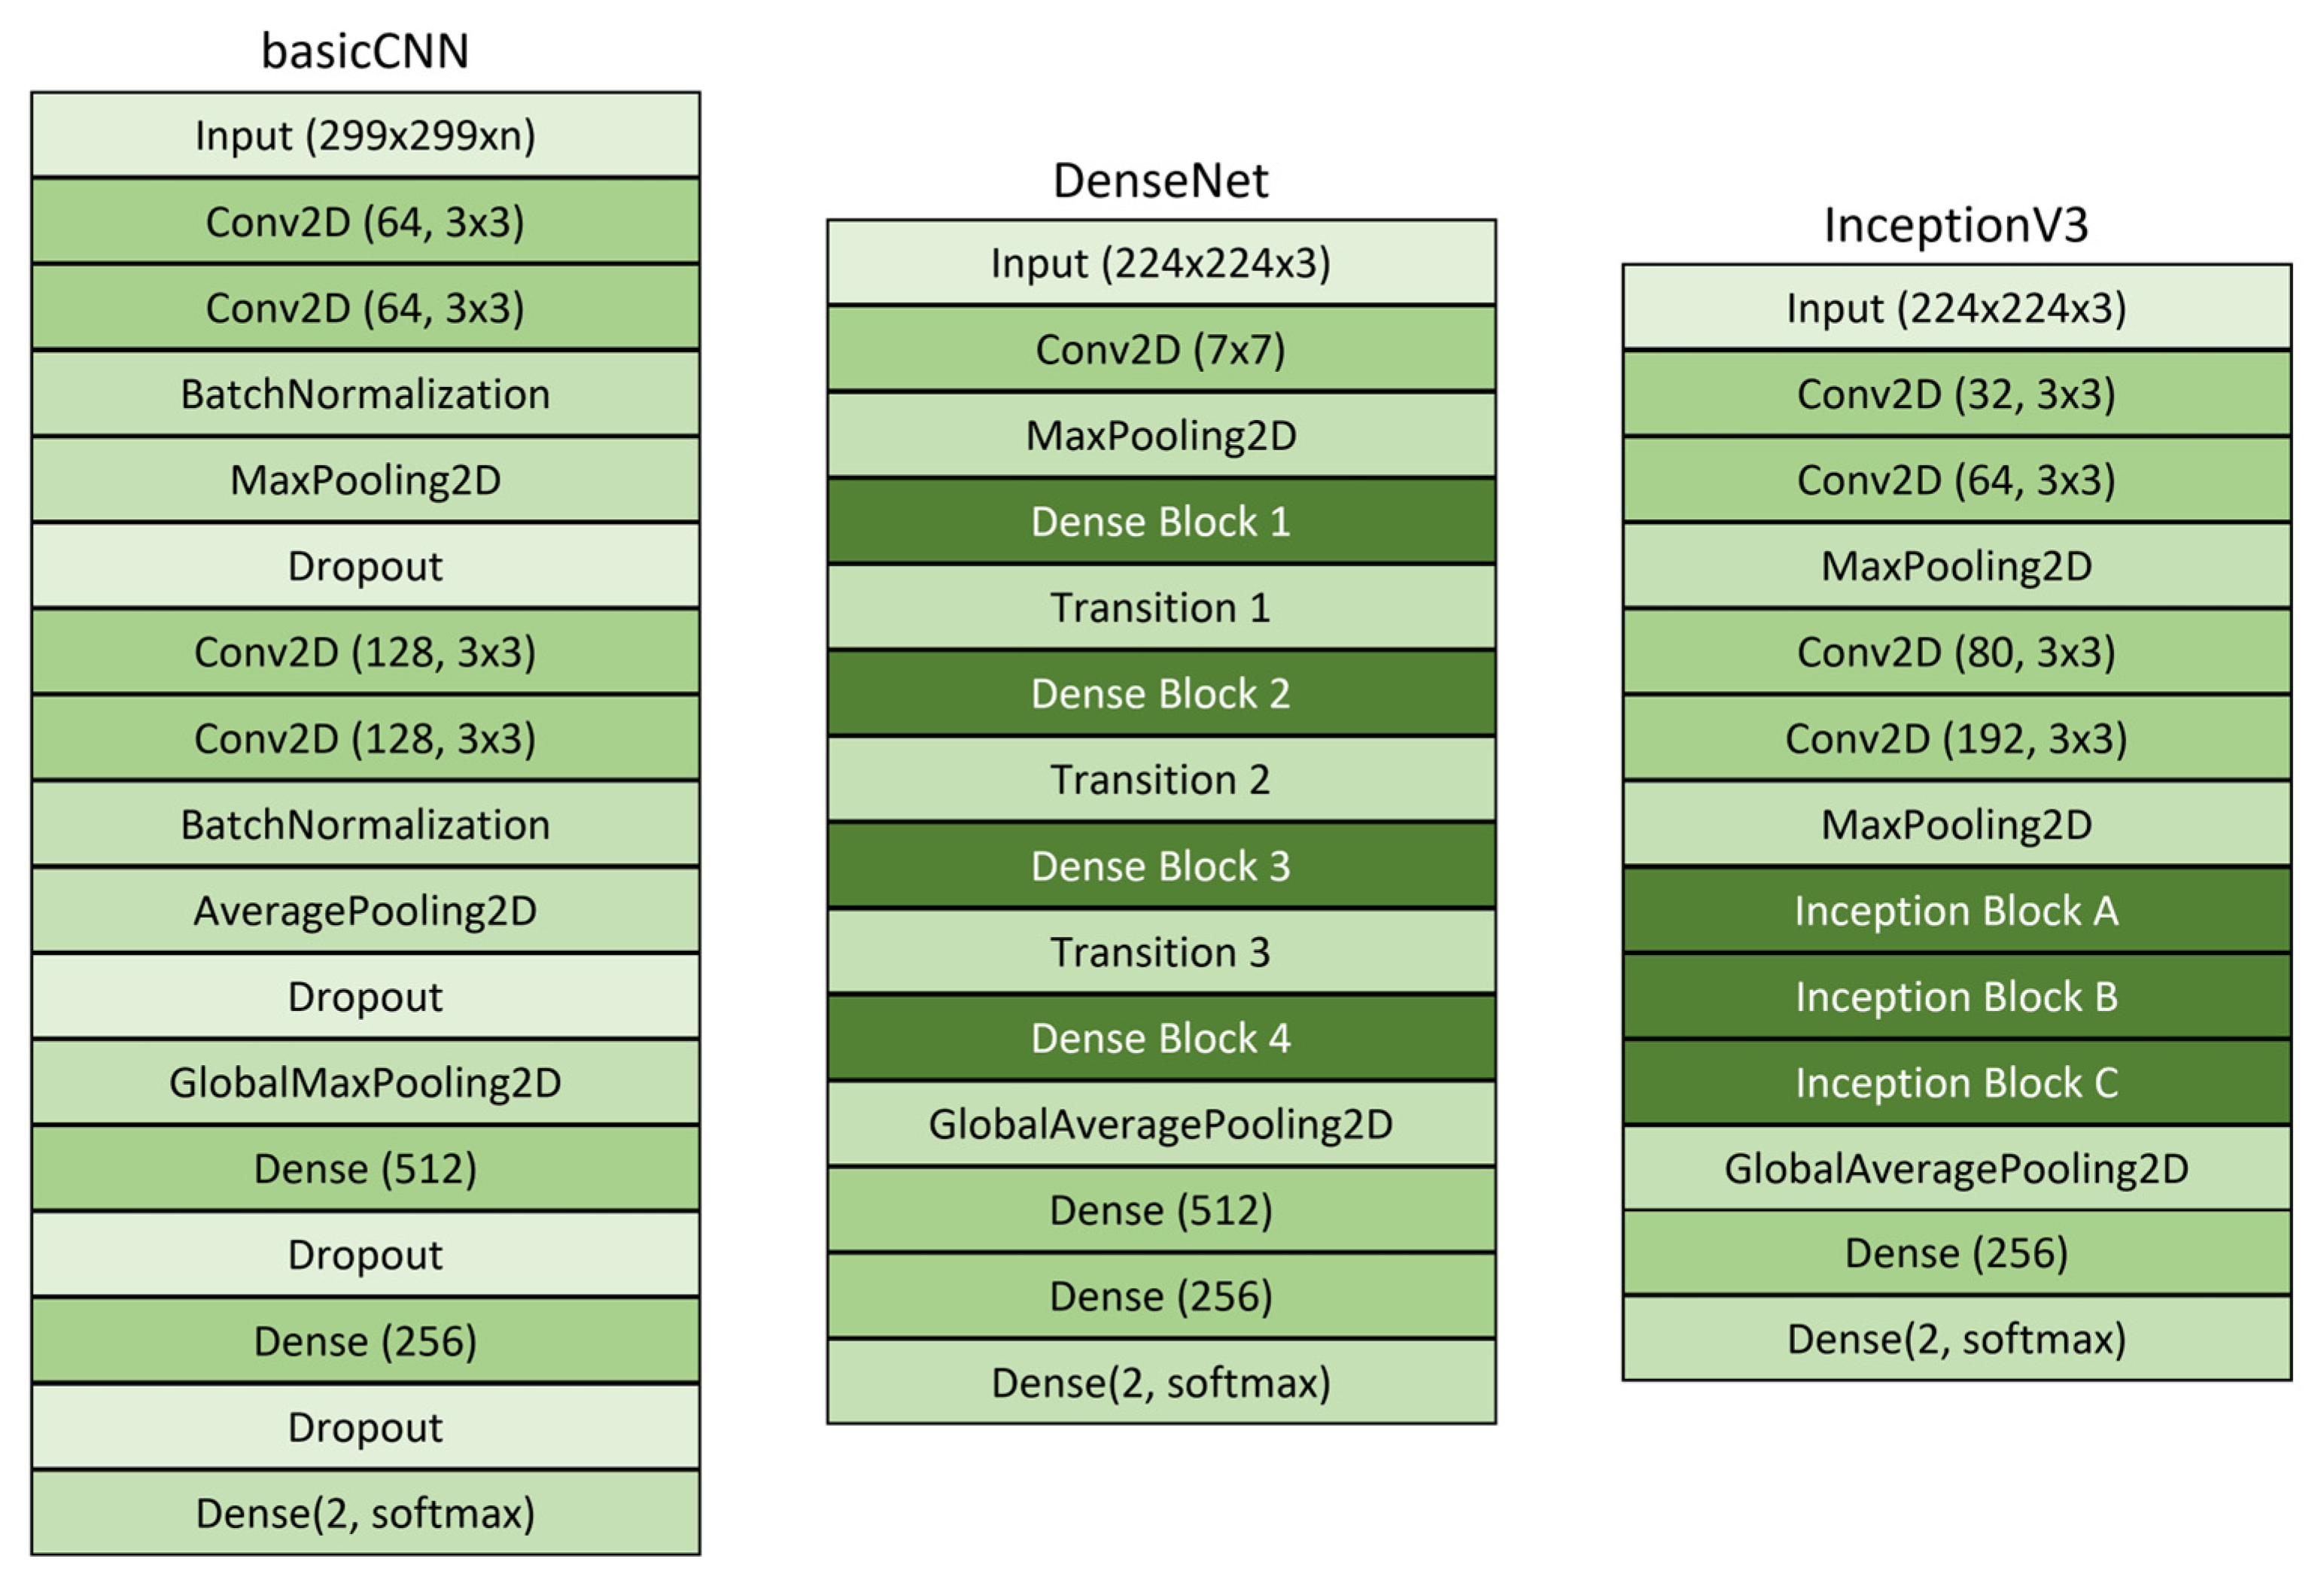
Figure 6). These architectures were selected for their complementary characteristics. BasicCNN was chosen for its lightweight computational requirements, suitable for resource-constrained environments. DenseNet was selected for its efficient information flow through dense connections. InceptionV3 was chosen for its multi-scale feature extraction capabilities that enhance classification accuracy.
The basicCNN model, which represents a fundamental CNN structure, was trained with grayscale, RGB (
Table 1), and RGB-GE (
Table 2) input data. DenseNet and InceptionV3, both widely used deep neural network architectures for image classification, were fine-tuned via transfer learning with pre-trained weights from the ImageNet dataset [
34]. Training was performed on a server equipped with an NVIDIA RTX A5000 GPU (NVIDIA Corporation, Santa Clara, CA, USA) with 24GB of VRAM. The deep learning models were implemented CUDA (v11.8, NVIDIA Corporation, Santa Clara, CA, USA) and cuDNN (v8.0, NVIDIA Corporation, Santa Clara, CA, USA) optimizations for efficient computation.
The basicCNN model employs a 3 × 3 convolutional filter and is designed to process input images of size 256 × 256 pixels with RGB, grayscale, and RGB-GE data formats. Each convolutional layer utilizes the ReLU activation function to facilitate the learning of complex patterns, and batch normalization is applied to stabilize training. Following the convolutional layers, the extracted feature maps are transformed into a one-dimensional vector using a flatten layer, which is subsequently passed through two fully connected layers. The final classification layer incorporates the Softmax activation function to categorize the input into two classes. The model was trained using the Adam optimization algorithm with a learning rate of 0.0001.
DenseNet is a deep learning architecture in which each layer receives inputs from all preceding layers, effectively enhancing information propagation and mitigating the vanishing gradient problem. The DenseNet model employed in this study was based on the DenseNet121 architecture, utilizing pre-trained ImageNet weights. Input images were resized to 224 × 224 × 3 pixels. The feature maps extracted from the final layer of DenseNet121 were passed through an average pooling layer before being classified into two categories via a dense layer with a Softmax activation function. The training process was conducted using the Adam optimizer with a learning rate of 0.0001.
InceptionV3, the third iteration of Google’s Inception model series, is distinguished by its application of multi-scale convolutional filters, enabling efficient spatial feature extraction from images. Similar to DenseNet, the InceptionV3 model used in this study incorporated pre-trained ImageNet weights and included custom layers for classification. The model was designed to process input images with dimensions of 229 × 229 × 3 pixels. The extracted feature maps were passed through a flatten layer before being fed into the final output layer, where the ReLU activation function was applied, followed by the Softmax activation function for binary classification. The training process employed the Adam optimizer with a learning rate of 0.0001. All models were trained for 100 epochs with a batch size of 32 to ensure sufficient feature learning. The model training and implementation were conducted on a server in a development environment using TensorFlow 2.13.1 and Python 3.8.20.
2.5. Deep Learning Model Performance Evaluation
To evaluate the performance of the trained deep learning-based image classification models, the dataset was partitioned into training and validation sets at an 8:2 ratio. The classification performance of the trained models was assessed using precision, recall, F1-score, and a confusion matrix [
35].
Precision, defined by Equation (1), measures the proportion of true positive predictions among all instances classified as positive. This metric reflects the model’s ability to minimize false positive errors and is particularly important when the cost of incorrect positive predictions is high. Recall, as shown in Equation (2), represents the proportion of actual positive cases that are correctly identified by the model. It reflects the model’s ability to capture relevant instances and is critical when missing positive cases carry significant consequences. F1-score, the harmonic mean of precision and recall, is particularly useful in scenarios where accurately identifying positive samples is crucial, as described in Equation (3). It provides a balanced measure that helps assess model performance in the presence of class imbalance, offering insight into how well the classifier handles both classes rather than being biased toward the majority class. Accuracy quantifies the proportion of correctly predicted samples in the entire dataset, reflecting the overall correctness of the model’s predictions, as defined by Equation (4).
A confusion matrix is a tabular representation that illustrates the relationship between predicted and actual values, facilitating the evaluation of a classification model’s performance [
36]. This matrix comprises four key components. True Positive (TP) denotes instances where the model correctly predicts the positive class, while True Negative (TN) refers to correctly predicted negative class instances. False Positive (FP) occurs when the model incorrectly classifies a negative sample as positive, whereas False Negative (FN) represents cases where a positive sample is misclassified as negative. By analyzing the confusion matrix, the types and proportions of errors made by the model for each class can be identified, providing valuable insights into its classification performance.
2.6. Grad-CAM and Complementary XAI Methods
In this study, an eXplainable AI (XAI) technique [
18] was employed to enhance the interpretability of classification models trained on
Z. jujuba and
Z. mauritiana datasets. XAI is a set of methods designed to provide transparency in AI decision-making by identifying key features and patterns that influence model predictions, addressing the black-box nature of AI models. This approach aimed to identify the areas within images that the CNN-based deep learning model focused on during classification, thereby providing a clearer understanding of the model’s decision-making process.
Among XAI techniques, Grad-CAM highlights the most influential regions in an image by computing the importance of feature maps from the final convolutional layer, allowing for visualization of areas that contribute most significantly to the model’s predictions [
31]. This method enables assessment of whether the model relies on relevant morphological features for classification or is influenced by extraneous elements within the image.
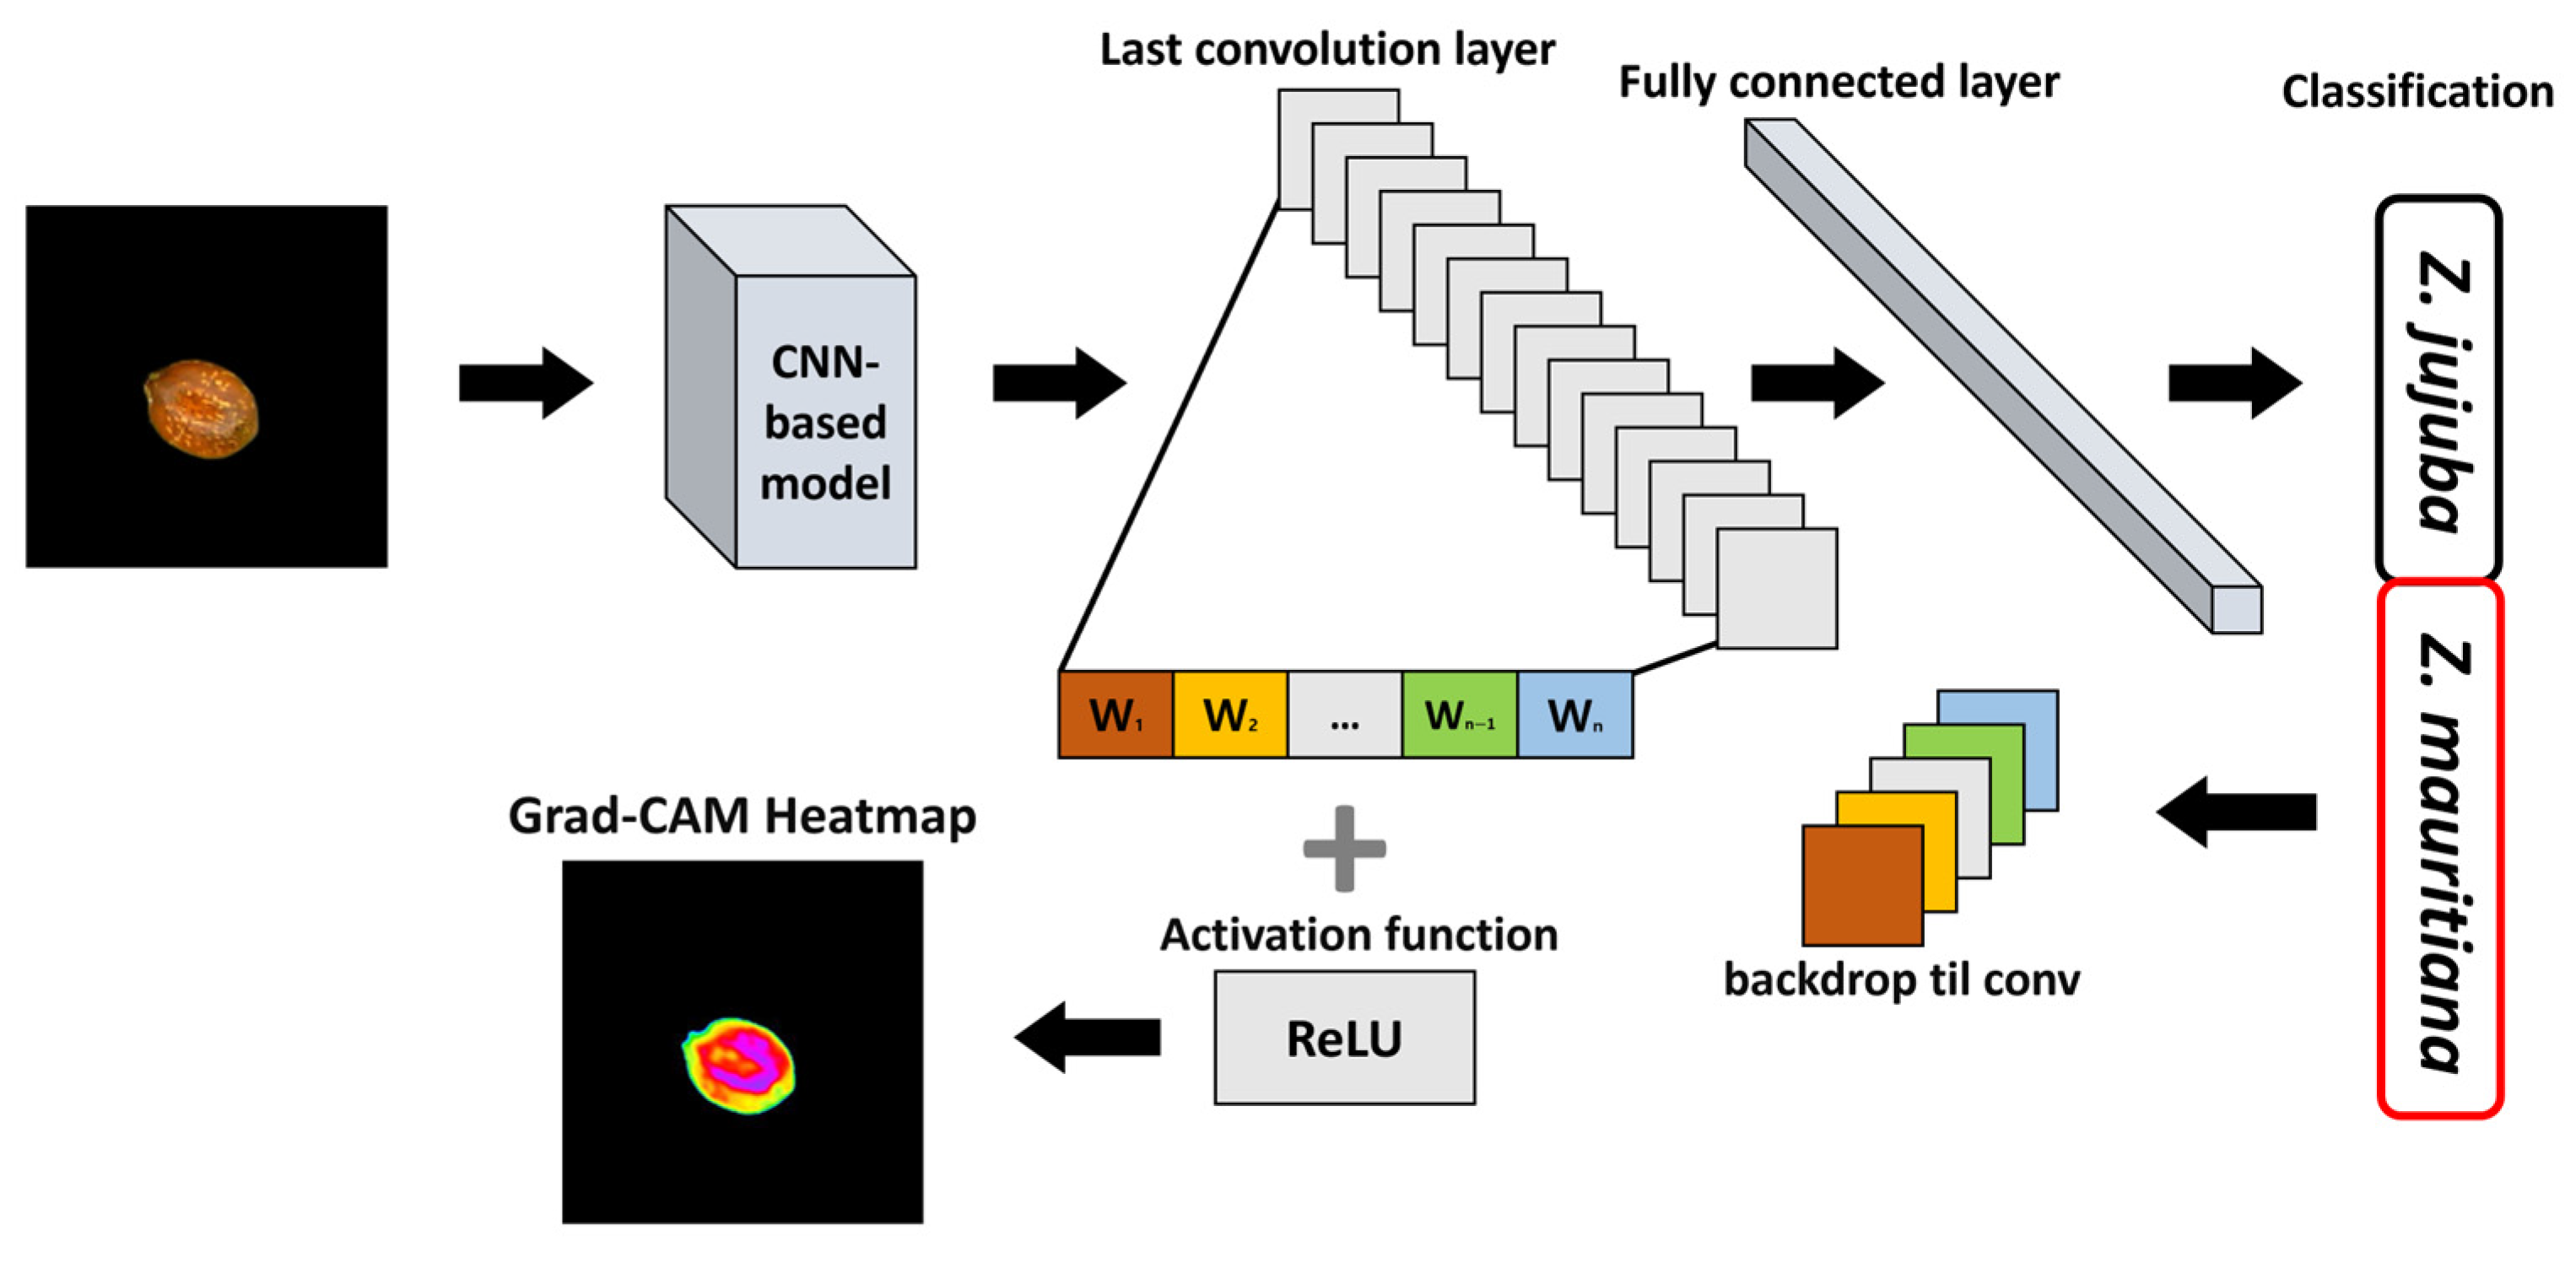
Figure 7 illustrates the Gradient Grad-CAM algorithm process, which generates heatmaps to visualize activation maps based on the predicted class for a given input image. CNN-based models extract features hierarchically, with lower layers detecting simple patterns and higher layers identifying more complex features [
27]. Grad-CAM leverages feature maps from the final convolutional layer to analyze how these extracted features contribute to the model’s final prediction. The Grad-CAM algorithm computes the gradient of the class score with respect to each feature map in the final convolutional layer, where the index represents the feature map. These gradient values indicate the degree of influence that each feature map has on the model’s prediction for a specific class. Using these values, the importance weight for each filter is determined as defined in Equation (5).
In Equation (5), represents the spatial dimensions of the feature map, while denotes the gradient of the class score with respect to the feature map at position . This gradient quantifies the extent to which the feature map at a specific location contributes to the prediction of class . The importance weight for each filter is computed by averaging the gradient values across all spatial positions, thereby measuring the contribution of each filter to class .
The computed importance weight
is then multiplied by the corresponding activation values
of the feature map to generate the activation map for class
, which is defined in Equation (6):
The ReLU (Rectified Linear Unit) function [
37] is applied to retain only the positive influences in the activation map, ensuring that only regions positively contributing to the classification decision are highlighted. The final Grad-CAM heatmap is then superimposed onto the original input image, providing a visual representation of the areas the model considers important for classification.
Although Grad-CAM typically produces a blurred heatmap that offers a general indication of relevant regions, this approach may lack the precision needed for distinguishing small and morphologically similar objects, such as Z. jujuba and Z. mauritiana. To enhance interpretability, this study employed pixel-level heatmap visualization, enabling a more detailed and fine-grained interpretation of the model’s decision-making process.
In addition to Grad-CAM, this study implemented and evaluated two complementary XAI methodologies—Local Interpretable Model-agnostic Explanations (LIME) and occlusion sensitivity analysis. LIME facilitates interpretation of individual predictions by approximating the complex model locally with an interpretable surrogate model. For implementation, input images were segmented into superpixels utilizing the SLIC algorithm with parameters optimized at 150 segments, compactness factor of 10, and sigma value of 1. The methodology encompassed the generation of 250 perturbed samples through random superpixel modifications, followed by the quantitative assessment of each segment’s contribution to the prediction outcome. Visualization protocols were designed to emphasize only positively contributing superpixels while suppressing background regions to enhance interpretability. Concurrently, occlusion sensitivity analysis was conducted by systematically occluding regions of the input image with 16 × 16 pixel patches at a stride of 8 pixels, subsequently measuring fluctuations in prediction probabilities. This approach generated comprehensive sensitivity heatmaps that quantitatively identified regions of critical importance to the model’s decision-making process. The occlusion impact was quantified as the differential between baseline and post-occlusion predictions, with higher values denoting greater significance. For visualization purposes, sensitivity maps underwent normalization before being superimposed as semi-transparent color-coded overlays on the original image, thereby preserving underlying feature visibility while precisely delineating the model’s attentional focus.
2.7. On-Site Classification Device
In this study, an on-site herbal medicine classification system was developed using a trained deep learning model and XAI algorithm. This system was deployed on a Jetson AGX Orin platform featuring a 2048-core NVIDIA Ampere architecture GPU with 64 Tensor Cores, 12-core Arm Cortex-A78AE CPU, and 64GB of memory, making it suitable for portable field applications. To ensure fast and accurate classification in real-world environments, the basicCNN model was selected for implementation as it achieved the optimal balance between performance and computational efficiency.
For system construction, the same data acquisition setup used in the study was employed, including a photo light box and a camera module. A height-adjustable support jack was incorporated to optimize camera positioning. The Jetson Orin platform was integrated with these hardware components to maximize portability and practicality, enabling the system to function as a fully independent, on-site classification device.
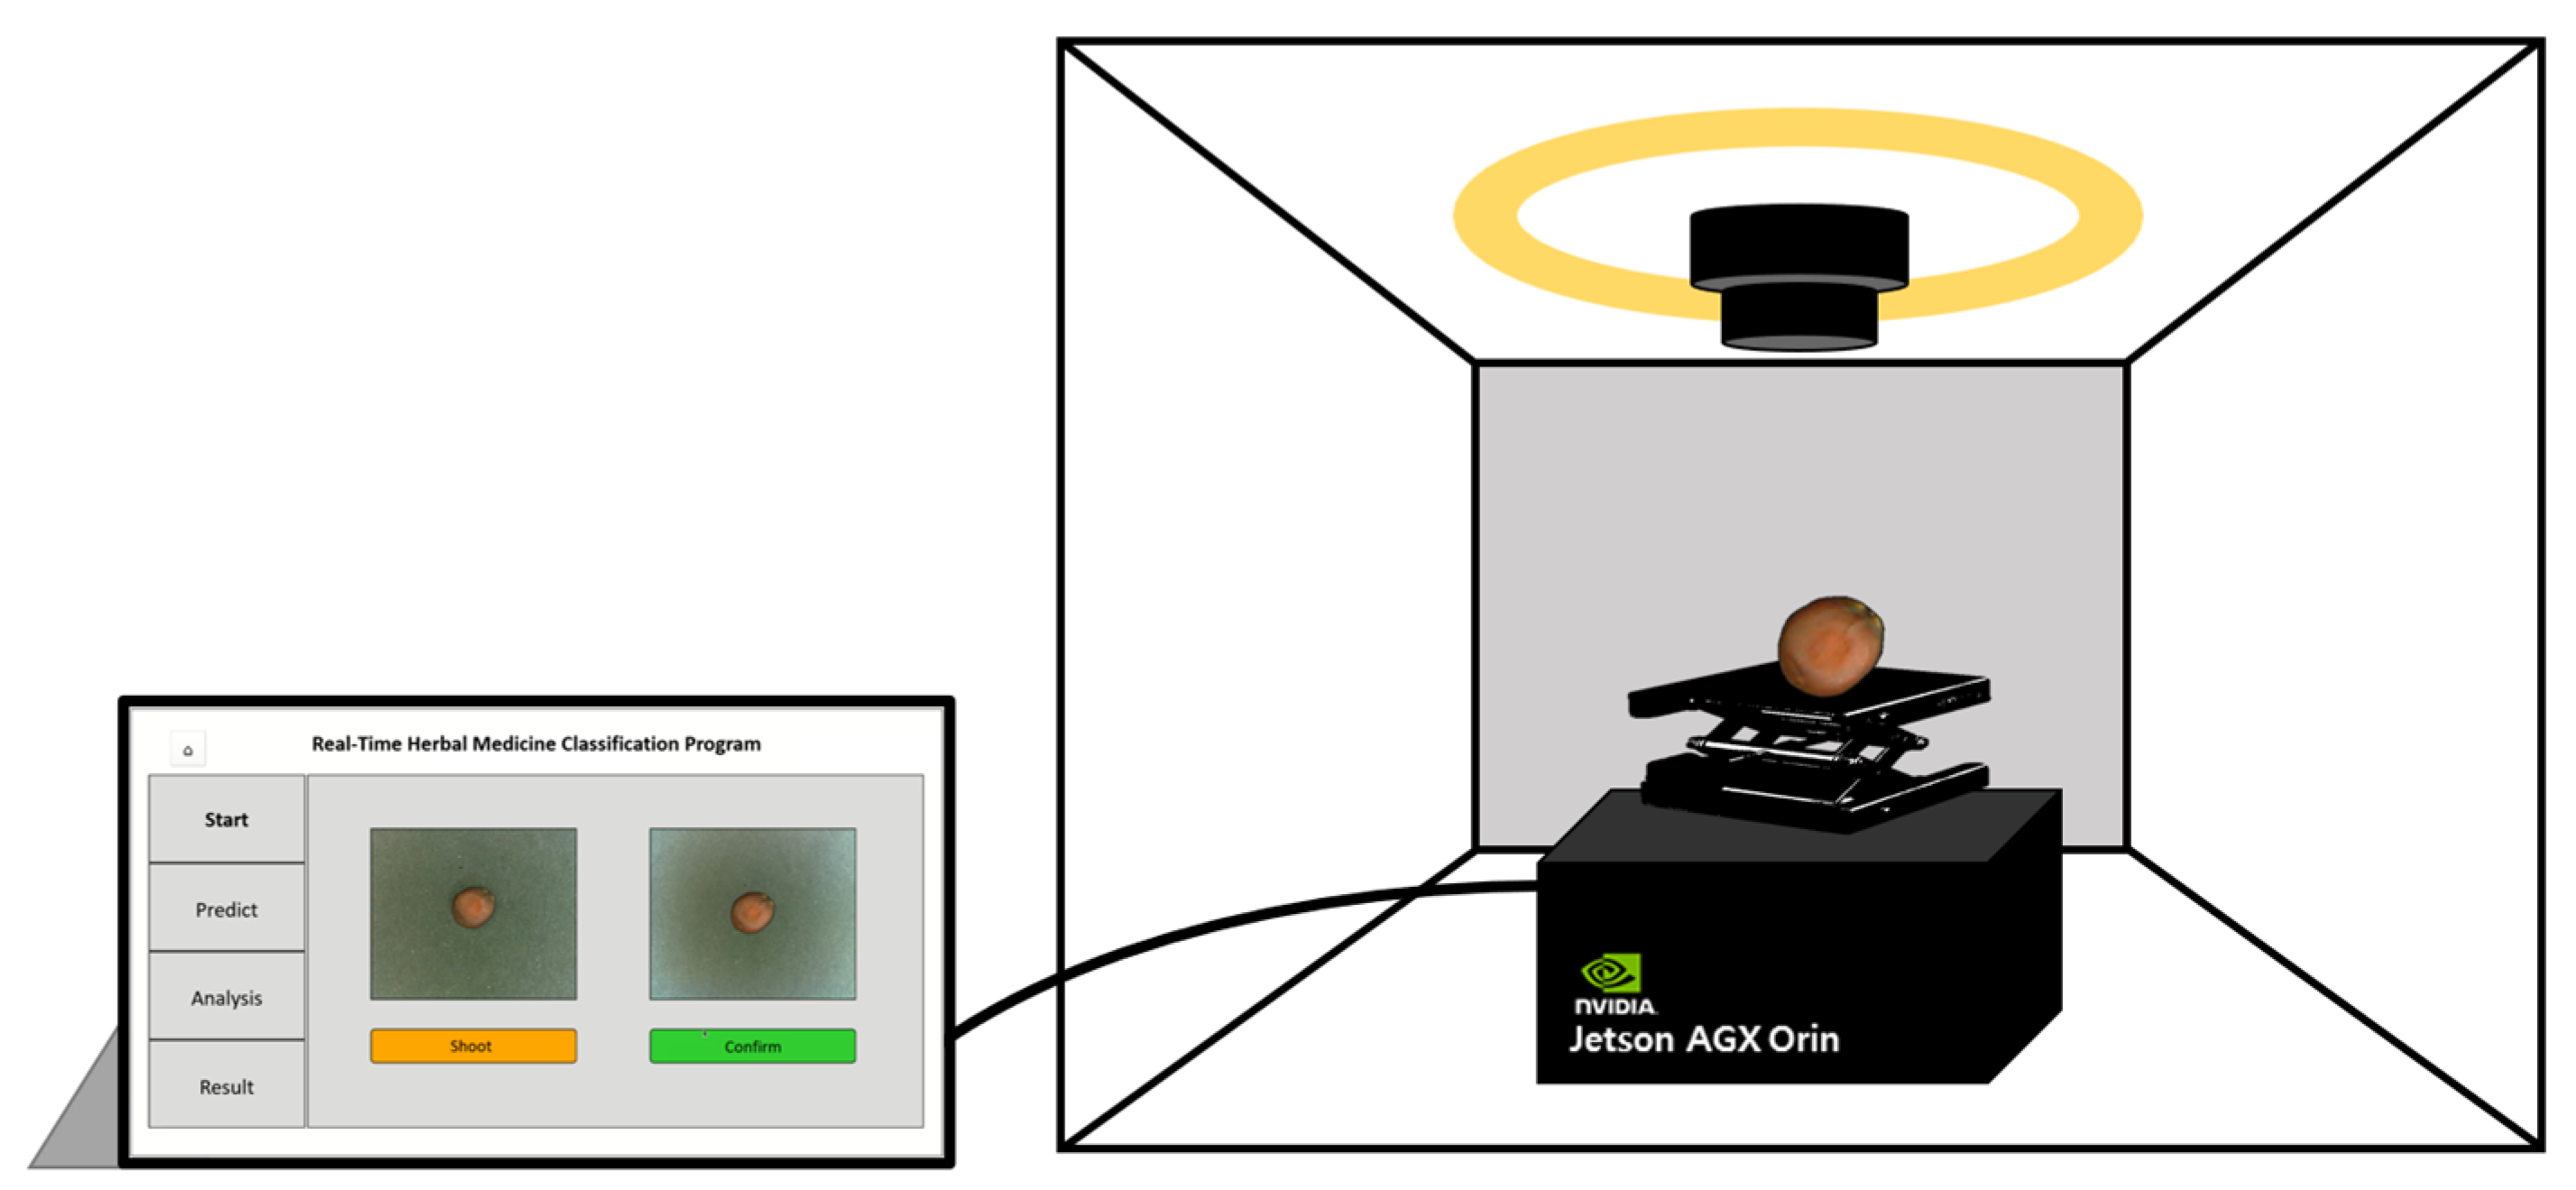
The classification system was designed for immediate usability in field applications. The camera module captures images of herbal samples, and the system processes them on-site to generate classification results via the user interface (UI). Users can capture images of samples at their preferred size, press the confirmation button, and initiate the classification process. The system then converts the image to grayscale, extracts edge-based surface texture information and presents the classification results. Furthermore, Grad-CAM-based XAI visualization is integrated to highlight the image regions the model prioritizes during classification. This feature enhances user trust by providing transparent insights into the model’s decision-making process. The UI program was developed using Python’s PyQt library, enabling seamless interaction and visualization of classification results (
Figure 8).
3. Results
In this study, the data preprocessing approach proposed in the Materials and Methods section integrates RGB channels with additional Gray and Edge channels to amplify information extracted from images. This method enables the deep learning model to learn more accurate and diverse features, improving classification performance without requiring a highly complex or resource-intensive model. Furthermore, XAI techniques were applied to identify key features and regions that the deep learning model prioritized during classification. This enhances the model’s interpretability and provides users with a clearer understanding of its decision-making rationale. The trained model was subsequently deployed in an on-site classification system implemented on a Jetson Orin platform, ensuring both accuracy and portability for field classification of Z. jujuba and Z. mauritiana in herbal medicine distribution settings.
3.1. Performance Evaluation of Models
The classification performance of deep learning models, including basicCNN, DenseNet, and InceptionV3, was evaluated using RGB image data. As summarized in
Table 3, the classification accuracy of models trained on RGB data was 92.91% for basicCNN, while DenseNet and InceptionV3 both achieved significantly higher accuracies of 98.55%, demonstrating their superior performance over the simpler basicCNN architecture.
To investigate the influence of color information and emphasize structural features, additional experiments were conducted using grayscale and RGB-GE data formats with the basicCNN model. The results showed that classification accuracy with grayscale data was 90.73%, while accuracy with RGB-GE data reached 98.36%, representing an improvement of approximately 6% over the basicCNN model trained on standard RGB data.
Analysis of recall values revealed significant patterns across the models. Z. mauritiana recall values in DenseNet and InceptionV3 were 0.9782 and 0.9818, respectively. BasicCNN showed high recall values of 0.9891 for RGB data and 0.9854 for RGB-GE data when detecting Z. mauritiana. While the recall values remained comparable between the two data formats, there was a substantial improvement in precision when using RGB-GE data. The precision for Z. mauritiana increased from 0.8831 with RGB data to 0.9819 with RGB-GE data. This quantitative improvement indicates that the RGB-GE format maintained the model’s detection capability while reducing false positive classifications.
As shown in
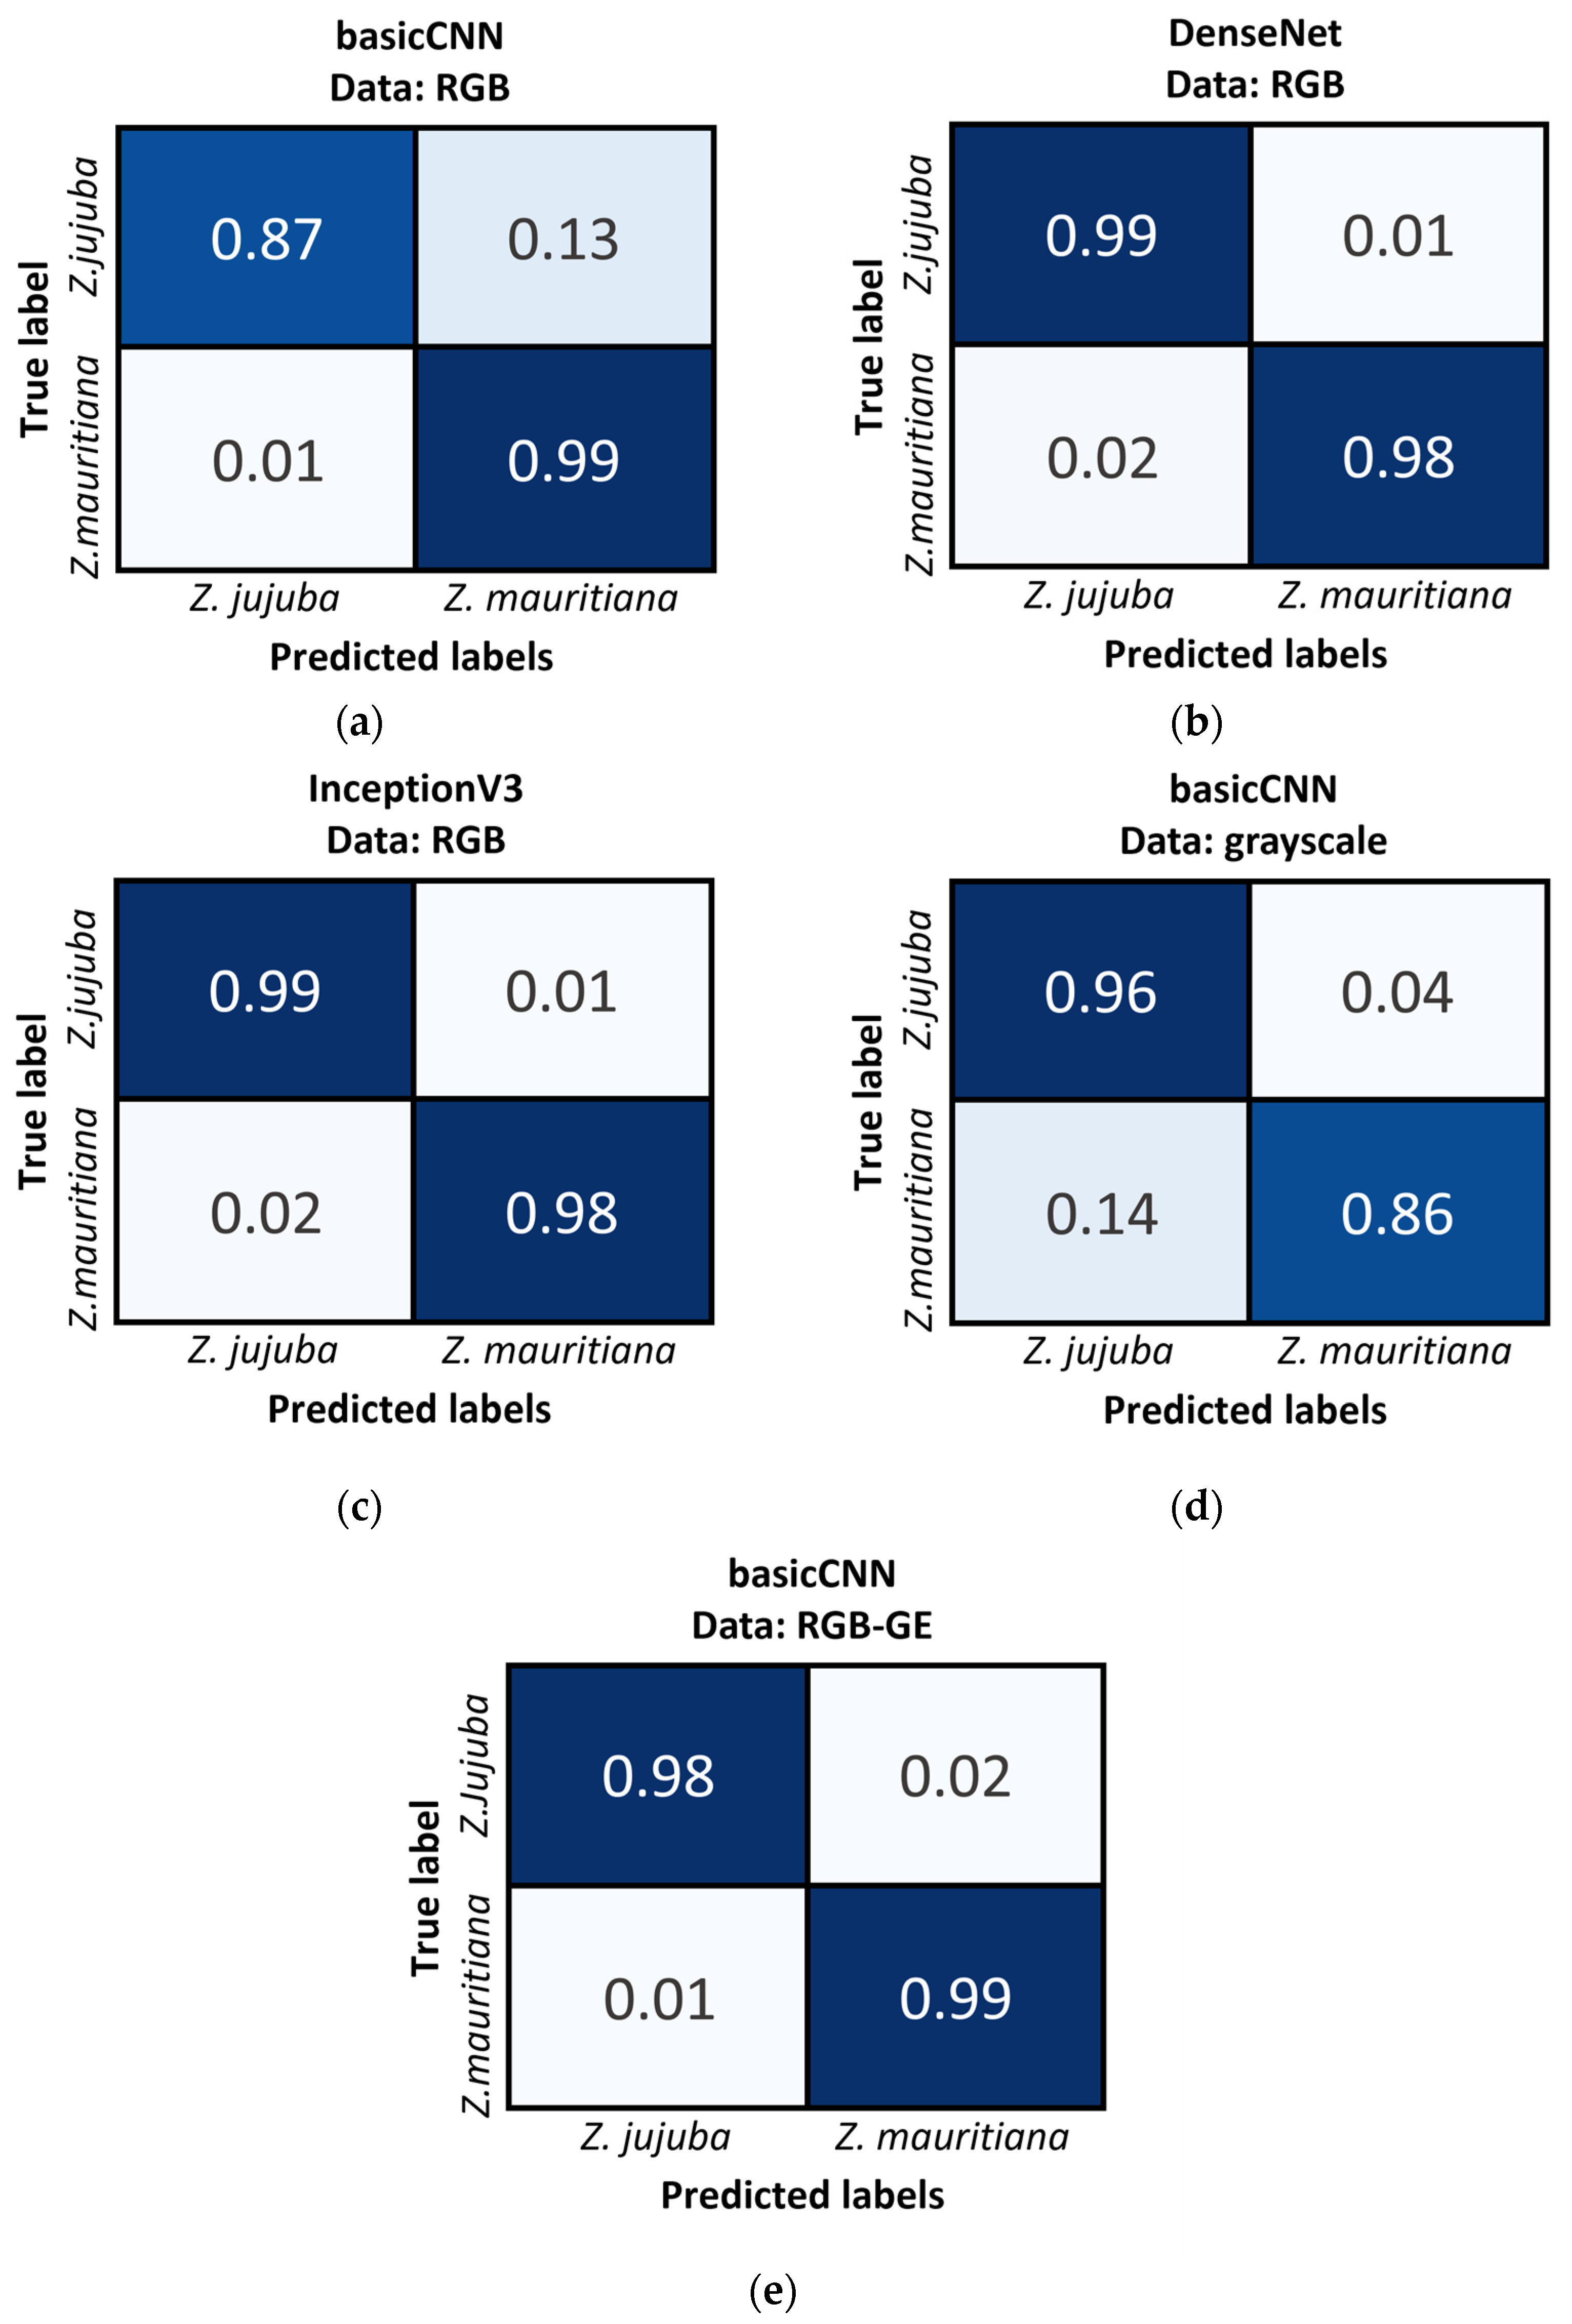
Figure 9, the Confusion Matrix results further support these findings. When using basicCNN with RGB data,
Z. jujuba was misclassified as
Z. mauritiana at a rate of 13%, while
Z. mauritiana was misclassified as
Z. jujuba at only 1%. However, with grayscale data, the misclassification rates increased, with
Z. mauritiana misclassified as
Z. jujuba at 14% and
Z. jujuba misclassified as
Z. mauritiana at 4%. These results highlight the importance of color information in distinguishing between the two species, as grayscale data consistently resulted in higher misclassification rates, particularly for
Z. mauritiana.
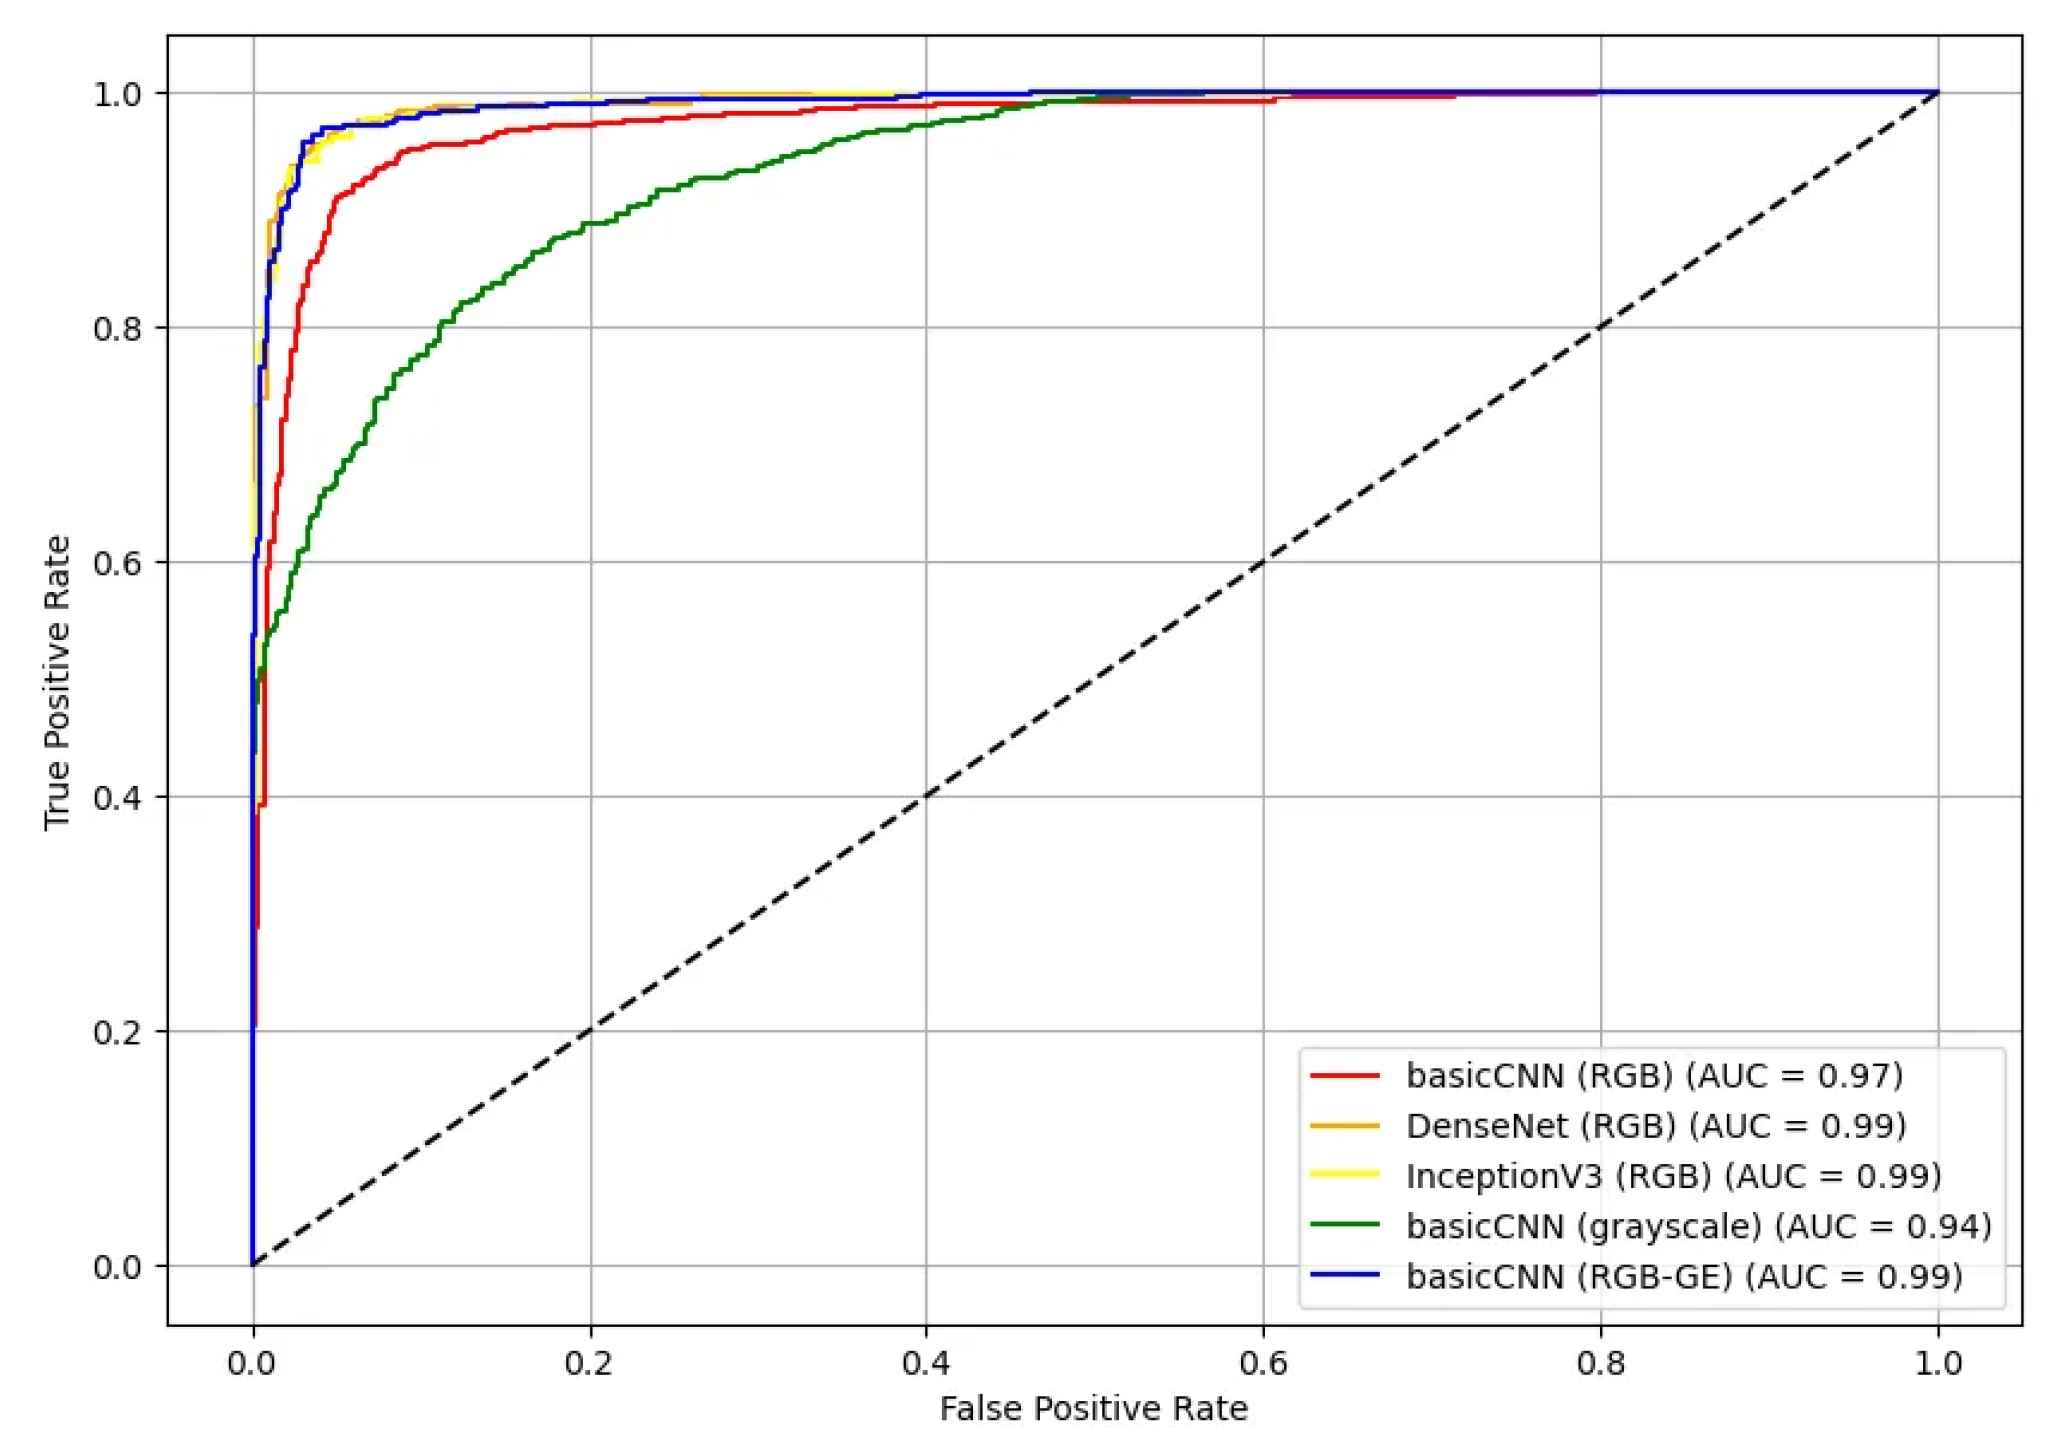
Additionally, the ROC curves and AUC values for the test set were calculated for five different model-dataset combinations (
Figure 10). The ROC curves illustrate the True Positive Rate (TPR) against the False Positive Rate (FPR) for each model, providing an assessment of their classification effectiveness. Most models demonstrated high AUC values, with DenseNet and InceptionV3 achieving the highest AUC of 0.99 for RGB data. The basicCNN model trained on RGB data achieved an AUC of 0.97, while the model trained on grayscale data showed a slightly lower AUC of 0.94. When trained on RGB-GE data, the basicCNN model improved to an AUC of 0.99, achieving performance comparable to that of the more complex pre-trained models.
3.2. Model Parameter, Size, and Inference Time Comparison
The performance comparison of deep learning models, including basicCNN, DenseNet, and InceptionV3, was extended to assess model size and computational efficiency. The total number of parameters, parameter size, model size, and inference time (on both the GPU server and the Orin platform) were measured for each model-data combination, with results summarized in
Table 4. The basicCNN model was evaluated using grayscale, RGB, and RGB-GE input data, while DenseNet and InceptionV3 models were evaluated using RGB input data for comparison.
In terms of total parameters, the basicCNN model with grayscale input had the smallest parameter count at 457,666. While the RGB and RGB-GE versions of basicCNN showed slightly higher parameter counts, the difference remained minimal, with a maximum increase of 2304. In contrast, DenseNet and InceptionV3 had significantly larger parameter counts, with 7,093,554 and 55,357,986 parameters, respectively. This substantial increase can be attributed to their architectural characteristics. DenseNet employs Dense Blocks, which facilitate feature reuse through extensive layer connections, while InceptionV3 incorporates multiple parallel convolutional filters within its Inception modules, resulting in a higher number of parameters.
Similarly, in terms of model size, the basicCNN model had the smallest capacity, with the RGB-GE version being the largest among the basicCNN variations. However, the difference among the grayscale, RGB, and RGB-GE versions of basicCNN remained minimal. In contrast, DenseNet and InceptionV3 had significantly larger model sizes, reaching approximately 15 times that of basicCNN.
In terms of inference time, the server environment demonstrated substantially faster processing compared to the Orin platform. On the server, DenseNet required the longest processing time at 839.10 ms, followed by InceptionV3 at 621.16 ms. Among the basicCNN models, the RGB-GE variant had an inference time of 144.40 ms, while the RGB model recorded 136.14 ms, and the grayscale model recorded a time of 147.83 ms.
On the Jetson AGX Orin platform, DenseNet and InceptionV3 showed the longest inference times at 4661.98 ms and 4791.05 ms, respectively, while the basicCNN variants maintained relatively fast inference times ranging from 2698.37 ms to 2738.89 ms. Both on the server and Orin platform, the basicCNN models consistently demonstrated more efficient inference performance compared to the deeper and more complex models. These findings suggest that the basicCNN model meets computational efficiency requirements and serves as a lightweight solution, making it an effective choice for on-site processing and deployment in resource-constrained environments.
3.3. Model Interpretability Analysis Using XAI Methods
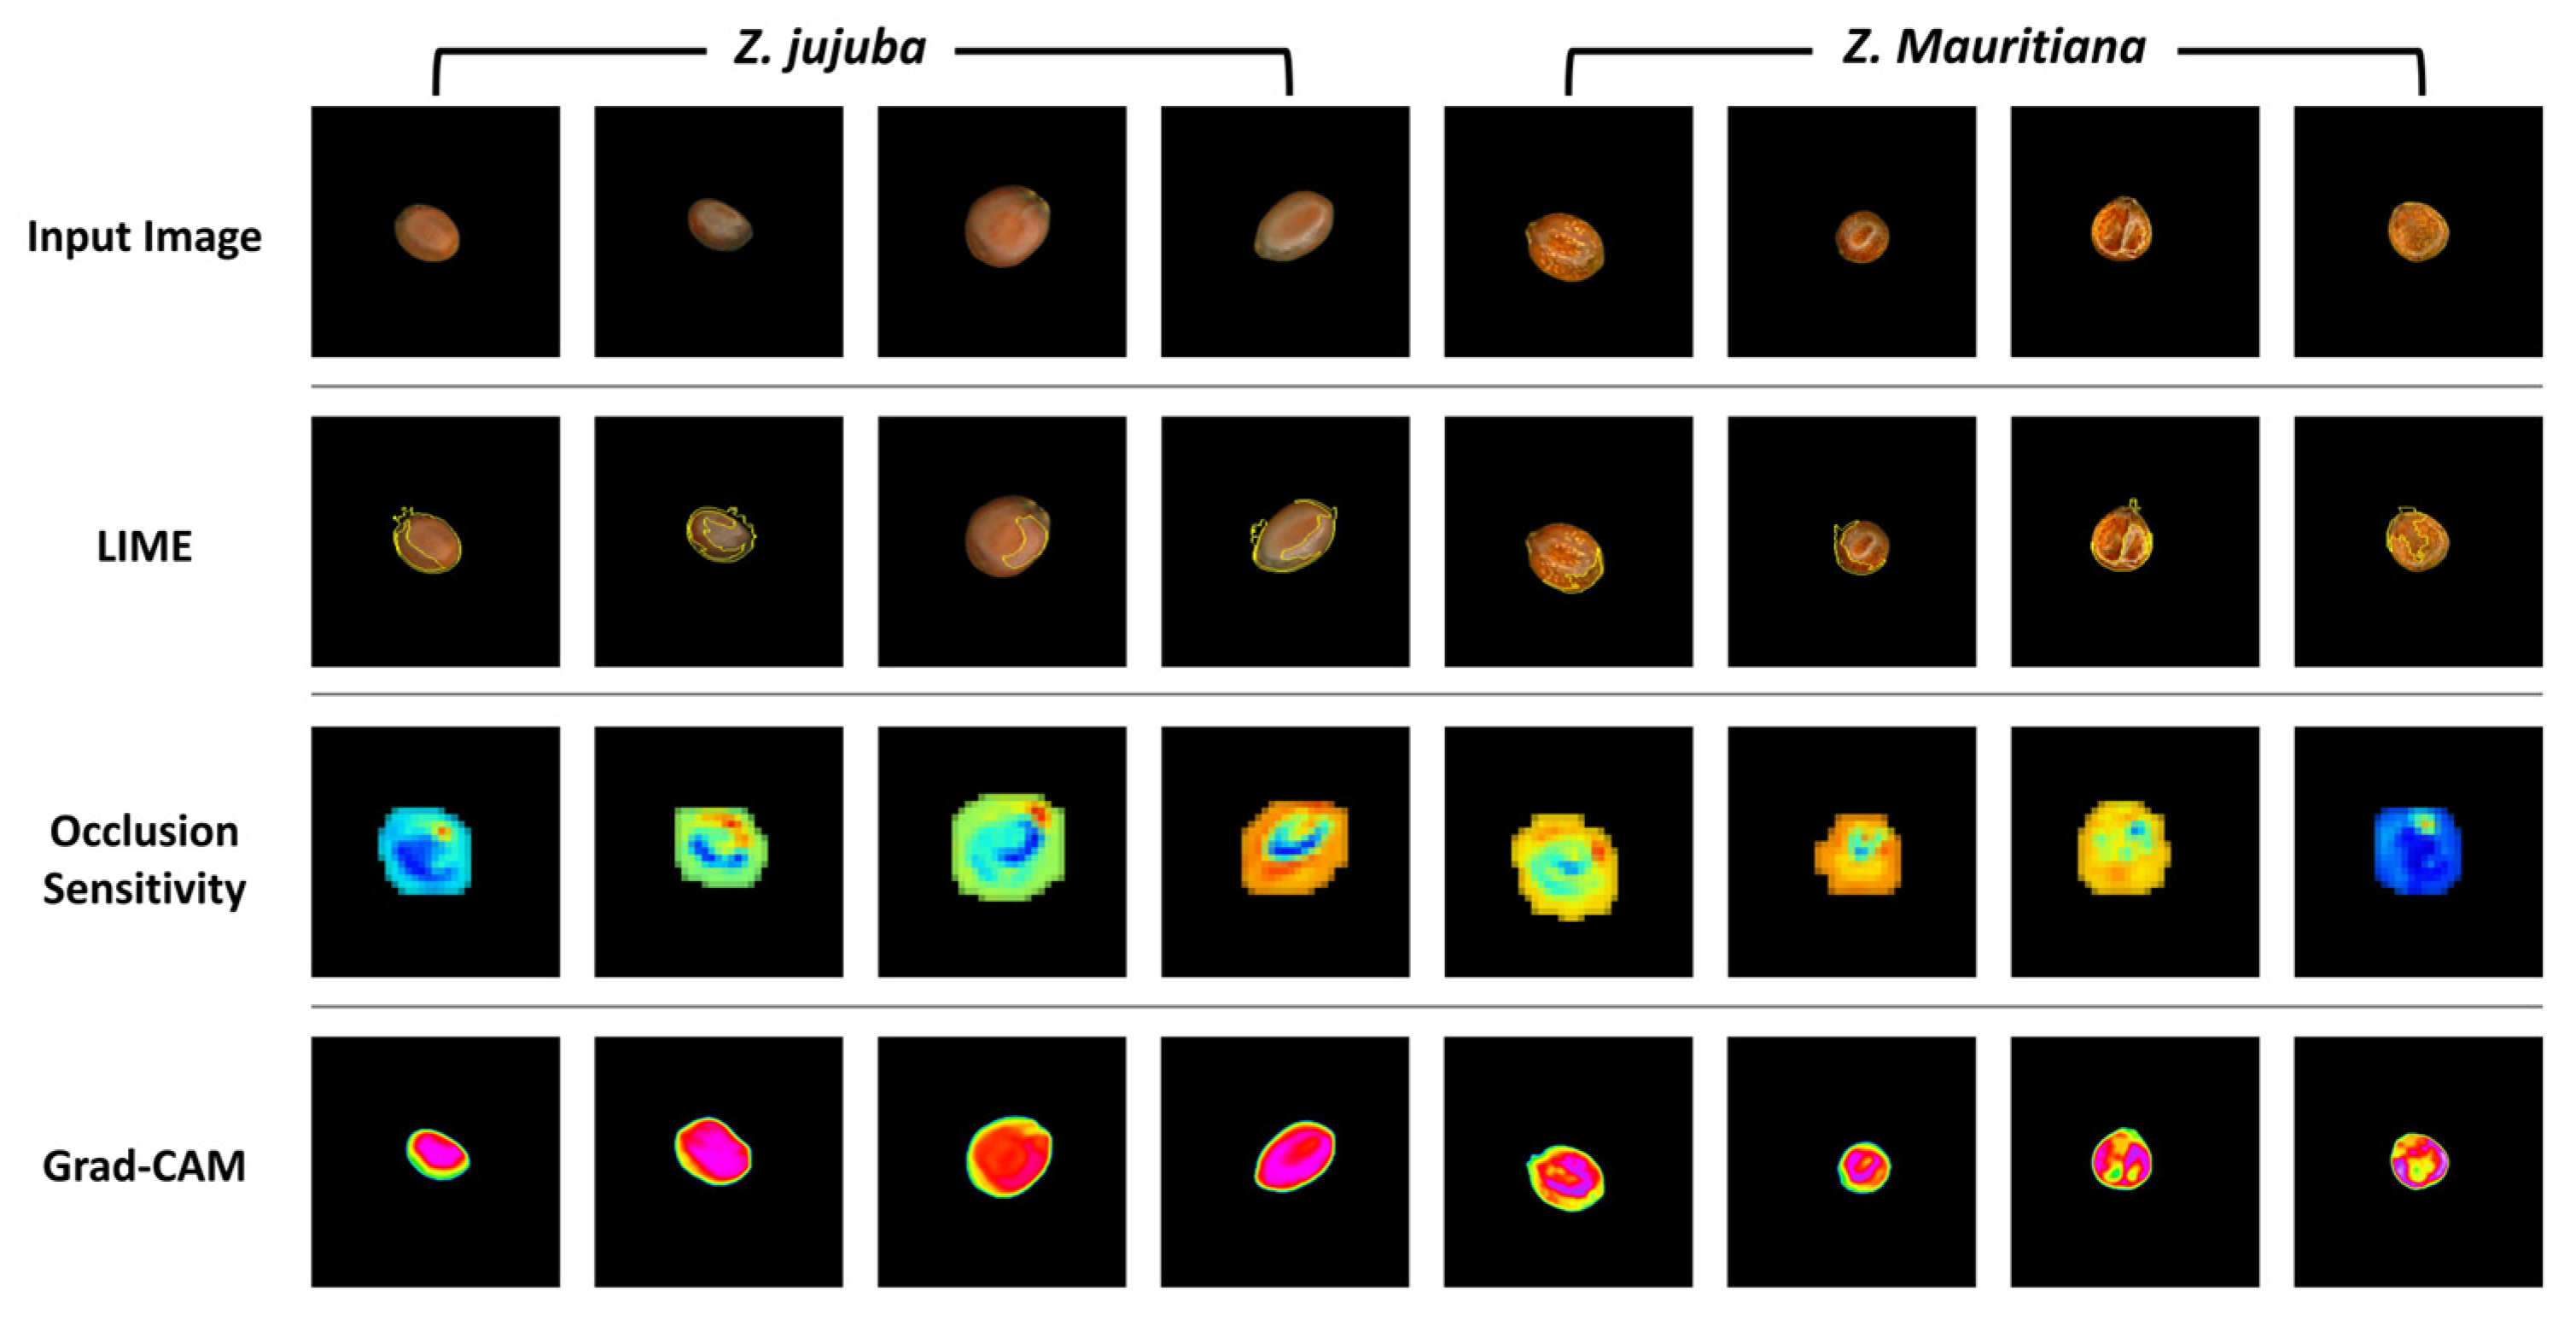
Figure 11 illustrates the comparative results of three XAI visualization techniques applied to
Z. jujuba and
Z. mauritiana samples. While all three methods aim to reveal the model’s focus areas, they demonstrate significant differences in visualization clarity and consistency. The LIME results show inconsistent highlighting of features across samples, with variable superpixel distributions that lack uniformity even within the same species. Similarly, occlusion sensitivity maps display heterogeneous activation patterns with irregular color distributions and inconsistent emphasis on morphological features between samples of the same species. These maps utilize a color spectrum where blue regions indicate areas of highest importance to the model’s predictions, as occluding these sections causes the most significant drops in classification confidence.
In contrast, Grad-CAM visualizations demonstrate remarkable consistency and clarity in highlighting the key distinguishing features. For Z. jujuba, Grad-CAM consistently emphasizes the smooth central region with uniform activation patterns across all samples. For Z. mauritiana, it reliably highlights the irregular central textures that serve as diagnostic features according to sensory evaluation standards. Furthermore, to quantitatively analyze the activation distribution in the central region, the standard deviation was calculated. The results indicated that Z. jujuba had an average standard deviation of 8.93, while Z. mauritiana exhibited a significantly higher average standard deviation of 36.12. These findings confirm that the activation pattern, intensity, and distribution in the central region of the Grad-CAM heatmap differ significantly between Z. jujuba and Z. mauritiana.
3.4. Development of the On-Site Classifier Program
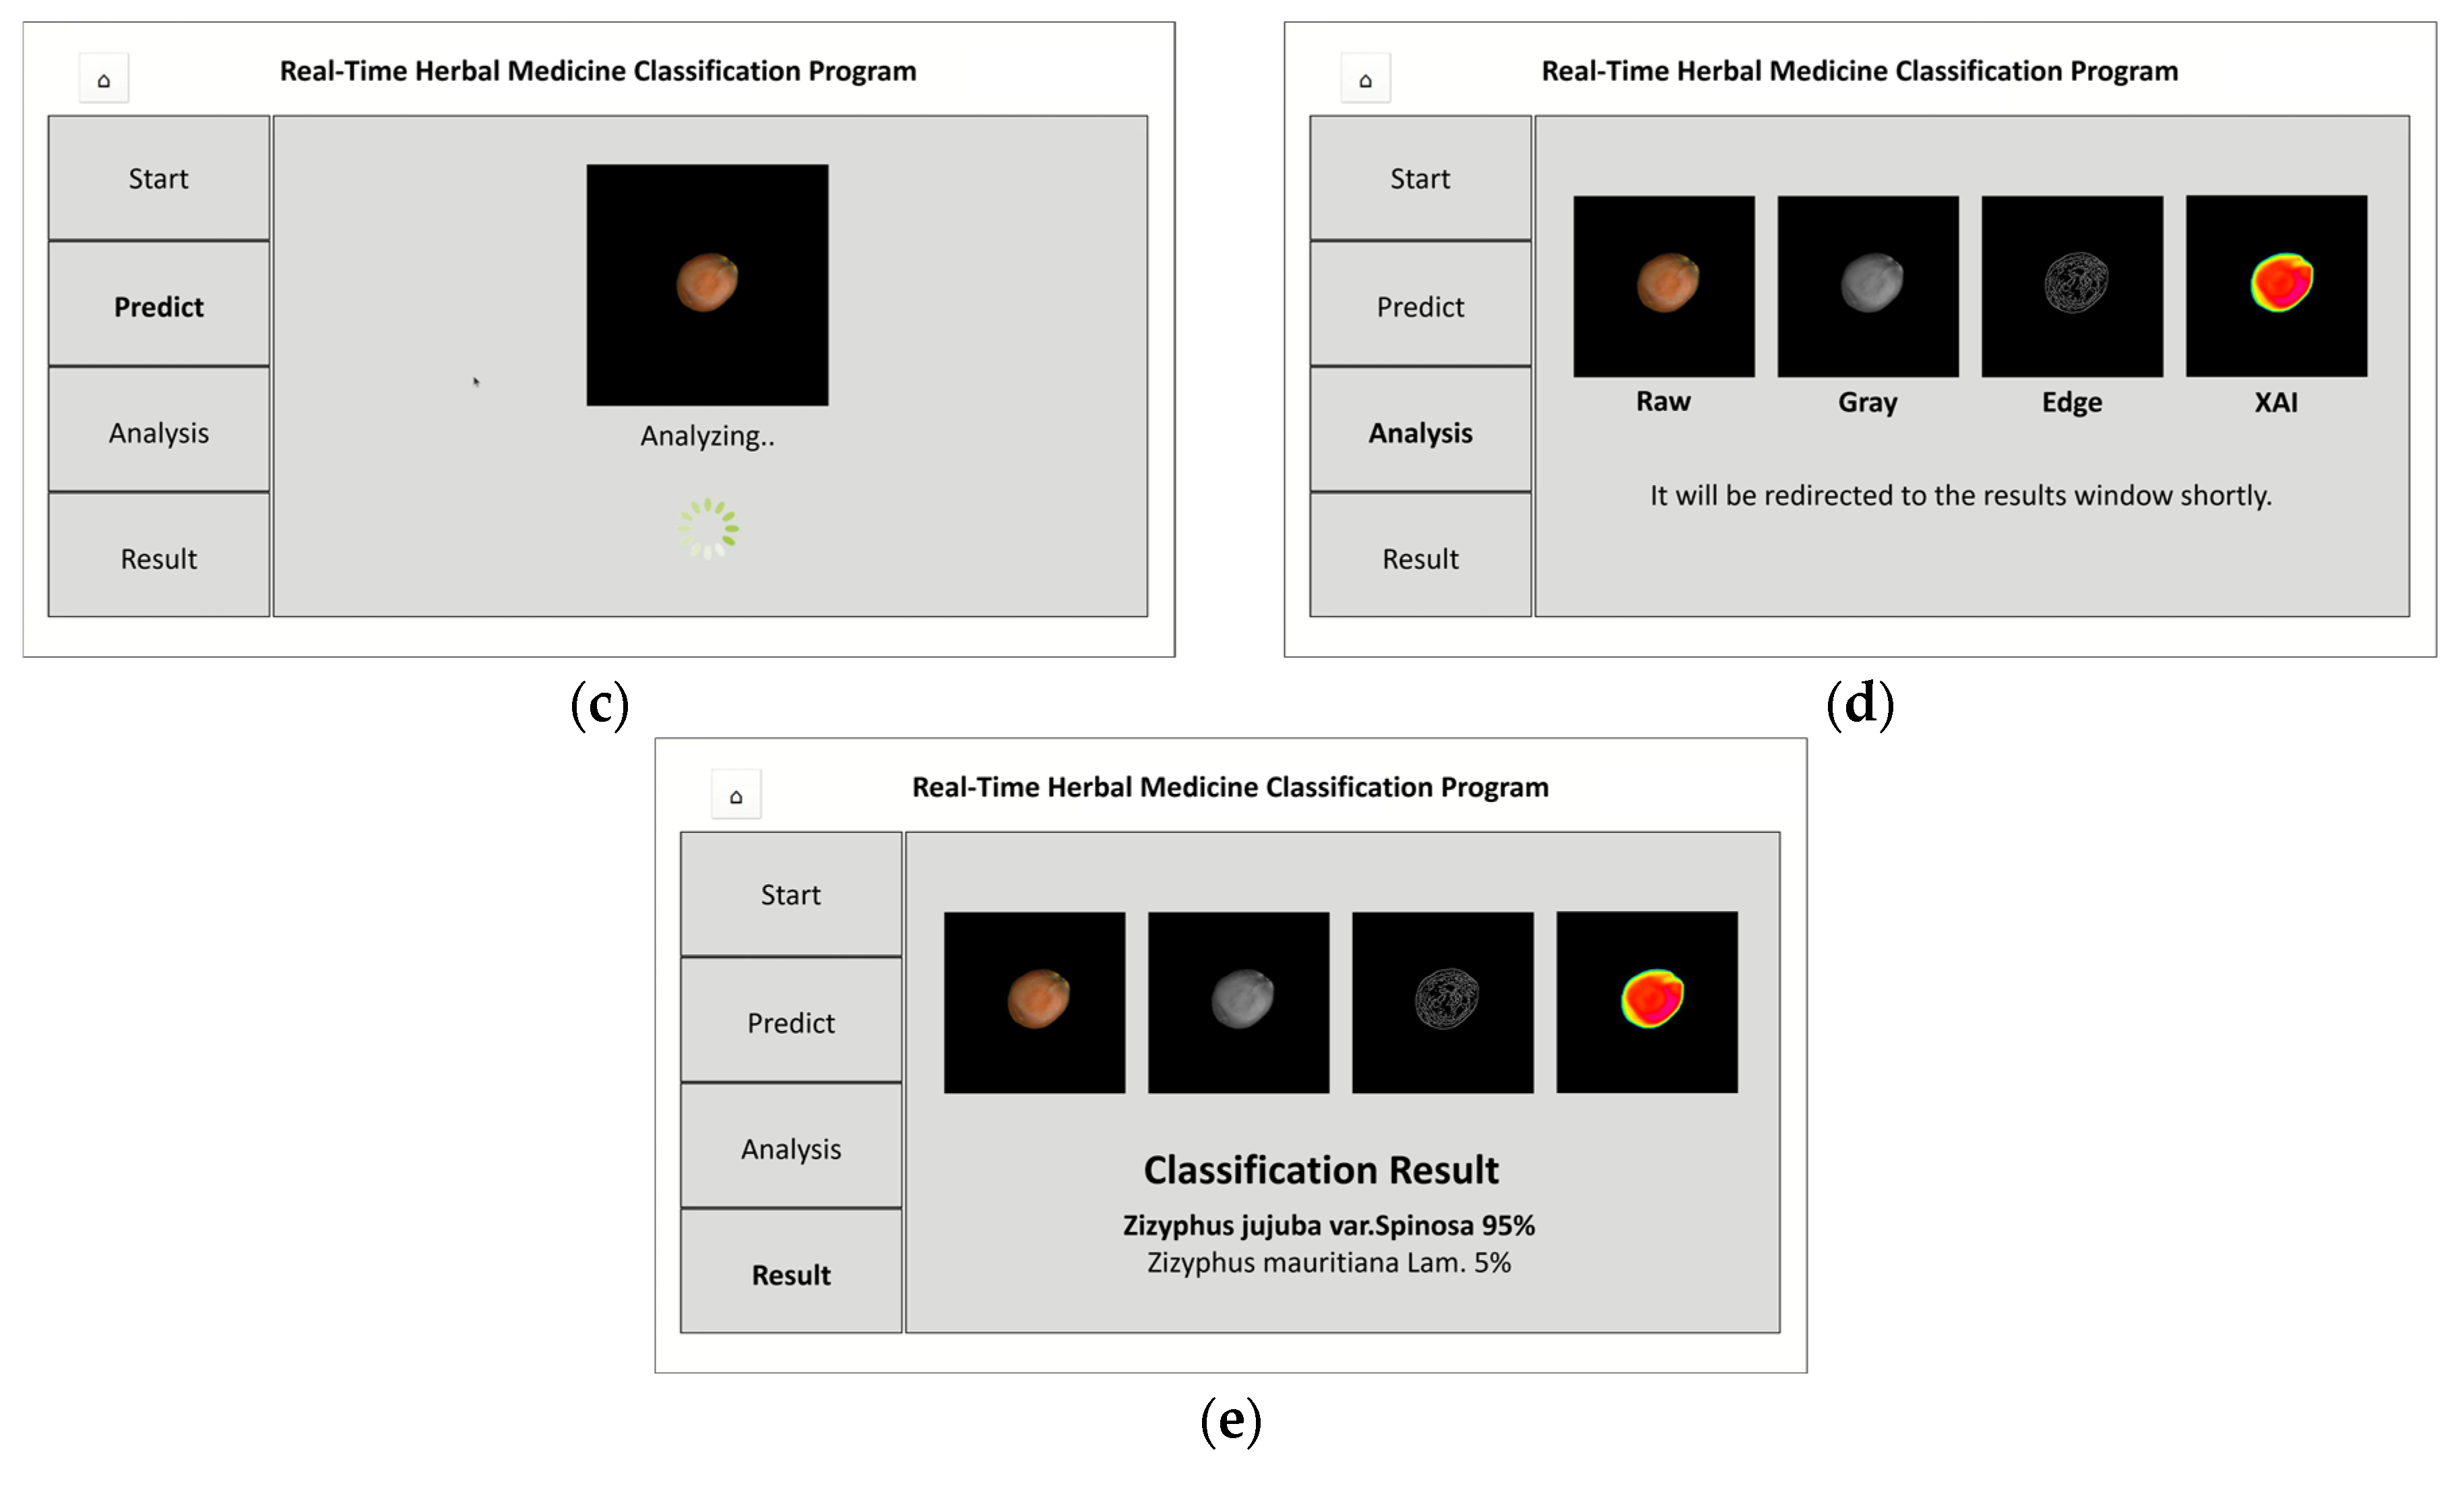
The on-site herbal medicine classification program (
Figure 12), developed using PyQt, features a user-friendly interface and follows a step-by-step classification process. The program operates as follows:
(a) Initial Screen: Upon launching, a message prompts users to press <Start>
(b) Image Capture Screen: Camera activates, allowing users to capture and confirm sample images
(c) Analysis Processing Screen: Captured image undergoes preprocessing and model analysis
(d) Intermediate Result Visualization Screen: Displays RGB, grayscale, edge-detected images, and Grad-CAM heatmap
(e) Final Classification Result Screen: Shows classification result with confidence scores for Z. jujuba or Z. mauritiana
This system enables users to verify classification results while gaining insight into the model’s decision-making process.
4. Discussion
Z. jujuba is a therapeutically significant and economically valuable medicinal herb. Despite its importance, accurate identification is often compromised due to its morphological and color similarities with Z. mauritiana, requiring specialized taxonomic expertise for reliable differentiation. This research focused on developing a specialized classification model for distinguishing morphologically similar Zizyphus species that present identification challenges. Moreover, it emphasized developing an on-site authentication system to address the increasing distribution of counterfeit products resulting from the declining number of experts. By modifying data formats and employing various deep learning models, the study achieved a maximum classification accuracy of 98.55% in distinguishing between Z. jujuba and Z. mauritiana.
To develop a reliable classification model for Z. jujuba and Z. mauritiana, we conducted experiments using basicCNN, DenseNet, and InceptionV3. The results showed that all models achieved an accuracy of over 90% across different input types, including grayscale, RGB, and RGB-GE. Interestingly, even when trained on grayscale images, the model achieved an accuracy of 90.73%, demonstrating deep learning models’ capability to extract meaningful features beyond color information.
The maximum accuracy of 98.55% achieved in this study represents a significant improvement over prior investigations in the field. Previous research employing EfficientNetB4 architecture for herbal medicine image classification reported 92.5% accuracy [
16], while our findings surpass the 94.25% accuracy achieved in previous
Zizyphus origin classification research utilizing CNN-based analysis of near-infrared spectroscopy data [
38]. Similarly, our approach outperforms the 90.2% accuracy reported in a study implementing CNN analysis of hyperspectral imaging data for the identification of five geographical origins of
Zizyphus [
39].
One key finding of this study was the comparison between the basicCNN model and pre-trained deep learning architectures such as DenseNet and InceptionV3. While CNN architecture primarily extracts and learns various features from RGB images, our approach specifically incorporated grayscale and edge-detection channels to develop a classification model specialized for distinguishing Z. jujuba and Z. mauritiana. This strategy effectively addressed the challenges posed by the small size of Zizyphus species and their reliance on color-based differentiation.
Although the accuracy of the basicCNN trained on RGB data was relatively lower at 92.91%, incorporating grayscale and edge-detection features in RGB-GE data increased accuracy to 98.36%, bringing it close to the 98.55% accuracy of the more complex pre-trained models. These results demonstrate that strategic preprocessing techniques can significantly enhance classification performance even without utilizing pre-trained model weights. Our methodology successfully transformed standard RGB data into feature-enriched RGB-GE data, achieving substantially improved accuracy with minimal computational overhead. Such innovation addresses a critical research objective: enhancing classification performance without requiring expensive equipment or additional spectral channels that are often cost-prohibitive. The validation of our hypothesis that intelligent preprocessing can effectively compensate for hardware limitations offers a practical and economical solution for high-accuracy classification tasks in resource-constrained environments.
Computational efficiency analysis revealed that the basicCNN model trained with RGB-GE data not only achieved performance comparable to complex architectures but also offered significant practical advantages. With a substantially lower parameter count and reduced model size compared to DenseNet and InceptionV3, the basicCNN model achieved an 80% reduction in inference time, making it ideally suited for on-site authentication and deployment in resource-constrained environments.
When considering herbal medicine distribution, preventing counterfeit products from entering the market requires careful attention to the recall values for Z. mauritiana. The basicCNN model using RGB data and RGB-GE data recorded the highest recall values at 0.9891 and 0.9854, respectively. Despite achieving high recall, the precision was relatively low at 0.8831 when using RGB data, but significantly improved to 0.9819 with RGB-GE data. Such improvement suggests that the model utilizing RGB-GE data possesses both the ability to distinguish counterfeit products and correctly classify authentic specimens.
Our comparative analysis of XAI techniques revealed that Grad-CAM produced explanations most closely resembling traditional herbal medicine evaluation patterns, demonstrating superior alignment with sensory evaluation manuals compared to LIME and Occlusion sensitivity methods. Through Grad-CAM visualization, we observed that Z. jujuba was classified based on its smooth surface, whereas Z. mauritiana was identified by its irregular central surface patterns. These observations align with established sensory evaluation manuals, which describe Z. jujuba as having a smooth, glossy surface with a yellow-brown to reddish-brown color, while Z. mauritiana exhibits a yellow-brown surface, a flattened circular shape, and no ridges. The correlation between XAI visualizations and expert-based classification criteria suggests that deep learning models can replicate human-expert decision patterns, thus enhancing credibility and trust in AI-driven classification systems.
Practical implementation of the basicCNN model on a portable classification device demonstrated a classification response time of 23.01 s from image capture to result display. The rapid execution speed highlights the system’s practical application in real-world herbal medicine distribution contexts, where fast and accurate classification is essential.
For developing AI with advanced explanatory power, integrating Large Language Models (LLMs) with domain-specific data could further enhance the usability of this authentication system [
40]. By connecting the image classification system with an LLM, the model could not only classify
Z. jujuba and
Z. mauritiana but also generate textual explanations describing the basis of its decisions. Such capability would allow the system to provide detailed reasoning, such as highlighting specific morphological patterns or surface characteristics that influenced the classification outcome. Future work incorporating LLM-based reasoning could contribute to the development of a more user-friendly authentication system, making on-site identification more accessible to non-experts.
Despite these promising results, we must acknowledge certain limitations of the current approach. While this study demonstrates accurate classification of Z. jujuba and Z. mauritiana under controlled conditions, the portable equipment used for data collection maintained consistent imaging parameters (top-view perspective, lighting conditions, camera specifications, background). In this controlled environment, the need for data augmentation techniques was minimized.
Significant challenges remain, however, for real-world implementation across variable conditions. For classification in dynamic environments, such as using smartphone cameras in uncontrolled settings, several additional considerations become necessary. Future research should focus on collecting diverse datasets across varying environmental conditions and implementing robust data augmentation strategies to enhance model generalization. Color calibration techniques would be essential to account for variability in color representation across different imaging devices, which could significantly impact classification accuracy when color features are utilized. These enhancements would be critical steps toward developing a more versatile and accessible system for herbal medicine authentication that can function reliably across a wider range of practical settings.
Looking ahead, we plan to expand on the current research as the DenseNet and InceptionV3 models used in this study were pre-trained on RGB data, limiting our ability to apply modified data formats to these architectures. Our future work will focus on designing and developing sophisticated yet lightweight 5-channel-based model structures. Through this approach, we aim to overcome the relatively long inference times on mobile platforms and build a system optimized for field applications.
5. Conclusions
This study successfully developed an on-site herbal medicine classification system to address the challenge of distinguishing between morphologically similar Z. jujuba and Z. mauritiana species. By integrating RGB data with grayscale and edge detection features to create RGB-GE datasets, we achieved significant improvements in classification accuracy while maintaining computational efficiency.
The proposed basicCNN model trained on RGB-GE data achieved 98.36% accuracy, comparable to the 98.55% accuracy of more complex pre-trained models like DenseNet and InceptionV3, while requiring substantially fewer parameters and reduced computational resources. Importantly, the model achieved high recall (0.9854) and precision (0.9819) for Z. mauritiana, enabling reliable counterfeit detection in herbal medicine distribution. This demonstrates that strategic preprocessing techniques can significantly enhance classification performance without necessitating computationally expensive architectures, offering a practical solution for resource-constrained environments.
Our comparative analysis of XAI techniques revealed that Grad-CAM visualizations aligned closely with traditional herbal medicine evaluation patterns. The model accurately identified the smooth central region of Z. jujuba and the irregular surface patterns of Z. mauritiana, confirming that its classification decisions were based on the same morphological features used by human experts. This transparency enhances trust in the system and validates its decision-making process against established sensory evaluation criteria.
The deployed classification system on a portable platform demonstrated practical response times of 23.01 s from image capture to result display, making it suitable for real-world applications in herbal medicine distribution settings. With the declining number of expert herbalists, this system represents a valuable tool for maintaining quality control and preventing counterfeit products from entering the market.
While our approach achieved excellent performance under controlled conditions, we acknowledge that several challenges remain for implementation across variable environments. Future research directions include collecting diverse datasets across varying conditions, implementing robust data augmentation strategies, and incorporating color calibration techniques to account for variability in imaging devices. Additionally, integrating Large Language Models with our classification system could provide detailed textual explanations of classification decisions, further enhancing system usability for non-experts.
This research contributes to the field of herbal medicine authentication by demonstrating that properly designed deep learning systems can effectively replicate expert decision-making patterns while offering advantages in accessibility, consistency, and throughput. The proposed approach balances high accuracy with practical deployment considerations, providing a promising solution to ensure the authenticity and quality of herbal medicines in commercial distribution.
