


Abstract
Today, crop suggestions and necessary guidance have become a regular need for a farmer. Farmers generally depend on their local agriculture officers regarding this, and it may be difficult to obtain the right guidance at the right time. Nowadays, crop datasets are available on different websites in the agriculture sector, and they play a crucial role in suggesting suitable crops. So, a decision support system that analyzes the crop dataset using machine learning techniques can assist farmers in making better choices regarding crop selections. The main objective of this research is to provide quick guidance to farmers with more accurate and effective crop recommendations by utilizing machine learning methods, global positioning system coordinates, and crop cloud data. Here, the recommendation can be more personalized, which enables the farmers to predict crops in their specific geographical context, taking into account factors like climate, soil composition, water availability, and local conditions. In this regard, an existing historical crop dataset that contains the state, district, year, area-wise production rate, crop name, and season was collected for 246,091 sample records from the Dataworld website, which holds data on 37 different crops from different areas of India. Also, for better analysis, a dataset was collected from the agriculture offices of the Rayagada, Koraput, and Gajapati districts in Odisha state, India. Both of these datasets were combined and stored using a Firebase cloud service. Thirteen different machine learning algorithms have been applied to the dataset to identify dependencies within the data. To facilitate this process, an Android application was developed using Android Studio (Electric Eel | 2023.1.1) Emulator (Version 32.1.14), Software Development Kit (SDK, Android SDK 33), and Tools. A model has been proposed that implements the SMOTE (Synthetic Minority Oversampling Technique) to balance the dataset, and then it allows for the implementation of 13 different classifiers, such as logistic regression, decision tree (DT), K-Nearest Neighbor (KNN), SVC (Support Vector Classifier), random forest (RF), Gradient Boost (GB), Bagged Tree, extreme gradient boosting (XGB classifier), Ada Boost Classifier, Cat Boost, HGB (Histogram-based Gradient Boosting), SGDC (Stochastic Gradient Descent), and MNB (Multinomial Naive Bayes) on the cloud dataset. It is observed that the performance of the SGDC method is 1.00 in accuracy, precision, recall, F1-score, and ROC AUC (Receiver Operating Characteristics–Area Under the Curve) and is 0.91 in sensitivity and 0.54 in specificity after applying the SMOTE. Overall, SGDC has a better performance compared to all other classifiers implemented in the predictions.
1. Introduction
In the agriculture sector, a lot of revolutionary changes have been observed in the present scenario. Different technologies and tools, such as sensory technologies, drones, smart irrigation systems, satellite image analysis, etc., are being used in farming for the enhancement of crop production. Here, the selection of a crop for the land plays an important role in farming. Liakos, K. G. et al. [1] performed an extensive review of crop recommendations and productions based on soil and water management. It has been observed that crop selection is an important factor in increasing crop yield and reducing the risk of crop loss, and the efficient use of resources like water, pesticides, and fertilizers leads to a better agricultural outcome. New farmers mainly take opinions from fellow experienced local farmers for crop selection. However, they may be misled due to human errors and their relationships with others. So, the new farmers may obtain lots of confusing information on crop selection, estimating the crop production and their profits. This motivated us to believe that handy and appropriate guidance could be provided to the new farmers using an application. If there is heavy production of a particular crop, then it may lead to losses during its sales. The objective of this research is to identify and recommend crops that are not only more suitable for optimal production but also have higher market values.
Doshi, Z. et al. [2] discussed identifying suitable crops based on the season, geographical location, and soil mineral properties. So, we have analyzed area-wise and season-wise crop production datasets so that suitable crops can be listed for a specific season and a particular land. Vaishnavi, S. et al. [3] analyzed crop datasets based on season and productivity. So, we collected datasets from different sources, such as Indian agriculture websites, based on these factors. Again, a data collection process was also conducted through interactions with experienced farmers based on their crop cultivation plans. The locally collected data were combined with the cloud dataset in a balanced way. Then, this dataset was analyzed for crop recommendations by applying suitable machine learning methods. These algorithms are used to help farmers make decisions, which will improve agriculture’s sustainability and profitability.
- Contribution:
The major contributions of this paper are as follows:
- Analyzing the area-wise crop data for the Odisha state of India;
- Implementing 13 different classifiers and evaluating them using the SMOTE;
- Identifying the best classifier SGDC and prediction of suitable crops.
The rest of the paper is structured as follows. Section 2 contains a review of different advancements and techniques used for improving crop productions and their comparative analysis; Section 3 presents the details of the materials and methods implemented, the proposed model, and the process of execution; Section 4 shows the experimental results; and finally, Section 5 explains the conclusions and future work concisely.
2. Advancements and Techniques Used for Improving Crop Production
A brief study on the different approaches of decision support systems for predicting crop suitability has been conducted. Many implementations are based on existing crop mineral datasets, satellite image analyses, and real-time data analyses using sensors, Wi-Fi, and drone technologies. Mainly, the recommendation is based on historical crop and soil mineral data.
Satish Babu et al. [4] elaborated on the development of the agriculture sector at a large scale in rich countries based on crop and soil parameters. In Kerala, India, to support small and marginal farmers. the soil crop databases collected from cultivation fields and crop calendars were prepared. This was achieved using different electronic devices for the reduction of agricultural expenses. R. Balamurali et al. [5] collected soil–weather parameters, such as temperature, humidity, Potential of Hydrogen (pH value), and NPK (Nitrogen, Phosphorus, and Potassium) values using real-time observations over time. The authors used a wireless sensor network and remote server for data collection and analysis and concluded that the performance of the Medium Access Control (MAC) and routing algorithm approach is the best. Fonthal, F. et al. [6] suggested a model that contains networking and sensors to collect the environmental conditions of fields cultivated with white cabbage crops. It helps the farmer monitor the environmental needs and reduces the losses in farming. Gábor Gyarmati et al. [7] performed a brief study on precision agriculture, which can solve food problems and reduce labor costs. The authors explained leads taken in precision farming to handle the day-to-day challenges of pollution and climate change. Palazzi, V. et al. [8] suggested collecting the leaf temperature and water needs using the sensor. It allows for better farming by identifying the season-wise crop suitability and its needs. The authors discussed Radio Frequency Identification (RFID)-based sensors and EM4325 ultra-high-frequency (UHF) chip utilization in the research. Yongsheng Wang et al. [9] suggested different tools for improving crop production. They applied different tools like Physical Layer Signaling (PLS), Packet Switching (PS), and Connectionless Mode Service (CLS) for crop production. It has been observed that the precision seeding of PLS is better in improving crop production. Dholu et al. [10] describe how the Internet of Things (IoT) connects various devices such as mobiles, tablets, and personal computers through machine-to-machine communication. They emphasize that IoT enhances precision agriculture by optimizing the use of resources like pesticides, light, and water, thereby increasing production efficiency and reducing waste.
O. Palagin et al. [11] explained the flora test to obtain information about the state of plants, and then they discussed the two different types of data acquisition systems, which depend on portable devices that are helpful in precision agriculture for controlling and monitoring the growth of crops, the usage of water to crops, and managing the pesticides to crops so that farmer can obtain more production using precision agriculture. Jitendra Patidar et al. [12] discuss how traditional agriculture methods are currently used in India and suggest that precision agriculture can replace these methods. Their work indicates that farmers can grow various crops more effectively with precision agriculture. Vandana B et al. [13] explained that the agriculture field in the Indian agriculture farming industry adapts less innovative technology compared to other industries. In precision agriculture, if we adapt communication and information technologies, which can easily provide less cost-effective methods and can be helpful for smart agriculture, in this work, they prepared a model for agriculture farming that can guide the farmers performing their farming in rural and urban areas so that the production of crop yield increase rapidly, which improves their profits about the farmer’s production rate. Xiaoshan Wang et al. [14] discussed the design and understanding of precision agriculture systems depending on 5S technology. Precision agriculture leads to the overall development of agriculture, like the utilization of resources and fertilizer without wastage. In proper times, we have to use them, and requirements that are needed by crops should be provided so that the production rate will increase, which can benefit the farmers compared to traditional farming. So, smart farming can replace traditional farming, which will improve the production rate of crops; ultimately, a farmer will obtain benefits using precision agriculture.
Ranaweera et al. [15] focused on finding the crop price based on fuel price, crop production, rainfall, and temperature. The authors considered four major crop data for analysis. Machine learning methods have been applied, and the root mean square is chosen as the measuring parameter. It has been observed that the tree-based models forecast better than others. Bondre, D. A. et al. [16] used a previous dataset for crop yield estimation. The SVC and RF are chosen for identifying crops and recommending their fertilizer needs. Crop data over the last five years were collected from different sources and analyzed. The soil classification, yield prediction, and fertilizer needs are three steps that have been proposed to implement. Thilakarathne, N. N. et al. [17] suggested a crop recommendation platform using cloud services. To find the best recommended details, KNN, DT, RF, XG-Boost, and SVC were applied. The experimental results have been analyzed based on accuracy, precision, recall, and F1-score. Here, the dataset has 2200 records that contain the soil and weather parameters such as temperature, humidity, pH, NPK, and rainfall details. Sonobe, R. et al. [18] presented TerraSAR-X satellite images of crops analyzed using the random forest, classification, and regression tree (CART) methods. Crop classification was applied and, overall, it has been observed that the performance of RF is better compared to CART. Priyadharshini, A. et al. [19] proposed a system for crop suggestions to farmers based on soil parameters and season. Data analysis has been conducted using linear regression, a neural network, KNN, Naive Bayes (NB), and SVC and compared based on their performances, out of which neural networks have the highest of 89.88% accuracy. Rajković, D. et al. [20] applied the ANN and random forest regression (RFR) tools for crop yield prediction. The data on 4 years on winter rapeseeds from Serbia has been used for analysis using both methods, out of which the prediction capability of the RFR is better than the other. A high correlation between oil and seed crops has been observed. Bhattacharyya, D. et al. [21] proposed an ensemble model by integrating Generalized Poisson Models (GPMs), CNNs, and SVCs for analyzing sugarcane production. A benchmark Godavari dataset of 5 years was used for analysis. It is observed that the CNN obtained the highest accuracy of 89.53%. Rajak, R. K. et al. [22] performed an ensemble of the SVC and ANN, and by applying majority voting, the recommendation is obtained. It has higher accuracy compared to the SVC and ANN. The dataset collected from the polytest laboratories of Maharashtra had a variety of crops such as cotton, ground nut, banana, paddy, sugar cane, coriander, etc. Keerthana, M. et al. [23] used 28,242 instances with a 7-feature dataset. The climate condition, rainfall, and crop type are important parameters for the dataset used. Different ensemble approaches were applied from prediction, out of which the Ada Boost Regressor with a decision tree had the highest accuracy of 95.7%.
Panigrahi, B. et al. [24] conducted a study on maize, groundnut, and Bengal gram crops in Telangana state. The dataset from the Information Technology, Electronics, and Communications Department (ITE&C) was analyzed. A dataset of different weather throughout the year has been used. Different machine learning algorithms were applied and verified based on the mean absolute error (MAE), mean squared error (MSE), coefficient of determination (R2 score), and cross-validation. The RFR has a higher accuracy compared to other approaches. Garg, D. et al. [25] suggested a hybrid method combining a grid search and wrapper feature selection for crop recommendation. Its performance is compared with the C4.5 decision tree and achieves the highest accuracy of 99.31%. The main aim is to assist farmers in crop selection and increase crop yield. Shankar, P. et al. [26] conducted a comprehensive study on rainfall, soil condition, and climate using machine learning. The implementation of RF, SVC, DT, and logistic regression has been performed to predict relevant plants. The relevant crop data collected from data.gov.in and Kaggle were analyzed using machine learning methods. Escorcia-Gutierrez, J. et al. [27] evaluate nutrient levels of soil and identify the nutrient requirements for the crop recommended. They proposed a model that implements deep learning techniques along with the voting ensemble technique for nutrient classification, which shows better performance with an accuracy of 0.928. Pandey, V. et al. [28] used satellite data from the Ujjain district, Madhya Pradesh, and applied RF, Naïve Bayes (NB), and ensemble techniques to analyze different classes of crops. A ground study has been conducted in three different intervals of a crop such as early wheat, mid wheat, and late wheat. It is seen that the RF algorithm implementation of images and its performance is better than others for satellite image data classification. Dhanavel, S. et al. [29] collected a detailed soil mineral dataset with 12 different parameters from Kaggle and analyzed it using machine learning and artificial intelligence (AI) techniques. Seven different techniques such as logistic, Hoeffding Tree, Random Tree, random forest, Repeated Incremental Pruning Tree (REP Tree), and Multilayer Perceptron were applied and analyzed for different performance analysis metrics on crop recommendation. Reddy, J. et al. [30] implemented an ensemble of different techniques to recommend crops for better decision making in the selection of crops for cultivation. The RF, DT, and SVC implemented on the Felin dataset, thereby applying the voting classifier and improvised results, shall be obtained. The performance measurement is analyzed based on accuracy, kappa score, and log loss values. Sharma, N. et al. [31] implemented regression models for predicting the production rate of crops in different areas of northeast India. The R2 score, root mean squared error (RMSE), coefficients of variation (CVs), and MAE are verified to identify the suitable prediction model. It predicts the top five crops with the highest average yield and is further analyzed for the most profitable crop. Gosai, D. et al. [32] focused on sensory-based soil testing to reduce soil degradation. Different machine learning algorithms implemented crop recommendation, in which XGBoost had the highest accuracy of 99.31%. Bandara, P. et al. [33] proposed an Arduino controller sensory system to collect soil and weather details and recommend crops in Srilankan cultivation lands. Machine learning techniques applied for crop selection had a high accuracy on a dataset collected from the Agriculture dept. of Sri Lanka.
Dubey, D. et al. [34] provided a proposal for an agricultural recommendation system, which is given for a reduced loss. The dataset was collected from different districts of Madhya Pradesh on crop production, rainfall, and soil type. Machine learning algorithms such as KNN, RF, DT, and logistic regression are applied to find the best recommendations, out of which RF has better accuracy. Sundari, V. et al. [35] used the historical dataset from different regions of Karnataka based on soil weather parameters for analysis. A web page was developed with a pattern-matching approach for recommending crops. A comparative analysis based on accuracy is performed for the two districts dataset of Karnataka, out of which DT has 76.8%. Kedlaya, A. et al. [36] prepared a dataset by combining the collected soil and weather parameters for 20 different crops from the Indian Meteorological Department (IMD), Pune, and Karnataka state. An application was developed to filter the crops using pattern-matching techniques at multiple levels and predict the suitability of crops. Garg, D. et al. [25] proposed a model that applies feature section using the Wrapper method, classification using the partial decision tree algorithm, and hyperparameter tuning using the grid method. Here, the soil features, humidity, and rainfall information of 2200 instances were used for analysis. It is observed that after hyperparameter tuning, an accuracy of 99.31% was obtained. Bhatnagar, K. et al. [37] used a soil crop dataset from Kaggle and applied machine learning algorithms, such as RF and KNN, for classification. A total of 2201 records were used from previous historical data for analysis, and predicted suitable crops based on production, and an accuracy of 99.5 was obtained for the random forest method. Reyana, A. et al. [38] used a machine learning approach such as DT, RF, Hoeffding Tree, and J48 for classification, and different performance metrics such as precision, F-measure, and recall were implemented. Multiple sensors are installed in different areas of agricultural land, and the real-time collected data from sensors are fused for analysis. The result analysis observed that the performance of random forest is higher than other approaches. Eddaoudi, R. et al. [39] suggested a recommendation system using web application implementation for predicting crops using five different machine learning algorithms. The performance of random forest is better than others in prediction with an accuracy of 97.18%, which is applied to a dataset with 1800 entries. Islam, M. R. et al. [40] proposed a machine-learning sensory device for soil nutrient monitoring and analysis. The real-time data are collected using sensors and analyzed to generate recommended crops and assess the device’s capabilities. It has been observed that the Cat Boost classifier, having a 97.5% accuracy, is better than the rest of the applied methods. Bhuyan, S. et al. [41] collected 180 soil samples from specific areas of Assam state and tested the samples to obtain their physical properties. After pre-processing the samples, the data were used for analysis using a decision tree with an accuracy of 94%. Based on water retention capacity, hydraulic conductivity, and particle density, the crops are recommended. Dahiphale, D. et al. [42] used soil and climate data for analysis and predicted the crops for improving yield and profits. DT, RF, KNN, NB, SVC, NN, and logistic regression were applied to a dataset from Kaggle and verified for their performance. A total of 22 different crops were taken as labels for analysis using machine learning methods, and it is observed that the RF and NB were obtained with an accuracy of 99.5%. Durai, S. K. S. et al. [43] focused on guiding individuals in suggesting crops and nutrients needed for their growth. Datasets from Kaggle based on crop and soil were analyzed. A total of 2200 samples with 22 labels were analyzed for attributes such as NPK, pH, and rainfall. Also, weed identification and pest identification have been conducted to take necessary measures. Pande, S. M. et al. [44] conducted research in the Maharashtra and Karnataka region. A mobile application was developed that collects the area and soil type as the input. The SVC, ANN, RF, KNN, and Multiple Linear Regression (MLR) were applied, out of which RF had the best performance with 95% accuracy. Here, based on the global positioning system (GPS), the location has been tracked, which helps identify the rate of rainfall, crop suitability, and fertilizer needs.
Katarya, R. et al. [45] proposed combining the data collection based on a sensory system and historical data. A model was recommended, which was applied with principal component analysis (PCA) and linear discriminant analysis (LDA) for feature extraction and then applied with the ensemble technique, RF, KNN, and the artificial neural network (ANN) method. An ensemble machine learning model was used to analyze datasets and classify crops. Different evaluation metrics were used to verify the best method. It has been observed that RF has the highest accuracy of 84.17% for prediction. Ashoka, D. V. et al. [46] presented a Fused Classifier Algorithm (FCA) and an Interfused Machine Learning Algorithm (IMLA) to predict suitable crops in the Karnataka region using agro-climatic parameters. They evaluate various machine learning models and conclude that the IMLA achieves the highest accuracy at 82.7%, outperforming other classifiers. It aims to improve agricultural productivity by aiding farmers in crop selection for optimal yield in rural Karnataka. Kawakura, S. et al. [47] applied explainable AI to analyze the agri-workers’ data to visualize the experienced and naive workers. The physical data are analyzed based on shapely additive explanations and a Light Gradient Boosting Machine (Light GBM). A wearable sensor is used to capture agri-workers’ motion pictures and analyze human dynamics in fields. Mostafa, S. et al. [48] focused on plants to observe characteristics, such as height, leaf shape, leaf count, biomass, etc., using explainable artificial intelligence. It allows for the development of better crop management by identifying water requirements, flowering time, etc. Kawakura, S. et al. [49] developed body-sensing systems, like wearable sensors, for real-time motion data in agriculture. The data were analyzed using Python, sharing insights with workers and managers. Employed explainable artificial intelligence (XAI) and visualization-developed training methods for agricultural directors based on diverse worker experiences. Ryo, M. et al. [50] applied XAI and interpretable machine learning on openly available data to observe the no-tillage effect on crops. They present insights on variable importance, interactions, associations with the response variable, and reasons behind predictions. Coulibaly, S. et al. [51] suggested detecting and locating insect pests in crops using XAI techniques. The visualization of aiding human validation of the results is implemented by the convolution neural network (CNN). Here, analysis was performed on 75,000 images from 102 pest categories in the IP102 dataset. Iatrou, M. et al. [52] aimed to provide rice growers with precise N-rate recommendations using precision agriculture methods. By constructing a predictive rice yield model integrating soil, remote sensing, and climatic data, machine learning systems were employed to analyze a 5-year dataset. The variation Autoencoder is applied to enhance the model and find the correlation between the variables. Apat, S. K. et al. [53] applied the SMOTE to balance the dataset and applied different machine learning algorithms, in which Cat Boosting had the highest accuracy for classification. The crop dataset on soil minerals was collected from Kaggle and analyzed for crop recommendation. Sabrina, F. et al. [54] designed a model for smart controlling of the agriculture system. The sensors are used to collect data and using the Fuzzy Controller, the anomalous behavior is observed and notified to the farmer with suitable solutions. The data for soil temperature and water availability were collected for approx. 8600 rows per year. KNN, SVC, and Naive Bayes were applied for classification, out of which Naive Bayes had the highest accuracy of 99.2%.
Paudel, D. et al. [55] demonstrate the efficacy of neural network models, particularly long short-term memory and one-dimensional convolutional neural networks, in forecasting the crop yield using data from the Monitoring Agricultural Resources (MARS) Crop Yield Forecasting System. Comparative analyses reveal that the long short-term memory (LSTM) recurrent neural network model outperforms the Gradient-Boosted Decision Trees (GBDTs) model for soft wheat in Germany and performs comparably for other case studies. Batchuluun, G. et al. [56] went for classification and disease prediction based on crop images. The model proposes a new plant based on analysis of 4720 thermal images. The CNN and XAI are implemented to classify the crop diseases. A database of paddy crop disease is used for analysis and comparison with the thermal images. It has been observed that the classification with higher accuracy is 98.5% for thermal images compared to the paddy crop dataset. Rajakumaran, M. et al. [57] propose the Multi-Attribute Weighted Tree-based Support Vector Machine (MAWT-SVM) approach to predict crop yields. Data were collected for 8 years from 1999 to 2007 on agriculture productivity and meteorological information. The methodology employs z-score normalization, principal component analysis (PCA), and genetic algorithms (GAs) to enhance performance. The results indicate that MAWT-SVM outperforms other methods. It offers a better solution for improving economic growth through optimal crop selection. Raju, C. et al. [58] proposed an ensemble model to enhance crop production accuracy. The dataset used was from the agroecological zone. By leveraging agricultural, environmental, and soil conditions, this approach aids farmers in informed crop selection decisions, employing a multilayered ensemble model to improve prediction performance. The evaluation metrics, including accuracy (97.1%) and F1-score (97.09%), validate the model’s effectiveness. Olofintuyi, S. S. et al. [59] developed a deep learning approach by an ensemble of the CNN and recurrent neural network. (RNN) applied to long short-term memory for cocoa yield prediction. The climate data of 31,320 samples were collected from 1988 to 2017 from cocoa-producing areas of southwest Nigeria. Mainly, the ensemble model utilizes the CNN for handling climatic data and the RNN for yield prediction. Benchmarking against other machine learning algorithms, the CNN-RNN with LSTM demonstrates superior performance based on metrics, like the MAE and MSE, highlighting its efficiency for cocoa yield prediction. Bandaiaha, K. et al. [60] classified fertilizers based on soil minerals obtained and the number of fertilizers required. The voting classifier and the decision tree were supplied with a sample of 10 data. It has been observed that the voting classifier (VTC) acquired a higher accuracy of 96% compared to the decision tree. Neupane, J. et al. [61] briefly discussed variable rate irrigation technologies to reduce water usage and focused on agronomic factors. It has been seen that the author gives importance to different tools to measure soil water status and crop growing conditions, which shall be analyzed using proximal sensing data. Ishak, M. et al. [62] suggested a methodology for crop yield prediction, monitoring crops and their market value analysis. A dataset from 64 districts of Bangladesh has been collected for analysis. They applied random forest, Support Vector Machine, and Voting Ensemble Regression. It was found that the voting regression has the highest R2 value of 82.8% compared to the others. It was observed that there was a seasonal analysis of six crops: Aus Rice, Aman Rice, Boro Rice, Wheat, Maize, and Lentil. Shams, M. Y. et al. [63] suggested an XAI-CROP algorithm that uses local interpretable model agnostic explanations for crop recommendations. They compared the performance of gradient boosting, decision tree, Gaussian Naive Bayes, and Multimodal Naive Bayes with XAI. XAI has the higher performance, with a mean squared error of 0.9412, a mean absolute error of 0.9874, consistently below 1, and an R-squared value of 0.94152. Shook, J. et al. [64] utilized the long short-term memory recurrent neural network (LSTM-RNN) model, implementing weekly weather data from Uniform Soybean Tests to predict the genotype responses in diverse environments. It was presented as being superior compared to the others in crop output accuracy. In the results, the R-squared value is 0.796 between the observed and predicted yields, which shows an adaptation of environmental variability. Wu, J. et al. [65] proposed a framework for intelligent crop management using a language model and reinforcement learning. Here, the study on maize crops results in presenting an enhanced approach that provides over 49% improvement in economic profit by reducing the environmental factors. Tabar, M. et al. [66] developed a machine-learning-based Met algorithm for forecasting the productivity of crops using data-driven techniques in the farms of Africa by collecting remotely sensed data from 2200 farms. They suggested a model that works as an early warning system on climates to provide an impact on agriculture productivity.
It has been observed from the extensive literature review that many researchers applied different approaches to their datasets for soil and crops. Many technological tools are used, such as sensors, drones, and automated devices, to collect and analyze real-time data. Different methods, including machine learning, deep learning, fuzzy systems, explainable AI, etc., were used to analyze the real-time data and the existing standard soil mineral dataset. Here, different measuring parameters were important to identify the best methods for predictions.
2.1. Preferred Reporting Items for Systematic Reviews and Meta-Analyses (PRISMA) Flow Diagram
A systematic and detailed review of the meta-analysis is shown using the PRISMA flow diagram given in Figure 1.
Figure 1.
PRISMA chart on the reviewed papers and the dataset.
The review analysis shown in Table represents the research work performed using different technologies for improving crop production such as the use of sensors and drones, analyzing crop growth, recommendations based on real-time data, and crop recommendations using historical datasets. An application of machine learning and deep learning algorithms has been observed. Here, it is observed that the dataset of crops, the ideal mineral needs of crops, and different geographical locations suitable for specific crops are used for analysis. In the last row in Table 1, we have represented the performance of our proposed model and its advantages compared to other models in different papers.
Table 1.
A Comparison of the proposed models and performance analysis in the literature review and our proposed model.
2.2. Research Gap
It has been observed that lots of researchers have applied RF, SVC, KNN, NB, and other methods for the prediction of recommended crops. It has been seen that many times, random forest and ensemble methods were suggested by researchers. Still, the performance shall be improved by applying different classification approaches with a continuous verification of performance evolution metrics. Also, some techniques that will handle the overfitting problems should be implemented. Finally, quick and optimized guidance will be provided to the new farmers who do not have much strategic knowledge of the soil minerals of their locations.
2.3. Research Questions
- Research Question (RQ1): How does applying the Synthetic Minority Oversampling Technique (SMOTE) influence the performance of classifier techniques in crop recommendation, and what are the observed changes before and after the SMOTE?
- Research Question (RQ2): How do accuracy, recall, precision, F1-score, ROC AUC, sensitivity, and specificity change for different classifiers before and after the application of the SMOTE?
- Research Question (RQ3): How do the classification performance metrics vary among different classifiers before and after the SMOTE regarding boxplots, AUC-ROC curves, and statistical summaries?
- Research Question (RQ4): Does the SMOTE along with classifiers contribute an improvement in the prediction of area-wise suitable crops accurately?
2.4. Technical Roadmap
Figure 2 presents a systematic overall technical roadmap for our research work. Here, initially, we have gone through many research papers for review and observed that most of the models implement sensors, drones, Wi-Fi, GPS, satellite images, and automated tools for crop recommendation, cultivation, monitoring, and effective production. We thought of finding a novel way to support the naïve farmers in recommending a quick and appropriate crop. For this, we explored extensively for suitable datasets. We found a dataset that contains details on different regular crops along with their season-wise productions from URL: https://data.world/thatzprem/agriculture-india (accessed on 5 January 2024). Then, data reduction was applied to the collected dataset, and it was confined to only three districts. We had a continuous visit to the local experienced farmers and interacted with them to learn about their expertise in crops in the last 10 years, and we also visited officers of agriculture offices for a period of 3 months. The collected crop information has been combined into the existing dataset. This dataset is cleaned, pre-processed, and converted into CSV format and stored in Firebase cloud memory. This CSV file has been trained using 13 classifiers based on production rate and season to identify suitable crops. Here, initially, we have seen that the dataset is not balanced properly. So, we applied the SMOTE and balanced the dataset. Then, we trained for 80% of the dataset using these classifiers and tested for 20% of the data. Then, we analyzed their performance based on the accuracy rate, and it was observed that the SGDC technique had the highest accuracy compared to the others.
Figure 2.
Overall technical roadmap.
Further, we have developed an Android application using Android Studio and SDK tools, which allows the farmer to input field location and season, which will be fed as an input to the model, and it identifies the suitable crop for the field.
3. Materials and Methods
A study has been conducted to understand the best way to find predictions on our dataset. The classifiers, such as LR, DT, KNN, SVC, RF, GB, XGBoost, Ada Boost, Histogram Gradient Boosting (HGB), SGDC, Multinomial Naive Bayes (MNV), etc., were applied to the dataset to identify the most suitable method and approach so that there will be an improvement in the predictions.
3.1. Logistic Regression
Logistic regression was applied using the crop suggestion as a dependent variable and other variables such as area, production rate, and soil temperature as independent variables. Here, the regression based on multinomial or ordinal shall be applied along with the different kernel functions for data analysis. The slope of the rate of crop production using logistic regression is presented in Equation (1).
where L is the maximum value in a curve, x is the real number, x0 is the middle point value in the sigmoid, and k is the growth rate of the curve.
3.2. Decision Tree
The decision tree is applied to the dataset based on the crop quantity produced. Here, the crop quantity shall be the feature to compare for high-rated production, and the outcome shall be the suggested crop that is expected to have better production. A decision tree will present the flow of decisions to reach the final node.
The DT is a popular classification method that is used to train the model using simple decision rules. It always starts with the root node, and by comparing the root with the record’s attribute, the branching begins. The decisions can be based on a categorical or continuous target variable. In this tree, each node is treated as a test case for some attribute. Then, the CART method shall be applied here for analysis. The value of the attribute shall be obtained by finding entropy, information gain, gain ratios, Gini index, reduction of variance, and chi-square. The standard equations to measure the above metrics are entropy shown in Equation (2), information gain in Equation (3), and Gini index in Equation (4).
where E(S) is entropy, Pi is the probability of a random variable S, and c is the categories that S can take in Equation (2).
Information gain (G) is measured based on the following:
where X is the attribute, T is the dataset, E(T) is the entropy of the dataset, and E(T, X) is the entropy of T after a split based on X, as shown in Equation (3).
The cost function Gini index shall be used to calculate the splits in the dataset. It shall be used with the CART to identify the spit points in the dataset. In Equation (4), the Gini index Gi, c is the count of classes in the crop dataset, and Pi is the probability of a particular crop at class i.
3.3. K-Nearest Neighbors
It is a simple supervised algorithm in which, based on the neighboring data points, crop classification can be performed. Here, the soil features, weather conditions, and production rate shall be the feature points for KNN to classify crops and identify nearest neighbors based on the suitable K value chosen. While training the dataset, a new data point is chosen, and the Euclidean distance is calculated from it to the nearest data points. The Euclidean distance formula D is shown in Equation (5), where the coordinate values of the 1st point are x1, y1 and x2, y2 for the 2nd point.
So, by finding the distance matrix and applying voting majority, it is decided that the new data point belongs to the class. The number of neighboring points is determined by the K value. The main benefit of KNN is that new data points can be added, as it will not learn from the training dataset. Here, choosing a K value is a crucial task.
3.4. Support Vector Classifier
The Support Vector Classifier (SVC) is used for both regression and classification. Here, we have used regression to find suitable crop detection. We identify the production rate as a parameter for it and expect the crops to be suitable for output. The independent variables are the production rate and area name, whereas the dependent variable crop is taken into consideration. The SVC shall evaluate the non-linear decision boundaries and classify them using its kernel functions. Here, we can apply four kernel functions, Gaussian, Gaussian Kernel Radial Basis Function, Polynomial Kernel, and Sigmoid Kernel, to identify the most suitable function for improving the performance of the SVC. The classification of crops based on variations in crop production in different areas is to be obtained here.
In the SVC, the hyperplane is used to identify the closest points to the margin. Here, the margin shall be the maximum for classification.
Based on the input features, the hyperplane can be a line or a 2D plane. The standard equations for classification using the SVC are presented in Equations (6)–(8).
Equation (6) shows the decision function; w is the direction of the plane, b is the threshold value, and x is the feature vector.
In Equations (7) and (8), w ∗ x − b shows the distance of the hyperplane along with vector w.
For positive class (1), it will be
For negative class (−1), it will be
In a multi-class SVM with three classes, we create hyperplanes to separate each pair of classes. To classify a new sample, we use a one-vs-rest approach, where a hyperplane is constructed for each class against all other classes combined.
f(x) = 0
f(x) = w · x + b
f(x) > 0
f(x) < 0
In Equation (9), a hyperplane for separating the data points of three classes the decision function w · xi + b calculates the distance between xi and the hyperplane.
3.5. Random Forest
A combination of multiple decision trees is used to predict more stably. RF is a very adaptable approach to implement in our study. As it handles complex datasets and over fits, it will have better performance in predictions. The crop datasets can have subsets to apply a decision tree, and then based on averaging in a random forest, we can classify the crops. Here, we can obtain better results without tuning its hyper parameters. By lowering the Gini index, we can predict the more appropriate crop for the area.
In Equation (10), the final prediction P(a) is shown, and Ti is the prediction for each input a.
where the n decision trees available are T1, T2, T3, …, Tn, and the input supplied to each tree is a. Here, the mode shows the majority voting applied among the predictions.
3.6. Gradient Boosting
Gradient Boosting is an ensemble method that sequentially trains the models. Here, each model tries to rectify the previous model. Each time, the new model gets trained based on the loss observed by applying the log-likelihood function in the previous old model. The location-based crop dataset shall be used in recommending, with the help of the gradient boosting technique.
In this approach, at first, a base model was used for prediction based on a crop dataset. Equation (11) shows the current model fi(x) for sample i evaluated at x, Yi is the predicted value, is the adjustment for prediction value by the min loss function, and L(Yi, γ) is the loss function.
Equation (12) shows the loss function L, the number of samples n, the predicted probability for crops pi, and the true binary label yi.
Equation (13) shows that each model is constructed by adding a weak learner tree hm(x) to the ensemble . There are m samples, and we need to fit the hm(x) at each iteration of m. So, the new weak learner is predicted for our model.
Finally, Equation (14) shows the prediction probability p, a sigmoid function to the sum of all the individual models and linear score f(x).
3.7. Bagged Tree
Bagging is the aggregation of bootstrapping. During the presence of noise in the crop dataset, bagging shall be used for classification by reducing the overfitting problem. Bagging builds different models using a sample subset of the crop dataset.
In bagging, there are divisions of the crop dataset, and then the bagging concept is applied to it. Then, by aggregating the predictions of the different models, it reduces the variance. So, instead of depending on the output of one model, it executes multiple models to find better accuracy in prediction. Here, bootstrapping is performed by training the model using a random collection of records from the dataset. The outputs from bootstrapping are taken for aggregation to reduce the variance. The aggregation is carried out using the standard deviation, mean, or median. The bagging is represented in the Equation (15) as follows:
where
- T is a sample subset element from training dataset D;
- D1, D2, … DT is the copy of the training sets;
- f1(x), f2(x),… ft(x) are the functions that return a sequence of outputs.
3.8. Ada Boost Classifier
Adaptive Boosting is an ensemble method that can be used for classification and regression. Here, we shall apply this method for crop data analysis and its classification. It trains all the weak learners iteratively, uplifts the previous weak learners who are not well trained, and then combines all of them to prepare a strong classifier.
Initially, consider wi is the weight of training instances and ht is a weak learner in the first iteration.
During each iteration t, consider dt = (xi, yi, wit) and train the learner ht using weighted dataset dt. Now, find the error et of ht on the weighted dataset, the weight of weak learner dt, and update the weights of the instances.
By combining these weak learners, we can obtain Equation (16) as follows:
When some samples are misclassified, the value of alpha shall be positive.
3.9. Extreme Gradient Boosting Classifier
In crop recommendation, the extreme gradient boosting classifier predicts suggested crops based on decision trees, repeatedly. Features like soil, climate, season, and economic factors shall be used as inputs. Here, the trees are generated in parallel. They handle the complex relationships in the data and regularize them to stop the overfitting problem. Extreme gradient boosting (XGBoost) has higher performance in classification than gradient boosting.
Consider Yi as the output predicted for the ith observation, Q is the count of trees observed in the model, Fq shows the qth tree in the ensemble approach, and Xi is the feature for the ith observation.
Then, the Equation (17) for XGBoost can be represented as follows:
Here, Fq is a tree that gives out results for each observation. Then, the final prediction shall be found by the summation of all the predictions.
3.10. Cat Boost
Categorical boosting is mainly used for classification, regression, and ranking. It is mainly implemented on categorical numerical data. Here, we shall implement it for the ordering of categories by splitting the crop data. It has regularization techniques to block overfitting. Cat Boost reduces memory usage and at the same time improves the speed of training.
In the crop dataset, consider n samples and m features (xi, yi). Equation (18) shows that the prediction function F(x) takes the input variables x and predict the target variable y. Here, F0(x) is the baseline prediction, M is the count of trees in the ensemble, N is the total training samples, and Fm(xi) is a prediction of the mth tree for the ith sample.
3.11. Histogram Gradient Boosting
The Histogram Gradient Boosting (HGB) approach works faster in predicting the crops as it uses the histograms for splitting the crop data. In HGB, the feature points are categorized and stored into buckets. Then, these buckets are used for constructing histograms. During the construction of decision trees, histograms are used to identify the split points. For each split point, they create a tree node and then find the leaf values for each leaf node to reduce the loss function. This approach allows us to train the model faster with less memory usage.
When there is a large dataset with more dimensional values, this method is useful.
Equation (19) shows the overall prediction for input x, M number of models, m = 1 to M represents the boosting iterations, v is the learning rate, and T(x) is a prediction of the new tree, and finally, the summation of all the trees is represented.
3.12. Stochastic Gradient Descent Classifier
When the crop dataset is larger, we will apply the Stochastic Gradient Descent algorithm. It processes each piece of training data independently. It chooses an instance randomly and calculates the gradient, and it is faster as a result. For each training example (xi, yi), the output and the loss function are shown in Equations (20) and (21), respectively.
3.13. Multinomial Naive Bayes
Multinomial Naive Bayes (MNB) is a variant of Naive Bayes and is useful for classifying the discrete features of crop data. Here, the text data are pre-processed and converted into a vector format. In MNB, at the beginning, the soil and season feature vectors are identified, such as the frequency of a particular word in a document. Then, it computes the probability of a feature in each class and then finds the highest probability that a document belongs to that class.
Let us consider the features w1, w2, w3, … wn.
D is the document and C is the class; then, Equation (22) shows that the posterior probability of C for data D, is the prior probability, and is the product of likelihoods.
3.14. Synthetic Minority Oversampling Technique
The Synthetic Minority Oversampling Technique (SMOTE) is used to handle the class imbalance problem while dealing with crop datasets. It identifies a minor class and then finds the nearest neighbors to generate synthetic samples to balance the minor class. With this approach, the problem of overfitting is avoided, which improves the overall performance of crop recommendations.
When we train a model having a dataset with a minor class, its performance will become poor. If we randomize the observations here, it leads to overfitting. But, we can apply the SMOTE as follows:
- Choose a sample X and identify its nearest neighbor N. Find the difference between the sample and nearest neighbor, i.e., D = (X − N).
- Consider a random number from 0 to 1. For example, the number is Rn and it is multiplied by the difference D. So, it is (Rn ∗ D).
Add these results to the sample X to generate a new synthetic feature Y shown in Equation (23) as follows:
3.15. Explainable AI
Explainable artificial intelligence (XAI) is used in the role of validating the crop classification algorithms. It allows us to identify the important features in crop data, which influence decisions. It authenticates the performance of predictions by reducing the influence of noisy features. So, the model prediction shall be fair and unbiased in different demographic groups.
Overall, XAI validates the classification methods by providing insights into decision-making, identifying features, and promoting transparency and error analysis.
3.16. Evaluation Metrics Applied to the Different Algorithms
We shall apply the performance evaluation metrics, i.e., sensitivity, specificity, precision, F-measure, AUC, training time, and testing time, on different machine learning algorithms used for crop classification. They help to analyze the performance of each method and improve the performance of our model by tuning.
We can derive the confusion matrix from the multi-class model. The predictions in the confusion matrix are P (positive), N (negative), T (true), F (false), TP (true positive), TN (true negative), FP (false positive), and FN (false negative). Then, the common measures we can observe from the matrix are as follows:
Accuracy: The accuracy rate is the ratio of correct predictions and total predictions, and it is used for identifying the performance of a model.
Precision: The measuring of the ability of a model by finding the ratio between true positive instances and all positive instances.
Recall: It evaluates the performance of classification models, particularly when the fast negative is costly. This means that the recall should minimize the number of false negatives.
F-measure/F1-score or F-score: We have considered the F-measure as a parameter here, as it is more useful than accuracy. Even though there are uneven classes of distribution, we can use the F-measure to measure performance.
AUC: We apply the AUC-ROC (Area Under the Receiver Operating Characteristic Curve) to visualize the performance of the classification models. We have obtained the AUC range to see the percentage of right predictions and wrong predictions in terms of a curve.
Sensitivity, true positive rate, or recall: We have identified the fraction of correct prediction using the recall measure or sensitivity.
Specificity (or True Negative Rate): This measures the fraction of negative samples correctly identified by the model. It is defined as: specificity = .
Where TN is the number of true negative and FP is the false positives.
3.17. Proposed Model for Seasonal Crop Recommendation
When a farmer seeks the recommended crops for a specific location based on a set of conditions, such as season, water availability, and other environmental factors, the model will predict the most suitable crop varieties that are most likely to perform well in those conditions. In this regard, a group of classification techniques will be applied to predict suitable crops for the specific field area.
We have proposed a procedure shown in Figure 3, which mainly focuses on area-wise crop data collected from standard agriculture websites in India. It is considered to have a smartphone application and a cloud memory dataset for the implementation of the support system.
Figure 3.
Proposed model for area-wise seasonal crop recommendations.
The model consists of two phases. Phase 1 consists of maintaining the dataset in the cloud and using an Android app interface to collect the GPS location from a farmer’s land. Then comes Phase 2, consisting of applying the machine learning methods, identifying the best method, and resulting in crop recommendations.
3.17.1. Phase I
Dataset Description
A detailed historical dataset has been collected from URL: https://data.world/thatzprem/agriculture-india (accessed on 26 January 2024) with 246,091 sample records with 37 different crops such as Arhar, Bajra, Castor seed, Coriander, Cotton, Dry chilies, Dry gunger, Garlic, Gram, Groundnut, Horse-gram, Jowar, Jute, Linseed, Maize, Mesta, Moong, Niger seed, Onion, Other Rabi Pulsesm Other Kharif pulses, Paddy, Potato, Ragi, Rapeseeds and Mustard, Rice, Safflower, Sannhamp, Sesamum, Small millets, Sugarcane, Sunflower, Sweet potato, Tobacco, Turmeric, Urad, and Wheat. Also, the metadata of the dataset contains state, district, crop year, season, crop name, area, and production per hectare.
The dataset is pre-processed to remove fields. Other Rabi pulses and Other Kharif pulses and removed records have empty locations. Then, the dataset was reduced to three districts, Koraput, Gajapati, and Rayagada, in Odisha State, which resulted in 1480 records. Figure 4 shows four different Agriculture Offices in three districts, Koraput, Gajapati, and Rayagada, in Odisha, where we have consulted the agriculture officers for their suggestions. We have also consulted experienced farmers from different areas of these districts and collected data on the crops and their productivity. We have combined both datasets and prepared a customized final dataset for analysis.
Figure 4.
Agriculture offices and Google Maps of GUNUPUR, PARALAKHEMUNDI, KORAPUT, and RAYAGADA.
Data Cleaning and Pre-Processing
The collected data from different sources have been cleaned by removing the irrelevant fields and correcting erroneous data inputs and empty fields. Then, the data have been processed to change their formats to be suitable for analysis. Mostly, the data have been converted into Comma-Separated Values (CSV) format. Feature selection has been performed to select the best set of features and apply predictions. Then, finally, the dataset is obtained for analysis.
Training and Testing
The cleaned and useful data are further divided into training and testing phases. A total of 80% of the data is used for training in a standard way and 20% is used for testing the model.
Cloud Storage
We have stored the final dataset in a low-cost cloud memory, i.e., Firebase service. We can also use any other cloud memory such as Google Cloud, Cloud Ways, Amazon Web Services, Digital Oceans, etc. Then, 80% of the dataset is used for training the model and 20% is used for testing purposes. Figure 5 below presents the cloud Firebase services used for maintaining the crops dataset in the cloud, which shall be used to interact with the Android mobile application for predictions.
Figure 5.
Firebase account to handle the area-wise crop dataset and recommendation.
Android Application
Nowadays, a smartphone device is available for common farmers. So, an Android application, “Area-wise Seasonal Crop Recommendation”, is developed using Android Studio, Emulator, SDK, and Tools. Figure 6 shows a screenshot of the application that contains the crop’s details and their relevant information. The application is tested for analyzing the crop dataset, which is in CSV file format using SMOTEs shown in the proposed model. A farmer can use our application interface using his Android smartphone, and it can present the suitable crop as per his field data, season, and water availability. He shall choose the specific location area available in the app and the present date to know the present season. Then, he shall go for the prediction option. This leads to executing different classification algorithms along with the SMOTE technology on these datasets. Also, different kernel functions are applied to fine-tune and improve the model’s performance.
Figure 6.
An Android application for identifying recommended crops based on user input and data analysis.
Based on the rate of performance, a suitable classifier technique is chosen, which shall suggest the crops based on season for a specific area. Finally, the suggested crops shall be visualized in the farmer’s mobile phone as per the area and season given.
3.17.2. Phase II
We shall apply different machine learning classifiers, analyze their performance based on different parameters, and identify the best technique.
Implementing the SMOTE
Here, we have applied 13 different methods such as logistic regression, decision tree, K-Neighbors, SVC, random forest, Gradient Boosting, bagging tree, XGB Classifier, Ada Boost Classifier, Cat Boost, HGB, SGDC, and MNB.
Here, we observed that the data imbalance may sometimes provide inaccurate results. So, we applied the Synthetic Minority Oversampling Technique (SMOTE) to balance the dataset.
Performance Analysis
We applied these methods before the SMOTE and after the SMOTE and compared their performance extensively using 7 different measuring parameters such as accuracy, precision, recall, F1-score, ROC, sensitivity, and specificity. The outcome of the comparison leads to identifying the best technique that shall be used for predictions. This approach shall guide the new farmers in making better decisions in crop selection.
4. Results and Discussion
The implementation is verified using 13 different machine learning algorithms such as logistic regression, K-Neighbors, decision tree, random forest, SVC, Gradient Boosting, bagging tree, XGB Classifier, Ada Boost Classifier, Cat Boost, HGB, SGDC, and MNB. The analysis of all these methods based on their performance has been observed using the confusion matrix, ROC curve, and precision–recall curve.
Generally, there is always the problem of data imbalance that may be present. It leads to many problems such as bias towards the majority classes, overfitting during smaller datasets, and the reduction in samples for major classes.
Below, Table 2 shows the implementation of different machine learning algorithms for the analysis of data without the SMOTE using the confusion matrix, ROC, and precision–recall curves.
Table 2.
A comparison of results of machine learning algorithms before the SMOTE.
The Synthetic Minority Oversampling Technique (SMOTE) is a popular method used in dealing with imbalanced datasets in machine learning, particularly in classification tasks. The SMOTE oversamples the minor classes by creating synthetic examples rather than duplicating samples. The SMOTE performs operations such as identifying a minor class, selecting the neighbors of the minor class, creating synthetic samples based on neighboring points, and adding these samples to balance the minor class.
So, the SMOTE reduces overfitting by properly balancing the classes, and it also preserves the information.
The performance analysis details on machine learning algorithms after applying the SMOTE on the dataset are presented in Table 3.
Table 3.
Comparison of machine learning classifiers after the SMOTE.
It has been observed that the confusion matrix provides true positives and true negatives with a good number of values in predictions. But, the false positive value is 48 in logistic regression, as shown in Table 2.
It is understood that after applying the SMOTE to balance the dataset, prediction is possible and the results shall be determined.
We have seen that the values of the confusion matrix after the SMOTE are improved. Here, the false negatives for logistic regression, SVC, and SGDC are 64, 78 and 47, respectively, as shown in Table 3.
Performance Analysis and Summary
- Solution to Research Question RQ1:
To handle this research question, we experimented on the crop dataset. As the dataset is imbalanced, we used a technique like the SMOTE. Further, we have used several machine learning classifiers along with the SMOTE before and after the SMOTE to see the recommendation.
Table 4 shows the performance measuring values of different classifiers before the SMOTE. There are several performance parameters used, like accuracy, precision, recall, F1-score, ROC AUC, sensitivity, and specificity.
Table 4.
Summary report before the SMOTE.
In Figure 7, the logistic regression obtained 76% accuracy but at the same time obtained a low precision–recall of 42%. That indicates that logistic regression suffers from accurate prediction for certain crops, whereas the other classifiers like SVC, RF, and GB prove the balanced classifier performances throughout the performance metrics.
Figure 7.
Before the SMOTE.
In Figure 8, the heat map representation for crop recommendation after applying the SMOTE exhibits the performance metrics result.
Figure 8.
After the SMOTE.
Table 5 shows a summary of the performance measuring values of different classifiers after the SMOTE. After applying the SMOTE, the precision–recall of logistic regression increases from 42% to 55%. The performance of the SVC is reduced from 100% to 29% in the recall. The XGB Classifier outperformed, but in some of the cases, improvement was observed after applying the SMOTE.
Table 5.
Summary after the SMOTE.
A comparison of all of the classifiers by considering the accuracy rate as a prime parameter before and after the SMOTE is shown in Table 6.
Table 6.
Comparison based on the accuracy rate.
In the above-mentioned Table 4 and Table 5, we observed some of the key points, and they are shown below. The performance parameter recall is improved after applying the SMOTE, which signifies that the performance metrics performed well in identifying minority class instances. It has been observed that some of the classifier performance metrics, especially the F1-score, and specificity decrease leading to potential misclassifications. However most of the cases accuracy of the performance parameter remains stable. The (SVCs) performance about the accuracy shows only slight changes. Similarly, the performance metrics and ROC AUC values show minor fluctuations. This indicates that the classifiers can distinguish between the remaining classes, which exhibit consistent characteristics. Here are minimal fluctuations observed in performance before and after applying SMOTE. Our objective was to handle the imbalanced dataset using the SMOTE, which improves the recall for most of the classifiers. It was also observed that some of the classifier’s performance had a high precision and recall but after the SMOTE, it became stable. The reason behind this is that after the SMOTE, the performance increased, i.e., its ability to detect the minority class instances that reduce the bias towards the majority class, which enhances the balanced performance in terms of measurement. The model performances are enhanced so that the minority classes are recognized, which is an important factor for crop recommendations. Those classifier performance metrics (precision and recall in most cases) are high before applying the SMOTE because of the data imbalance nature. After using the SMOTE, we found overall performance improvement, which signifies that those classifiers are better suggested for crop recommendation in different conditions.
In the polar graph shown in Figure 9, it has been observed that the classifier LR and accuracy remain the same before and after some techniques, i.e., 76%. The obtained result does not impact performance. Similarly, the same effect on the DT and the obtained result is 95%. In KNN, the performance decreased after implementing the SMOTE, demonstrating that the SMOTE technology produces a negative impact on the K-NN classifier. In the same way as the SVC, the performance slightly decreased from 1.00 to 0.74.RF. In the SGDC, these classifiers increased after the SMOTEs. However, some of the classifiers have performances that decreased after the SMOTE, like Ada Boost, Cat Boost, and MNV. It has been also observed that some of the classifier’s performance remains the same before the SMOTE and after the SMOTE, and these are Bagged Tree, HGB, etc. The provided radar graph demonstrates that the classifier RF and SGDC provide a positive impact and no impact (logistic regression, decision tree, Bagged Tree, XGB Classifier, HGB), as well as a negative impact (K-Neighbors, SVC, Gradient Boosting, Ada Boost Classifier, Cat Boost, MNV), on the classifiers. The classifier SGDC improved performance, and the SVC provided a negative impact.
Figure 9.
Bar chart for comparing the performance metrics.
Figure 10 demonstrates the ROC curve applied before the SMOTE and after the SMOTE. Before the SMOTE a value of 0.92 was obtained, and after, a value of 0.96 was obtained, which indicates that the model perfectly identifies the two classes after applying the SMOTE. The model obtained a higher ROC AUC, which means that the model perfectly differentiates between the two classes. Increasing the ROC AUC achieves the ability to classify instances of the minority class.
Figure 10.
ROC curve before the SMOTE.
- Solution to Research Question RQ2:
The performance measuring metrics of different machine learning algorithms are compared. Figure 11 shows a bar chart and box plot that compare the algorithms based on the accuracy rate and here, the SVC has more accuracy before the SMOTE.
Figure 11.
Bar chart and box plot for analyzing the classifiers using the accuracy rate.
- Solution to Research Question RQ3:
The scores of different algorithms are generated and compared here. Figure 12 shows a box plot that compares the changes observed in the performance of algorithms. It is seen that the SGDC has good score compared to others after the SMOTE.
Figure 12.
Comparison using a box plot before and after the SMOTE.
The research question can be solved using the SMOTE to enhance the performance of crop recommendation classifiers. Our objective was to determine whether the oversampling technique contributes to enhanced model discrimination and overall classification performance in imbalanced datasets related to crop recommendation. Figure 13 shows the ROC AUC curve for comparison. It seems that it continuously improved model discrimination and overall classification performance in the context of imbalanced datasets related to crop recommendation.
Figure 13.
Comparison using the ROC AUC before and after the SMOTE.
- Solution for Research Question RQ4:
Figure 14 shows a graph on precision vs. recall, which is a representation of different thresholds of a classifier. When the first curve reaches the upper-right corner, it indicates that it produces better performance. Figure 15 shows a curve that indicates the performance of the classifier after applying the SMOTE. The curve shifted towards the higher precision and recall values, which is why it improved the performance on the balanced dataset after the SMOTE.
Figure 14.
Precision–recall chart before the SMOTE and after the SMOTE.
Figure 15.
Line chart based on precision–recall before and after the SMOTE.
5. Conclusions and Future Work
An extended literature survey that includes many different techniques and methodologies was applied in crop recommendations and used for improving profitability in cropping. In the survey, it is observed that many researchers applied research on using wireless sensors, RFID-based sensors, sensors for monitoring water usage, and the use of satellite images for analysis. Also, they analyzed soil minerals and weather parameters and the suitability of different crops in fields using machine and deep learning tools on different datasets. The objective of the proper use of agriculture fields without wastage of water and minerals is seen.
We have analyzed the collected crop production dataset at URL: (https://data.world/thatzprem/agriculture-india (accessed on 5 January 2024). We applied 13 different classifiers to it to find the most suitable technique that can recommend crops with a higher accuracy. We applied data reduction and confined our dataset in three districts of Odisha state, India. Also, by collecting suggestions from local agriculture officers and experienced farmers, the data were improvised.
We proposed a model to identify a suitable classifier based on performance analysis, and we can predict the crops without any anomalies. Initially, we applied 13 different classifiers without the SMOTE, and we saw that the accuracy of the SVC is 1.0, the XGB Classifier is 0.97, and the SGDC is 0.95. But, for appropriate prediction, dataset balancing is very important. So, after cleaning and pre-processing in a standard way, we applied the classifiers after the SMOTE to the data. It has been observed that the accuracy of the SVC is reduced to 0.74 and XGBoost to 0.97, and the SGDC is improved to 1.0.
So, we conclude that the prediction after balancing the dataset shall be more accurate. In the future, we shall extend our work by implementing XAI techniques to optimize and enhance performance. Also, we shall implement a large dataset that shall cover a vast area.
Author Contributions
M.K.S., A.R. and N.P. conceived the idea, designed and performed the experiments, analyzed and investigated the results, drafted the manuscript, and revised the final manuscript. N.P. and A.R.: visualization; N.P.: supervision. All authors have read and agreed to the published version of the manuscript.
Funding
This research received no external funding.
Institutional Review Board Statement
Not applicable.
Data Availability Statement
The data that support the findings of this study are available from the corresponding author upon reasonable request.
Acknowledgments
I would like to express my special thanks to Neelamadhab Padhy, Professor, Deputy Dean (R&D), Computational Science (Guide), GIET University and the Agriculture Department of GIET University for permitting us to conduct different tests on soils of different crops and interact with Agriculture officers.
Conflicts of Interest
The authors declare no conflicts of interest.
Abbreviations
| Word | Abbreviations |
| SMOTE | Synthetic Minority Over-sampling Technique |
| SGDC | Stochastic Gradient Descent |
| SVC | Support Vector Classifier |
| GB | Gradient Boost |
| NPK | Nitrogen Phosphorus, Potassium |
| MAC | Medium Access Control |
| RFID | Radio Frequency Identification |
| UHF | Ultra high frequency |
| PLS | Physical Layer Signalling |
| PS | Packet Switching |
| CLS | Connectionless Mode Service |
| KNN | K-Nearest Neighbor |
| RF | Random Forest |
| SVC | Support Vector Classifier |
| DT | Decision Tree |
| XGBoost | Extreme Gradient Boosting |
| pH | Potential of Hydrogen |
| CART | classification and regression tree |
| NB | Naïve Bayes |
| ANN | Artificial Neural Network |
| RFR | Random Forest Regression |
| GPM | Generalized Poisson Models |
| CNN | Convolution Neural Network |
| ITE&C | Information Technology, Electronics and Communications Department |
| MAE | Mean Absolute Error |
| MSE | Mean Squared Error |
| R2 score | R-squared score |
| AI | Artificial Intelligence |
| REP Tree | Repeated Incremental Pruning Tree |
| RMSE | Root mean squared error |
| CV | coefficients of variation |
| IMD, Pune | India Meteorological Department, Pune |
| DT, NN | Decision Tree, Neural Network |
| MLR | Multiple Linear Regression |
| PCA and LDA | principal component analysis, linear discriminant analysis |
| GBM | Gradient Boosting Machine |
| MARS | Monitoring Agricultural ResourceS |
| LSTM | long short-term memory |
| GBDT model | Gradient-Boosted Decision Trees |
| XAI | Explainable Artificial Intelligence |
| VTC | Voting Classifier |
| PRISMA | Preferred Reporting Items for Systematic Reviews and Meta-Analyses |
| MNB | Multinomial Naive Bayes |
| HGB | Histogram Gradient Boosting |
| AUC ROC | Area under the Receiver Operating Characteristic Curve |
| RFR | Random Forest Regression |
| IoT | Internet of Things |
| GPS | Global Positioning System |
| LightGBM | Light Gradient Boosting Machine |
| CSV | Comma-Separated Values |
References
- Liakos, K.G.; Busato, P.; Moshou, D.; Pearson, S.; Bochtis, D. Machine learning in agriculture: A review. Sensors 2018, 18, 2674. [Google Scholar] [CrossRef] [Scilit] [PubMed]
- Doshi, Z.; Nadkarni, S.; Agrawal, R.; Shah, N. AgroConsultant: Intelligent crop recommendation system using machine learning algorithms. In Proceedings of the 2018 Fourth International Conference on Computing Communication Control and Automation (ICCUBEA), Pune, India, 16–18 August 2018; pp. 1–6. [Google Scholar]
- Vaishnavi, S.; Shobana, M.; Sabitha, R.; Karthik, S. Agricultural crop recommendations based on productivity and season. In Proceedings of the 2021 7th International Conference on Advanced Computing and Communication Systems (ICACCS), Coimbatore, India, 19–20 March 2021; Volume 1, pp. 883–886. [Google Scholar]
- Babu, S. A software model for precision agriculture for small and marginal farmers. In Proceedings of the 2013 IEEE Global Humanitarian Technology Conference: South Asia Satellite (GHTC-SAS), Trivandrum, India, 23–24 August 2013; pp. 352–355. [Google Scholar]
- Balamurali, R.; Kathiravan, K. An analysis of various routing protocols for Precision Agriculture using Wireless Sensor Network. In Proceedings of the 2015 IEEE Technological Innovation in ICT for Agriculture and Rural Development (TIAR), Chennai, India, 10–12 July 2015; pp. 156–159. [Google Scholar]
- Fonthal, F. Design and implementation of WSN for precision agriculture in white cabbage crops. In Proceedings of the 2017 IEEE XXIV International Conference on Electronics, Electrical Engineering and Computing (INTERCON), Cusco, Peru, 15–18 August 2017; pp. 1–4. [Google Scholar]
- Gyarmati, G.; Mizik, T. The present and future of precision agriculture. In Proceedings of the 2020 IEEE 15th International Conference of System of Systems Engineering (SoSE), Budapest, Hungary, 2–4 June 2020; pp. 593–596. [Google Scholar]
- Palazzi, V.; Gelati, F.; Vaglioni, U.; Alimenti, F.; Mezzanotte, P.; Roselli, L. Leaf-compatible autonomous RFID-based wireless temperature sensors for precision agriculture. In Proceedings of the 2019 IEEE Topical Conference on Wireless Sensors and Sensor Networks (WiSNet), Orlando, FL, USA, 20–23 January 2019; pp. 1–4. [Google Scholar]
- Wang, Y.; Liu, Y. Benefits of Precision Agriculture Application for Winter Wheat in Central China. In Proceedings of the 2018 7th International Conference on Agro-Geoinformatics (Agro-Geoinformatics), Hangzhou, China, 6–9 August 2018; pp. 1–4. [Google Scholar]
- Dholu, M.; Ghodinde, K.A. Internet of things (iot) for precision agriculture application. In Proceedings of the 2018 2nd International Conference on Trends in Electronics and Informatics (ICOEI), Tirunelveli, India, 11–12 May 2018; pp. 339–342. [Google Scholar]
- Palagin, O.; Romanov, V.; Galelyuka, I.; Velichko, V.; Hrusha, V. Data acquisition systems of plants’ state in precision agriculture. In Proceedings of the 6th IEEE International Conference on Intelligent Data Acquisition and Advanced Computing Systems, Prague, Czech Republic, 15–17 September 2011; Volume 1, pp. 16–19. [Google Scholar]
- Patidar, J.; Khatri, R.; Gurjar, R.C. Precision Agriculture System Using Verilog Hardware Description Language to Design an ASIC. In Proceedings of the 2019 3rd International Conference on Electronics, Materials Engineering & Nano-Technology (IEMENTech), Kolkata, India, 29–31 August 2019; pp. 1–6. [Google Scholar]
- Vandana, B.; Kumar, S.S. A novel approach using big data analytics to improve the crop yield in precision agriculture. In Proceedings of the 2018 3rd IEEE International Conference on Recent Trends in Electronics, Information & Communication Technology (RTEICT), Bangalore, India, 18–19 May 2018; pp. 824–827. [Google Scholar]
- Wang, X.; Qi, Q. Design and realization of precision agriculture information system based on 5S. In Proceedings of the 2011 19th International Conference on Geoinformatics, Shanghai, China, 24–26 June 2011; pp. 1–4. [Google Scholar]
- Ranaweera, H.M.B.P.; Rathnayake, R.M.G.H.N.; Ananda, A.S.G.J.K. Crop Price Prediction Using Machine Learning Approaches: Reference to the Sri Lankan Vegetable Market. J. Manag. Matters 2023, 10, 19–34. [Google Scholar] [CrossRef] [Scilit]
- Bondre, D.A.; Mahagaonkar, S. Prediction of crop yield and fertilizer recommendation using machine learning algorithms. Int. J. Eng. Appl. Sci. Technol. 2019, 4, 371–376. [Google Scholar] [CrossRef] [Scilit]
- Thilakarathne, N.N.; Bakar, M.S.A.; Abas, P.E.; Yassin, H. A cloud enabled crop recommendation platform for machine learning-driven precision farming. Sensors 2022, 22, 6299. [Google Scholar] [CrossRef] [Scilit] [PubMed]
- Sonobe, R.; Tani, H.; Wang, X.; Kobayashi, N.; Shimamura, H. Random forest classification of crop type using multi-temporal TerraSAR-X dual-polarimetric data. Remote Sens. Lett. 2014, 5, 157–164. [Google Scholar] [CrossRef] [Scilit]
- Priyadharshini, A.; Chakraborty, S.; Kumar, A.; Pooniwala, O.R. Intelligent crop recommendation system using machine learning. In Proceedings of the 2021 5th International Conference on Computing Methodologies and Communication (ICCMC), Erode, India, 8–10 April 2021; pp. 843–848. [Google Scholar]
- Rajković, D.; Marjanović Jeromela, A.; Pezo, L.; Lončar, B.; Zanetti, F.; Monti, A.; Kondić Špika, A. Yield and quality prediction of winter rapeseed—Artificial neural network and random forest models. Agronomy 2021, 12, 58. [Google Scholar] [CrossRef] [Scilit]
- Bhattacharyya, D.; Joshua, E.S.N.; Rao, N.T.; Kim, T.H. Hybrid CNN-SVC Classifier Approaches to Process Semi-Structured Data in Sugarcane Yield Forecasting Production. Agronomy 2023, 13, 1169. [Google Scholar] [CrossRef] [Scilit]
- Rajak, R.K.; Pawar, A.; Pendke, M.; Shinde, P.; Rathod, S.; Devare, A. Crop recommendation system to maximize crop yield using machine learning technique. Int. Res. J. Eng. Technol. 2017, 4, 950–953. [Google Scholar]
- Keerthana, M.; Meghana, K.J.M.; Pravallika, S.; Kavitha, M. An ensemble algorithm for crop yield prediction. In Proceedings of the 2021 Third International Conference on Intelligent Communication Technologies and Virtual Mobile Networks (ICICV), Tirunelveli, India, 4–6 February 2021; pp. 963–970. [Google Scholar]
- Panigrahi, B.; Kathala, K.C.R.; Sujatha, M. A machine learning-based comparative approach to predict the crop yield using supervised learning with regression models. Procedia Comput. Sci. 2023, 218, 2684–2693. [Google Scholar] [CrossRef] [Scilit]
- Garg, D.; Alam, M. An effective crop recommendation method using machine learning techniques. Int. J. Adv. Technol. Eng. Explor. 2023, 10, 498. [Google Scholar]
- Shankar, P.; Pareek, P.; Patel, M.U.; Sen, M.C. Crops Prediction Based on Environmental Factors Using Machine Learning Algorithm. Cent. Dev. Econ. Stud. 2022, 9, 127–137. [Google Scholar]
- Escorcia-Gutierrez, J.; Gamarra, M.; Soto-Diaz, R.; Pérez, M.; Madera, N.; Mansour, R.F. Intelligent agricultural modelling of soil nutrients and pH classification using ensemble deep learning techniques. Agriculture 2022, 12, 977. [Google Scholar] [CrossRef] [Scilit]
- Pandey, V.; Choudhary, K.K.; Murthy, C.S.; Poddar, M.K. Improved In-Season Crop Classification Performance Using Ensemble Learning Technique: A Case Study of Lekoda Insurance Unit, Ujjain, Madhya Pradesh. Int. Arch. Photogramm. Remote Sens. Spat. Inf. Sci. 2019, 42, 477–481. [Google Scholar] [CrossRef] [Scilit]
- Dhanavel, S.; Murugan, A. A Study on Variable Selections and Prediction for Crop Recommender System with Soil Nutrients Using Stochastic Model and Machine Learning Approaches. Tuijin Jishu/J. Propuls. Technol. 2023, 44, 1126–1137. [Google Scholar]
- Reddy, J.; Devi, S.S.; Parvatham, S.D.; Vishal, K.S. Optimizing Crop Forecasts: Leveraging Feature Selection and Ensemble Methods. Turk. J. Comput. Math. Educ. (TURCOMAT) 2023, 14, 1062–1071. [Google Scholar]
- Sharma, N.; Dutta, M. Yield Prediction and Recommendation of Crops in the Northeastern Region Using Machine Learning Regression Models. Yuz. Yıl Univ. J. Agric. Sci. 2023, 33, 700–708. [Google Scholar] [CrossRef] [Scilit]
- Gosai, D.; Raval, C.; Nayak, R.; Jayswal, H.; Patel, A. Crop recommendation system using machine learning. Int. J. Sci. Res. Comput. Sci. Eng. Inf. Technol. 2021, 7, 558–569. [Google Scholar] [CrossRef] [Scilit]
- Bandara, P.; Weerasooriya, T.; Ruchirawya, T.; Nanayakkara, W.; Dimantha, M.; Pabasara, M. Crop recommendation system. Int. J. Comput. Appl. 2020, 975, 8887. [Google Scholar] [CrossRef] [Scilit]
- Dubey, D.; Gupta, N.; Gupta, S.; Gour, S. Crop Recommendation System for Madhya Pradesh Districts using Machine Learning. Int. J. Innov. Sci. Res. Technol. 2023, 8, 2059–2062. [Google Scholar]
- Sundari, V.; Anusree, M.; Swetha, U. Crop recommendation and yield prediction using machine learning algorithms. World J. Adv. Res. Rev. 2022, 14, 452–459. [Google Scholar] [CrossRef] [Scilit]
- Kedlaya, A.; Sana, A.; Bhat, B.A.; Kumar, S.; Bhat, N. An efficient algorithm for predicting crop using historical data and pattern matching technique. Glob. Transit. Proc. 2021, 2, 294–298. [Google Scholar]
- Bhatnagar, K.; Jaahnavi, M.; Barathi, B.A. Agriculture Crop Recommendation System using Machine-Learning. Math. Stat. Eng. Appl. 2022, 71, 626–637. [Google Scholar]
- Reyana, A.; Kautish, S.; Karthik, P.S.; Al-Baltah, I.A.; Jasser, M.B.; Mohamed, A.W. Accelerating Crop Yield: Multisensor Data Fusion and Machine Learning for Agriculture Text Classification. IEEE Access 2023, 11, 20795–20805. [Google Scholar] [CrossRef] [Scilit]
- Eddaoudi, R.; Alaoui, A.; Ettaki, B.; Zerouaoui, J. A Predictive Approach to Improving Agricultural Productivity in Morocco through Crop Recommendations. Int. J. Adv. Comput. Sci. Appl. 2023, 14, 199–205. [Google Scholar]
- Islam, M.R.; Oliullah, K.; Kabir, M.M.; Alom, M.; Mridha, M.F. Machine learning enabled IoT system for soil nutrients monitoring and crop recommendation. J. Agric. Food Res. 2023, 14, 100880. [Google Scholar] [CrossRef] [Scilit]
- Bhuyan, S.; Patgiri, D.K.; Medhi, S.J.; Patel, R.; Abonmai, T. Machine Learning-based Crop Recommendation System in Biswanath District of Assam. Biol. Forum Int. J. 2023, 15, 417–421. [Google Scholar]
- Dahiphale, D.; Shinde, P.; Patil, K.; Dahiphale, V. Smart Farming: Crop Recommendation using Machine Learning with Challenges and Future Ideas. TechRxiv 2023. [Google Scholar] [CrossRef]
- Durai, S.K.S.; Shamili, M.D. Smart farming using machine learning and deep learning techniques. Decis. Anal. J. 2022, 3, 100041. [Google Scholar] [CrossRef] [Scilit]
- Pande, S.M.; Ramesh, P.K.; Anmol, A.; Aishwarya, B.R.; Rohilla, K.; Shaurya, K. Crop recommender system using machine learning approach. In Proceedings of the 2021 5th International Conference on Computing Methodologies and Communication (ICCMC), Erode, India, 8–10 April 2021; pp. 1066–1071. [Google Scholar]
- Katarya, R.; Raturi, A.; Mehndiratta, A.; Thapper, A. Impact of machine learning techniques in precision agriculture. In Proceedings of the 2020 3rd International Conference on Emerging Technologies in Computer Engineering: Machine Learning and Internet of Things (ICETCE), Jaipur, India, 7–8 February 2020; pp. 1–6. [Google Scholar]
- Ashoka, D.V.; Bv, A.P. IMLAPC: Interfused Machine Learning Approach for Prediction of Crops. Rev. D’intell. Artif. 2022, 36, 169. [Google Scholar]
- Kawakura, S.; Hirafuji, M.; Ninomiya, S.; Shibasaki, R. Analyses of diverse agricultural worker data with explainable artificial intelligence: Xai based on shap, lime, and lightgbm. Eur. J. Agric. Food Sci. 2022, 4, 11–19. [Google Scholar] [CrossRef] [Scilit]
- Mostafa, S.; Mondal, D.; Panjvani, K.; Kochian, L.; Stavness, I. Explainable deep learning in plant phenotyping. Front. Artif. Intell. 2023, 6, 1203546. [Google Scholar] [CrossRef] [Scilit] [PubMed]
- Kawakura, S.; Hirafuji, M.; Ninomiya, S.; Shibasaki, R. Adaptations of Explainable Artificial Intelligence (XAI) to Agricultural Data Models with ELI5, PDPbox, and Skater using Diverse Agricultural Worker Data. Eur. J. Artif. Intell. Mach. Learn. 2022, 1, 27–34. [Google Scholar] [CrossRef] [Scilit]
- Ryo, M. Explainable artificial intelligence and interpretable machine learning for agricultural data analysis. Artif. Intell. Agric. 2022, 6, 257–265. [Google Scholar]
- Coulibaly, S.; Kamsu-Foguem, B.; Kamissoko, D.; Traore, D. Explainable deep convolutional neural networks for insect pest recognition. J. Clean. Prod. 2022, 371, 133638. [Google Scholar] [CrossRef] [Scilit]
- Iatrou, M.; Karydas, C.; Tseni, X.; Mourelatos, S. Representation Learning with a Variational Autoencoder for Predicting Nitrogen Requirement in Rice. Remote Sens. 2022, 14, 5978. [Google Scholar] [CrossRef] [Scilit]
- Apat, S.K.; Mishra, J.; Raju, K.S.; Padhy, N. An Artificial Intelligence-based Crop Recommendation System using Machine Learning. J. Sci. Ind. Res. (JSIR) 2023, 82, 558–567. [Google Scholar]
- Sabrina, F.; Sohail, S.; Farid, F.; Jahan, S.; Ahamed, F.; Gordon, S. An interpretable artificial intelligence based smart agriculture system. Comput. Mater. Contin. 2022, 72, 3777–3797. [Google Scholar] [CrossRef] [Scilit]
- Paudel, D.; de Wit, A.; Boogaard, H.; Marcos, D.; Osinga, S.; Athanasiadis, I.N. Interpretability of deep learning models for crop yield forecasting. Comput. Electron. Agric. 2023, 206, 107663. [Google Scholar] [CrossRef] [Scilit]
- Batchuluun, G.; Nam, S.H.; Park, K.R. Deep learning-based plant classification and crop disease classification by thermal camera. J. King Saud Univ.-Comput. Inf. Sci. 2022, 34, 10474–10486. [Google Scholar] [CrossRef] [Scilit]
- Rajakumaran, M.; Arulselvan, G.; Subashree, S.; Sindhuja, R. Crop yield prediction using multi-attribute weighted tree-based Support Vector Classifier. Meas. Sens. 2024, 31, 101002. [Google Scholar] [CrossRef] [Scilit]
- Raju, C.; Ashoka, D.V.; Bv, A.P. CropCast: Harvesting the future with interfused machine learning and advanced stacking ensemble for precise crop prediction. Kuwait J. Sci. 2024, 51, 100160. [Google Scholar] [CrossRef] [Scilit]
- Olofintuyi, S.S.; Olajubu, E.A.; Olanike, D. An ensemble deep learning approach for predicting cocoa yield. Heliyon 2023, 9, E15245. [Google Scholar] [CrossRef] [Scilit] [PubMed]
- Bandaiaha, K.; Parvathyb, L.R.; Simats, C. Classification of Fertiliser Type Based on Soil Minerals Using Voting Classification Over Decision Tree. Adv. Parallel Comput. Algorithms Tools Paradig. 2022, 41, 476. [Google Scholar]
- Neupane, J.; Guo, W. Agronomic basis and strategies for precision water management: A review. Agronomy 2019, 9, 87. [Google Scholar] [CrossRef] [Scilit]
- Ishak, M.; Rahaman, M.S.; Mahmud, T. FarmEasy: An intelligent platform to empower crops prediction and crops marketing. In Proceedings of the 2021 13th International Conference on Information & Communication Technology and System (ICTS), Surabaya, Indonesia, 20–21 October 2021; pp. 224–229. [Google Scholar]
- Shams, M.Y.; Gamel, S.A.; Talaat, F.M. Enhancing crop recommendation systems with explainable artificial intelligence: A study on agricultural decision-making. Neural Comput. Appl. 2024, 36, 5695–5714. [Google Scholar] [CrossRef] [Scilit]
- Shook, J.; Gangopadhyay, T.; Wu, L.; Ganapathysubramanian, B.; Sarkar, S.; Singh, A.K. Crop yield prediction integrating genotype and weather variables using deep learning. PLoS ONE 2021, 16, e0252402. [Google Scholar] [CrossRef] [Scilit]
- Wu, J.; Lai, Z.; Chen, S.; Tao, R.; Zhao, P.; Hovakimyan, N. The new agronomists: Language models are experts in crop management. In Proceedings of the IEEE/CVF Conference on Computer Vision and Pattern Recognition, Seattle, WA, USA, 17–21 June 2024; pp. 5346–5356. [Google Scholar]
- Tabar, M.; Lee, D.; Hughes, D.P.; Yadav, A. Mitigating Low Agricultural Productivity of Smallholder Farms in Africa: Time-Series Forecasting for Environmental Stressors. In Proceedings of the AAAI Conference on Artificial Intelligence, Vancouver, BC, Canada, 22 February–1 March 2022; Volume 36, pp. 12608–12614. [Google Scholar]
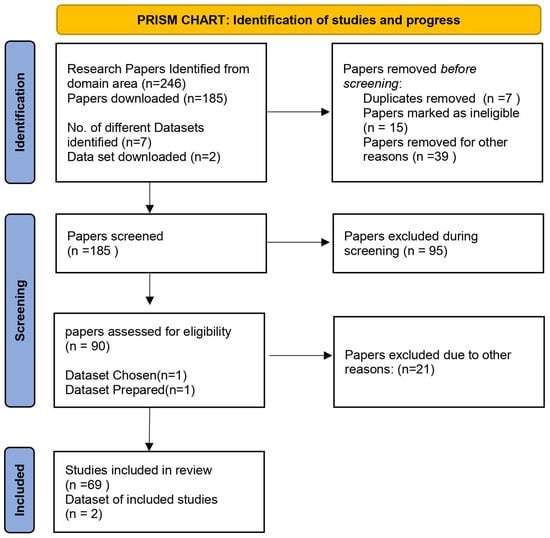
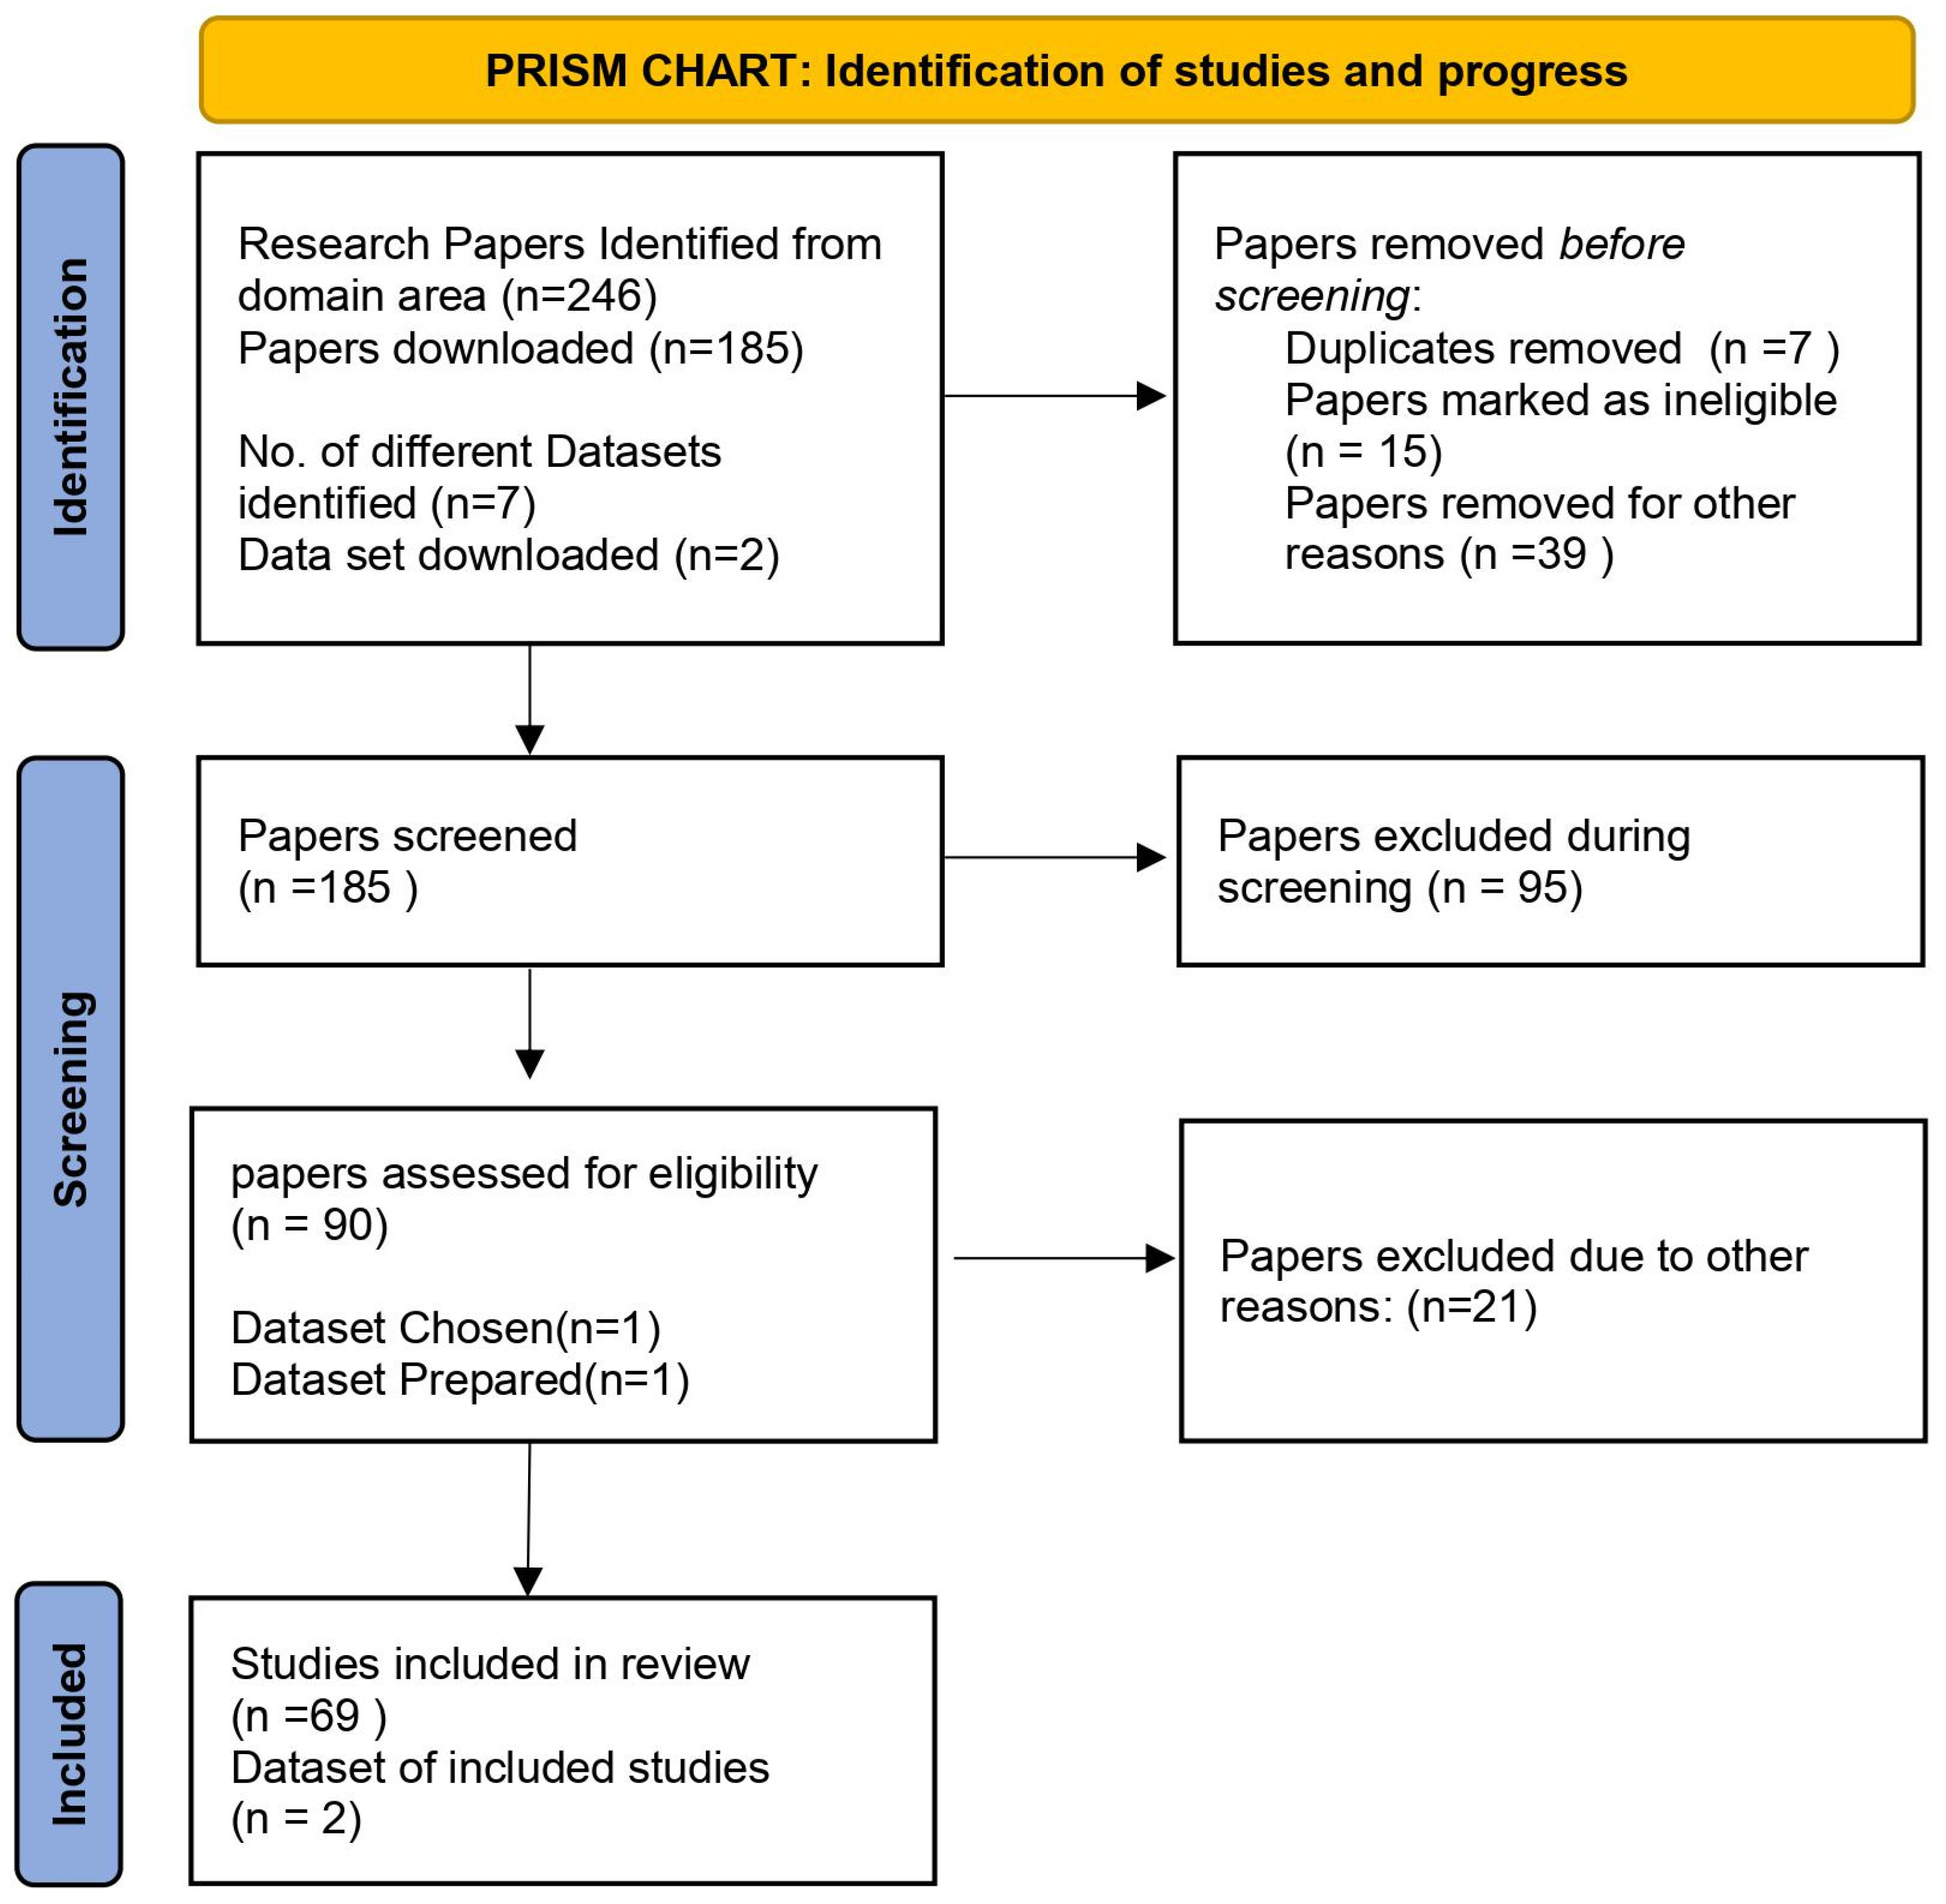
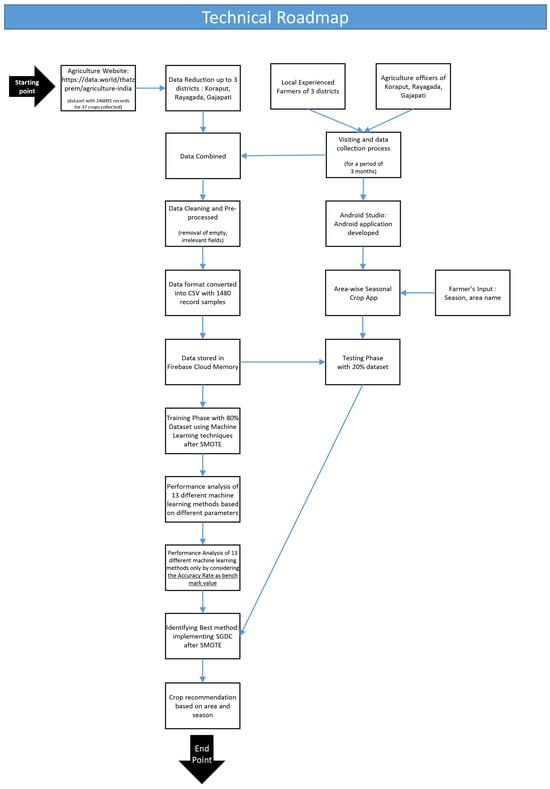
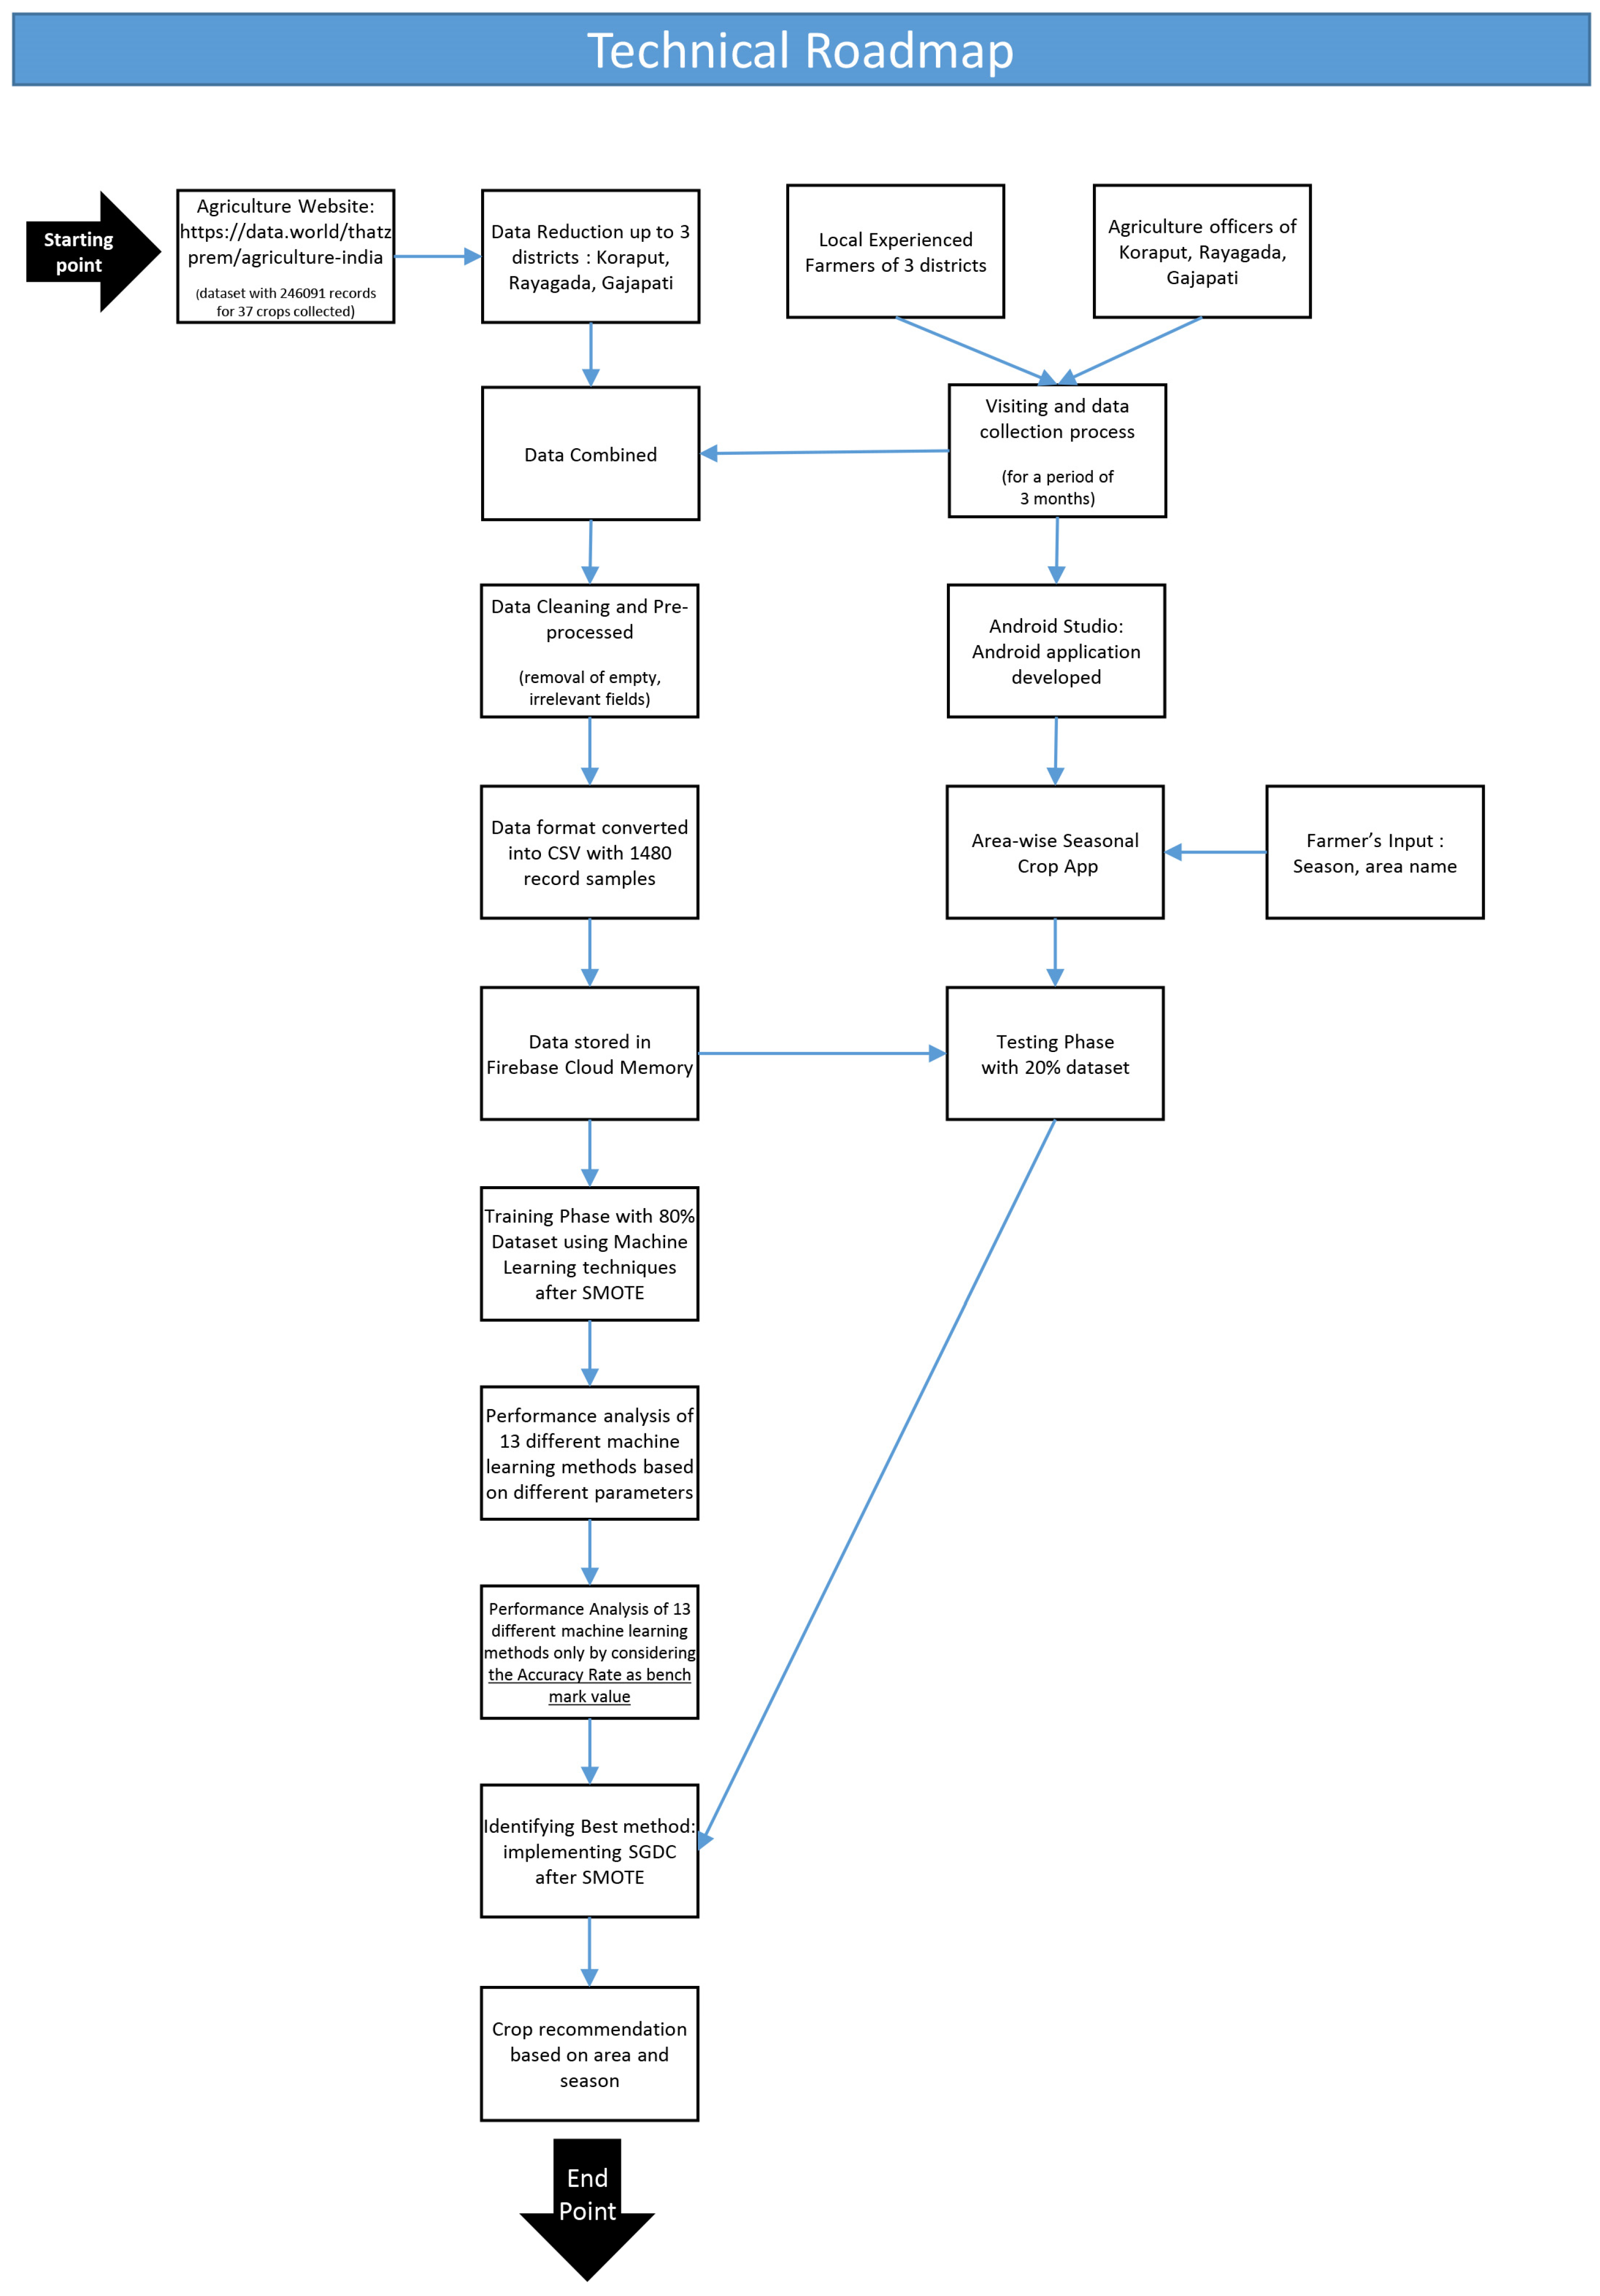
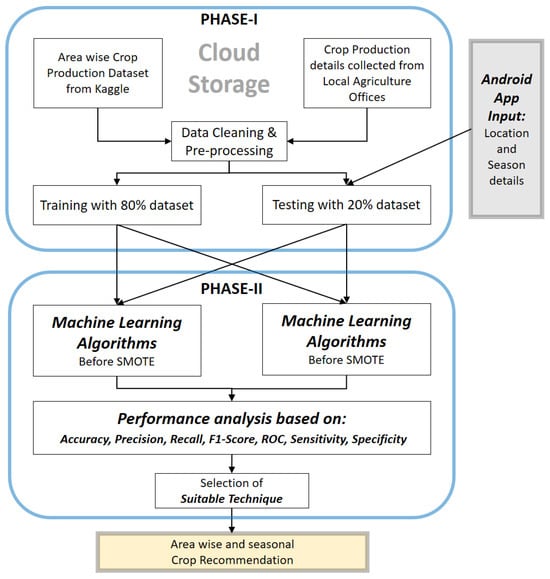
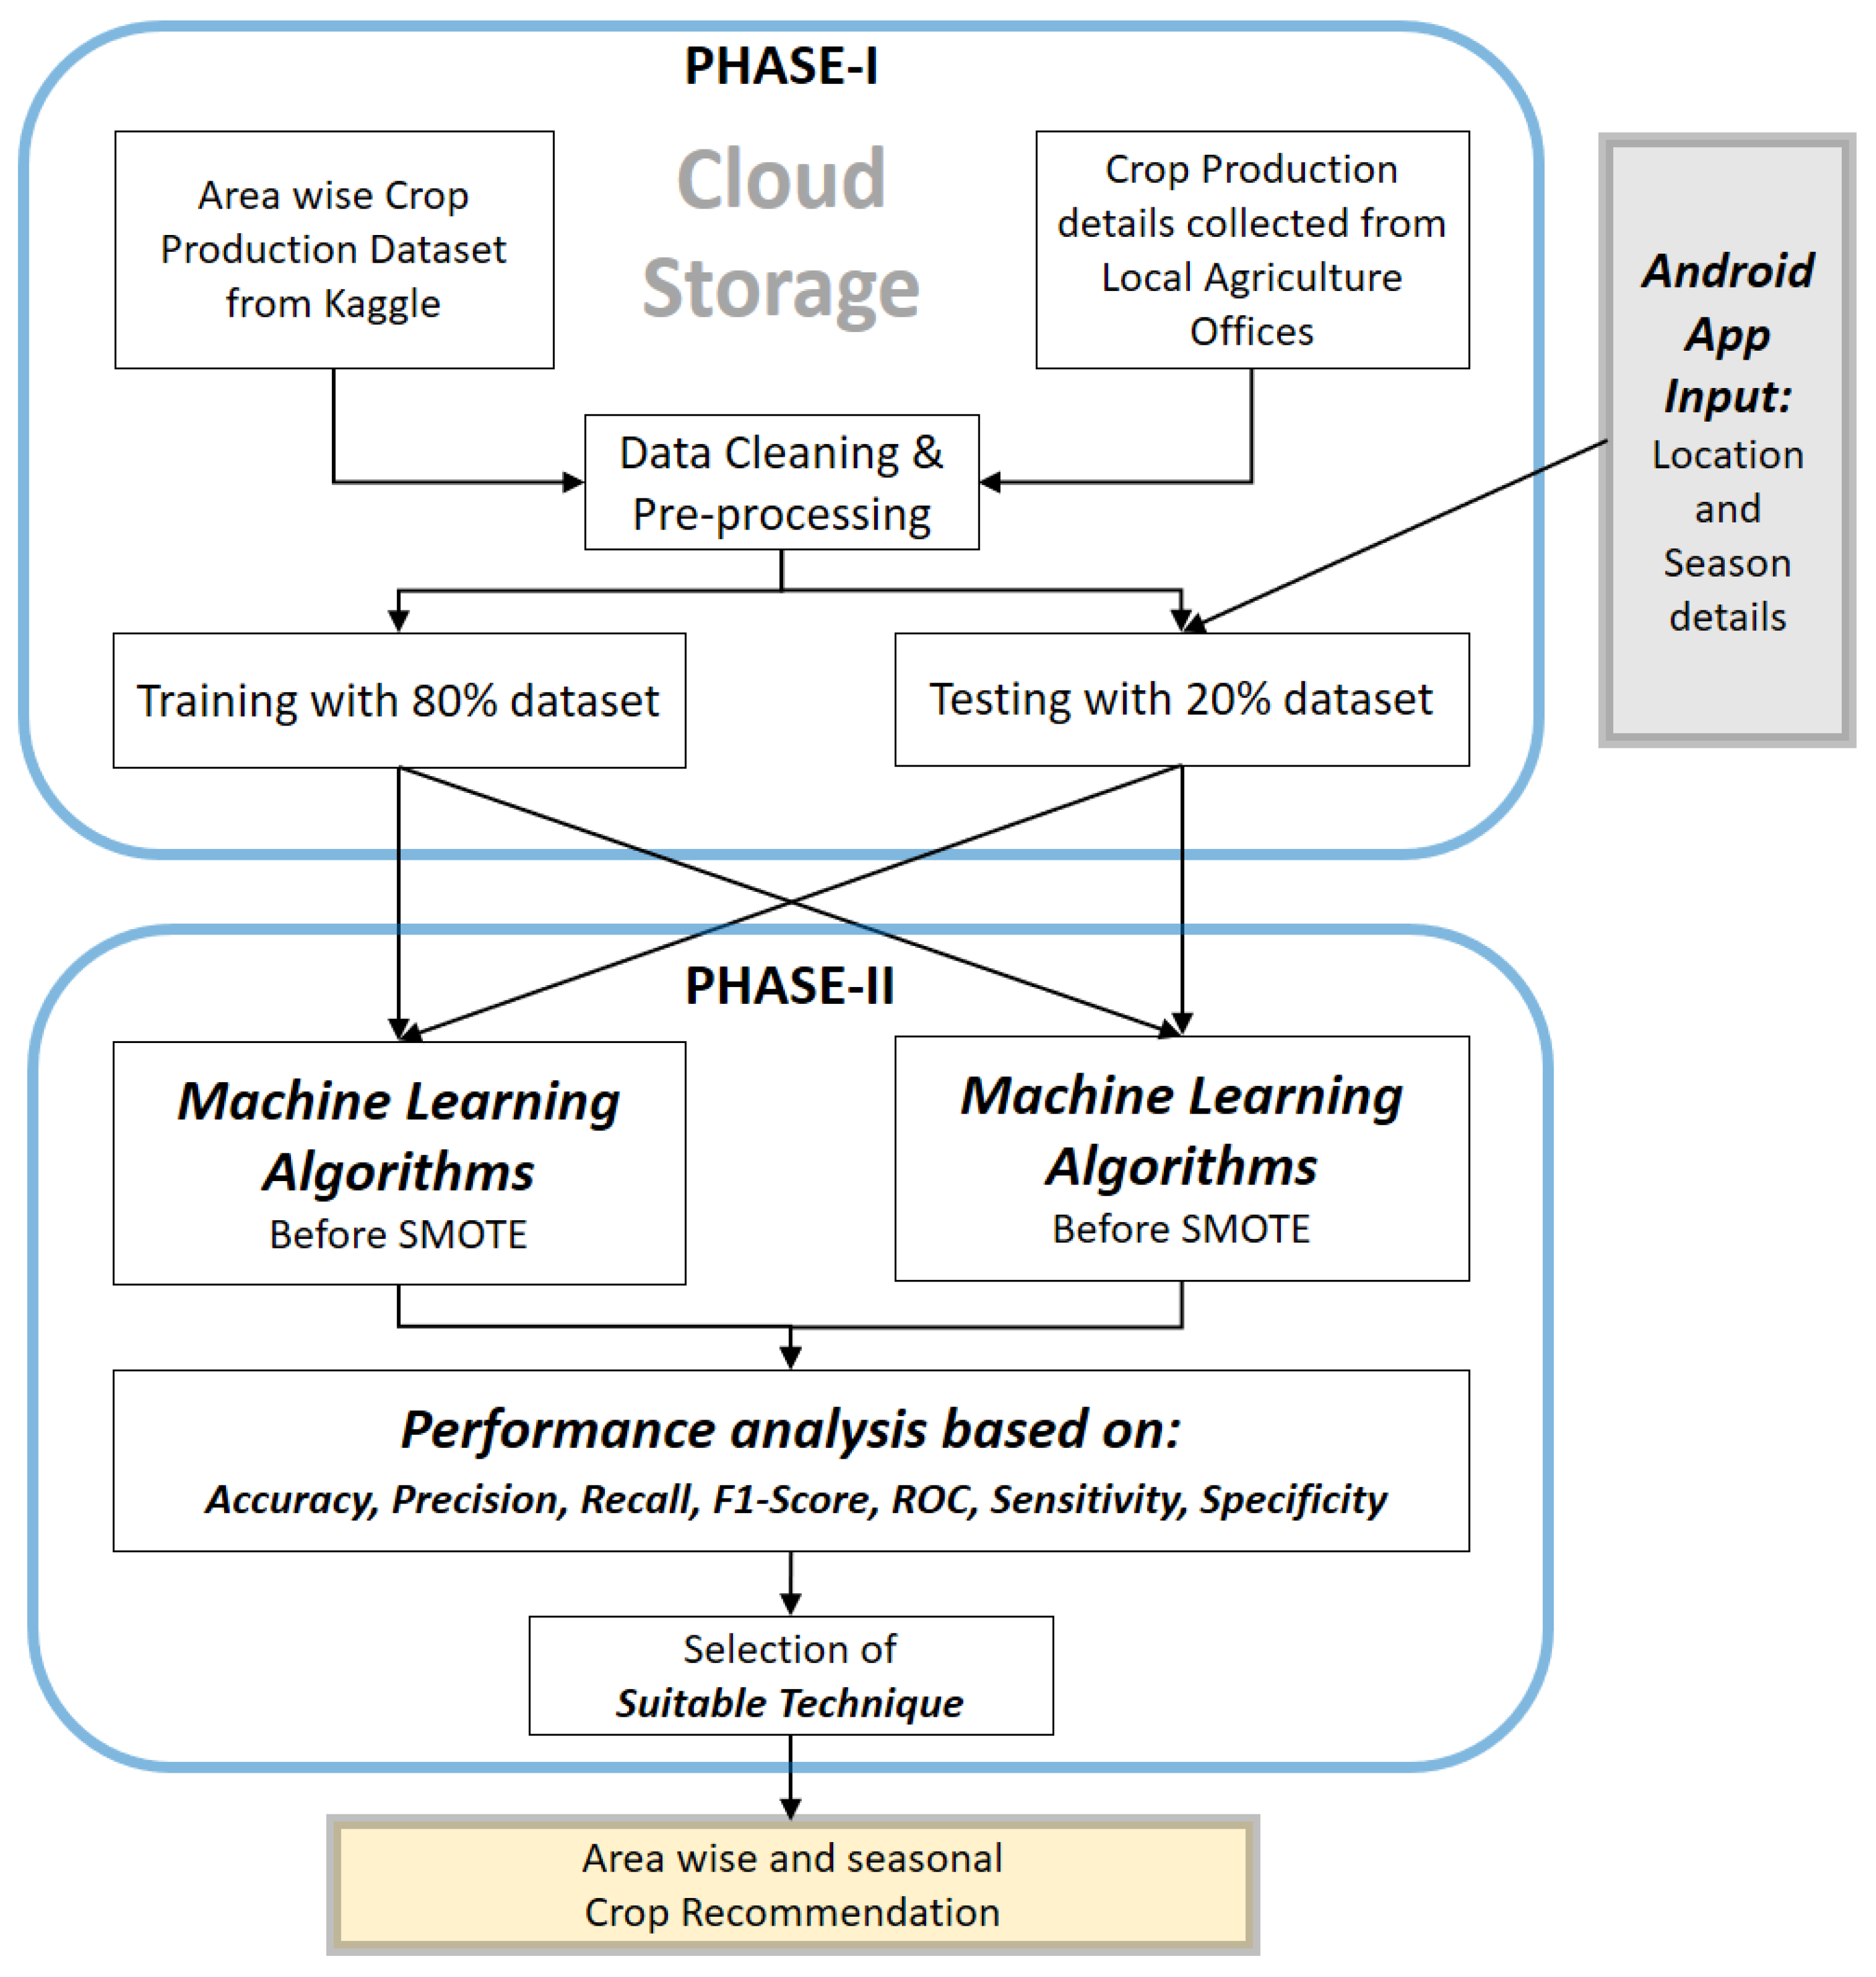
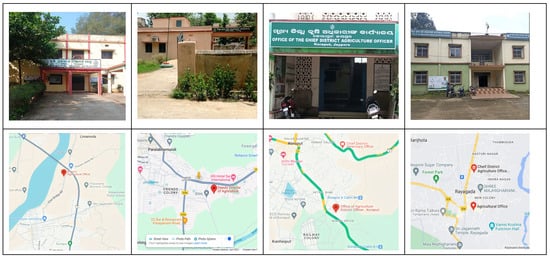
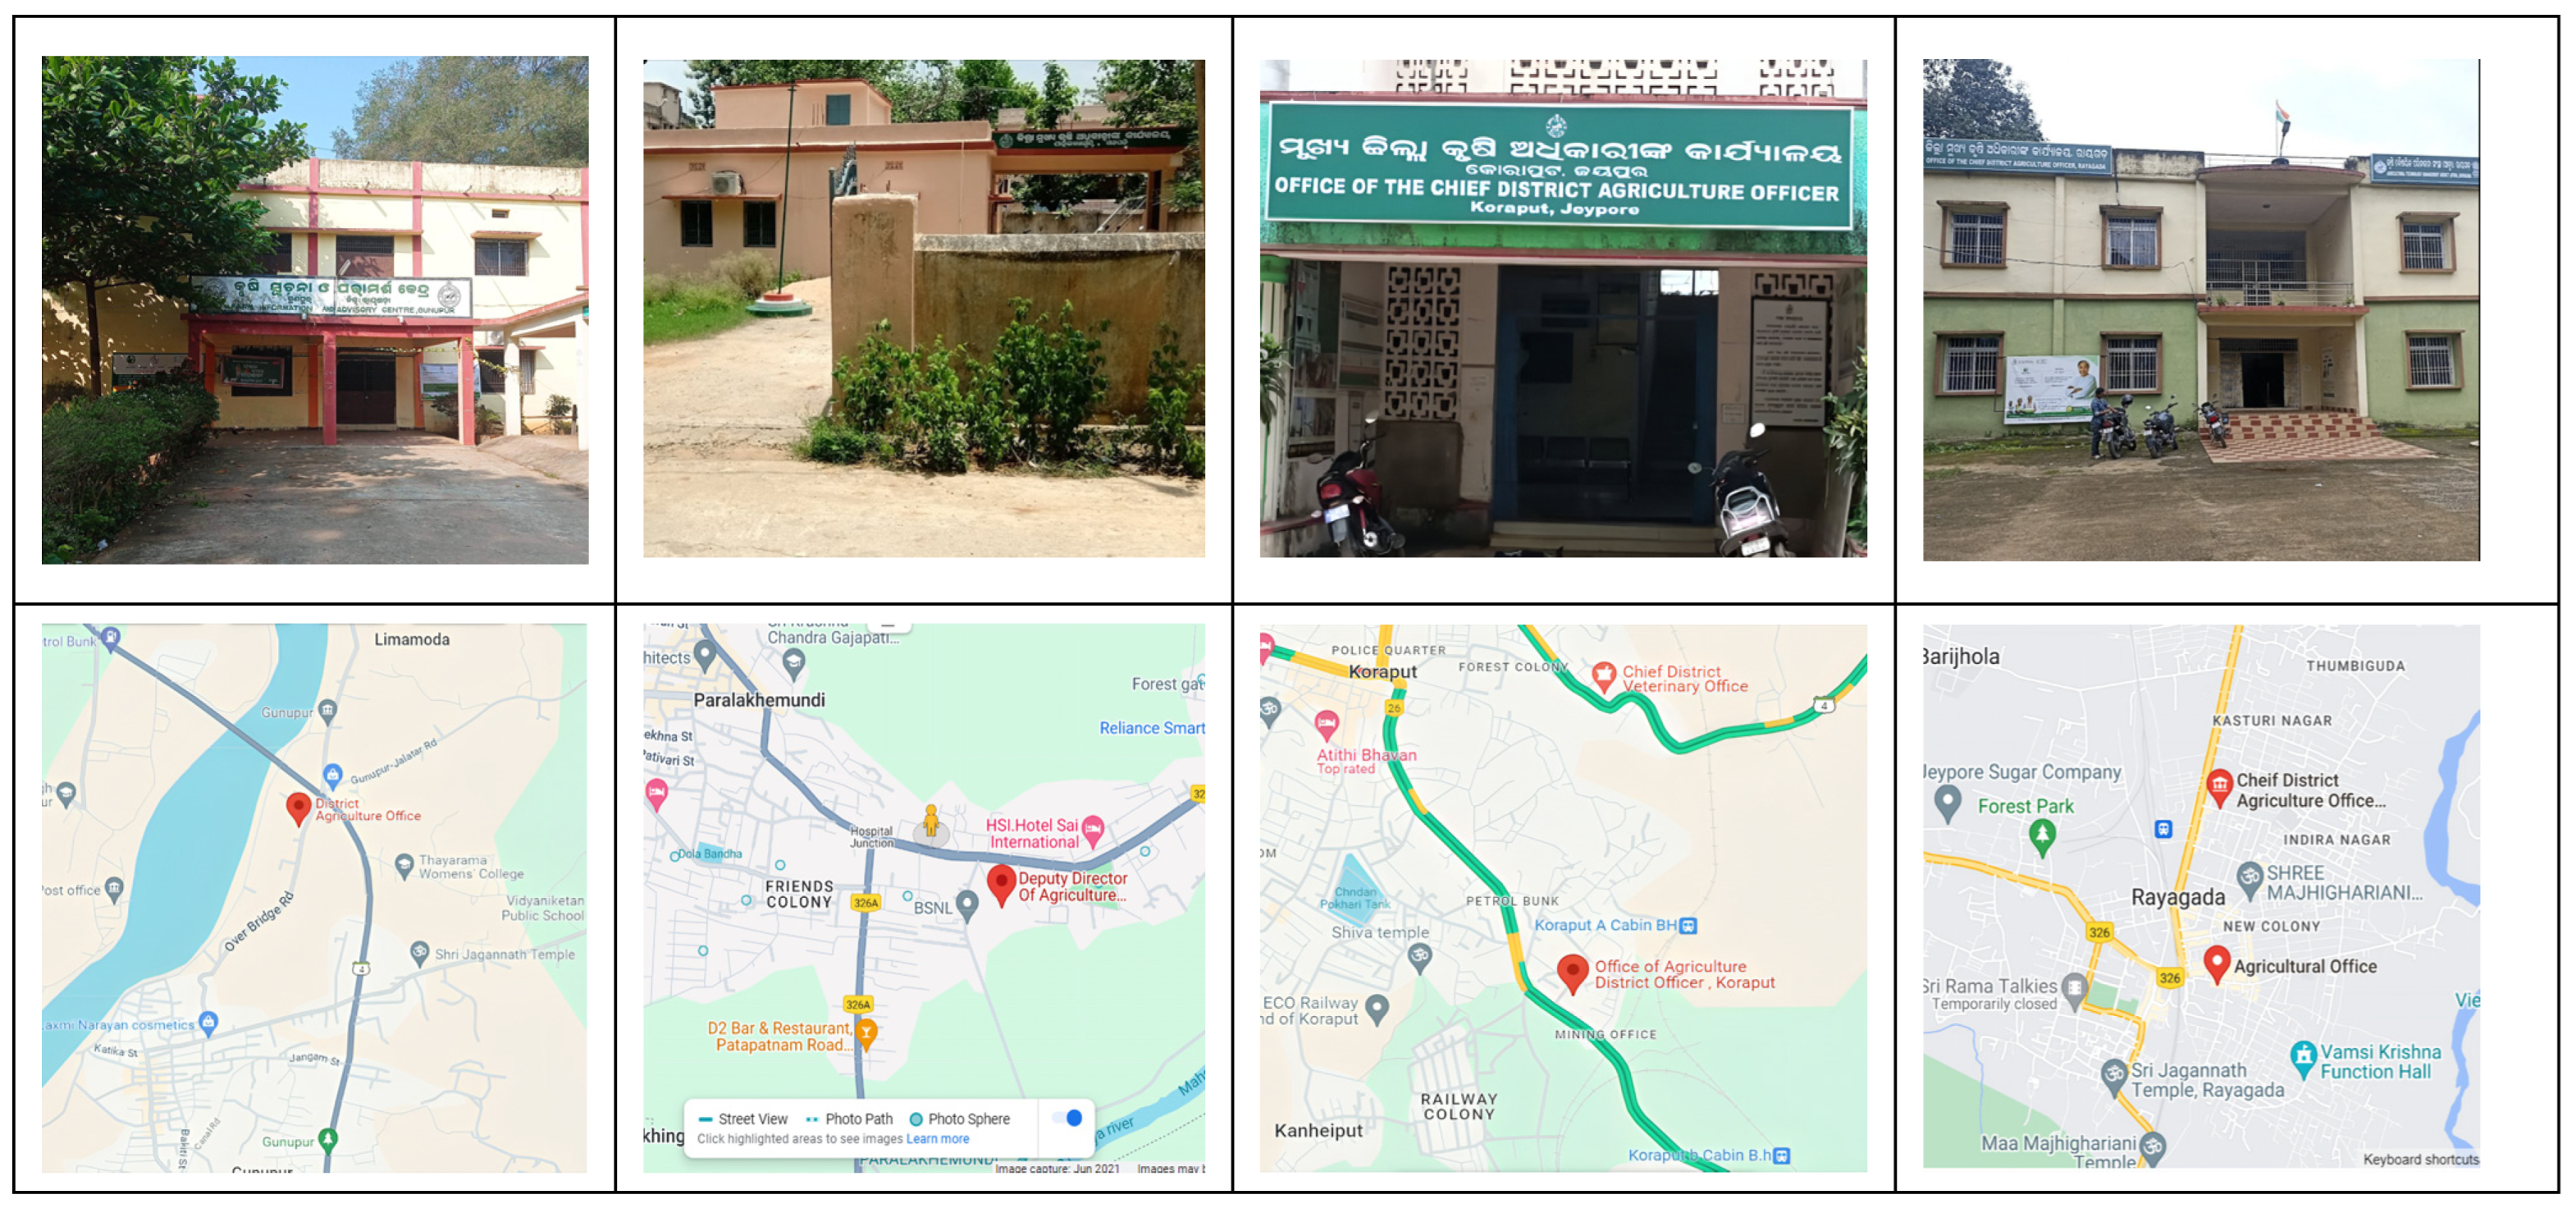
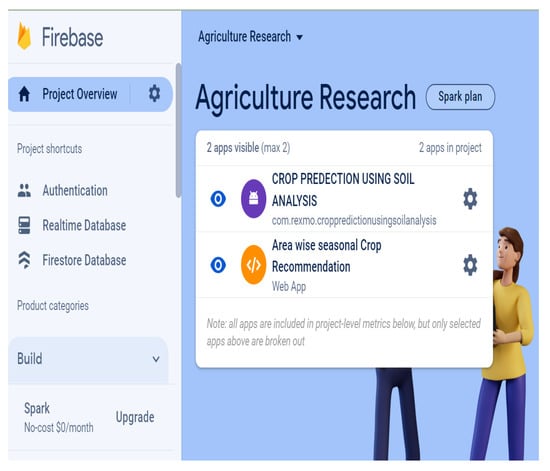
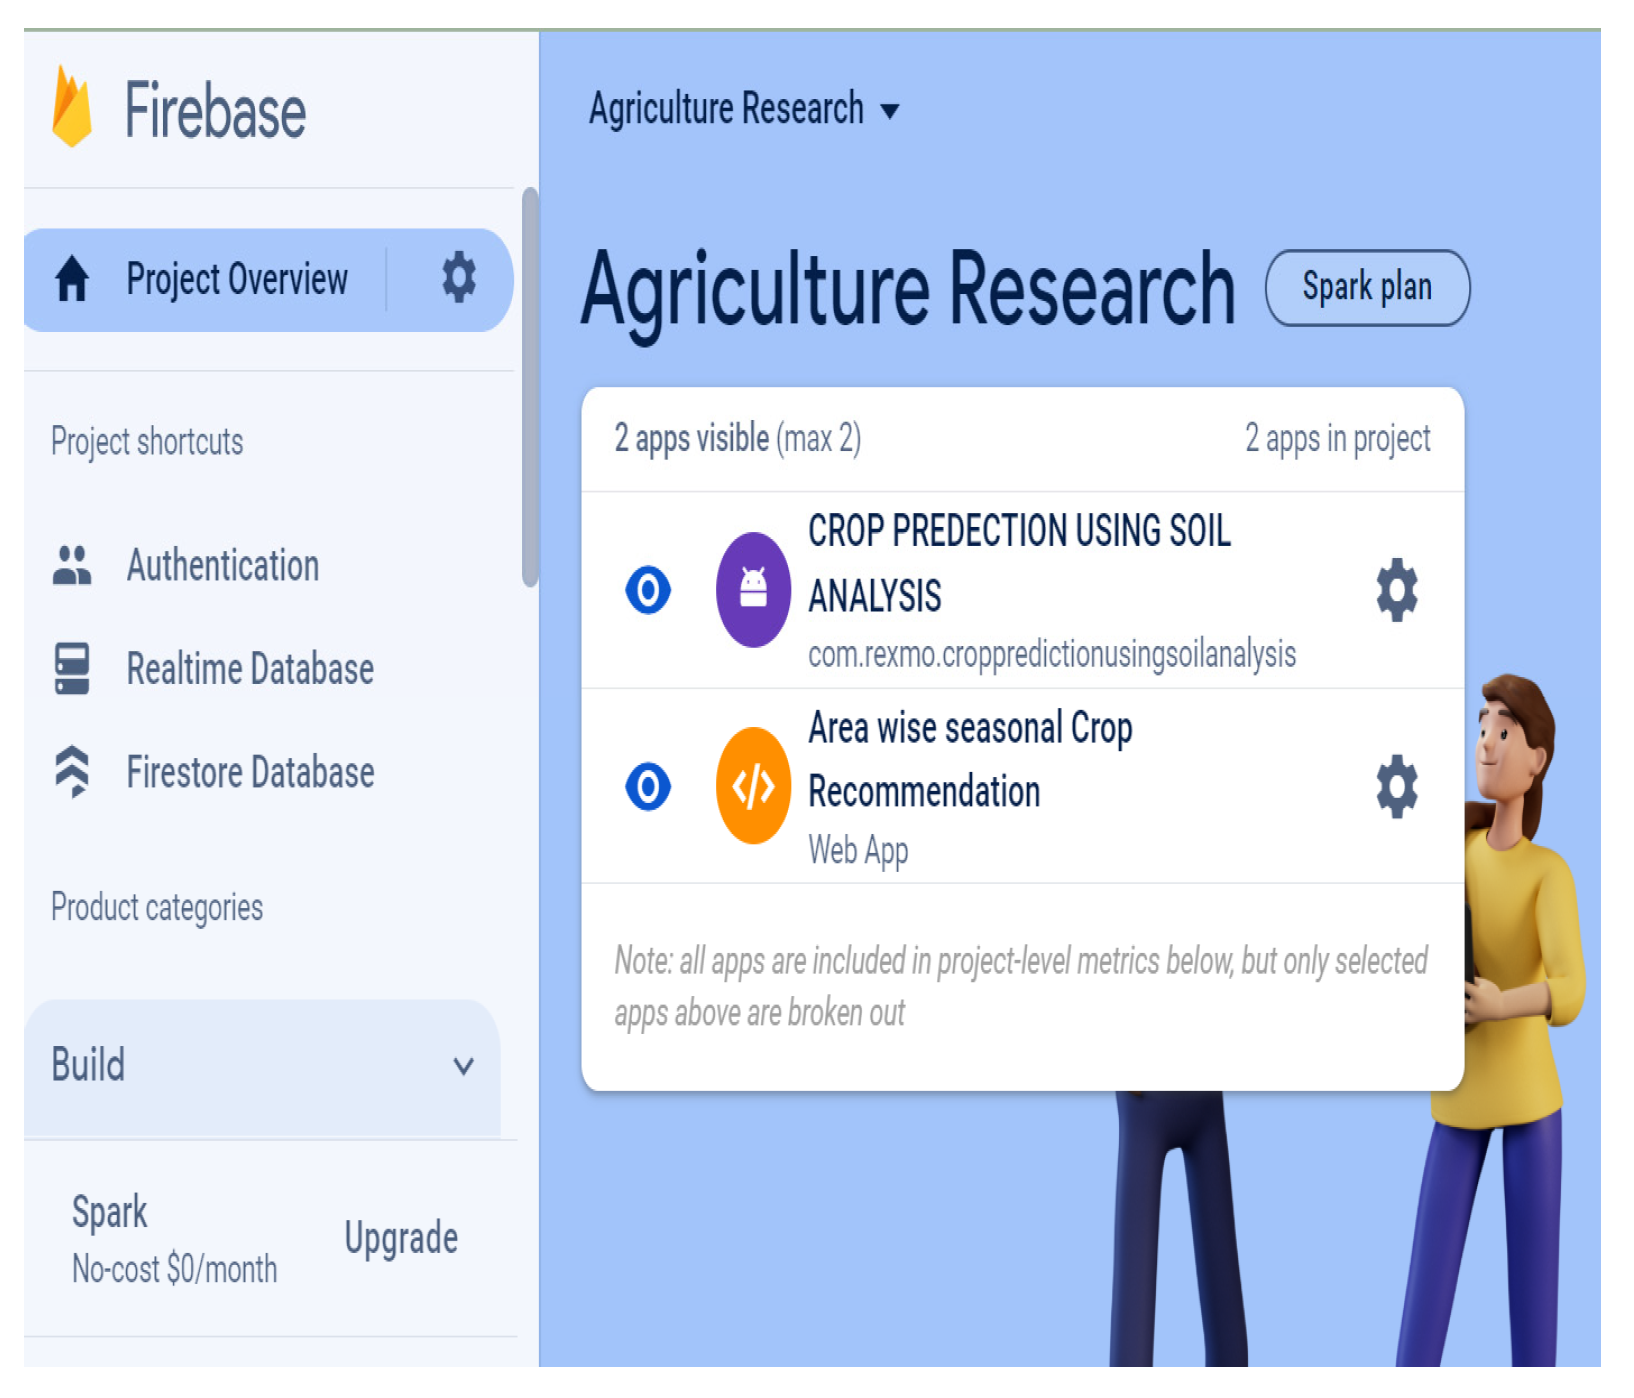
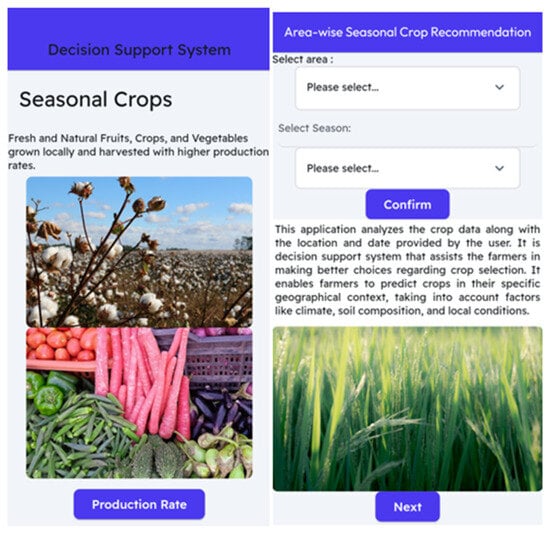
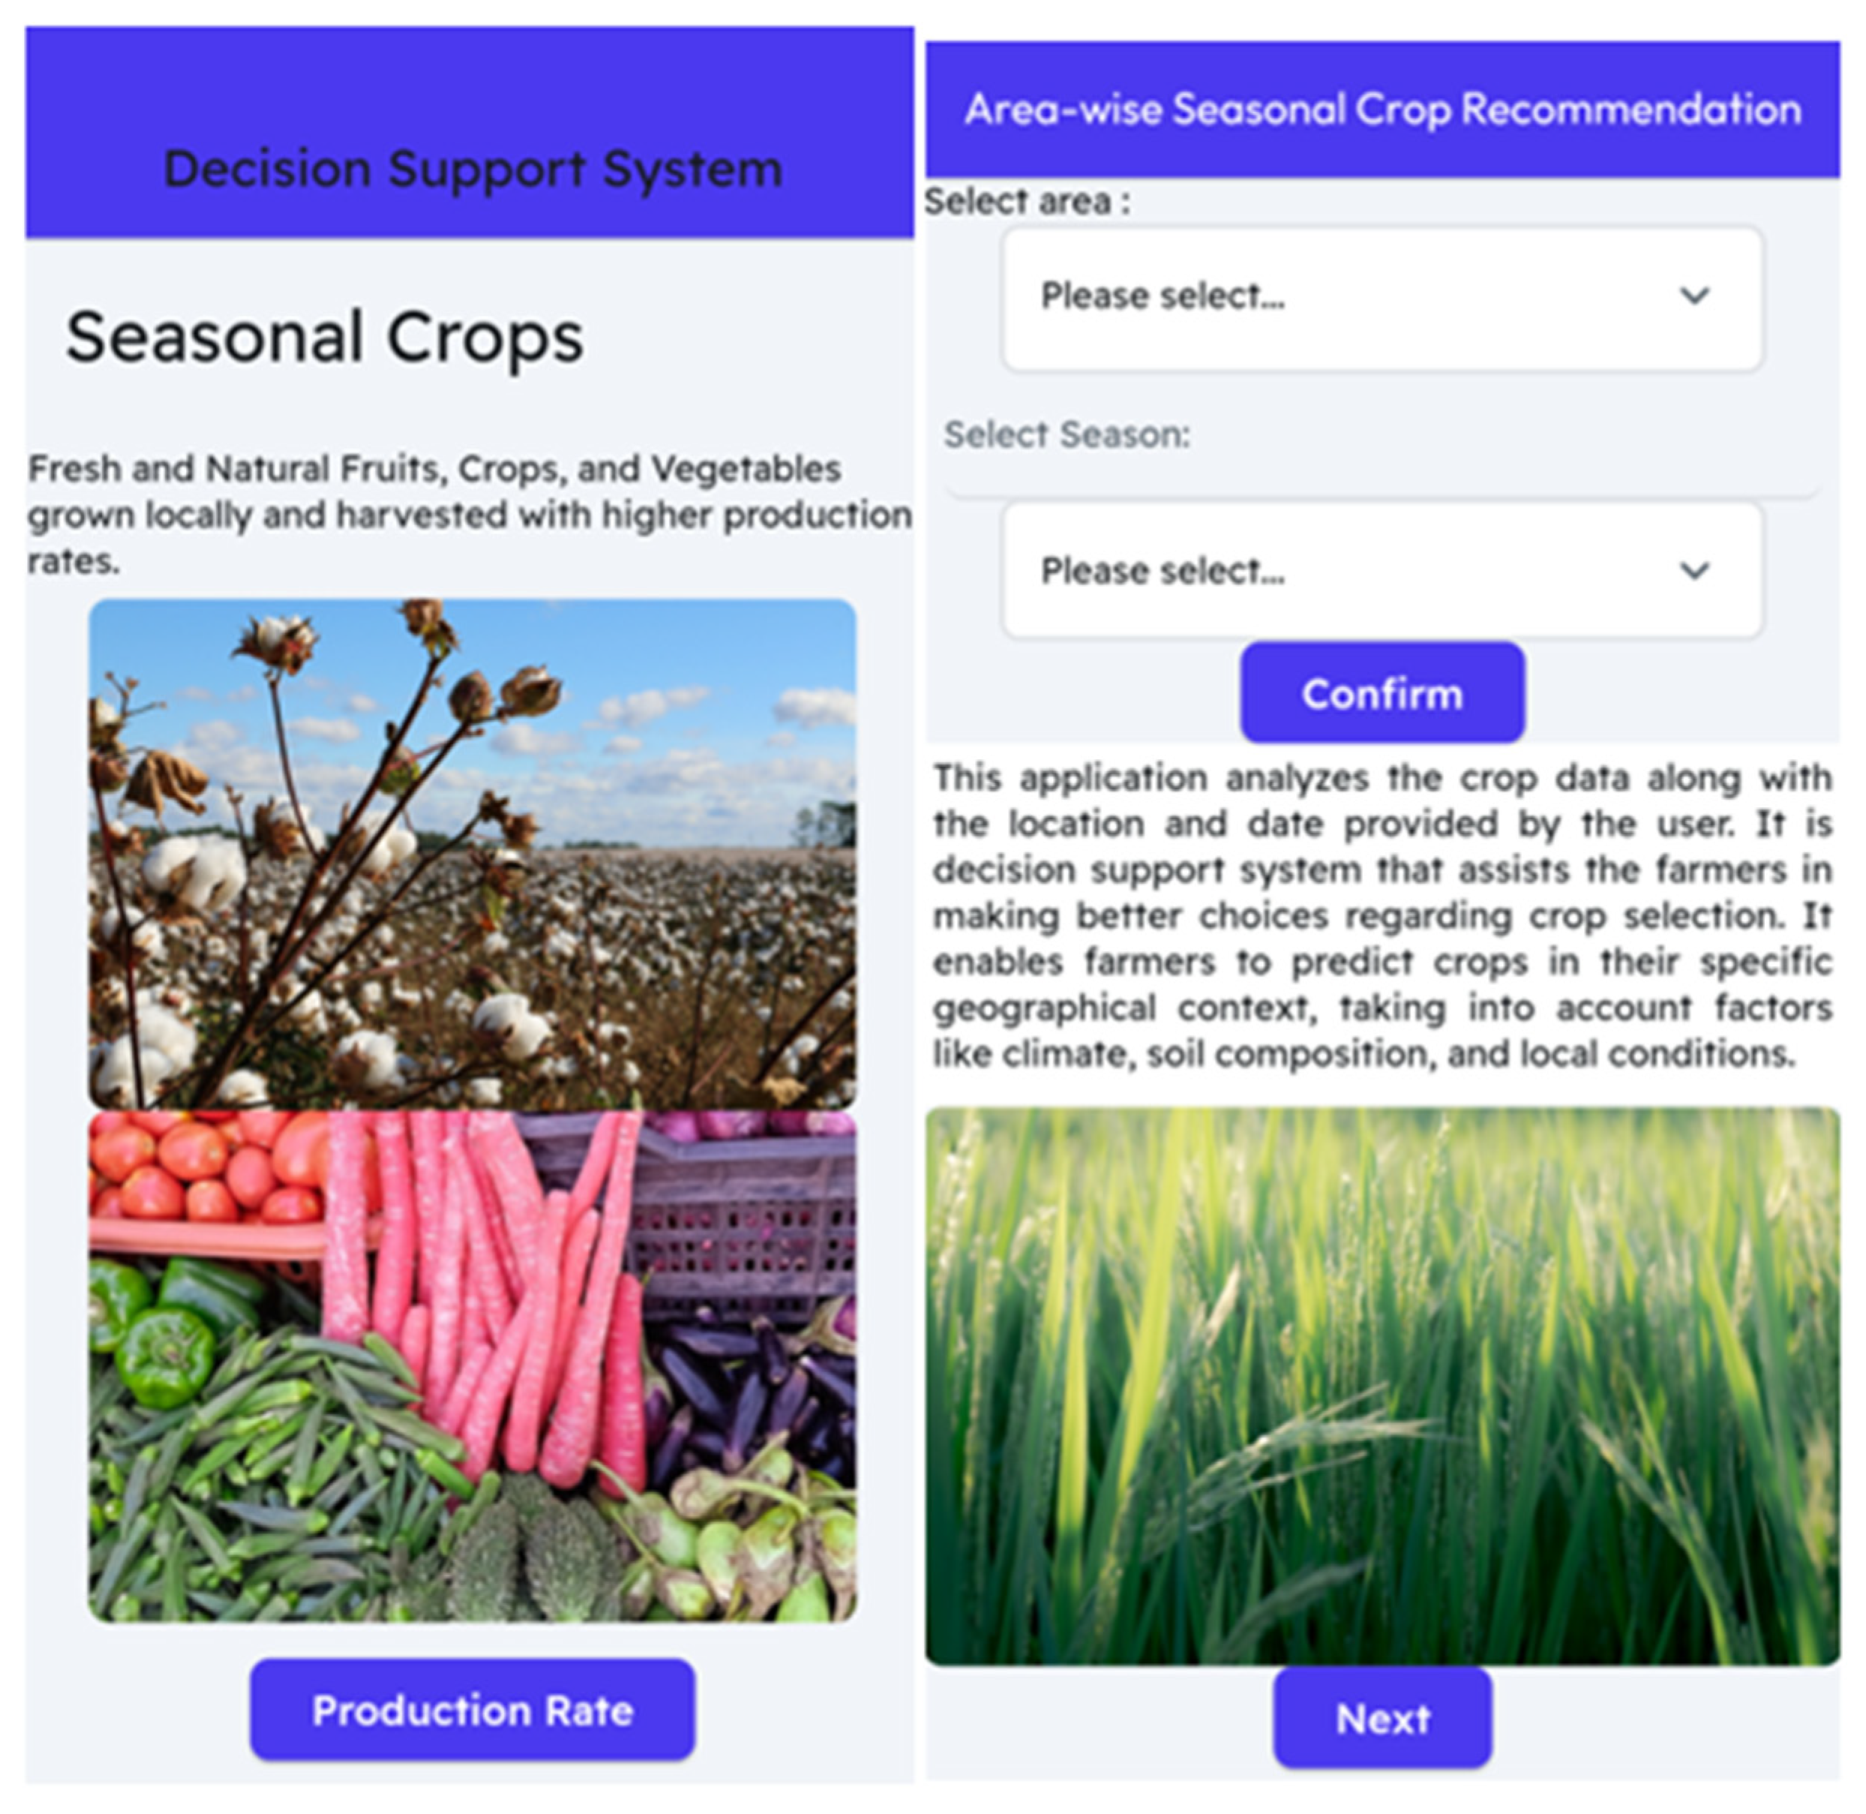
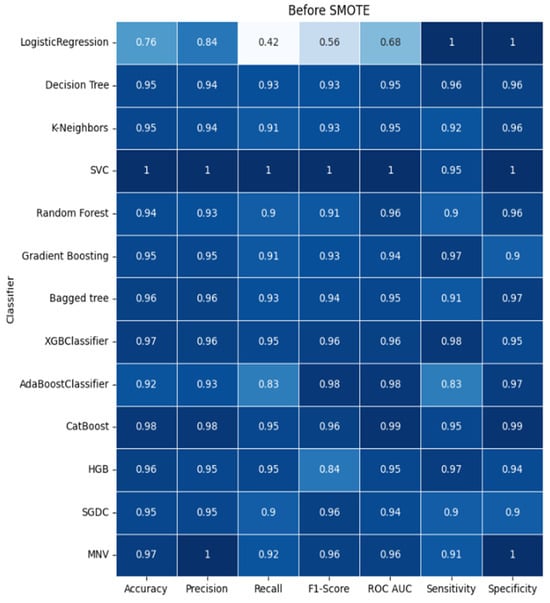
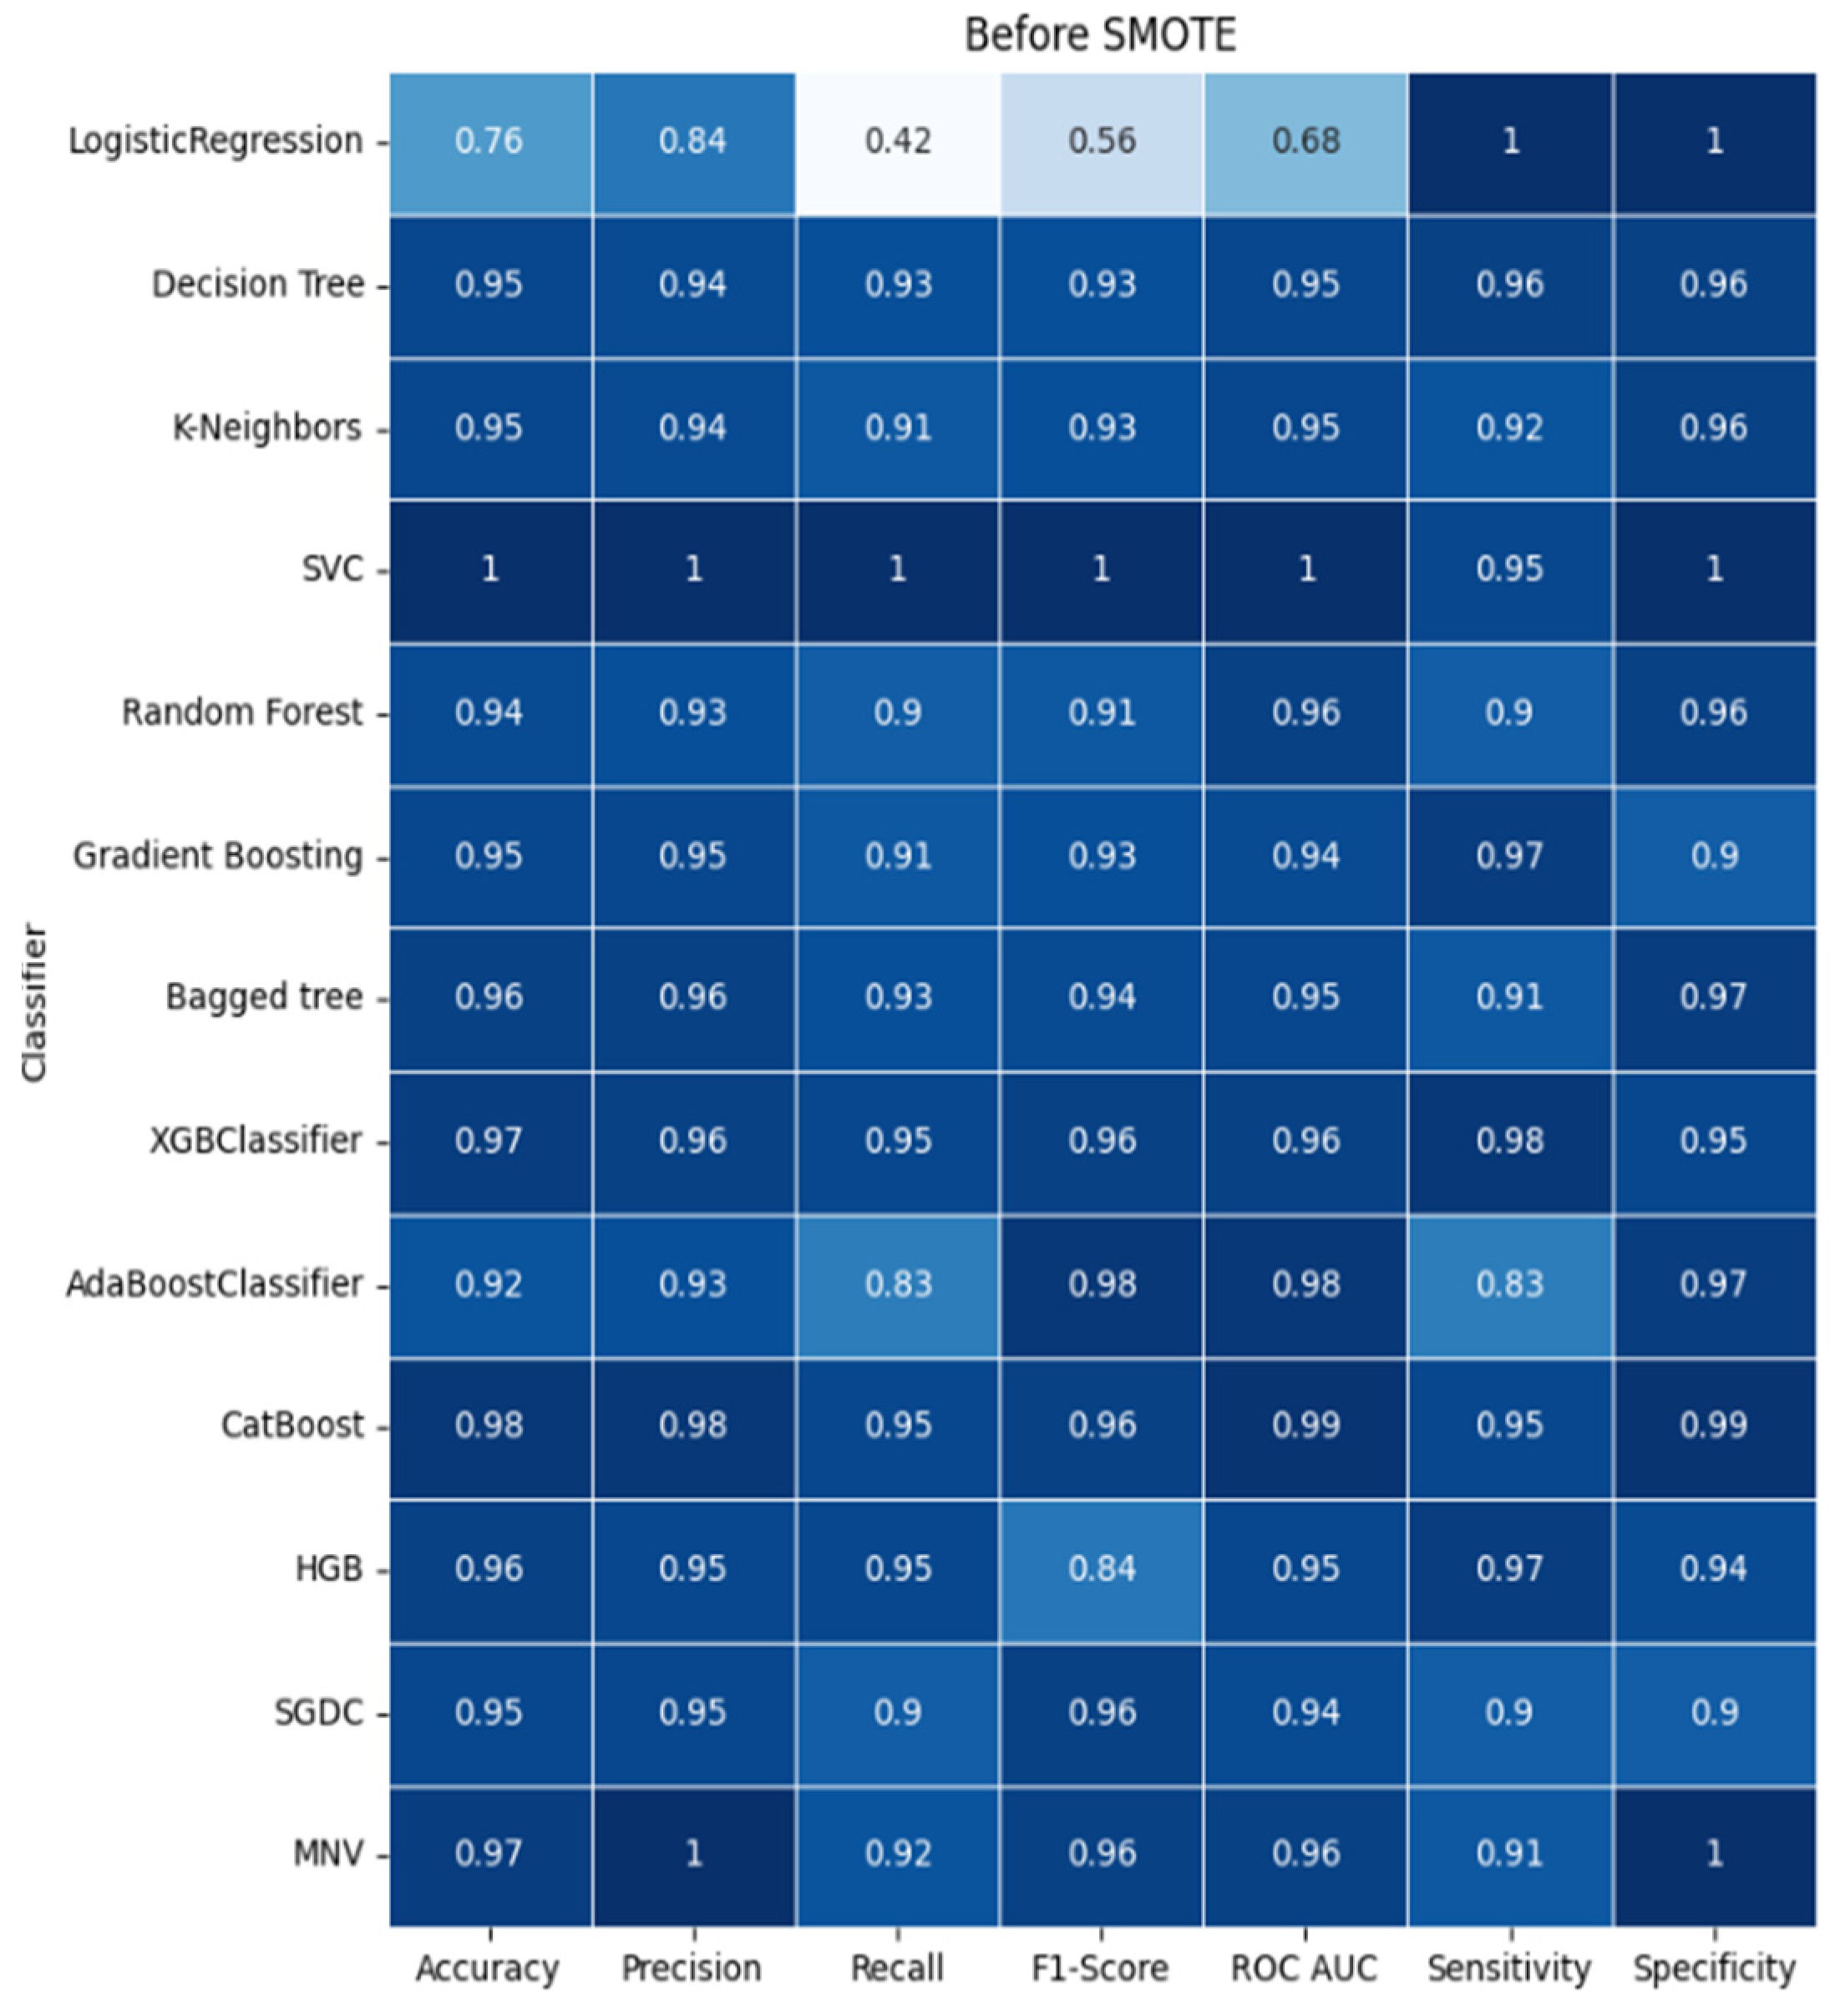
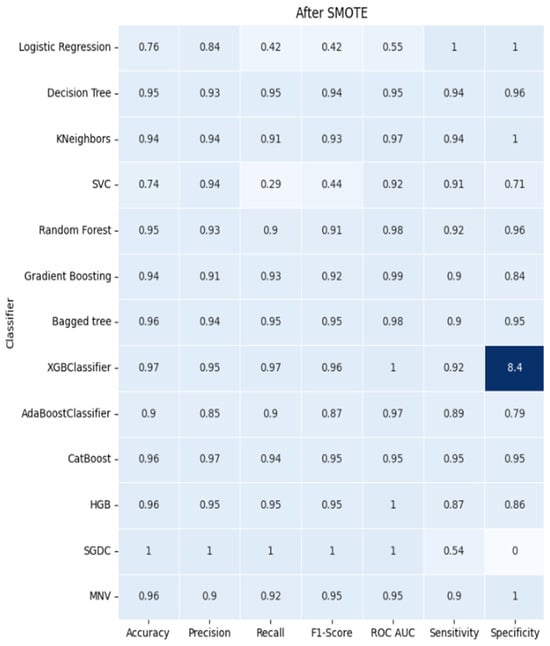
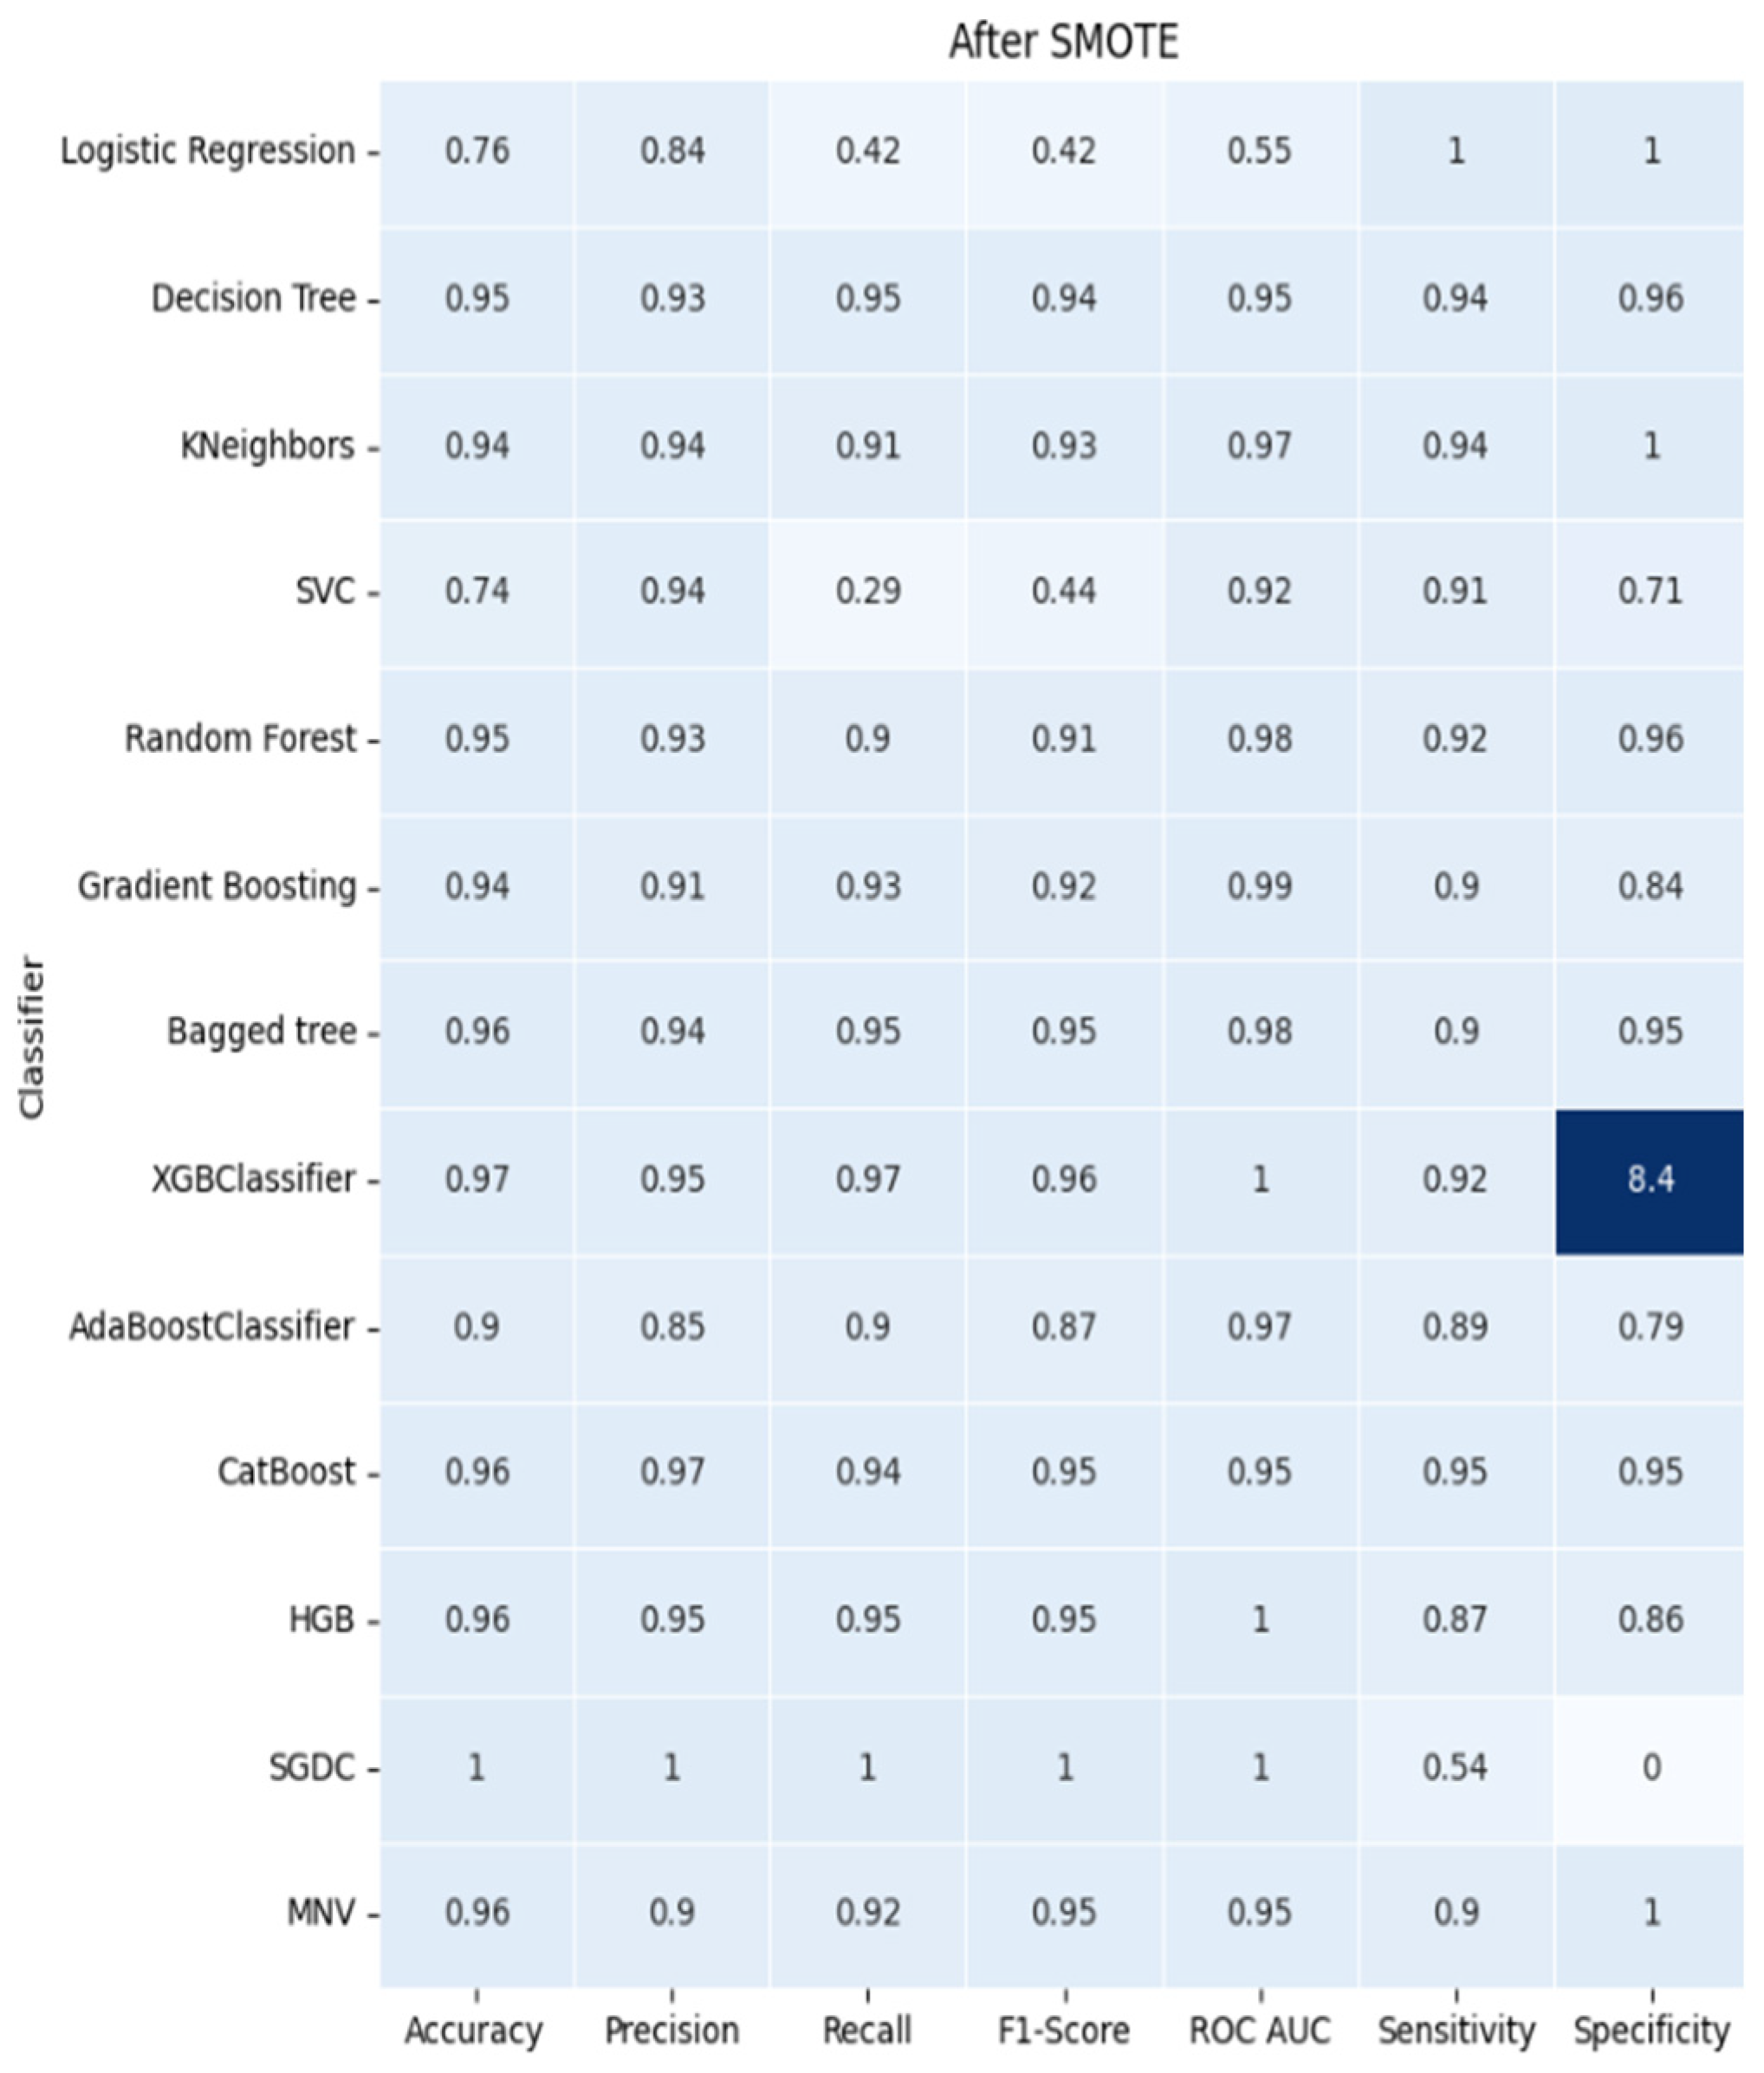
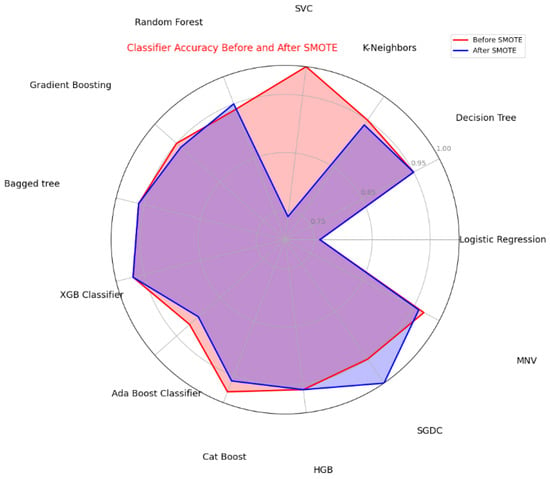
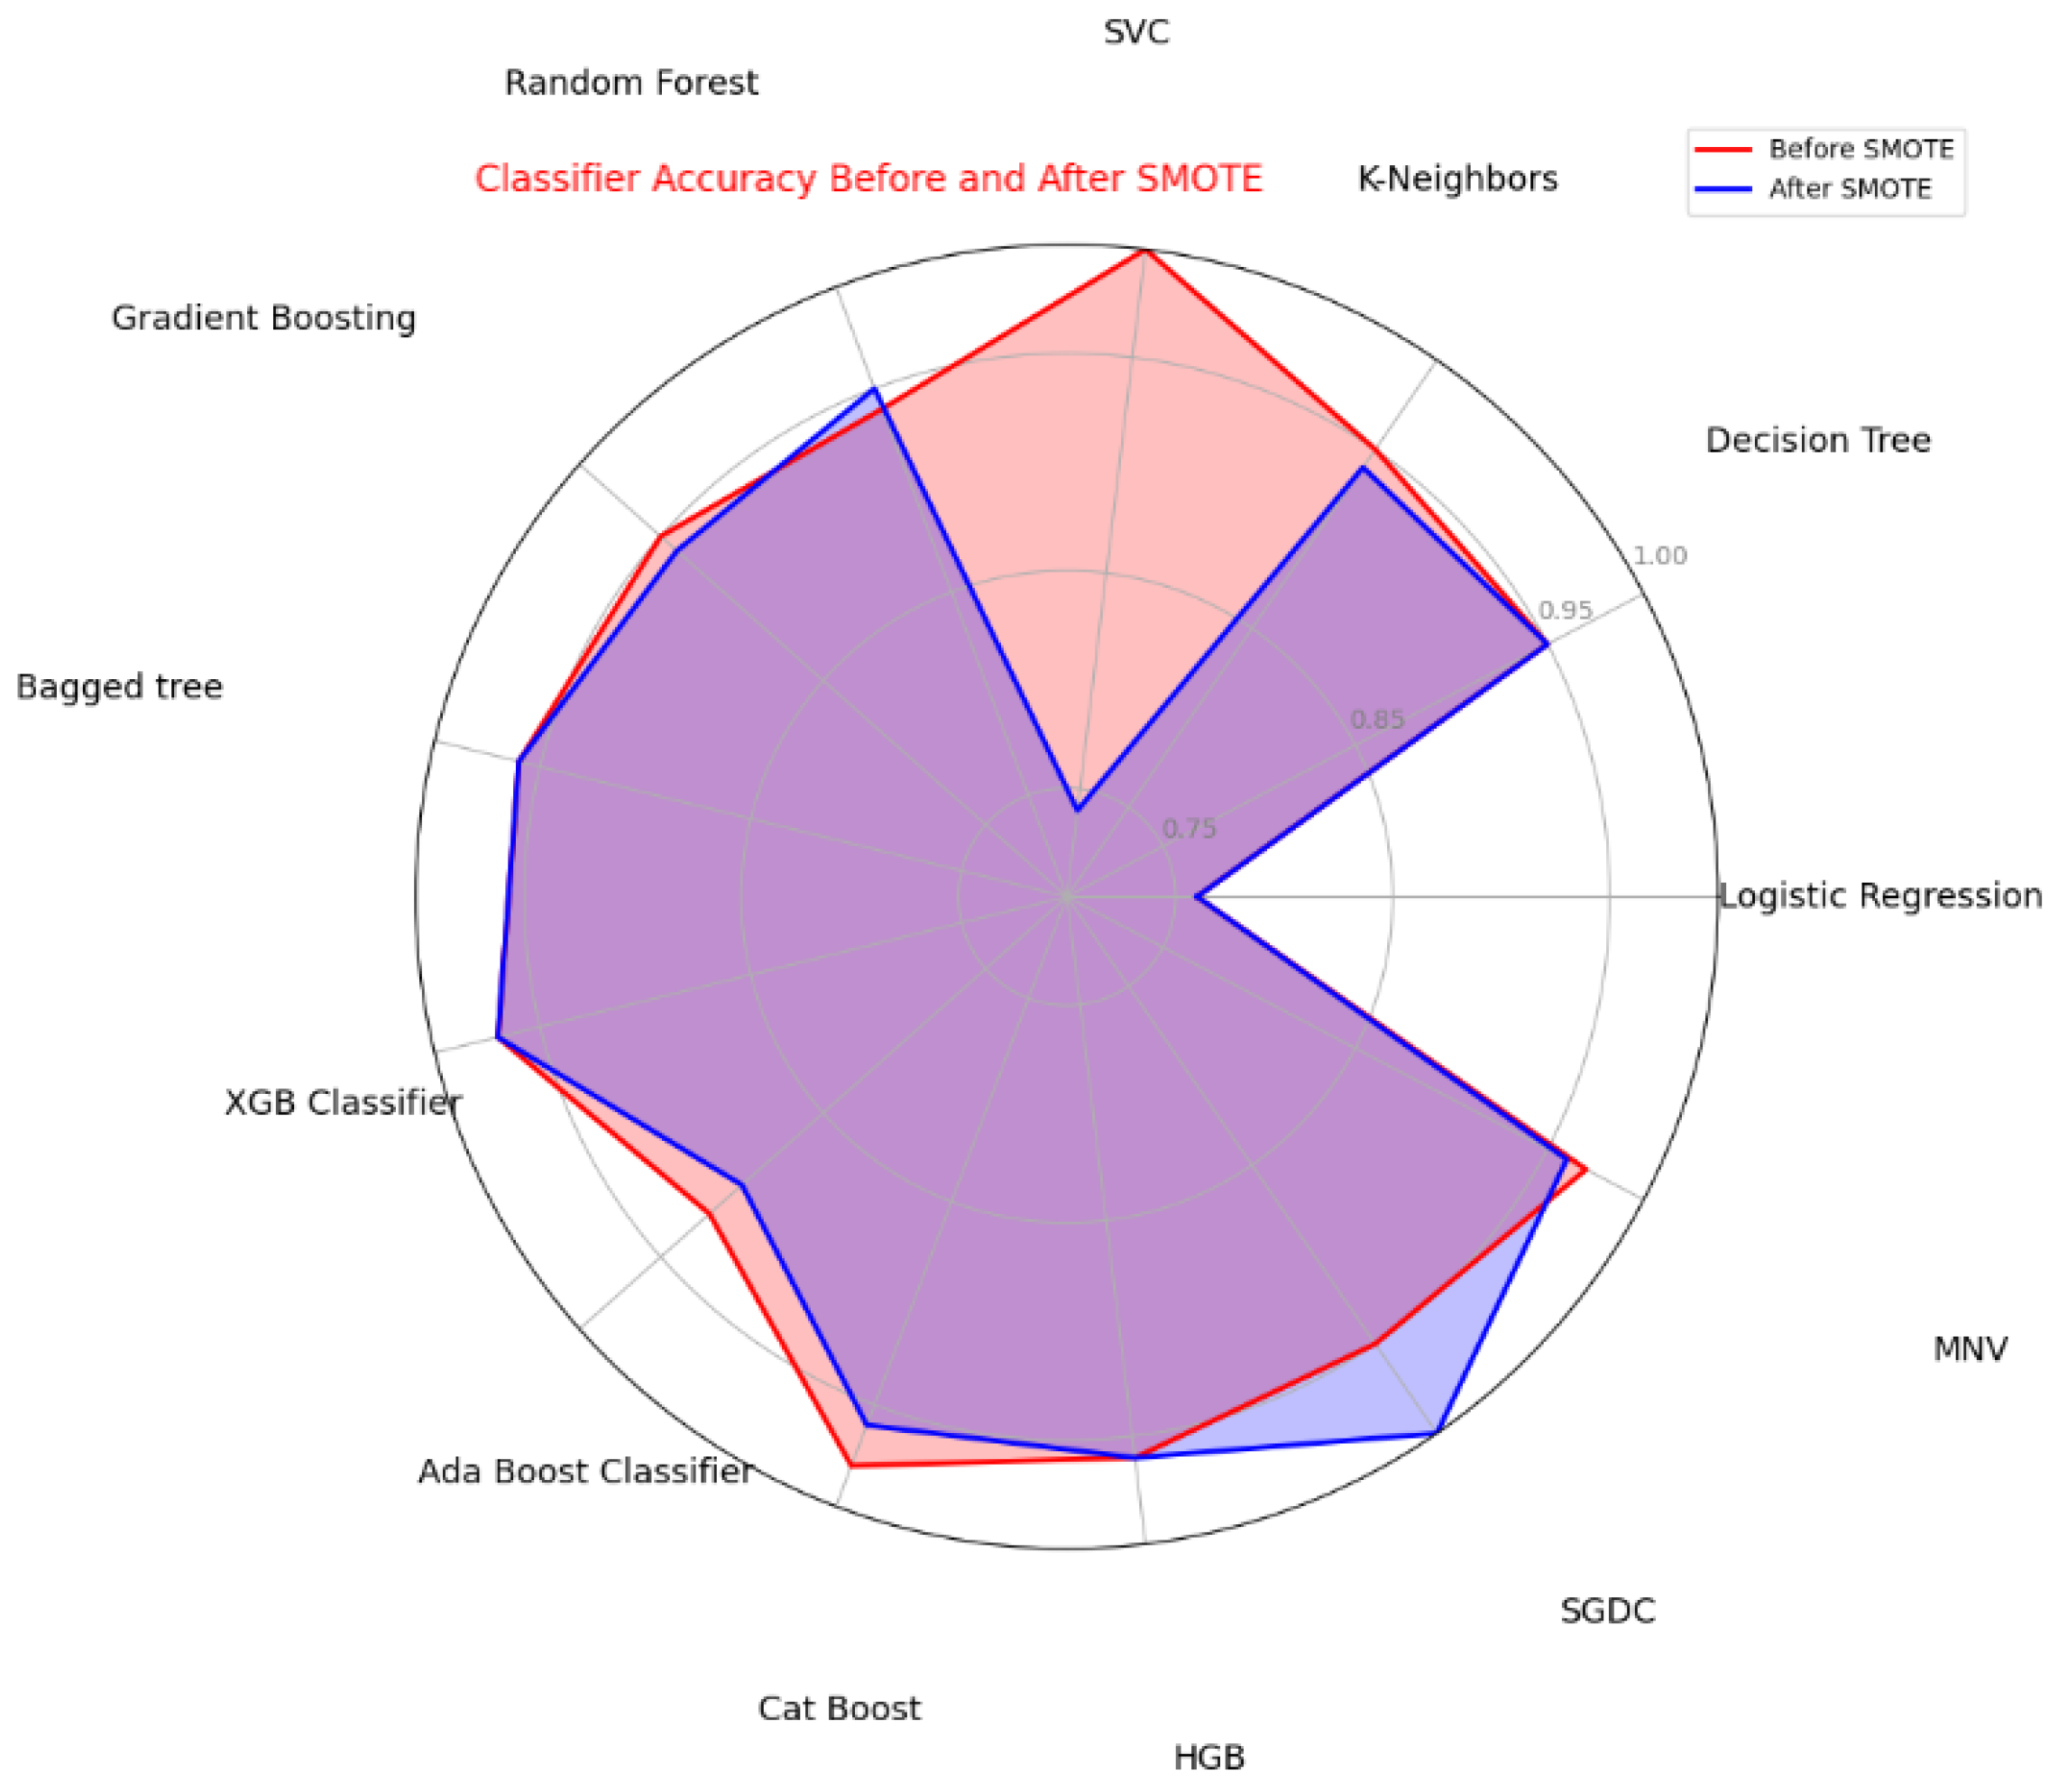
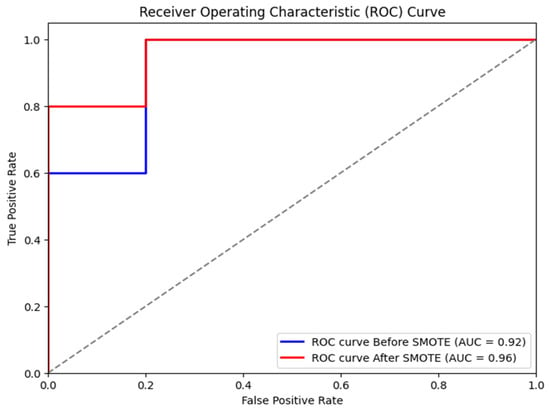
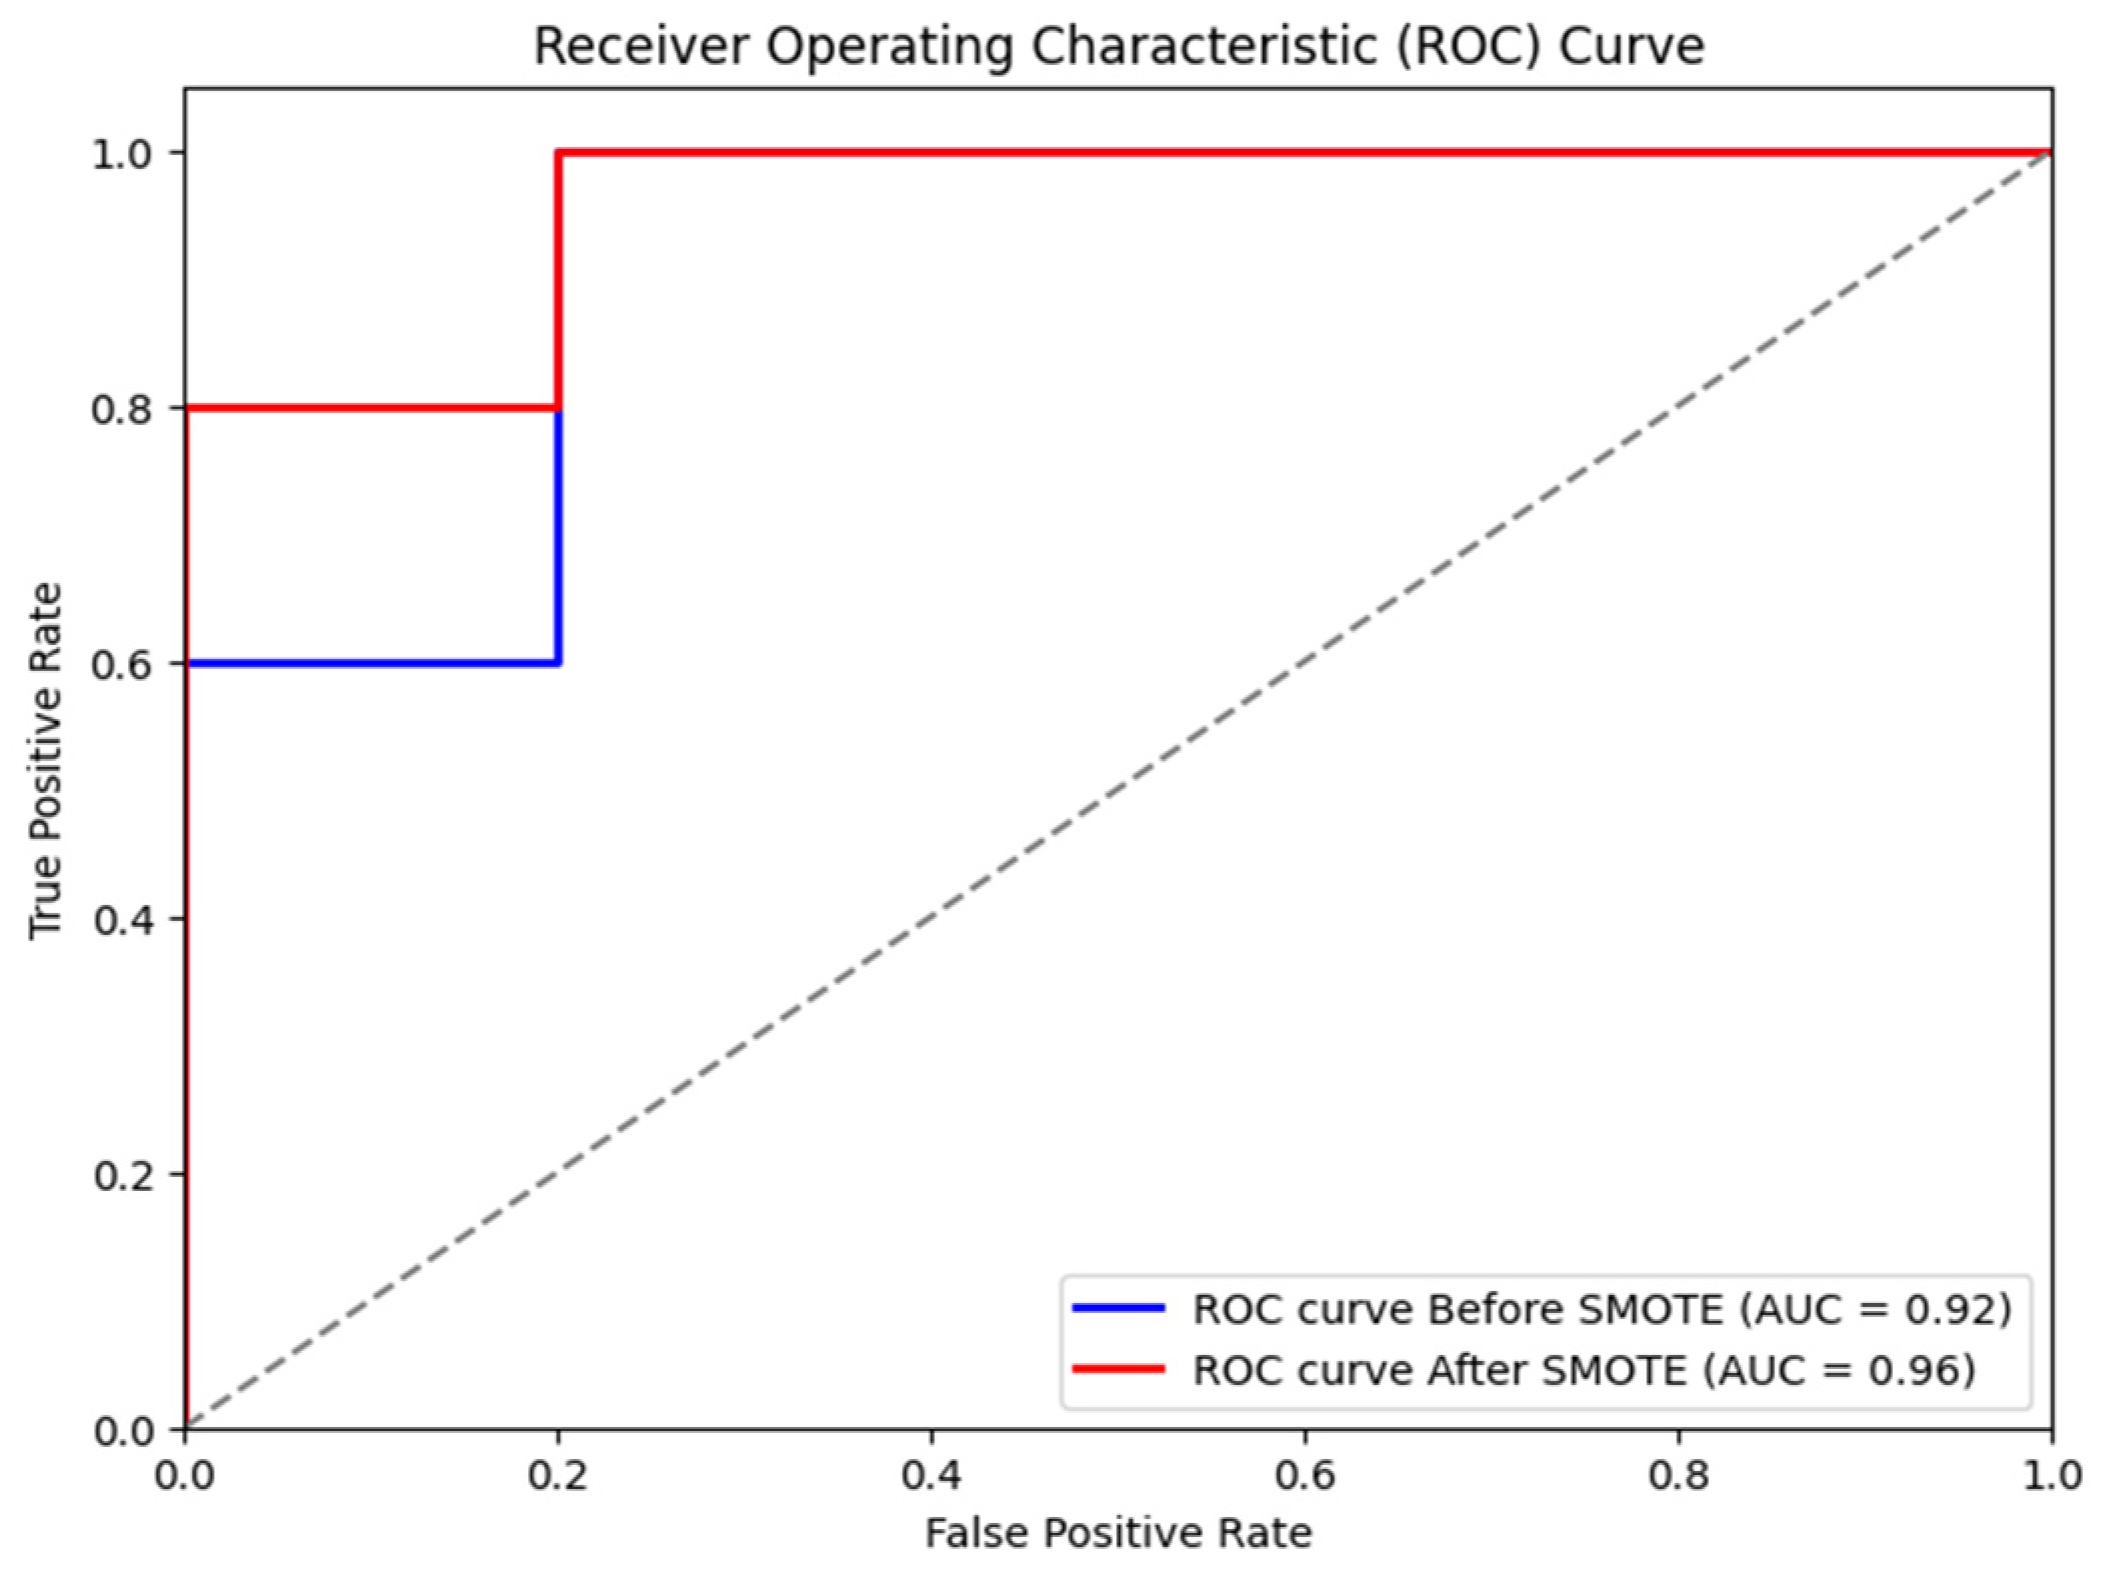
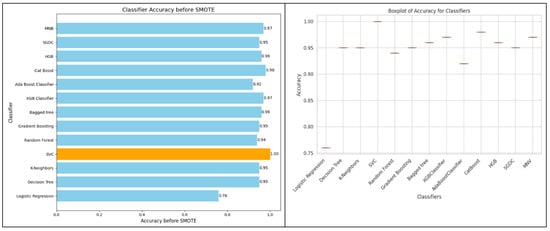
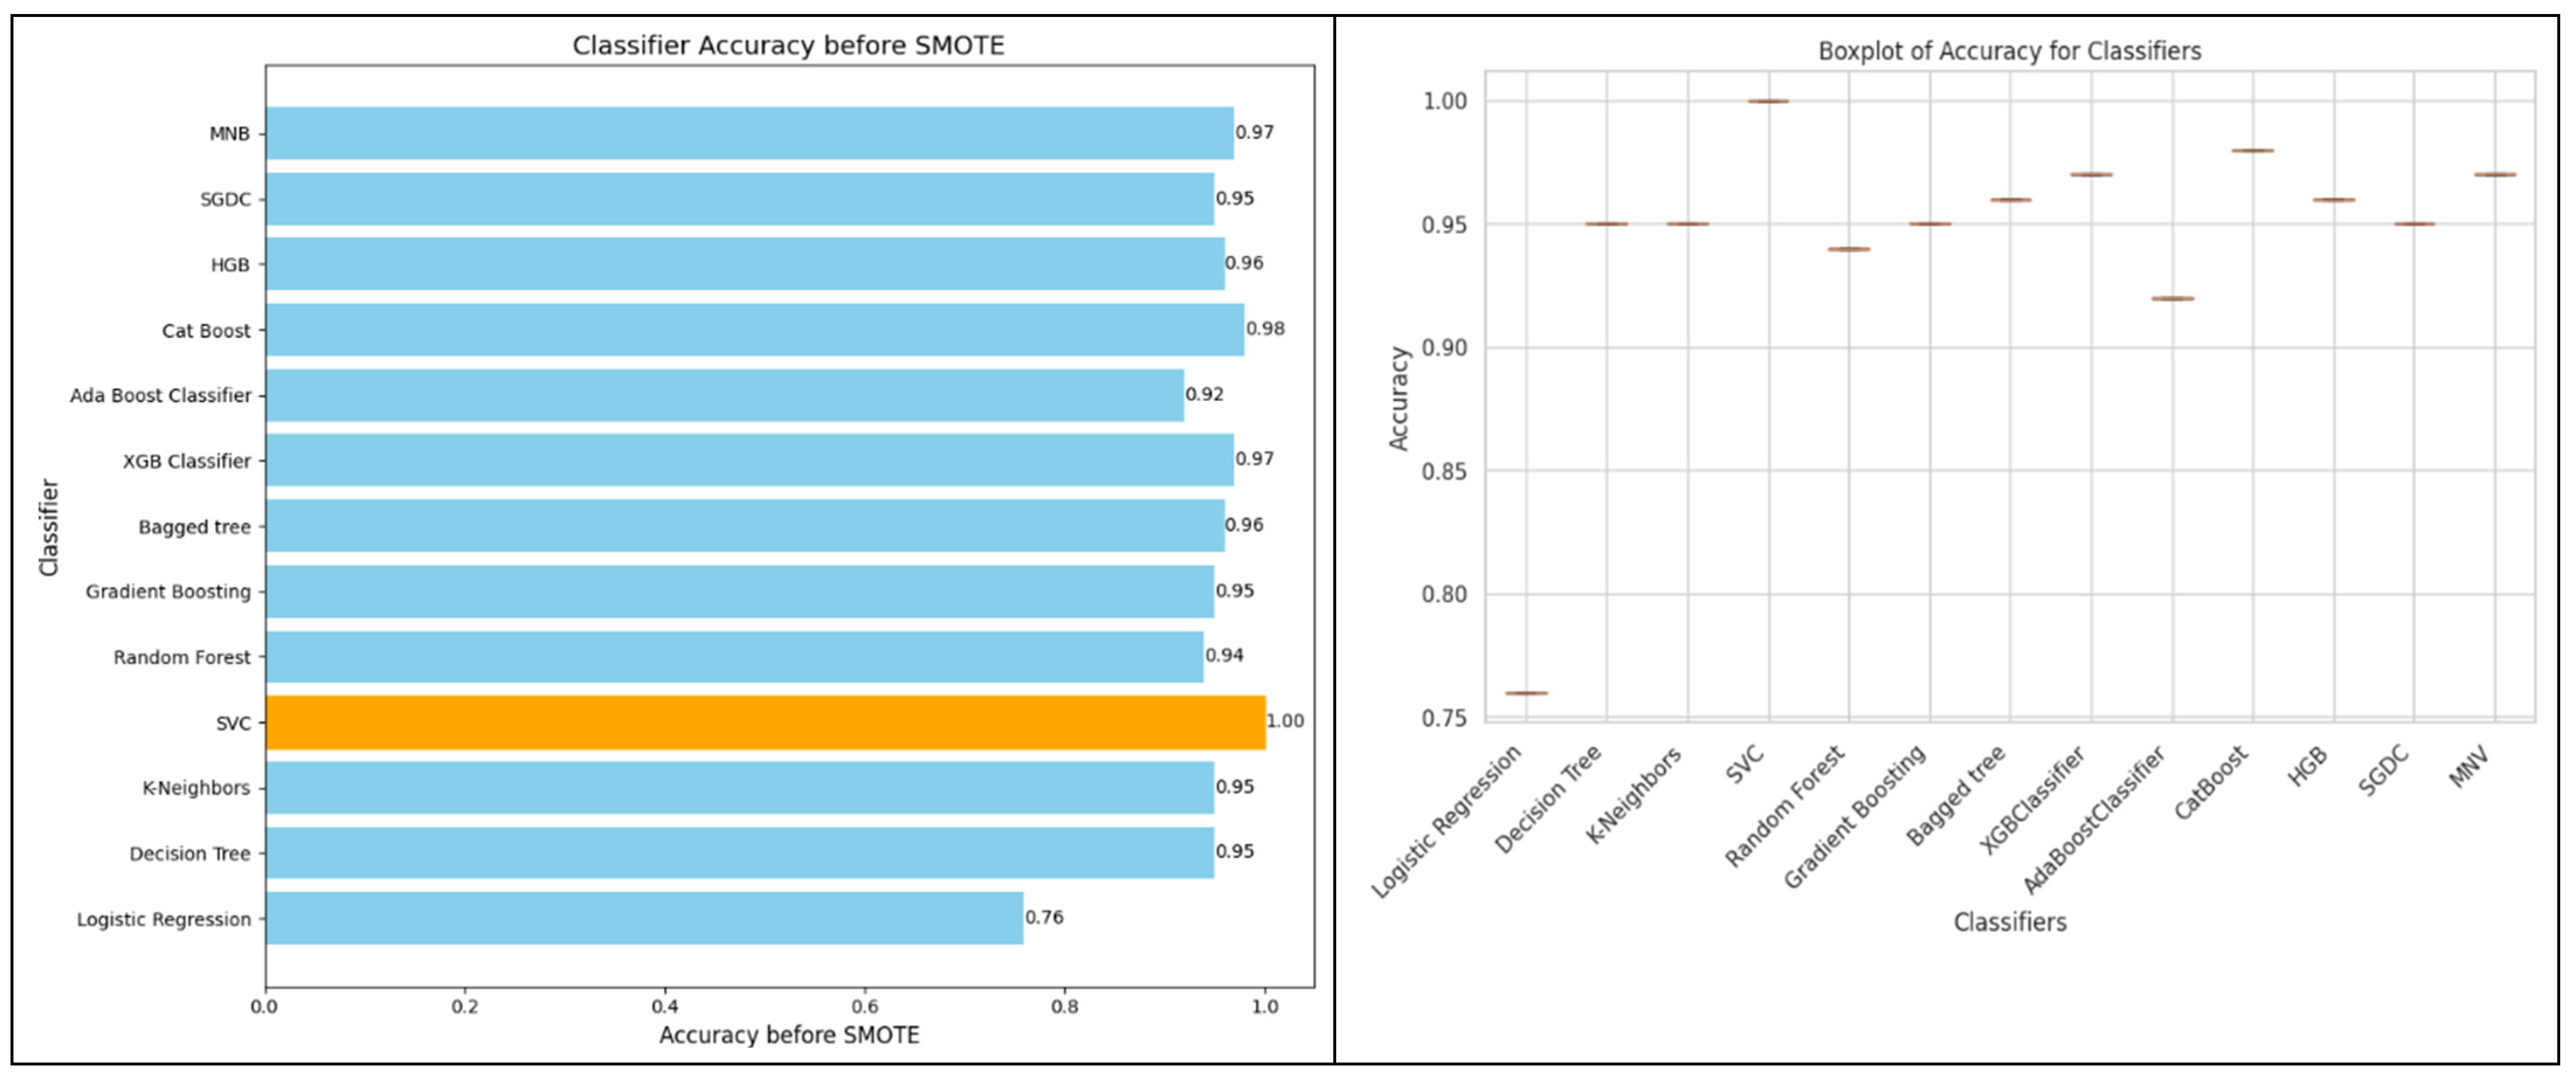
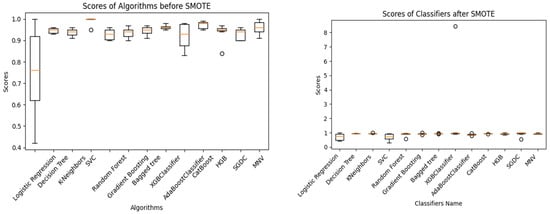
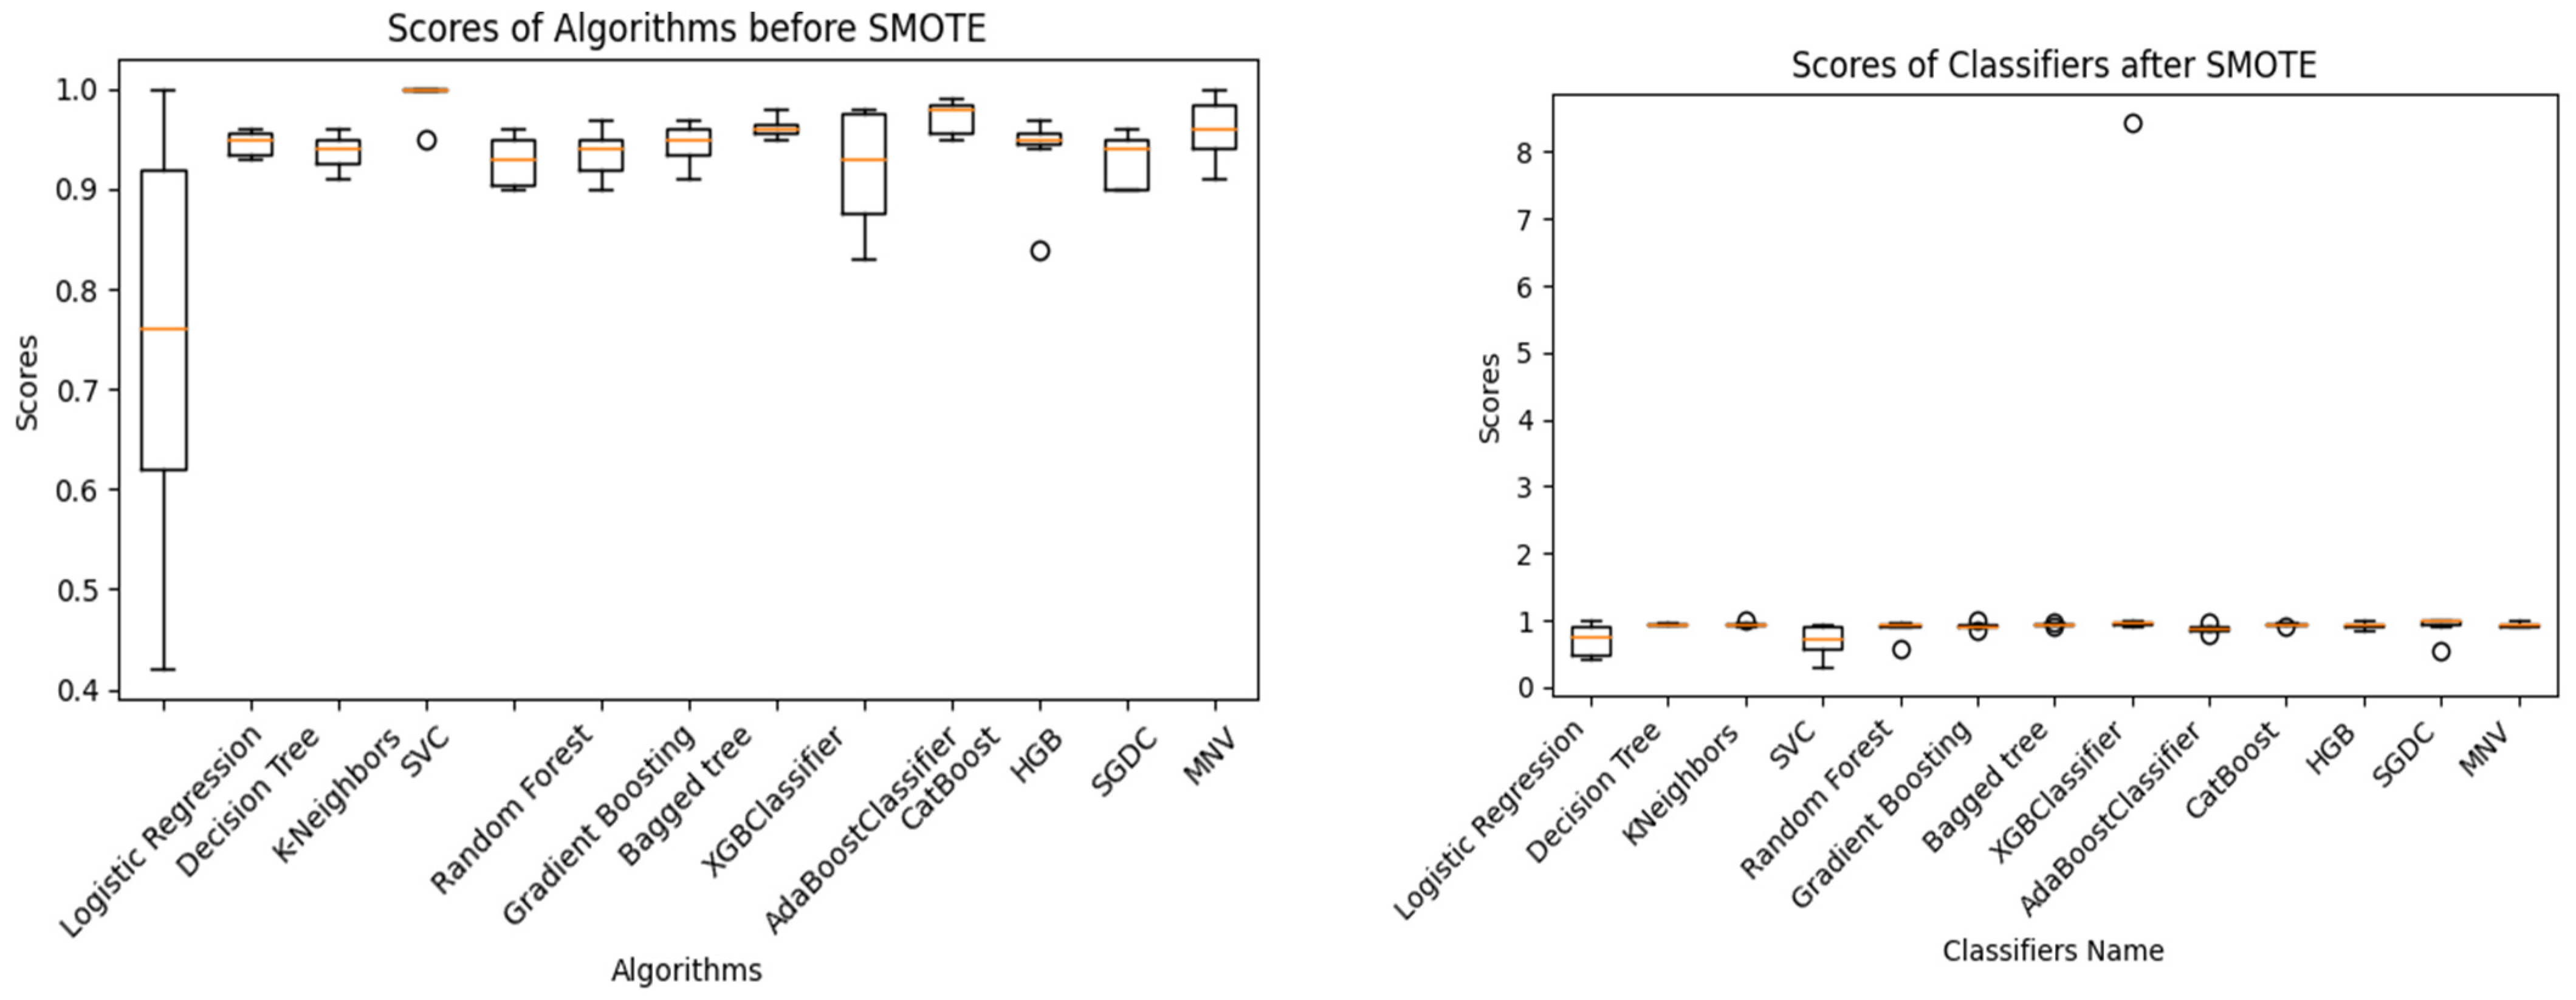
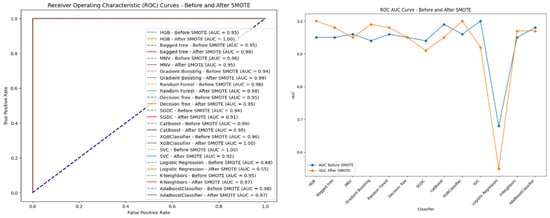
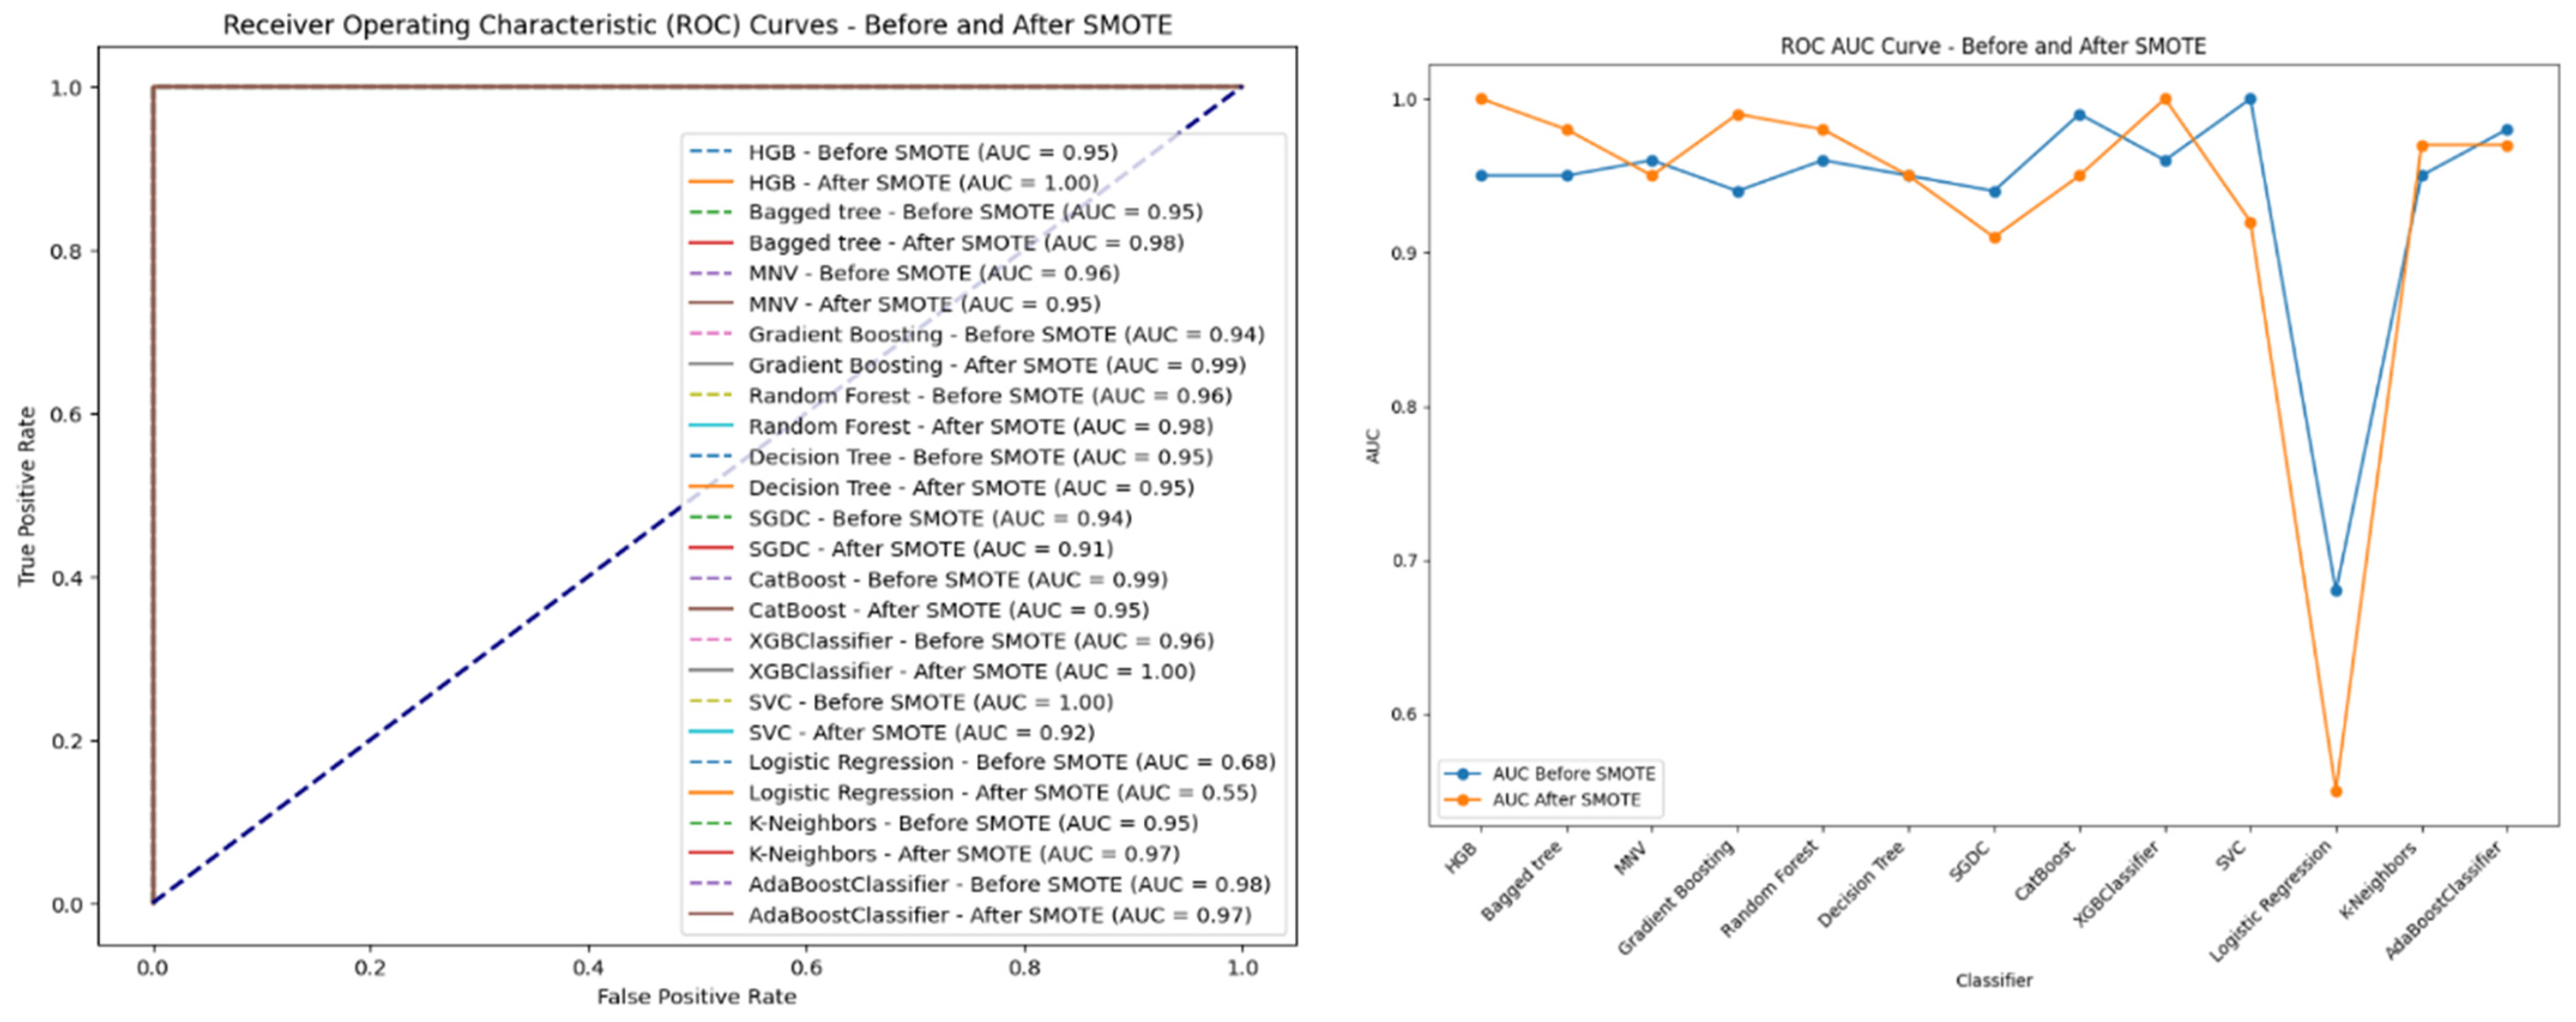
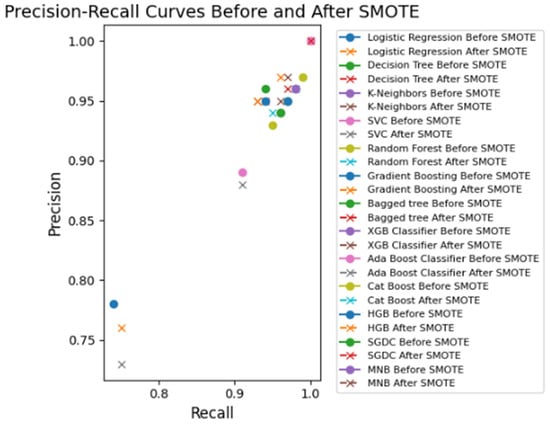
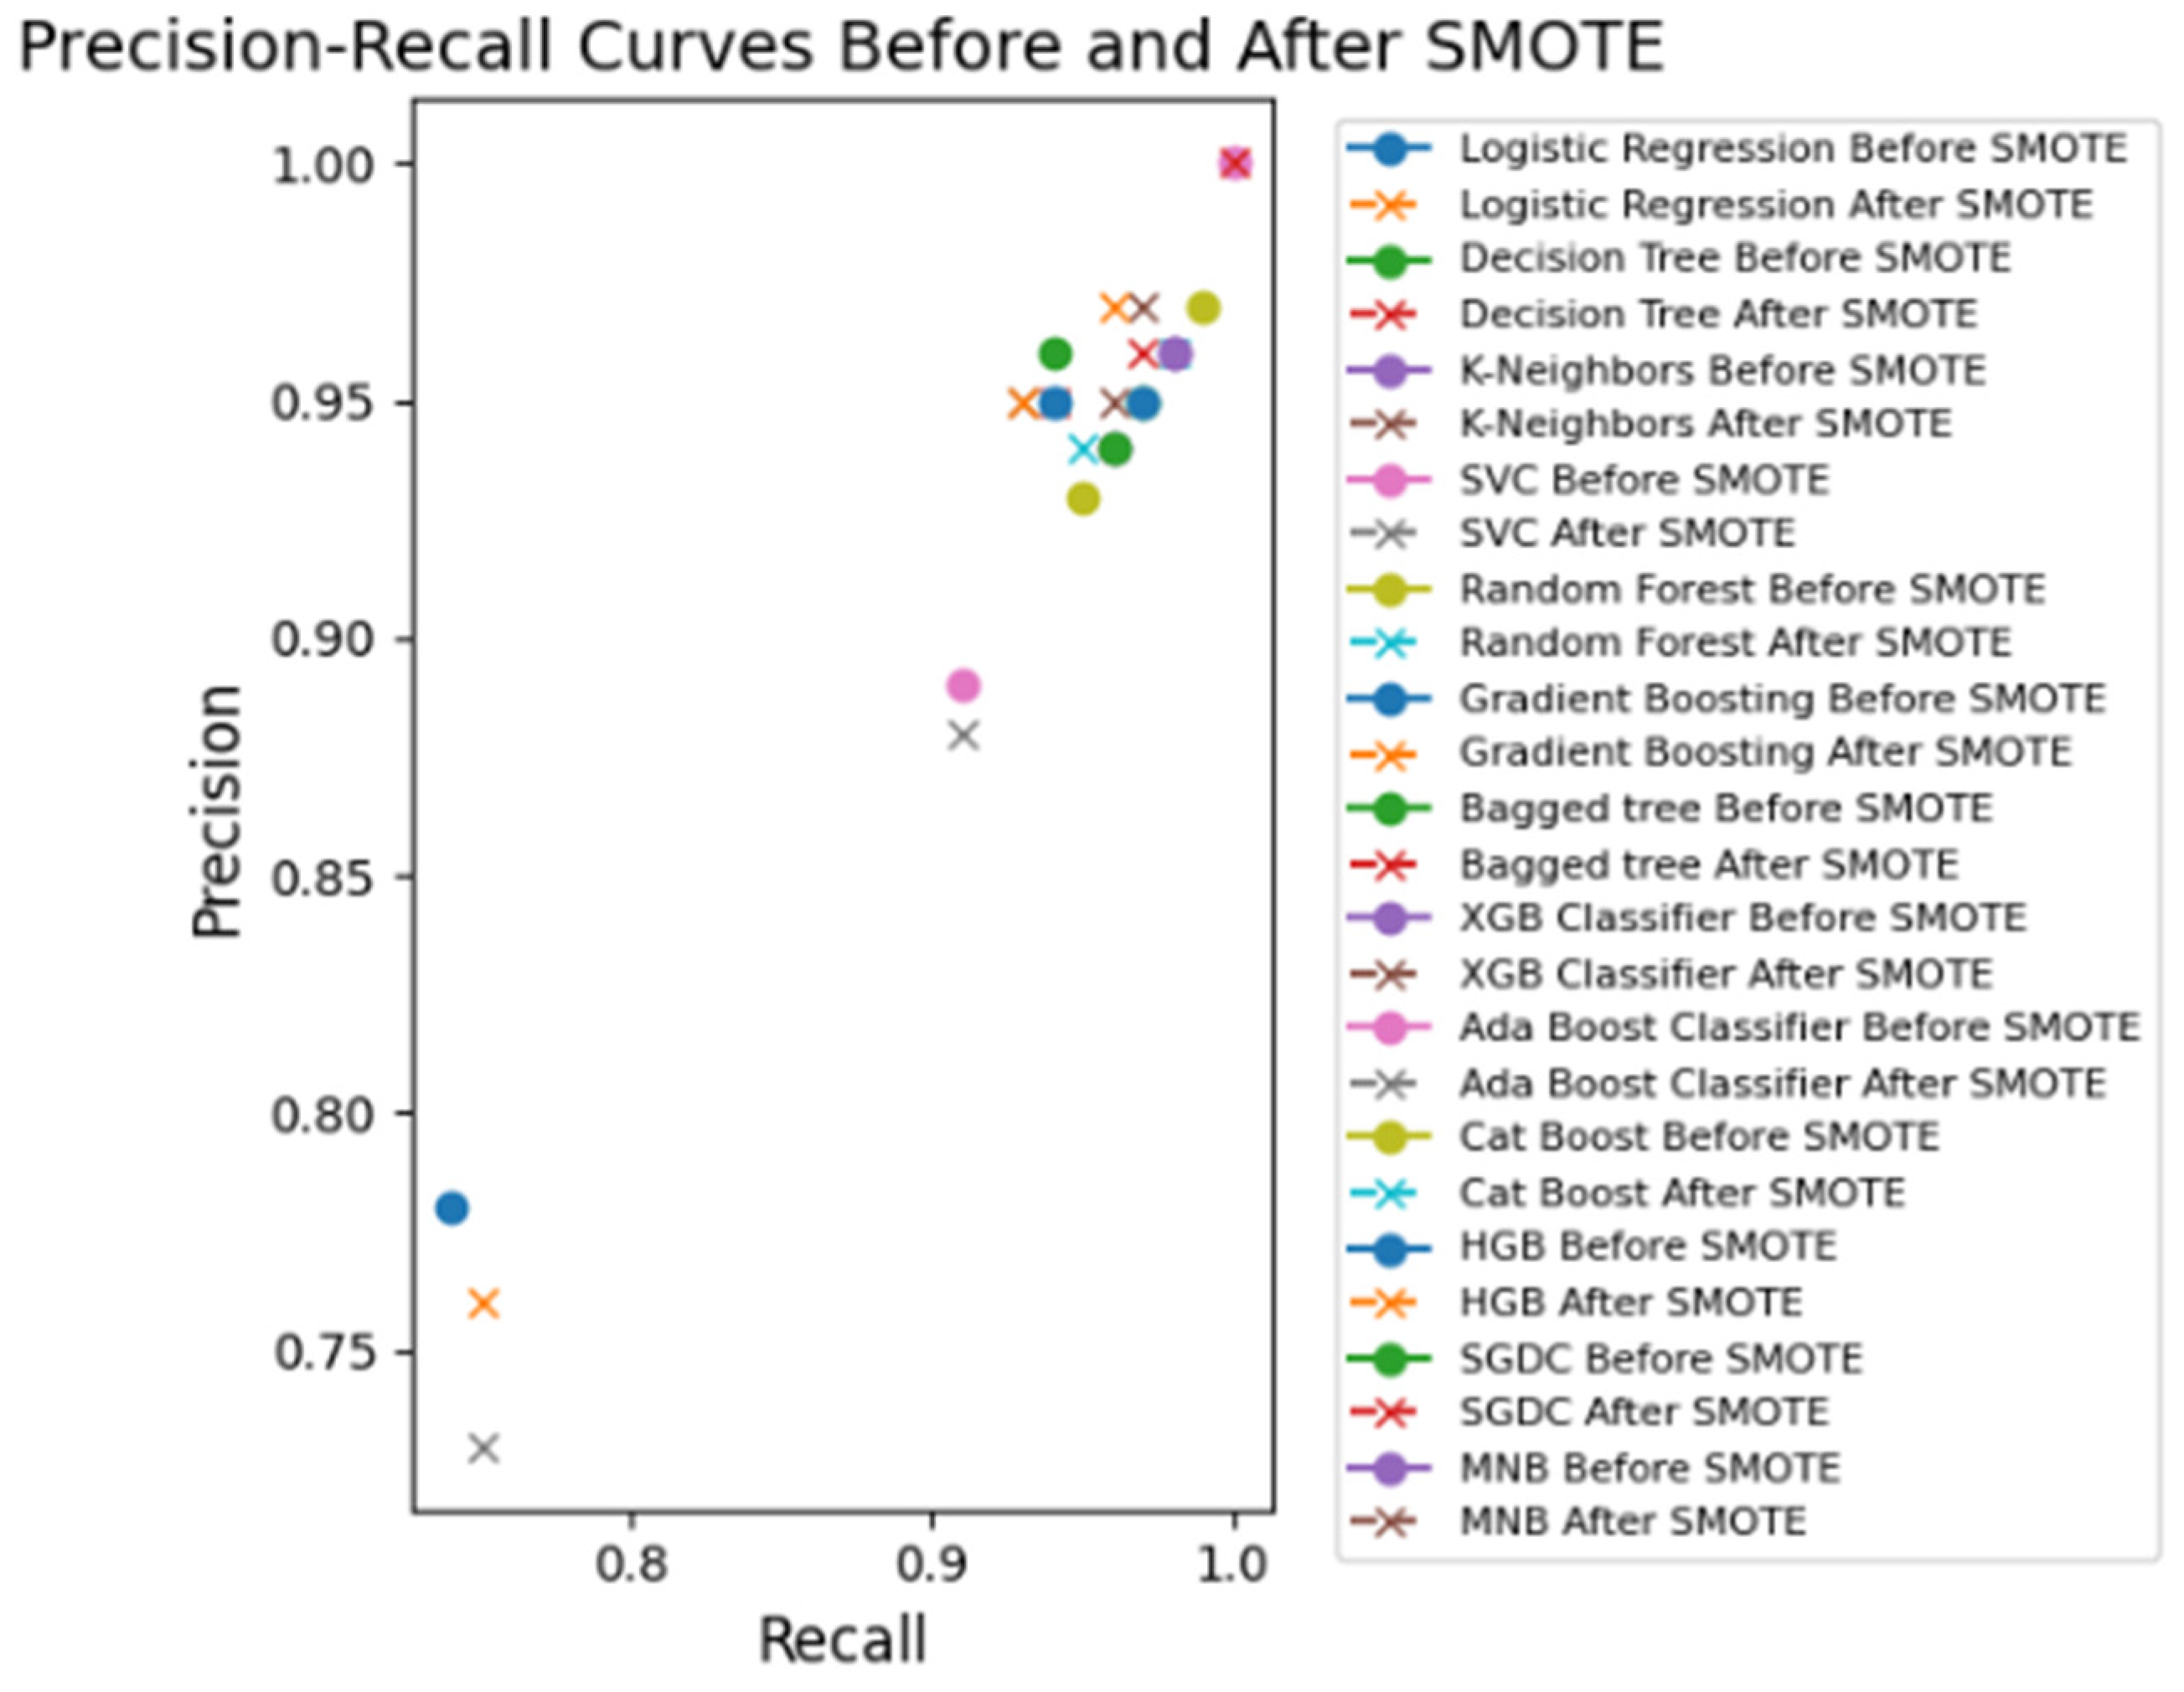
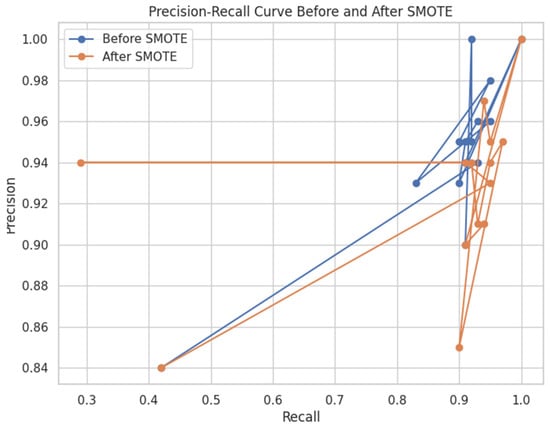
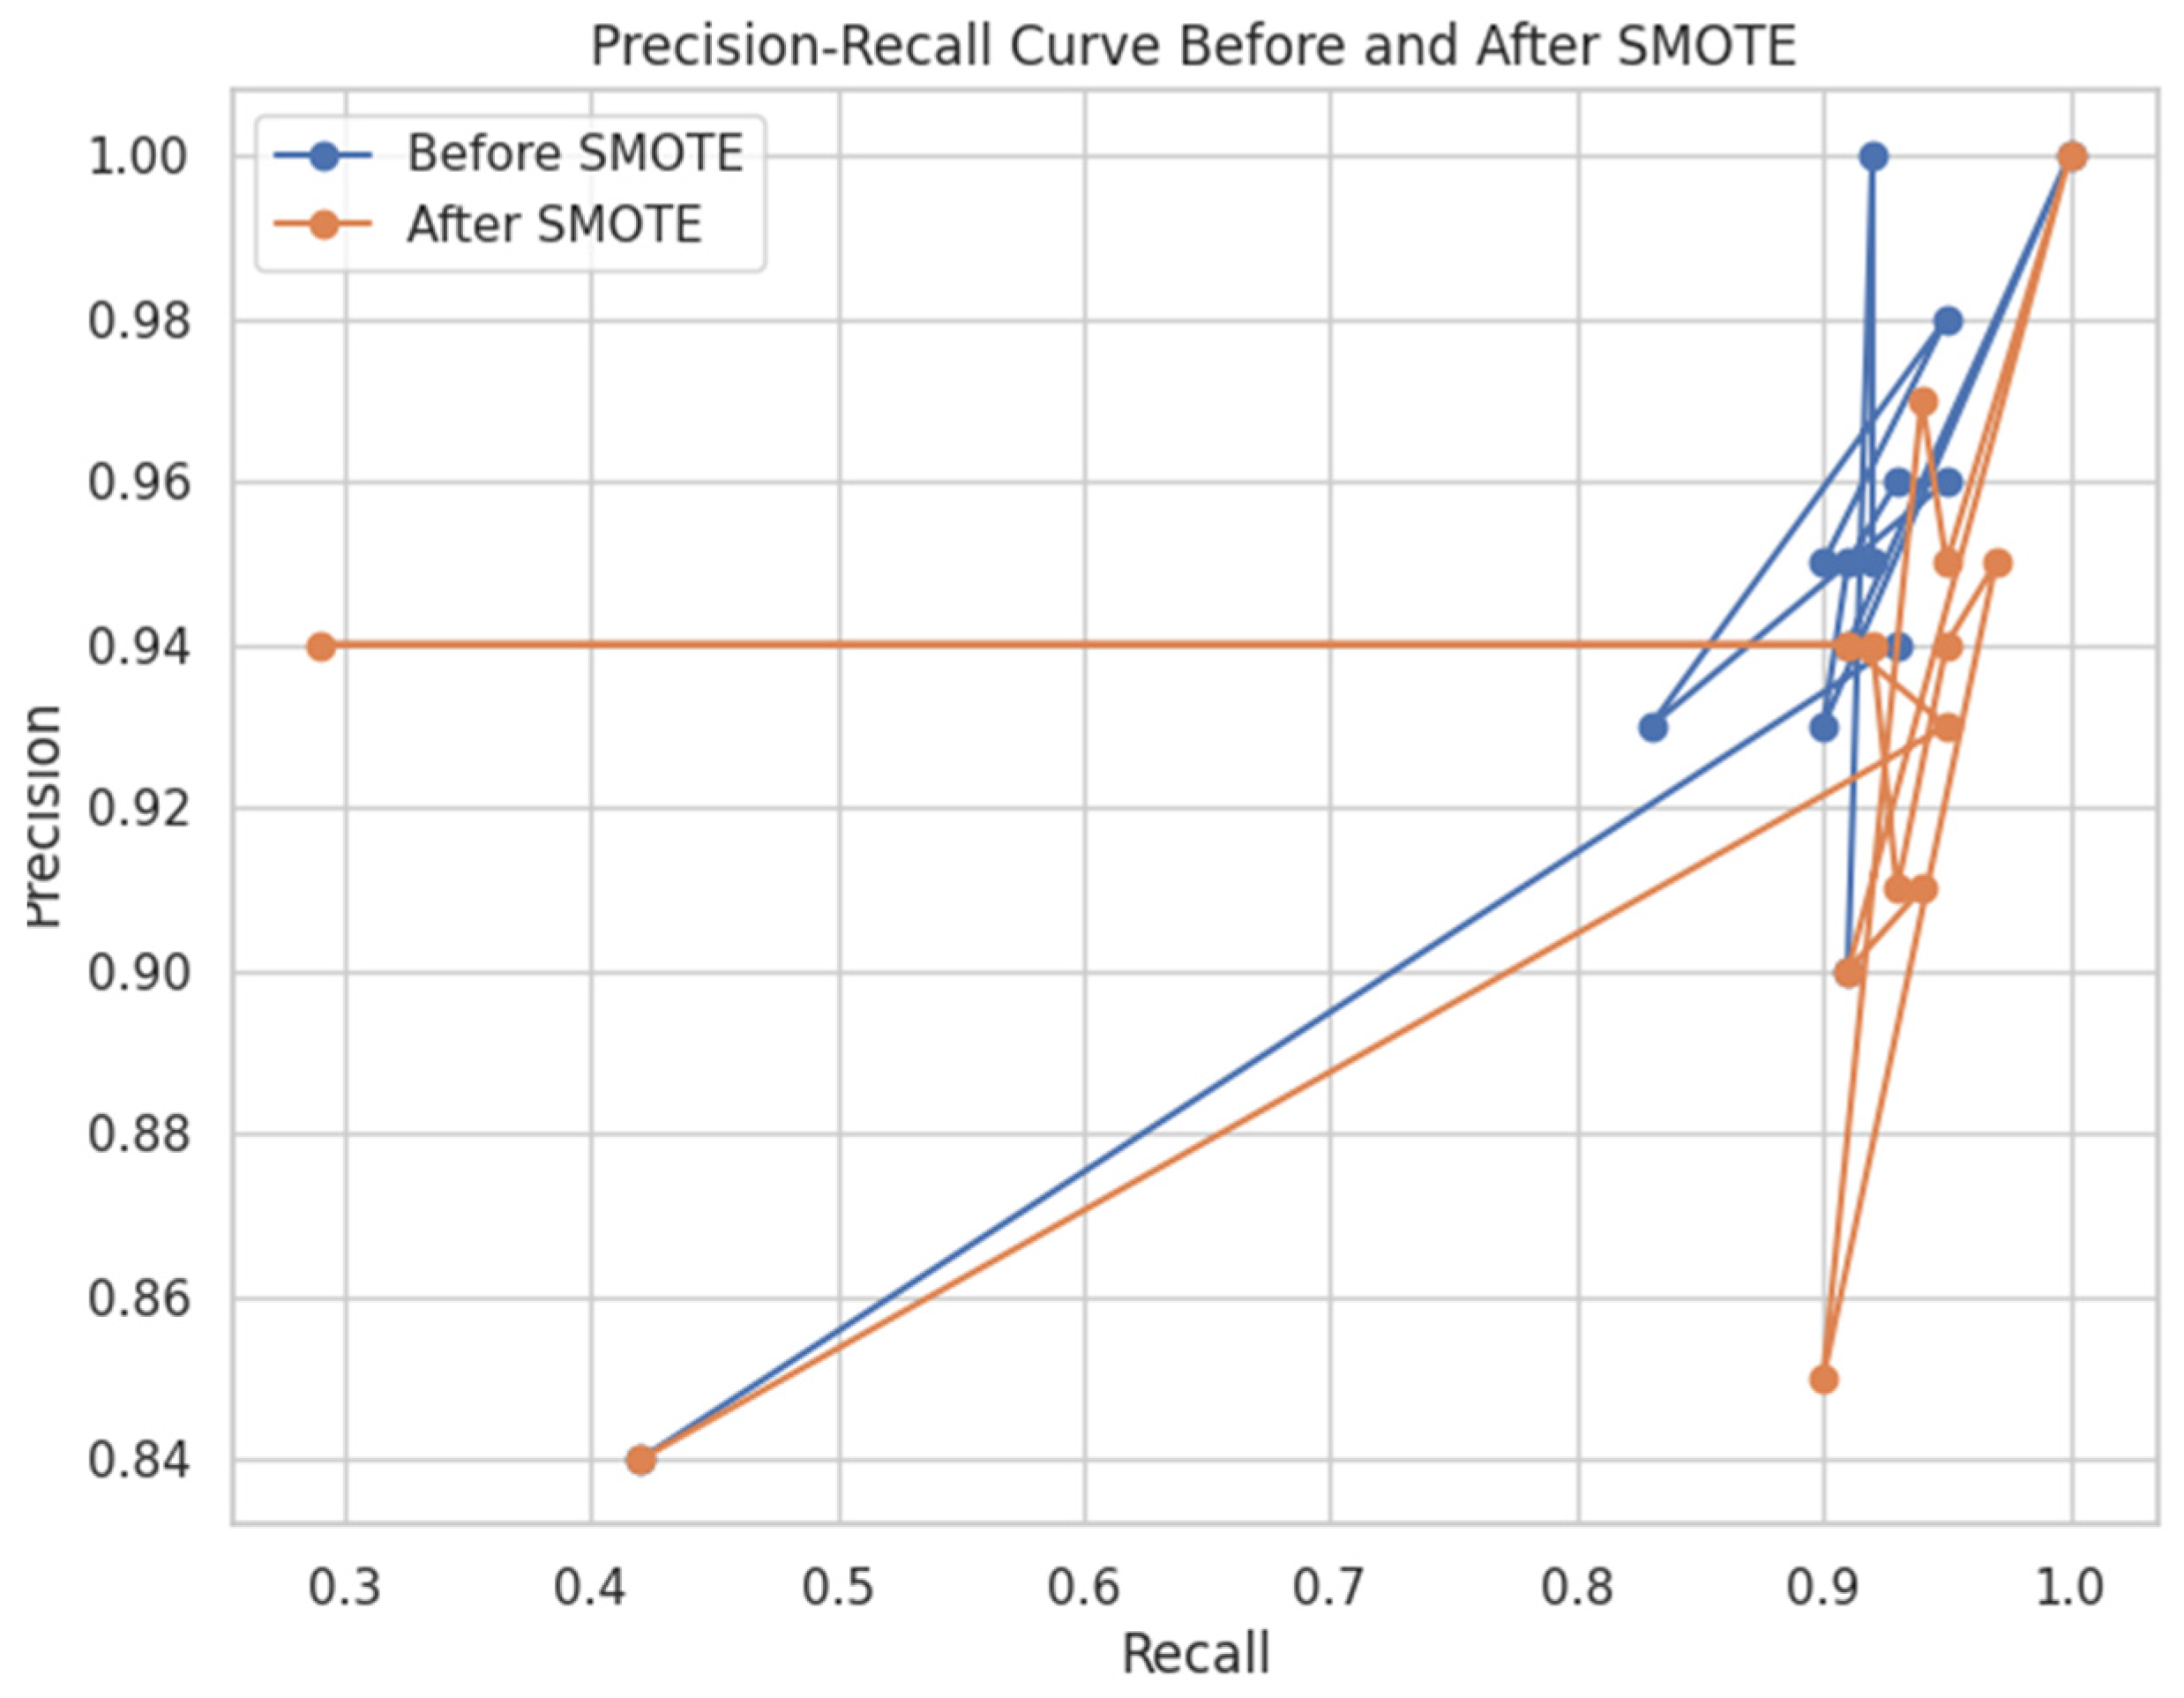

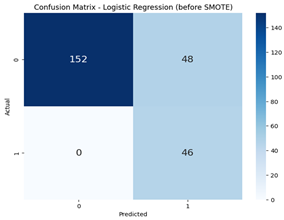
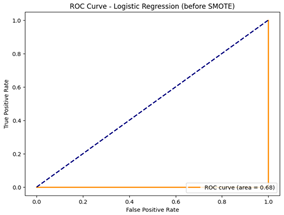
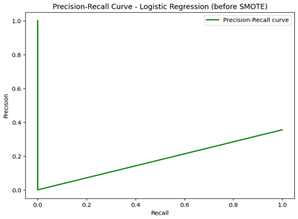
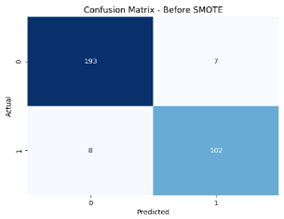
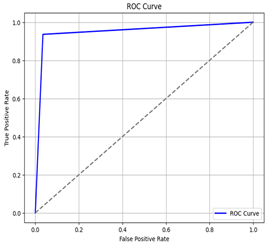
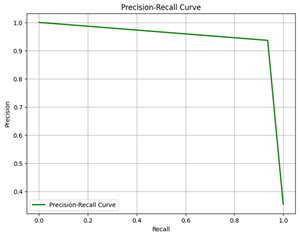
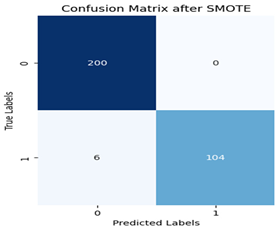
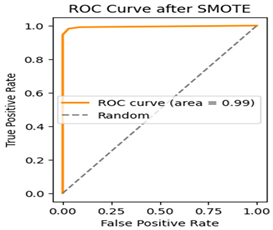
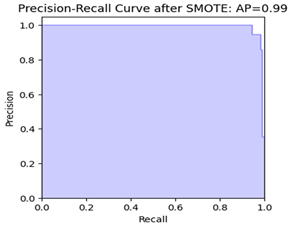
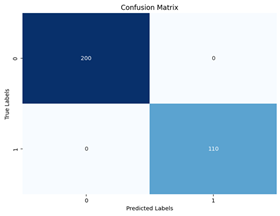
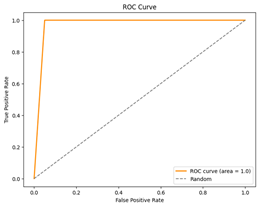
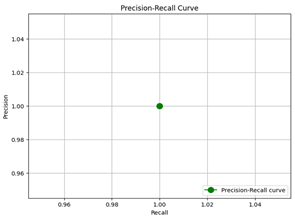
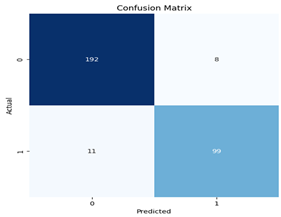
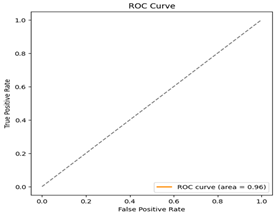
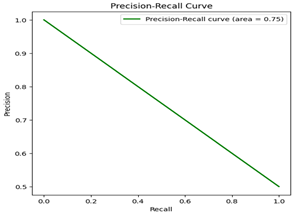
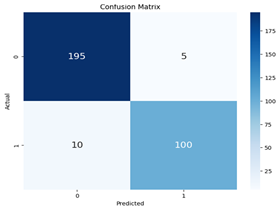
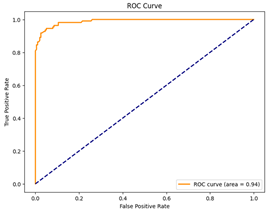
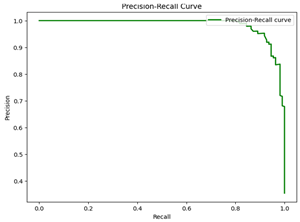
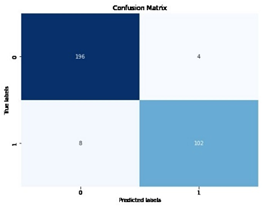
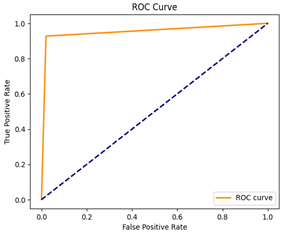
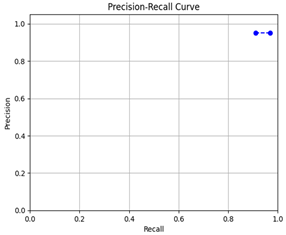
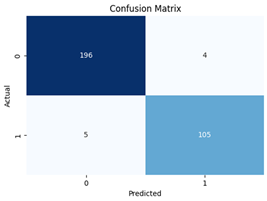
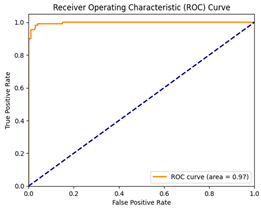
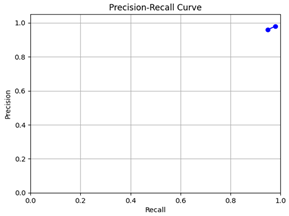
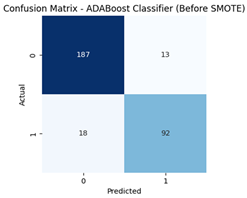
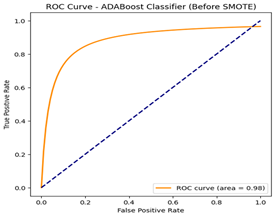
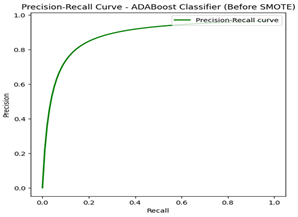
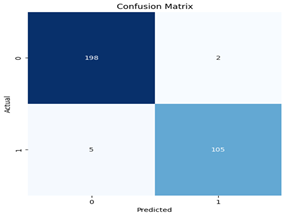
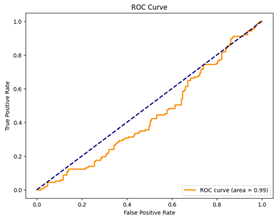
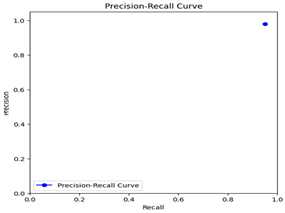
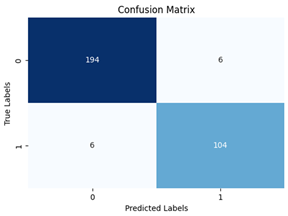
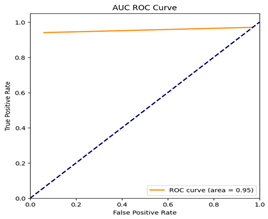
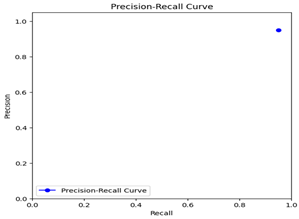
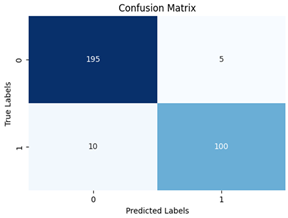
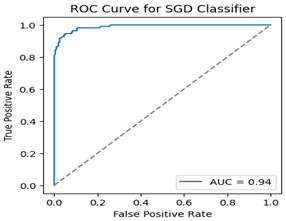
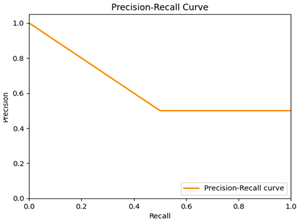
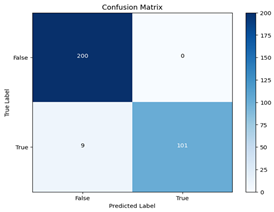
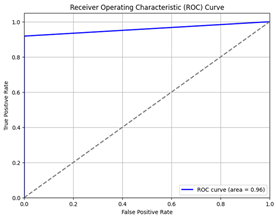
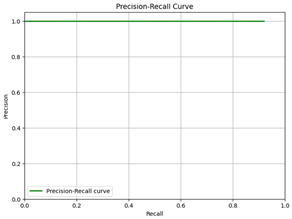
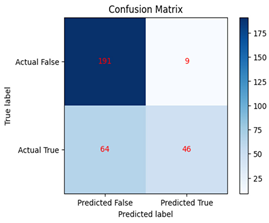
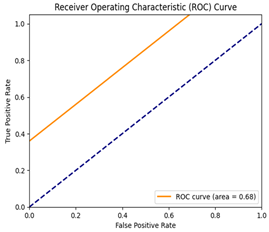
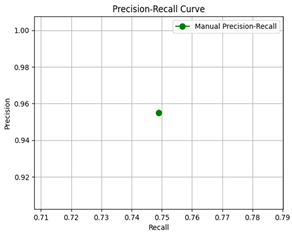
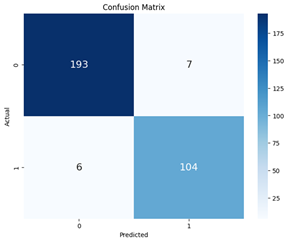
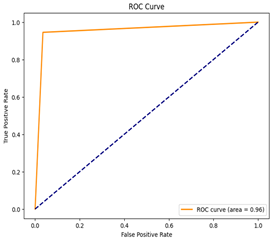
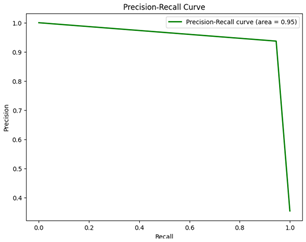
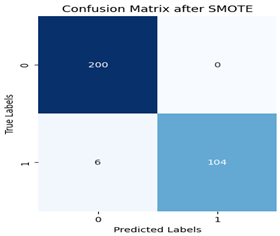
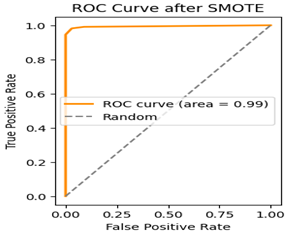
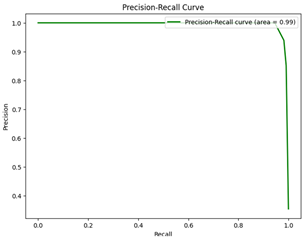
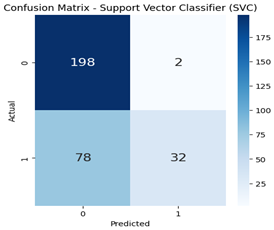
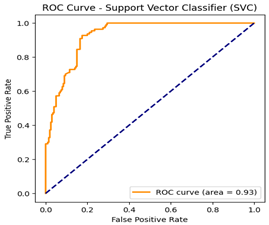
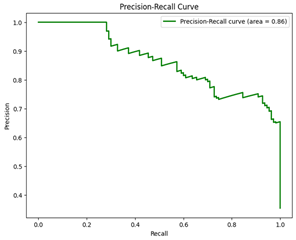
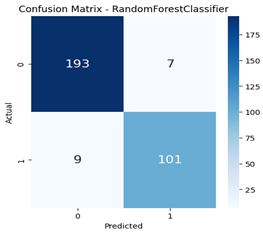
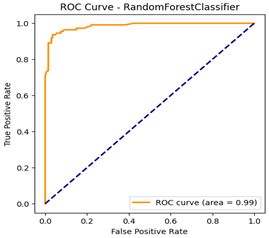
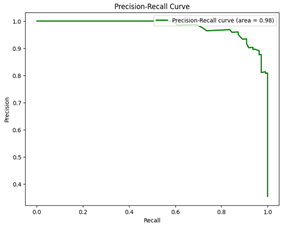
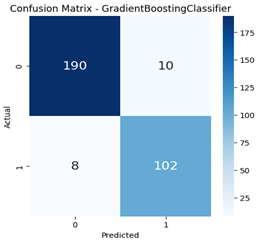
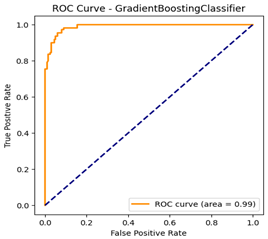
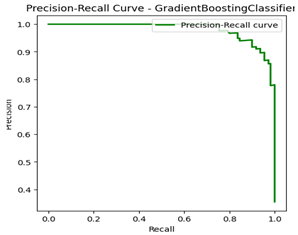
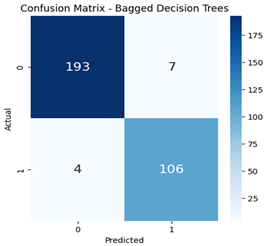
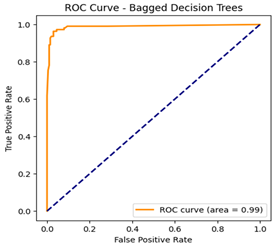
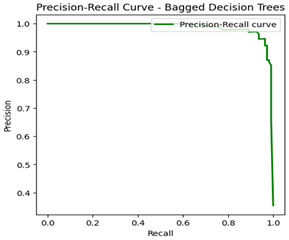
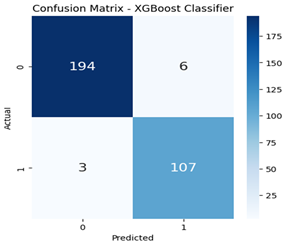
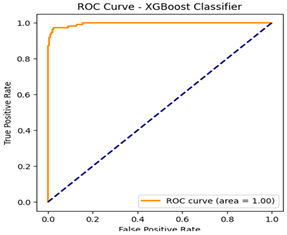
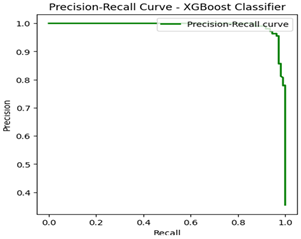
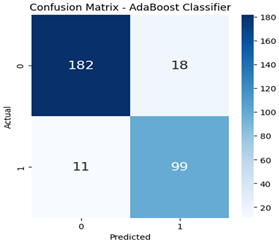
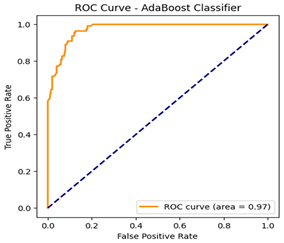
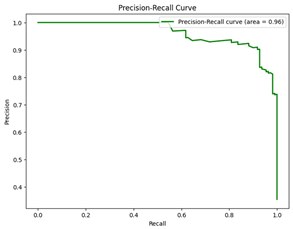
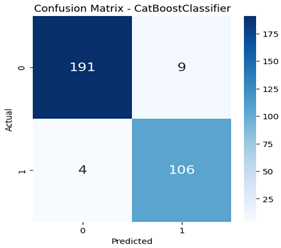
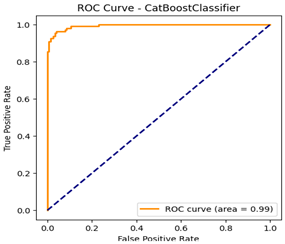
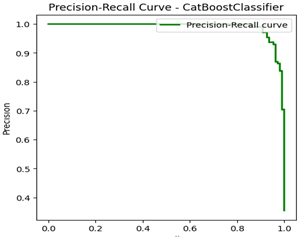
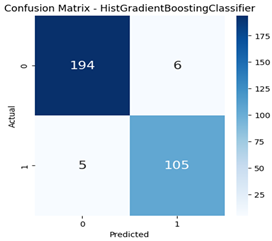
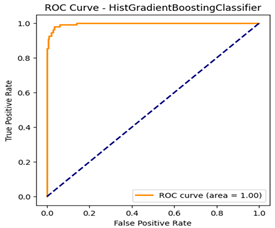
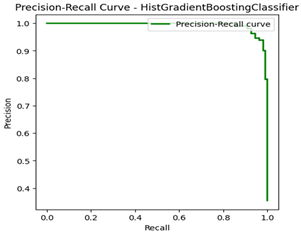
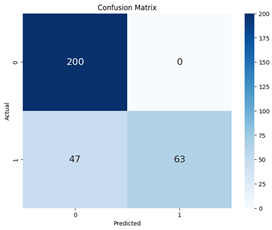
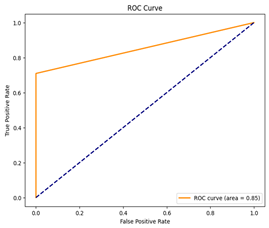
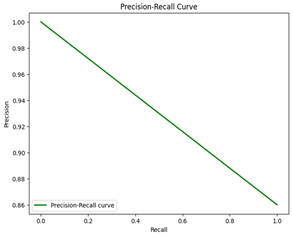
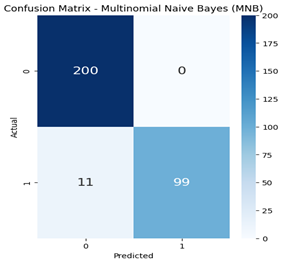
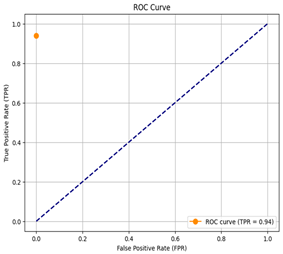
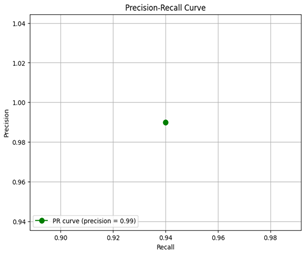
Disclaimer/Publisher’s Note: The statements, opinions and data contained in all publications are solely those of the individual author(s) and contributor(s) and not of MDPI and/or the editor(s). MDPI and/or the editor(s) disclaim responsibility for any injury to people or property resulting from any ideas, methods, instructions or products referred to in the content. |
© 2024 by the authors. Licensee MDPI, Basel, Switzerland. This article is an open access article distributed under the terms and conditions of the Creative Commons Attribution (CC BY) license (https://creativecommons.org/licenses/by/4.0/).