Article

Synthesis of Highly Intercalated Urea–Clay Nanocomposite via Pomegranate Peel Waste as Eco-Friendly Material

by
Abolfazl Teimouri Yanehsari
1,
Hossein Sabahi
1,*,
Yousef Jahani
2,
Mohammad Hossein Mahmoodi
1 and
Farzaneh Shalileh
1
1
Division of Nanobiotechnology, Department of Life Science Engineering, Faculty of New Sciences and Technologies, University of Tehran, Tehran 14399-57131, Iran
2
Iran Polymer and Petrochemical Institute, Tehran 14977-13115, Iran
*
Author to whom correspondence should be addressed.
Agriculture 2024, 14(12), 2097; https://doi.org/10.3390/agriculture14122097
Submission received: 7 October 2024 / Revised: 10 November 2024 / Accepted: 18 November 2024 / Published: 21 November 2024
(This article belongs to the Section Agricultural Technology)

Abstract

:
Until now, no slow-release urea (SRU) fertilizer has been made using the screw press method and the powder of plant residues rich in polyphenols, which are considered eco-friendly materials due to some health benefits for agricultural soil. Therefore, the goal of this experiment was to synthesize a novel SRU fertilizer using “eco-friendly materials” and the “screw press method”. In order to achieve this goal, urea (U) was innovatively and highly intercalated between interlayers of impure montmorillonite (Mt) (bentonite) with the help of polyphenol-rich pomegranate peel powder (PPP) by a single-screw oil press machine. The experiment had five treatments, including a fixed ratio of U/Mt (4:1) with variable ratios of U/Mt/PPP (w/w), including 4:1:0 (F1), 4:1:1 (F2), 4:1:1.5 (F3), and 4:1:2 (F4). Control (U) and F5 treatments (U/PPP at ratio of 4:1) were also included. These composites were fabricated using a single-screw oil press machine. The produced composites were characterized using FTIR, SEM, XRD, and TG analyses. The release pattern was studied using the White method. The XRD (low-angle) results revealed that the interlayer space of Mt increased from 12.3 Å in bentonite to 19.4 Å, 27.3 Å, 25.7 Å, and 0 Å in the F1, F2, F3, and F4 composites, respectively, which is an indicator of the high intercalation of U between the interlayers of Mt, especially in the F2 treatment. The XRD (low- and normal-angle) analyses indicated that the two main reasons for the high intercalation in the F2 treatment were, first, the complete conversion of urea from a crystalline to an amorphous state by PPP and, second, the increase in the interlayer space of Mt nano-sheets by PPP. It seems that PPP at a low concentration (F2) can have a positive effect on the placement of U in the interlayer space, but at high concentrations (F4), due to intensive pectin gelation, the space between the Mt layers grows until complete exfoliation. FTIR spectra and TG analysis also confirmed this hypothesis. SEM images revealed the formation of an intensive crosslink between U, Mt, and PPP. A release test in water revealed that only 10% of U in the F2 treatment was released after 10 h, and 87% after 120 h, which indicates the satisfactory slow-release pattern of this composite. By comparing the results of the present study with the other SRUs reported in the literature, it can be concluded that the composite F2, in addition to offering valuable polyphenol-rich plant materials, had an acceptable performance in the aspect of the U release pattern.

1. Introduction

The production of nitrogen fertilizers for modern agriculture began in 1913 with the discovery of the Haber–Bosch process. Today, nearly half of the world’s population relies on enhanced crop yields, especially wheat and rice, through the use of nitrogen fertilizers to access affordable food [1]. The most common nitrogen fertilizer is urea fertilizer with 46% nitrogen by weight. However, the major problem of U fertilizer is its rapid hydrolysis into ammonium and then its transformation to nitrate (nitrification) in the soil, causing extensive losses in the form of nitrate leaching [2] and ammonia and NxOy emission [3]. It has been estimated that only 30–50% of the dose of nitrogen applied as urea can be recovered by plants. The nitrate leaching from conventionally formulated U contributes greatly to non-point-source pollution and the eutrophication of lakes and reservoirs [2,3]. Nitrogen leaching and emission, in addition to lowering the efficiency of urea fertilizer, have adverse effects on the environment and human health [4]. Therefore, this is a major challenge for modern agriculture and food security in the future. Nitrification, a microbial process, converts ammonium into nitrate. Nitrate can be converted into gaseous nitrogen (N2), nitric oxide (NO), and nitrous oxide (N2O) through denitrification, leading to their release into the atmosphere [5]. Nitrification inhibitors are considered a potent tool to mitigate the N loss associated with nitrification and denitrification, but they are not without drawbacks. These include high costs, limited efficacy, and potential environmental pollution [5]. Numerous studies have reported on the impact of crop residues on soil’s chemical, physical, and biological characteristics. As the most prevalent class of secondary plant metabolites, polyphenols contribute to various biological activities in plant and soil systems, including plant defense, allelopathy, and nutrient cycling [6]. Microbial activity is stimulated by low concentrations of polyphenols but is suppressed by high concentrations of polyphenols. Polyphenols, being natural secondary metabolites, fulfill the criteria necessary for effective nitrification inhibition [7]. Plant residues such as PPP, which are rich in polyphenols, can exhibit potent nitrification inhibitory properties.
Another important way to enhance NUE is the use of SRU. Currently, the common method for SRU production is to coat or extrude U granules using synthetic and natural polymers. For example, Gu et al. (2019) successfully produced SRU using Mt and pure lignin [8]. Pereira et al. (2015) and Yamamoto et al. (2016) succeeded in producing SRU using paraformaldehyde/polyacrylamide hydrogel [9,10]. Pereira et al. (2012), in another experiment, succeeded in producing an efficient SRU with environmentally friendly materials (bentonite) and an environmentally friendly method of cold extrusion [11]. Xia et al. (2021) coated U granules using the melt-mixing method at 120 °C with a mixture of two synthetic polymers, namely polylactic acid and polycaprolactone, and the consumption of some chemicals including anhydrous ferric chloride and acetyl tributyl citrate (ATBC) plasticizer [12]. Xiao et al. (2017) also succeeded in producing SRU using starch and chemicals including ceric ammonium nitrate, plus methylene-bisacrylamide as a crosslinker and saponification agent [13]. Xiaoyu et al. (2013) produced SRU using environmentally friendly materials of bentonite and an organic polymer [14]. In addition to these studies, the synthesis of SRU using other polymers and materials including polysulfone [15], poly (butylene succinate)/Mt [16], metal/Mt [17,18], methyl cellulose/Mt [19], and hydroxyapatite/Mt [20] has also been researched.
To synthesize a novel SRU, we decided to use materials that are both eco-friendly and environmentally friendly. To this end, we selected two materials, bentonite and PPP. These materials have been called environmentally friendly as no chemical has been applied for their preparation. Of these two materials, PPP is called eco-friendly due to having a high percentage of polyphenols [21,22]. It has been proved that plant polyphenols can improve the availability of other soil nutrients, especially phosphorus. Polyphenols can also retain exchangeable inorganic cations (Ca, Mg, and K) by providing sorption sites in highly leached, acidic soils, and can maintain the availability of metal micronutrients (e.g., Mn, Fe, and Cu) through the formation of organic complexes [7,23,24]. They can also improve the health of agricultural soil [22] and act as pesticides [25,26]. Accordingly, plant residues rich in polyphenols can be called eco-friendly materials for agricultural soil [27].
Although much research has been conducted in the field of producing SRU using different chemical and natural polymers, a comprehensive study has not been conducted on the combined use of eco-friendly materials (PPP), U, and Mt. In other words, the full potential of these natural materials in the production of fertilizers with a controlled release pattern has not been fully explored. Therefore, this study’s novelty lies in the use of a combination of U, PPP, and Mt for this purpose, as well as the usage of a high-efficiency method on an industrial scale, plus easy work, low cost, and compatibility with the environment.

2. Materials and Methods

2.1. Materials

Urea fertilizer was provided by Khorasan Petrochemical Co., Bojnord, North Korasan, Iran. Impure sodium bentonite was produced by Poodrsazan, Tehran, Iran. The chemical composition of the Mt, with a mesh size of 200 and a particle size of less than 75 μm, has been reported elsewhere [28]. To prepare the PPP, discarded pomegranate fruits were collected from Bajestan orchards, and then the peels were separated from aril and dried under natural conditions and then ground to the size of 75–100 µm by a grinding mill.

2.2. Fertilizer Production

Urea is currently produced by many petrochemical companies such as Pardis Petrochemical Company. To prepare SRU, the previous research in this field revealed that the best SRU was obtained in the ratio of 1:4 of Mt/U; thus, we also chose this ratio in all treatments (Table 1). The Mt to PPP ratio (w/w) was determined after several preliminary experiments as Table 1. The preparation of composites included three stages: mixing, screw pressing, and granulating (powdering).
To prepare the five composite fertilizers (Table 1), first, Mt and U and PPP according to Table 1 were separately weighed and premixed, to which 8% water (w/w) at a temperature of 25 °C was added. The obtained mixtures were pressed and molded by a single-screw oil press machine (Figure S1) (model ZX85 with a production capacity of 1.4–2 tons/24 h, weight of 260 kg, size of 1.2 × 0.4 × 0.9 m, Ruian Every Machinery, Mcrayone, China) at 120 °C and turned into pellets with a diameter of 5 mm by a grinding mill. The fertilizers were dried at room temperature for 48 h under natural conditions. It is important to mention that the X170 model of this machine, which is far larger in weight (1410 kg) and size (2.2 × 0.8 × 1.8 m), has a capacity of 20 tons of fertilizer per 24 h, which can be used for industrial production.

2.3. Characterization of Nanocomposites

To analyze the exfoliation process of Mt and intercalation of U molecules between interlayers of Mt and determine the crystalline state of the nanocomposites, X-ray diffraction (XRD) was performed using a Philips X-ray diffractometer (X’PERT MPD, Eindhoven, The Netherlands) with a Co Kα incident beam.
Fourier Transform Infrared Spectroscopy (FTIR) was performed to analyze the functional groups of Mt, U, F, and PPP as well as their interactions with each other using a Spectrum version 10.7.2 spectrophotometer (PerkinElmer, Waltham, MA, USA) with a KBr disk within the range of 400–4000 cm−1.
To determine the water content and the thermal stability of composites, thermogravimetry analysis (TGA) was performed using an SDT Q600 thermogravimetric analyzer (TA Instruments, New Castle, DE, USA) at a heating rate of 10 °C/min under a flow of argon (50 mL min−1).
Scanning electron microscopy (SEM) was performed to analyze the morphology of composites using a Field Emission Scanning Electron Microscope (FESEM) (JEOL JSM-6360, Mira-3Tescan, Brno, Czech Republic).

2.4. Release Pattern

U release in water was assessed based on the White et al. method [29]. The experiment was performed using a dialysis membrane (Cellulose MC-30, Sigma-Aldrich, Louis, MI, USA) to avoid the dissolution of clay and separate its possible solution equilibrium effects. Under acidic conditions, para-di methyl amino benzaldehyde (PDAB) from Sigma-Aldrich and U react with each other and produce a lemon-yellow product. To determine the concentration of U in this solution, UV-Vis at the wavelength of 420 nm was used. However, ammonia and CO2 in the solution can interrupt the absorption process. Therefore, sulfuric acid with low concentration was employed to neutralize this effect.

2.5. Statistical Analysis

Release pattern data were shown as means ± standard deviation. Each treatment had three replicates. Statistical data analyses of release data were performed using ANOVA and means comparison by Tukey test at p < 0.05 through SPSS 21.0 software. All figures and curves were drawn by Excel 23.0 software.

3. Results

3.1. XRD Analysis (Low-Angle)

Figure 1 displays the XRD (low-angle) analysis of Mt and F1–F5 composites. It can be seen that there is a main peak in Mt at 2Ө = 7.2, which corresponds to the interlayer space of pure Mt. According to Bragg’s law, the interlayer distance at this angle is calculated to be 12.3 Å [28]. In composites F1, F2, and F3, where the ratio of Mt/U is constant (1:4) and only the percentage of PPP has been changed as 0%, 16.7%, and 23.1%, respectively, this angle has dropped to 4.56, 3.24, and 3.44 degrees, respectively. According to Bragg’s law, the interlayer distance in these third treatments is 19.4 Å, 27.3 Å, and 25.7 Å, respectively, which is strong evidence of the successful intercalation of U into the interlayer space of Mt, especially in treatment F2. In treatment F4, where the PPP content was elevated to 28.6%, no peak is observed, which could be a sign of exfoliation of Mt nanosheets [8]. In treatment F5, where there was no Mt, this curve is a straight line. These interesting results indicate that extrusion of PPP at a concentration of 16.7% along with U and Mt gave us the best result and caused the highest intercalation as well as interlayer distance of Mt. This interlayer distance has not been achieved in any other studies employing Mt and various natural plus synthetic polymers to convert Mt to organic clay to increase the interlayer distance and then use it in SRU production [9,10,11]. For example, Pereira et al. (2012) prepared SRU exactly the same as treatment F1 of the present experiment using a twin-screw extruder and were only able to increase the interlayer distance of Mt from 14.1 Å to 19.3 Å, which indicates a growth of 5.2 Å in the interlayer distance [11]. This increase in the present experiment was 15 Å. In another experiment, Pereira et al. (2015) mixed 80% U + 20% bentonite, similar to the present experiment, and then used two polymers, polyacrylamide hydrogel and polycaprolactone, at concentrations of 1%, 2%, and 4%, to prepare various SRUs using a twin-screw extruder. In these treatments, the maximum interlayer rose from 13.4 Å to 17.7 Å in the composite containing 20% bentonite plus 4% hydrogel [9]. In a third experiment, Yamamoto et al. (2016) were able to achieve a result similar to their second experiment in increasing the interlayer distance of Mt by producing a composite of 80% + 20% + 0.5 molar paraformaldehyde [10]. By comparing the results of the present experiment with the mentioned studies above, it can be suggested that after extruding PPP with U and Mt at a high temperature, the pectin that exists in the content of PPP [30] has been extracted and transformed to a gel structure in a reaction with Mt hydroxyl groups [31] and active sodium ions in Mt [32]. Then, with increasing temperature, the pectin gel is degraded, and its viscosity decreases [33], then, pectin monomers penetrate into the interlayer of Mt. Since pectin gel formation is thermo-reversible, the interaction between pectin and U as a thermo-reversible agent caused the pectin monomer to be re-transformed into gel structure between the interlayers of Mt as the composite cools [34,35]. However, in treatment F3, the higher content of PPP affects the viscosity of the matrix, which in turn limits the movement of Mt layers during extrusion, resulting in less intercalation. The formation of gel structures between the interlayers of Mt further expands the interlayer space as shown in the graphic abstract, which ultimately leads to a very desirable slow-release pattern, especially in treatment F2 (Figure 6). Nevertheless, the exact mechanism of the PPP on U intercalation is not completely clear to us, since in a previous experiment, the effect of PPP extract on the interaction in the melting method was far less than that in the current study [36]. Therefore, in order to find out its exact mechanism, further investigations are required in the future.

3.2. XRD Analysis (Normal-Angle)

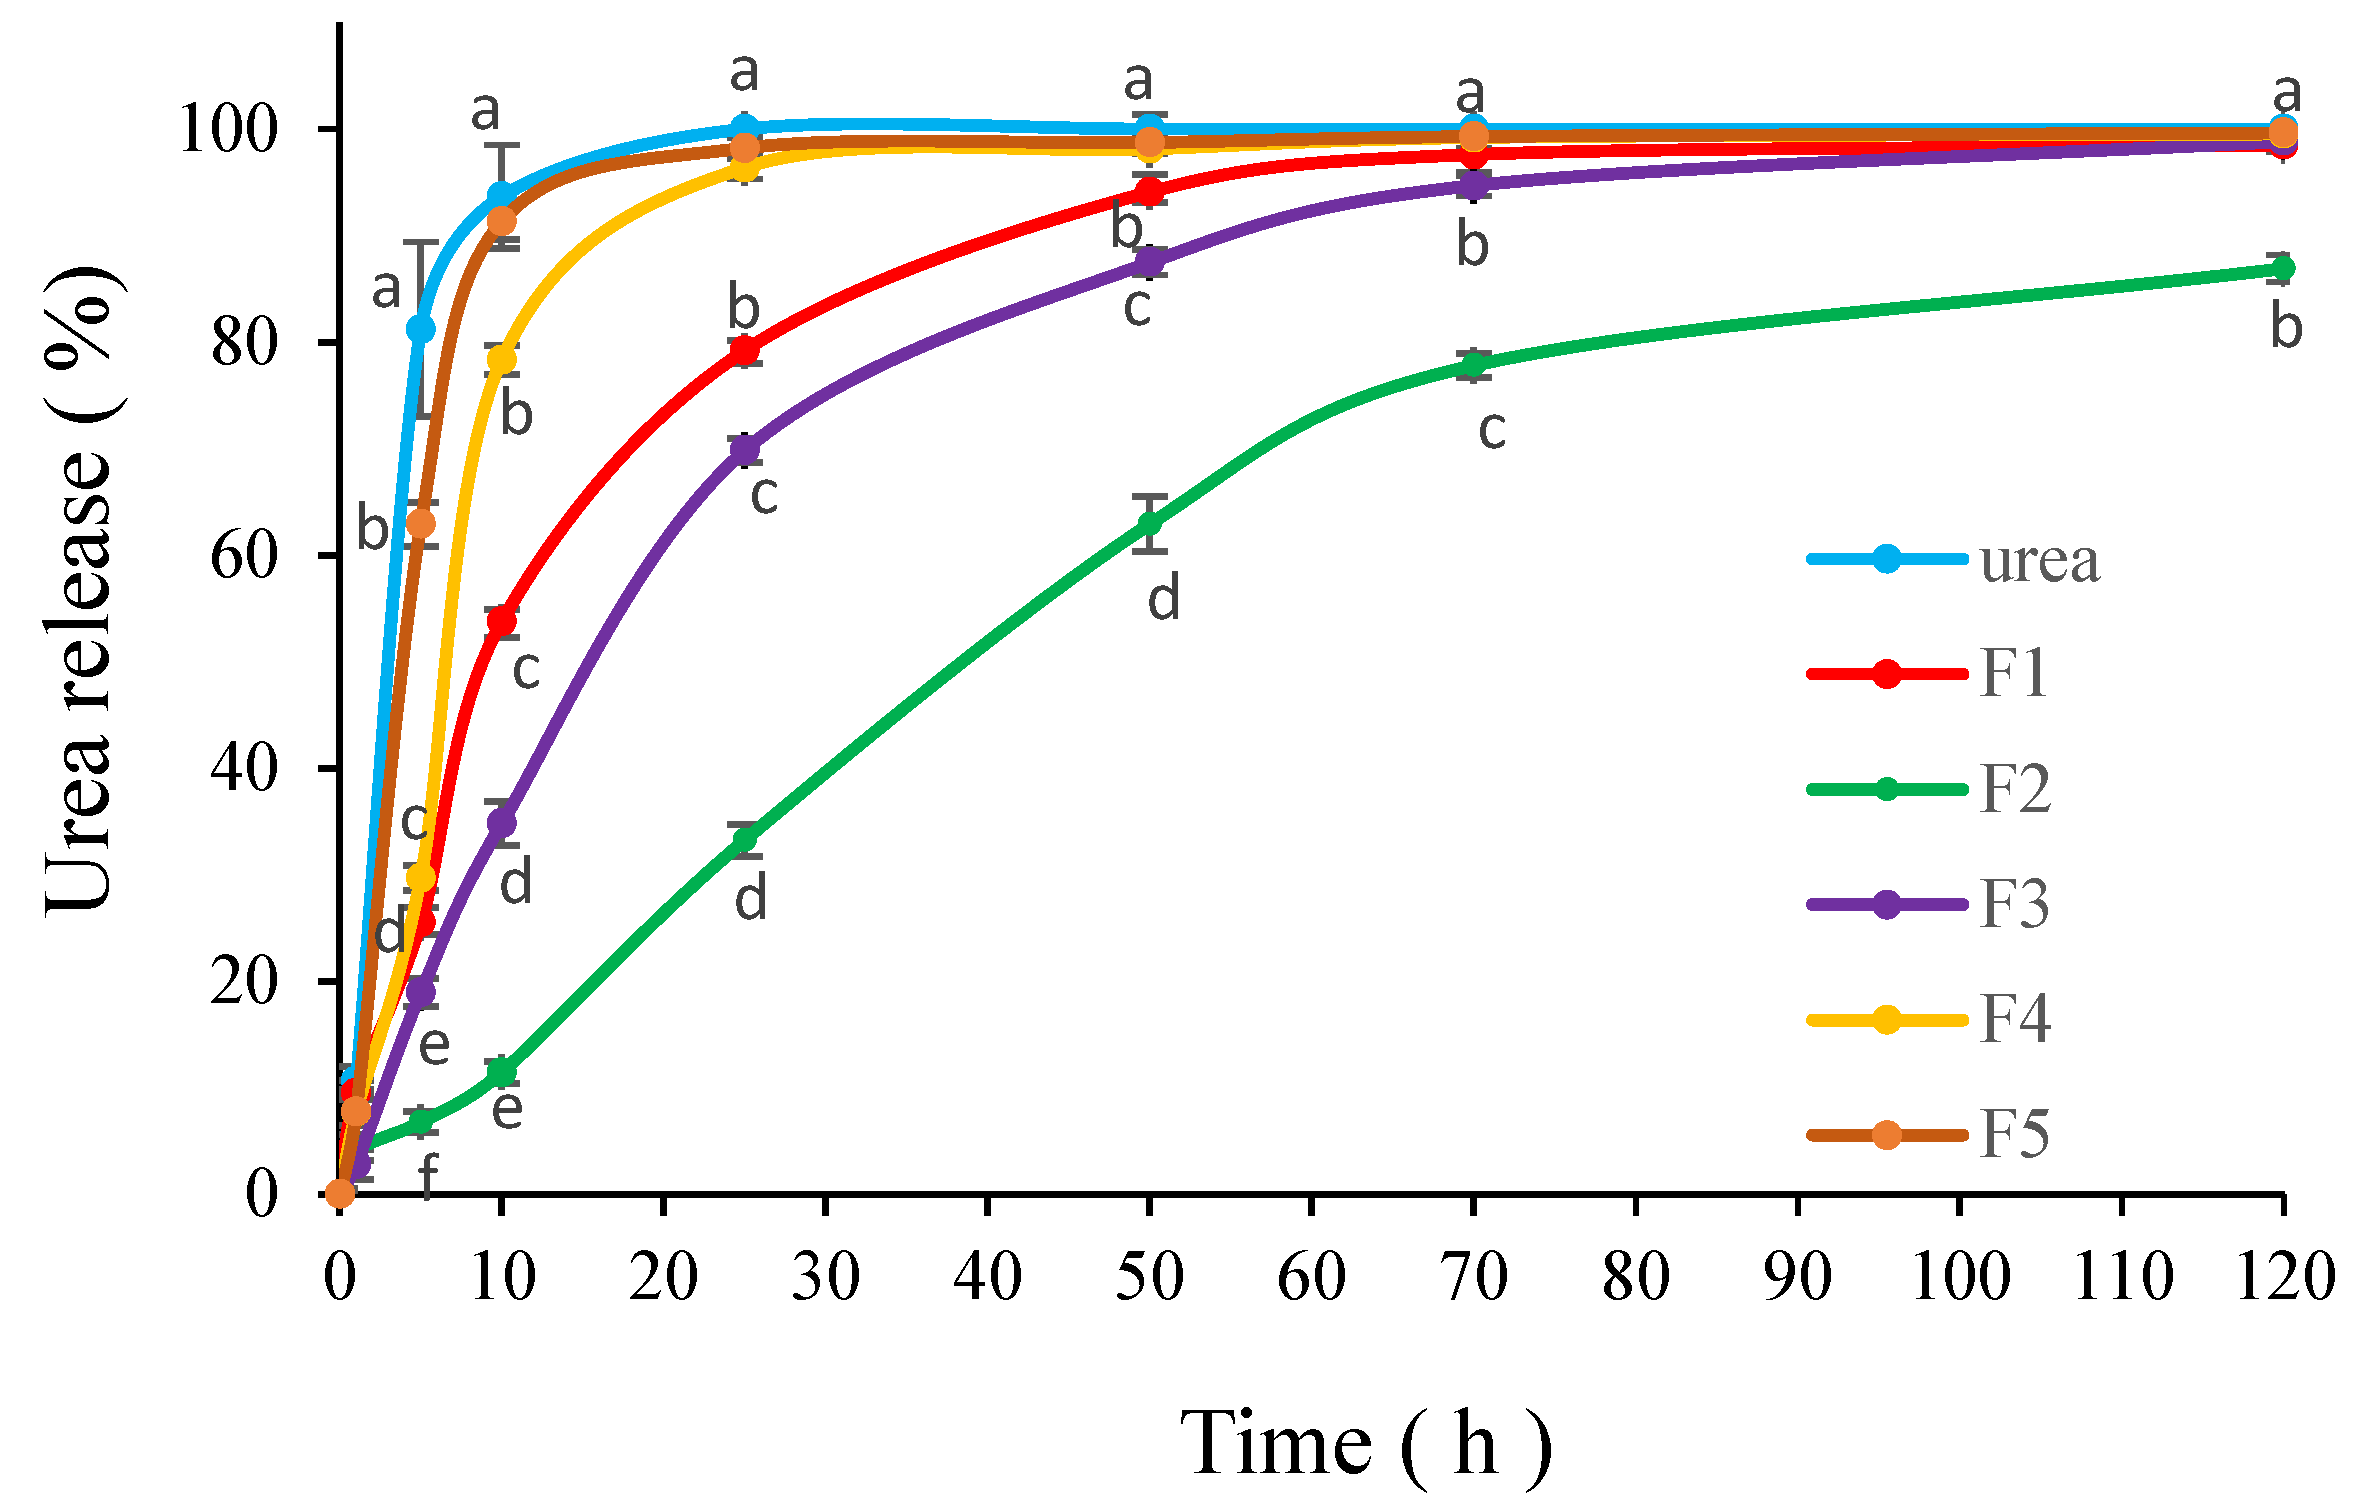
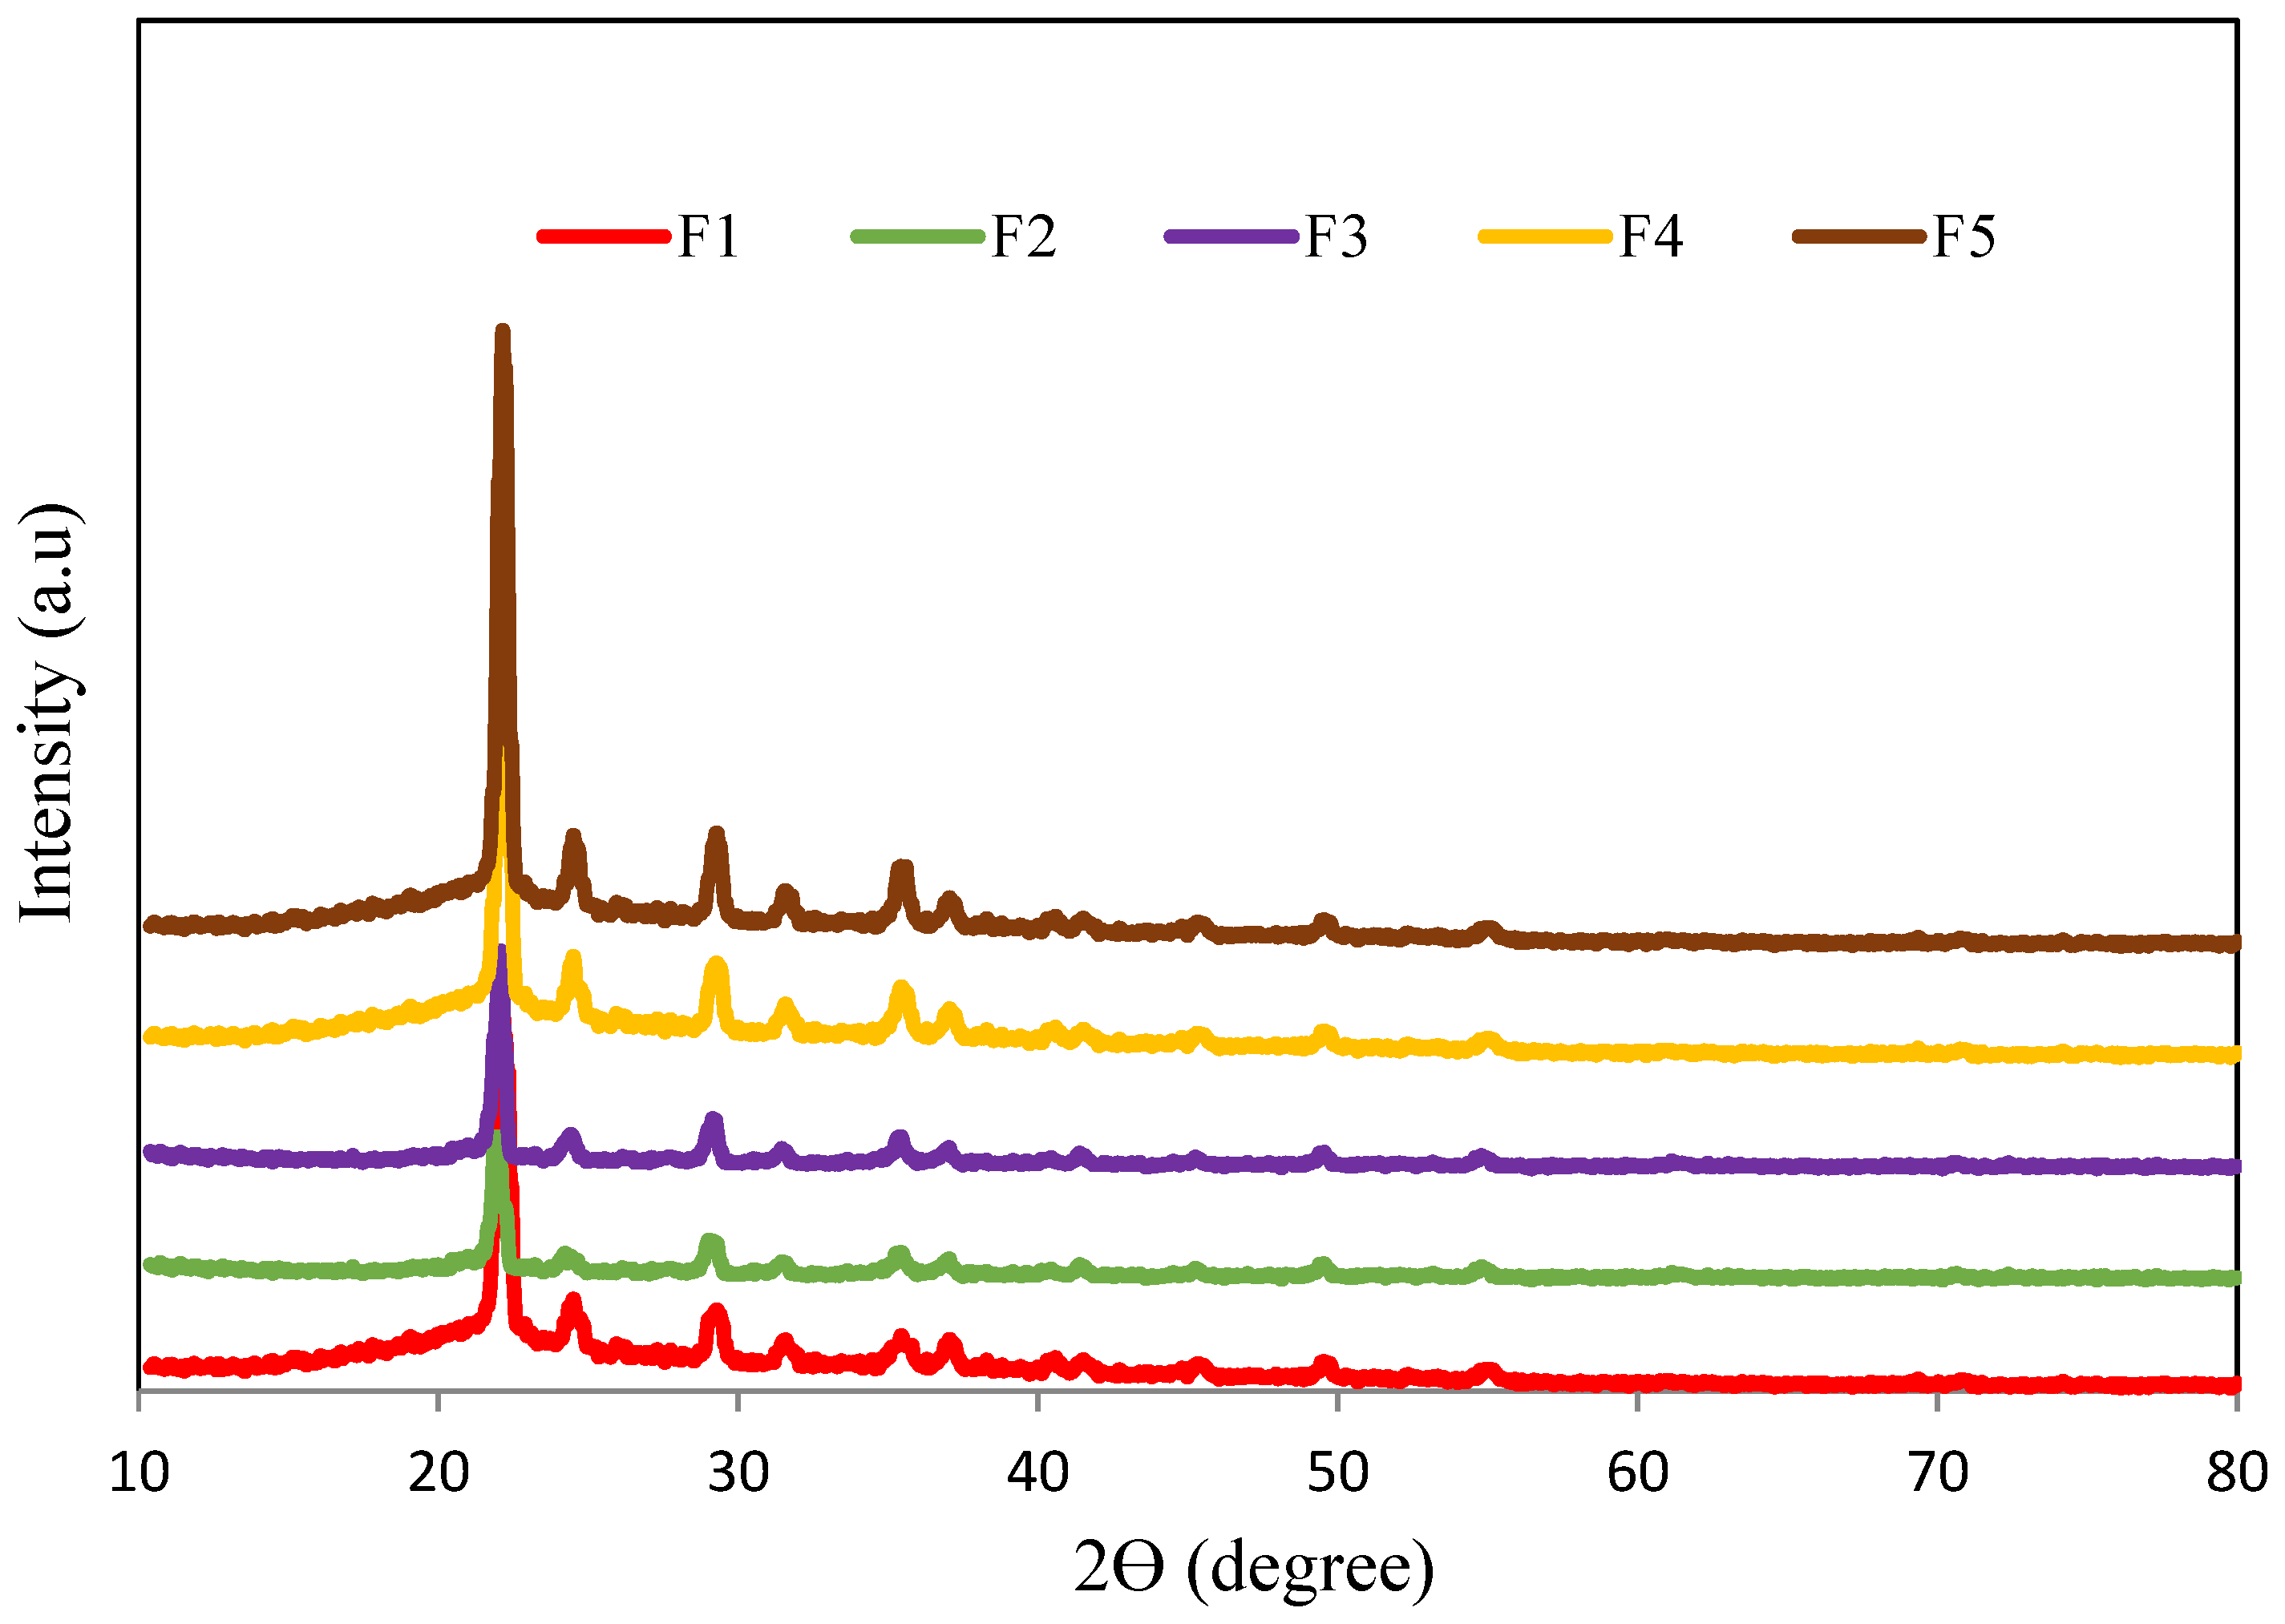
Figure 2 depicts the XRD analysis (normal-angle) which was performed to measure the crystallinity of U in composites F1–F5. The peaks at 22, 24.5, 29.2, 31.5, 35.5, and 37 degrees are related to the crystallinity of U [37]. The peaks of the F1 composite (U/Mt) at the mentioned angles have a higher intensity than the F2 (U/Mt/PPP16.7%) and F3 composites (U/Mt/PPP23.1%) but not that of F4 (U/Mt/PPP28.6%). This result shows that PPP, especially at a low concentration (F2), has been able to convert urea from a crystalline to an amorphous state, which can lead to more intercalation (Figure 1) [8]. The conversion of a composite to an amorphous state can also be attributed to the effect of Mt since Mt sheets can also disrupt urea crystal formation [38,39]. The intensity of the peaks related to the crystallinity of Mt at 19.5, 20, 26.5, and 30.5 degrees has disappeared [40]. The disappearance of crystalline planes of Mt is an indication of an extreme crystal lattice change which is consistent with XRD analysis (Figure 1) since heavy intercalation and exfoliation were reported in previous parts [41]. This process has led to the best release pattern in composite F2. Accordingly, the results of XRD (Figure 1 and Figure 2) are consistent with the release pattern (Figure 6).

3.3. FTIR Spectra

Figure 3 reveals the FTIR spectra of Mt, PPP, U, and five composites. In the FTIR spectra of U, the peaks at 3429 cm−1 and 3332 cm−1 are assigned to the asymmetric and symmetric stretching vibrations of NH2, respectively. The peak at 3252 cm−1 is due to the stretching vibration of absorbed water O-H. The peak at 1675 cm−1 can be assigned to the carbonyl (C=O) group, and the peak at 1592 cm−1 can be ascribed to the bending vibration of N-H and the stretching vibration of C-H of U. The peaks at 1457 cm−1 and 1148 cm−1 can be assigned to the bending vibration of N-H and the C-N stretching vibration, respectively [42,43].
The FTIR spectra of Mt show that their internal and external plane bonds are smaller than 1250 cm−1. The structure of Mt usually contains silicate layers that have cations such as aluminum and iron between their layers. According to Gul and Shah, Al-O-Si and Si-O-Si have vibration peaks at 517 cm−1 and 463 cm−1. Si-O vibration peaks are visible around 1004 cm−1 and 1108 cm−1. Al-Al-OH and Al-Fe-OH have vibrations peaking at 921 cm−1 and 792 cm−1. At 3627 cm−1 and 1629 cm−1, very small peaks related to the OH vibration of aluminum ions can also be seen [44].
Figure 3 also presents the FTIR spectra of PPP. The spectrum confirmed the complex nature of the PPP and proved the presence of a wide variety of compounds. It has been reported by studies that PPP contains different natural organic compounds. This figure indicates that the spectra for PPP showed a long band width of 3297 cm−1 indicating that the O-H stretching band confirms the presence of alcohol compounds and carboxylic acid groups. The C=C stretching band of the alkyne group was detected at the band of 2919–2850 cm−1. The sharp mid-intense peak at 1724 cm−1 can be attributed to carbonyl group C=O due to the presence of aldehydes, ketones, and carboxylic acids. The moderate sharp peak at 1609 cm−1 indicates the presence of unsaturated compounds (alkenes). The bands at 1443 cm−1 can be attributed to O-CH3 deformation. The band at 1320 cm−1 (CH2 bending) is related to the presence of cellulose. A peak at 1222 cm−1 (-CH3CO stretching) confirms the presence of ester and ether groups. The peak at 878 cm−1 can be related to -CCH and -COH bending.
Comparing the FTIR spectra of the five composites in the region of 3332 cm−1 and 3429 cm−1, which are related to the NH2 group, indicated that in the two more slow-release composites (Figure 6) of F2 and F3, both peaks have become broader than U, F1 and F4, revealing a stronger interaction between Mt and U in these two treatments (F2 and F3). The XRD analysis results (Figure 1 and Figure 2) also fully confirm this hypothesis. It can be seen (Figure 1) that the intercalation in the F2 and F3 composites was much greater than that in the F1 and F4 composites. In contrast, U crystallinity was lower in these two composites compared to two others (Figure 2). The peak 3252 cm−1 has also disappeared in these two composites, which again is an indication of self-assembly interactions [45]. Another very clear change in F2 and F3 compared to U, F1 and F4, is the disappearance of the 1675 cm−1 peak and the diminished sharpness of the 1592 cm−1, again showing more self-assembly interactions between U with Mt and PPP. A similar change, namely a decrease in the sharpness of peaks in F2 and F3, can be observed in the peaks of 1457 cm−1, 1148 cm−1, 790 cm−1, 763 cm−1, 590 cm−1, and 450 cm−1 which are connected by the vertical dotted lines (Figure 3). Another significant change that can be observed in these two treatments (F2 and F3) is the disappearance of the 1004 cm−1 peak, which is related to the Si-O bond. This also well indicates that the functional group of Si-O has been covered by the hydrogen bonds formed between the N-H group of U and the Si-O group of Mt [8,9]. In contrast to this change, it can be seen that the peak of 1052 cm−1 related to PPP has become sharper and clearer in these two treatments, which can confirm the hypothesis about the intercalation of U molecules between interlayers of Mt with the help of pectin. Another stronger piece of evidence of higher interaction between functional groups of F2 and F3 with PPP is the appearance of a new peak in these two treatments in the region of 1050 cm−1, which can be linked to polysaccharide functional groups such as pectin. These two peaks are not observed in the F1 and F4 treatments, but they are observed in the F5 treatment, which contains only U and PPP. The presence of two peaks of 2919 and 2850 in four composites of F2–F5 and its absence in composite F1 is a strong piece of evidence for the absence of PPP in this composite (F1).

3.4. TGA

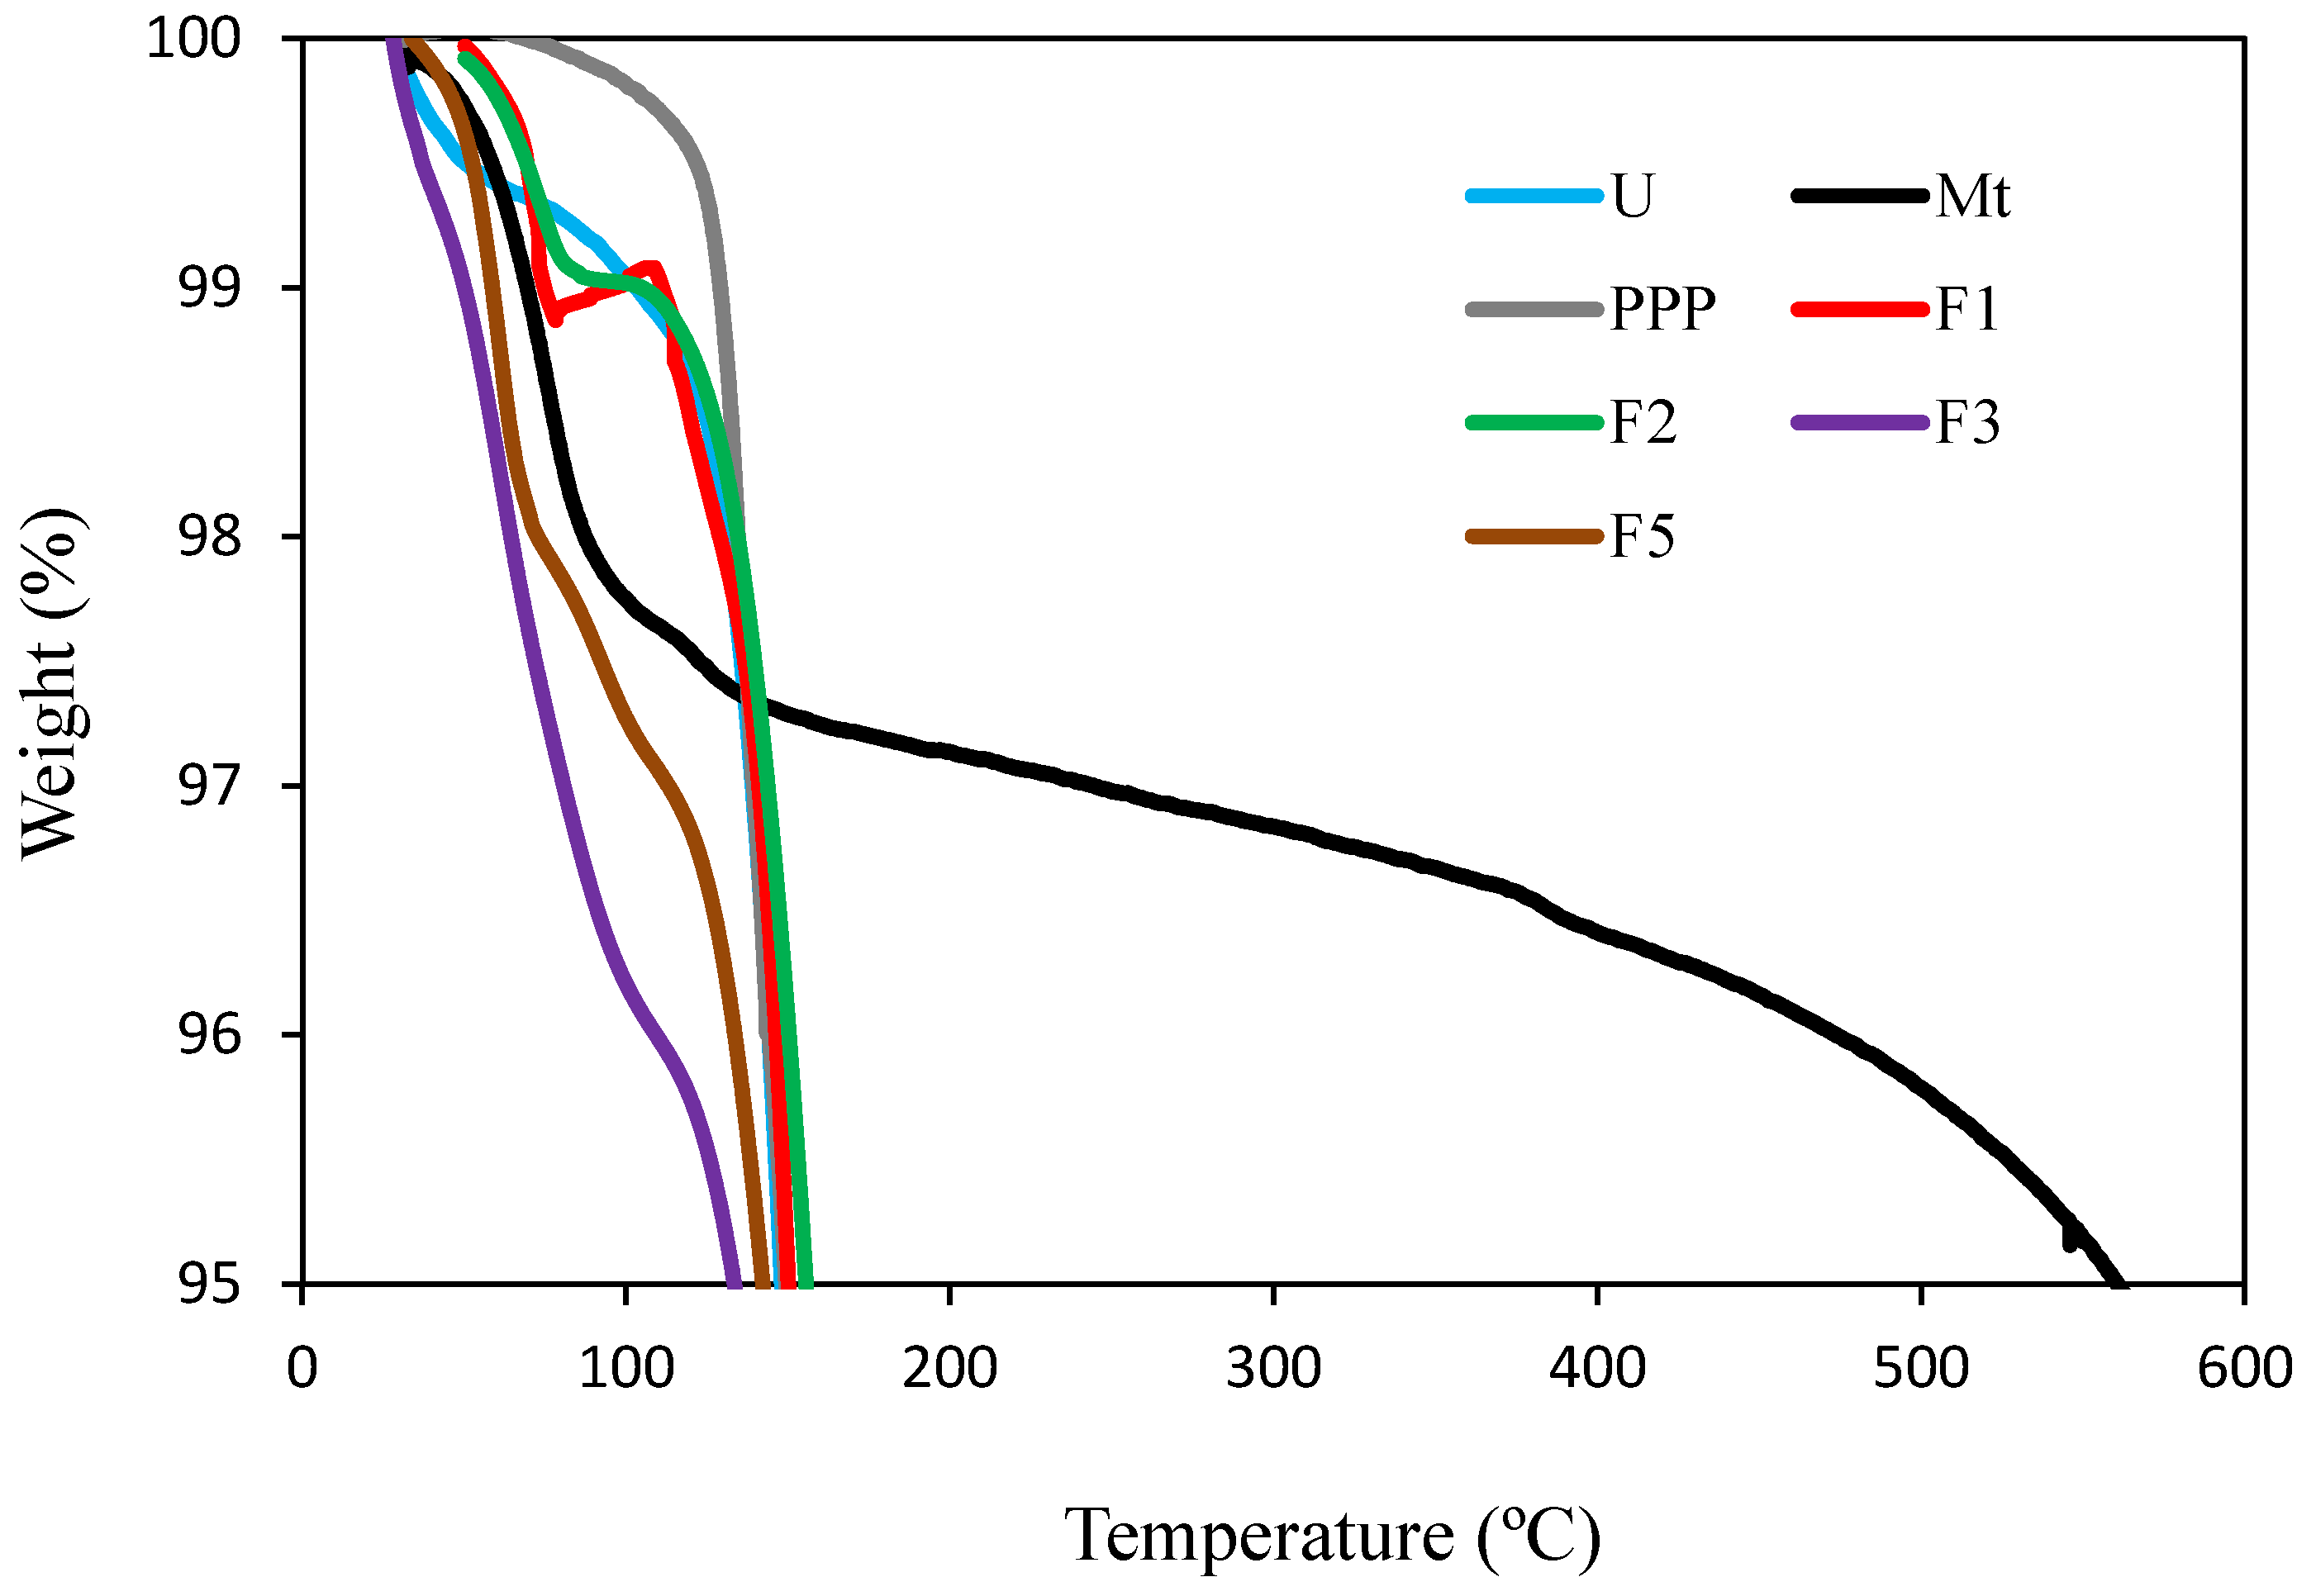
Thermogravimetric analysis (TGA) was used to measure the thermal stability of U and its composites. Figure S2 and Figure 4 indicate the results of TGA analysis for Mt, U, and PPP of F1–F5 composites. Mt does not decompose below 600 °C. Therefore, 95% of its weight remains unchanged at this temperature. The first weight loss of Mt occurs between 100 and 200 °C, which is attributed to the loss of adsorbed water, interlayer water, and structural water. The second weight loss occurs within 200–400 °C, which is probably due to the loss of structural water or de-hydroxylation of Mt [36].
The first weight loss of U occurs within 100–50 °C, which is due to the loss of water. The second weight loss occurs between 100 and 210 °C. At this stage, urea loses 50% of its weight. In the third stage, within 300–450 °C, the percentage of weight loss grows to 85%, and in the last stage, within 450–600 °C, less than 5% of U remains.
The reduction in the weight of PPP is performed in several stages and by reducing the total mass by %63 of weight within the temperature range of 133 to 500 °C. The first stage with a weight loss of 8% at 58–133 °C is related to the evaporation of water. Multiple decomposition at 194–334 °C is attributed to the degradation of hemicellulose, lignin, and cellulose [46]. Lignin has a wider degradation temperature range than cellulose and hemicellulose with maximum weight loss at 240 and 334 °C due to its constituent functional groups such as phenolic, hydroxyl, carboxyl, carbonyl, and methoxy groups [47].
Figure S2 demonstrates that the use of Mt in combination with U and PPP enhanced the thermal stability of F1–F3. The order of thermal resistance of these three treatments, which contained all three components of U, Mt, and PPP, was F2 > F3 > F4. The ratio of Mt/PPP also had a similar order of F2 > F3 > F4. If we look at the TGA analysis of these three treatments within the range of 0–150 °C, we find that the amount of free water and structural water in these three treatments was in the order of F4 > F3 > F2 (Figure 4). This result also confirms the intercalation and replacement of more U molecules instead of water molecules between the Mt nano-sheets in the F2 treatment compared to the F3 and F4 treatments. It can be suggested that the high content of hydrophilic compounds extracted from PPP in F3 and F4 treatments has captured U molecules by hydrogen bonding (Figure 3) and therefore prevented them from being intercalated between interlayers of Mt. The results of XRD analysis well prove this claim (Figure 1). What remains unclear here is the higher thermal resistance of treatment F2 compared to treatment F1. Based on the XRD analysis (Figure 1), which is well discussed in the relevant section, these results demonstrate that PPP at low concentration can have a positive effect on the intercalation of U into the interlayer spacing and hence on its thermal resistance and its release pattern (Figure 6), which requires extensive molecular research to elucidate its exact mechanism. The lowest thermal resistance (Figure S2) and the fastest release rate (Figure 6) were obtained for treatment F5, which had zero Mt and contained only a combination of U and PPP. This clearly shows the positive effect of Mt on improving thermal resistance as well as the slowing release pattern of U. However, it should be noted that the addition of PPP alone has improved the thermal resistance and consequently the release pattern of U compared to pure U very little, which can be attributed to the hydrogen bonds between U and extracted PPP compounds.

3.5. SEM Images

Figure 5 exhibits the structural morphology of Mt and F1 to F5 composites as examined by SEM. In composite F1, with the addition of Mt sheets, an irregular membrane-like surface with layers and irregular meshes is formed in the U matrix, where the crystalline structure of urea is visible on the surface of the layers (Figure 5). In composites F2, F3, and F4, where the U/Mt ratio was the same and the PPP ratio was different, Mt is homogeneously dispersed and forms a network structure via three-dimensional space. In composite F2, the Mt nano-sheets have dispersed homogeneously by full blending and formed a lattice structure in three-dimensional space [14,48,49]. The PPP extract has been dissolved in melting urea and extended its long chain in the solution; in this way, it cross-linked the Mt nano-sheets and strengthened the lattice frame (Figure 5) [14]. In the SEM images at a scale of 20 µm (Figure 5), we observe the layers of a continuous and smooth membrane covered with rectangular pieces (disintegrated PPP) in F2, which is different from F3 and F4 composites (Figure 5). The higher roughness and surface pores observed in F3 and F4 compared to F2 are due to the low intercalation of U and PPP between Mt sheets and its further crystallization (Figure 5). These observations demonstrate that the ratio of Mt/PPP used in the production of the composite has a significant effect on the morphology of the composite.
In composite F5, PPP lignocelluloses are observed, and U crystals are visible between and on the surface of these lignocelluloses (Figure 5). This lignocellulose network, due to the absence of Mt, has not been able to create a coherent three-dimensional network structure, and the composite has a rough and porous surface due to the crystalline U structure (Figure 5). The U has a sharp melting point (133 °C), so it takes on a tetragonal crystalline structure upon sudden cooling after melting, which is visible in the U crystal structure (Figure 5).

3.6. Release Pattern

Figure 6 displays the U release pattern in water for composites F1, F2, F3, and F4 where the ratio of U/Mt was constant and only the Mt/PPP ratio was different. Composite F5 only had 20% PPP and 80% U. Based on the results of Figure 6, it can be observed that the time required for the complete dissolution of pure U in water is less than 1 h. The amount of U release in F1 treatment was 25%, 50%, and 90% after 5 h, 10 h, and 50 h, respectively. In treatment F2, the conditions were completely different, so only 10% of U was released after 10 h. In this treatment, even after 120 h, 87% of U was released, which indicates a completely slow-release pattern.
In treatments F3 and F4, where the U/Mt ratio was the same as F2 but the PPP ratio was increased, the release rate rose sharply. The reason for this interesting phenomenon has been discussed in XRD, TGA, FTIR, and SEM sections. If we want to summarize the results of all these analyses, we can say that adding PPP and Mt to U in a specific ratio (4:1:0.25) was able to completely convert U from a crystalline to an amorphous state and consequently enable it to be fully intercalated between Mt sheets. This result (increasing the interlayer spacing of Mt to 27.3 Å) has not been reported in any reference so far for U/Mt/synthetic polymers or U/Mt/organic polymer composites. This allowed the Mt sheets to act as a strong barrier against urea dissolution in water and resulted in its controlled release.
Pereira et al. (2015) prepared slow-release U composites by mixing 80% U with 20% bentonite and then using two polymers, polyacrylamide hydrogel and polycaprolactone, at concentrations of 1%, 2%, and 4%, using a twin-screw extruder method. In these treatments, a maximum of 70% of U was released in the composite containing 20% bentonite plus 2% hydrogel over 72 h [9]. Xiaoyu et al. (2013) described the preparation of a slow-release U-based fertilizer composition using U, bentonite, and an organic polymer. They found that the slowest release rate was approximately 70% of U in 13 h [14]. Chen et al. (2008) found that 100% of U encapsulated in a copolymer matrix of starch and polylactic acid dissolves in water after 25 h [50]. Costa et al. (2013) used poly-hydroxybutyrate and ethyl cellulose to coat U granules and observed that 80% release of U in distilled water was between 3 and 5 min. A longer time for U dissolution was 1 h [51]. A study by Niu and Li (2012) revealed that the maximum dissolution time of U in water was 28 h when the U was coated with a (starch-g-polyvinyl acetate) membrane [52]. Comparing the results of the present study with the above-mentioned research showed that the F2 composite had an acceptable performance compared to the reported slow-release U fertilizers.
Figure 6. Release pattern of urea (U) and the five composites (F1–F5). A description of the F1 to F5 composites is shown in Table 1. Letters on each curve are significant labels. Treatments at each time point with non-common letters have a significant difference at p < 0.0 by Tukey’s test.
Agriculture 14 02097 g006

4. Discussion

In this study, the SRU was produced by the screw press method. This method is ideal for the production of large quantities of composite material with thermal and mechanical mixing. This method is also suitable for the kind of materials that have high viscosity and powder materials whose use can become complicated and expensive in other methods (coating, solution, etc.).
The additives that were used in this study, namely pomegranate peel powder and high-purity bentonite, are readily available and cheap to acquire. Clay materials such as montmorillonite have long been used as additives for their impressive mechanical and thermal properties due to their structure and composition. The intercalation of Mt by the matrix material, in this study U, has improved the physical properties of the composite, such as crystallinity, thermal stability, and release pattern. The effects of nano-clay materials have long been the subject of studies that have been referenced in previous parts.
Pomegranate peel powder (PPP) was another additive employed in the fertilizer composite. This powder consists of a variety of organic compounds such as pectin, lignin, cellulose, and lignin–cellulose. In this study, PPP proved to be a decisive factor for enhancing the amount of intercalation alongside Mt as is evident by the results of XRD analysis, especially for the F2 and F3 treatments (Figure 1). One factor that is discussed in this study is the phenomenon of pectin gelation. Pectin, in contact with Mt hydroxyl groups and sodium ions, undergoes a thermo-reversible gelation reaction. By elevating the temperature in the extrusion chamber, pectin gel viscosity diminishes and permeates into the interlayer of Mt. When the temperature drops at the end of extrusion, pectin gel structure forms between the Mt layers once more, further expanding the d-spacing in comparison to a Mt/U composite. This is the most probable cause of an exceptionally high degree of intercalation of the F2 treatment. In the F3 treatment, however, higher concentrations of PPP and pectin result in higher viscosity of the matrix, thus making it harder for Mt layers to distance themselves in a heated environment due to high viscosity. This explains the lower degree of intercalation in F3 treatment as opposed to F2. The results in the F4 treatment were interesting as no significant peaks were observed in the XRD pattern (Figure 1). This can be attributed to the fact that the F4 treatment had the lowest amount of Mt in its composition and a high amount of PPP. With the lowest amount of Mt, heat, and pectin gelation, the space between Mt layers grows to the point of complete exfoliation. This is the most likely scenario that can explain the result of treatment F4.
FTIR analysis of the treatments indicates functional groups of the components in the composites. The wave number related to N-H groups, C-O groups, and hydroxyl groups are all present in all composites as expected. Other than the change in intensity of the N-H bands and Si-O bands which are related to the concentration of U and Mt, respectively, and the change in hydroxyl groups as a result of a change in hydrogen bonding, no major change was observed. This shows that the composite did not undergo a radical chemical reaction as a result of heating through extrusion.
XRD analysis (normal-angle) also presents a significant change in the crystal lattices of the U. By examining the treatments, we can observe the lower crystallinity of the F2 treatment in comparison to other treatments and the control and overall lower crystallinity of all treatments that contain Mt as opposed to pure urea. This is the result of Mt layers disrupting the formation of new crystals as mentioned in the previous parts in detail. TGA analysis was also performed to examine the water content and thermal stability of the composites up to the temperature of 150 °C.
The SEM imagery of the treatments reveals that homogeneous dispersion of Mt and PPP into the U matrix can cause radically different morphology of the surface. As is evident in the presented images, the change in morphology is significant when the ratio of the components of the composite changes. This can be observed by comparing the crystalline structure of U with the three-dimensional, crystalline structure network of the F4 and F5 treatments. This effect can be attributed to the concentration of PPP rather than Mt; the reason for this assumption is the change in morphology with the rise in the PPP concentration in treatments F4 and F5. Due to the complexity of PPP’s composition, an accurate description of the events is not possible in this study, and the effect of PPP on the morphology of U crystals can be a subject for further research.
The release pattern of urea fertilizer has also been analyzed in Figure 6. In this analysis, the F2 treatment has shown the most promising result compared to other treatments. This can be attributed to low crystallinity and high intercalation of Mt in this composite, a result corroborated by the results of XRD analysis (Figure 1 and Figure 2).

5. Conclusions

The present study was conducted to produce a low-cost and eco-friendly SRU using agricultural waste (PPP) and nano-clay (Mt). The availability of pomegranate agricultural waste in some parts of the world and bentonite clay makes the results of this study economically viable. Aside from the gelation effect of the PPP pectin, this powder is also rich in polyphenol, which has the potential to boost the availability of some soil nutrients such as phosphorus, iron, zinc, and copper which can improve crop yield, a subject matter that can be investigated in future studies. The release pattern of the produced fertilizers was improved significantly compared to the control, strongly depending on the Mt/PPP ratio. The results indicated the possibility of producing an effective SRU with these low-cost materials.

Supplementary Materials

The following supporting information can be downloaded at: https://www.mdpi.com/article/10.3390/agriculture14122097/s1, Figure S1: Two-screw oil press machine model 180 mm with production capacity of 5–3 T/24 h, weight 600 kg, size 170*90*130, product (Iran Cold Pressing) of Iran; Figure S2: TGA of urea (U), montmorillonite (Mt), pomegranate peel powder (PPP) and their composites (F1–F5). Description of the F1 to F5 composites have been shown in Table 1.

Author Contributions

A.T.Y.: conceptualization, investigation, formal analysis, writing—original draft, visualization, funding acquisition. M.H.M.: writing—original draft, visualization, formal analysis. F.S.: investigation, H.S.: conceptualization, supervision, formal analysis, writing—review and editing, resources. Y.J.: methodology, instruments. All authors have read and agreed to the published version of the manuscript.

Funding

This research received no external funding.

Data Availability Statement

The data presented in this study are available on request from the corresponding author due to restrictions (e.g., privacy, legal or ethical reasons).

Acknowledgments

Financial support by the University of Tehran is gratefully acknowledged. Also, Khorasan Petrochemical Co. is thanked for preparing urea.

Conflicts of Interest

The authors declare no conflicts of interest.

References

  1. Borlaug, N.E. The Green Revolution Revisited and the Road Ahead; 1970 Nobel peace prize laureate. Anniversary lecture; The Norwegian Nobel Institute: Oslo, Norway, 2000. [Google Scholar]
  2. El-Razik, A.; Eman, M. Reducing nirate leaching through the soil profile using some nano-sized organic residues. J. Soil Sci. Agric. Eng. 2020, 11, 757–764. [Google Scholar]
  3. Kottegoda, N.; Sandaruwan, C.; Priyadarshana, G.; Siriwardhana, A.; Rathnayake, U.A.; Berugoda Arachchige, D.M.; Kumarasinghe, A.R.; Dahanayake, D.; Karunaratne, V.; Amaratunga, G.A.J. Urea-hydroxyapatite nanohybrids for slow release of nitrogen. ACS Nano 2017, 11, 1214–1221. [Google Scholar] [CrossRef] [PubMed]
  4. de Vries, W. Impacts of nitrogen emissions on ecosystems and human health: A mini review. Curr. Opin. Environ. Sci. Health 2021, 21, 100249. [Google Scholar] [CrossRef]
  5. Wang, X.; Bai, J.; Xie, T.; Wang, W.; Zhang, G.; Yin, S.; Wang, D. Effects of biological nitrification inhibitors on nitrogen use efficiency and greenhouse gas emissions in agricultural soils: A review. Ecotoxicol. Environ. Saf. 2021, 220, 112338. [Google Scholar] [CrossRef] [PubMed]
  6. Tang, S.; Ma, Q.; Luo, J.; Xie, Y.; Pan, W.; Zheng, N.; Liu, M.; Wu, L. The inhibition effect of tea polyphenols on soil nitrification is greater than denitrification in tea garden soil. Sci. Total Environ. 2021, 778, 146328. [Google Scholar] [CrossRef]
  7. Hättenschwiler, S.; Vitousek, P.M. The role of polyphenols in terrestrial ecosystem nutrient cycling. Trends Ecol. Evol. 2000, 15, 238–243. [Google Scholar] [CrossRef]
  8. Gu, H.; Zhang, Y.; Li, X.; Li, W.; Huang, S. Lignin improves release behavior of slow-release fertilizers with high content of urea. J. Appl. Polym. Sci. 2019, 136, 48238. [Google Scholar] [CrossRef]
  9. Pereira, E.I.; da Cruz, C.C.T.; Solomon, A.; Le, A.; Cavigelli, M.A.; Ribeiro, C. Novel slow-release nanocomposite nitrogen fertilizers: The impact of polymers on nanocomposite properties and function. Ind. Eng. Chem. Res. 2015, 54, 3717–3725. [Google Scholar] [CrossRef]
  10. Yamamoto, C.F.; Pereira, E.I.; Mattoso, L.H.C.; Matsunaka, T.; Ribeiro, C. Slow release fertilizers based on urea/urea–formaldehyde polymer nanocomposites. Chem. Eng. J. 2016, 287, 390–397. [Google Scholar] [CrossRef]
  11. Pereira, E.I.; Minussi, F.B.; da Cruz, C.C.T.; Bernardi, A.C.C.; Ribeiro, C. Urea–montmorillonite-extruded nanocomposites: A novel slow-release material. J. Agric. Food Chem. 2012, 60, 5267–5272. [Google Scholar] [CrossRef]
  12. Xia, Y.; Kwon, H.; Wander, M. Developing county-level data of nitrogen fertilizer and manure inputs for corn production in the united states. J. Clean. Prod. 2021, 309, 126957. [Google Scholar] [CrossRef]
  13. Xiao, X.; Yu, L.; Xie, F.; Bao, X.; Liu, H.; Ji, Z.; Chen, L. One-step method to prepare starch-based superabsorbent polymer for slow release of fertilizer. Chem. Eng. J. 2017, 309, 607–616. [Google Scholar] [CrossRef]
  14. Xiaoyu, N.; Yuejin, W.; Zhengyan, W.; Lin, W.; Guannan, Q.; Lixiang, Y. A novel slow-release urea fertilizer: Physical and chemical analysis of its structure and study of its release mechanism. Biosyst. Eng. 2013, 115, 274–282. [Google Scholar] [CrossRef]
  15. Tomaszewska, M.; Jarosiewicz, A. Use of polysulfone in controlled-release NPK fertilizer formulations. J. Agric. Food Chem. 2002, 50, 4634–4639. [Google Scholar] [CrossRef] [PubMed]
  16. Baldanza, V.A.R.; Souza, F.G., Jr.; Filho, S.T.; Franco, H.A.; Oliveira, G.E.; Caetano, R.M.J.; Hernandez, J.A.R.; Ferreira Leite, S.G.; Furtado Sousa, A.M.; Nazareth Silva, A.L. Controlled-release fertilizer based on poly (butylene succinate)/urea/clay and its effect on lettuce growth. J. Appl. Polym. Sci. 2018, 135, 46858. [Google Scholar] [CrossRef]
  17. Kim, K.S.; Park, M.; Choi, C.L.; Lee, D.H.; Seo, Y.J.; Kim, C.Y.; Kim, J.S.; Yun, S.-I.; Ro, H.-M.; Komarneni, S. Suppression of NH3 and N2O emissions by massive urea intercalation in montmorillonite. J. Soils Sediments 2011, 11, 416–422. [Google Scholar] [CrossRef]
  18. Kim, K.S.; Kim, M.-T.; Ryu, J.-H.; Choi, J.-S.; Park, K.D.; Kang, H.-W.; Park, M. Metal-urea-montmorillonite hybrid incorporated with citric acid. Korean J. Soil Sci. Fertil. 2013, 46, 610–614. [Google Scholar] [CrossRef]
  19. Bortolin, A.; Aouada, F.A.; Mattoso, L.H.C.; Ribeiro, C. Nanocomposite paam/methyl cellulose/montmorillonite hydrogel: Evidence of synergistic effects for the slow release of fertilizers. J. Agric. Food Chem. 2013, 61, 7431–7439. [Google Scholar] [CrossRef]
  20. Madusanka, N.; Sandaruwan, C.; Kottegoda, N.; Sirisena, D.; Munaweera, I.; De Alwis, A.; Karunaratne, V.; Amaratunga, G.A.J. Urea–hydroxyapatite-montmorillonite nanohybrid composites as slow release nitrogen compositions. Appl. Clay Sci. 2017, 150, 303–308. [Google Scholar] [CrossRef]
  21. Pathak, P.D.; Mandavgane, S.A.; Kulkarni, B.D. Valorization of pomegranate peels: A biorefinery approach. Waste Biomass Valorization 2017, 8, 1127–1137. [Google Scholar] [CrossRef]
  22. Shinde, P.N.; Mandavgane, S.A.; Karadbhajane, V. Process development and life cycle assessment of pomegranate biorefinery. Environ. Sci. Pollut. Res. 2020, 27, 25785–25793. [Google Scholar] [CrossRef] [PubMed]
  23. Czaban, W.; Rasmussen, J.; Laursen, B.B.; Vidkjaeer, N.H.; Sapkota, R.; Nicolaisen, M.; Fomsgaard, I.S. Multiple effects of secondary metabolites on amino acid cycling in white clover rhizosphere. Soil Biol. Biochem. 2018, 123, 54–63. [Google Scholar] [CrossRef]
  24. Peter Constabel, C.; Yoshida, K.; Walker, V. Diverse ecological roles of plant tannins: Plant defense and beyond. In Recent Advances in Polyphenol Research; John Wiley & Sons Ltd.: Hoboken, NJ, USA, 2014. [Google Scholar]
  25. Zolotareva, O.K.; Podorvanov, V.V.; Dubyna, D.V. Polyphenolic compounds of macrophytes and their ecological importance. Ukr. Bot. J. 2017, 74, 373–384. [Google Scholar] [CrossRef]
  26. Singh, S.; Kaur, I.; Kariyat, R. The multifunctional roles of polyphenols in plant-herbivore interactions. Int. J. Mol. Sci. 2021, 22, 1442. [Google Scholar] [CrossRef] [PubMed]
  27. Munakata, R.; Larbat, R.; Duriot, L.; Olry, A.; Gavira, C.; Mignard, B.; Hehn, A.; Bourgaud, F. Polyphenols from plant roots: An expanding biological frontier. Recent Adv. Polyphen. Res. 2019, 6, 207–236. [Google Scholar]
  28. Rabiei, M.; Sabahi, H.; Rezayan, A.H. Gallic acid-loaded montmorillonite nanostructure as a new controlled release system. Appl. Clay Sci. 2016, 119, 236–242. [Google Scholar] [CrossRef]
  29. With, T.K.; Petersen, T.D.; Petersen, B. A simple spectrophotometric method for the determination of urea in blood and urine. J. Clin. Pathol. 1961, 14, 202–204. [Google Scholar] [CrossRef]
  30. Abid, M.; Cheikhrouhou, S.; Renard, C.M.G.C.; Bureau, S.; Cuvelier, G.; Attia, H.; Ayadi, M.A. Characterization of pectins extracted from pomegranate peel and their gelling properties. Food Chem. 2017, 215, 318–325. [Google Scholar] [CrossRef]
  31. Newton, A.G.; Lee, J.-Y.; Kwon, K.D. Na-montmorillonite edge structure and surface complexes: An atomistic perspective. Minerals 2017, 7, 78. [Google Scholar] [CrossRef]
  32. Kastner, H.; Einhorn-Stoll, U.; Fatouros, A.; Drusch, S. Impact of sodium ions on material properties, gelation and storage stability of citrus pectin. Food Hydrocoll. 2020, 104, 105750. [Google Scholar] [CrossRef]
  33. Owens, H.S.; Swenson, H.A.; Schultz, T.H. Factors influencing gelation with pectin. In Natural Plant Hydrocolloids; ACS Publications: Washington, DC, USA, 1954. [Google Scholar]
  34. Said, N.S.; Olawuyi, I.F.; Lee, W.Y. Pectin hydrogels: Gel-forming behaviors, mechanisms, and food applications. Gels 2023, 9, 732. [Google Scholar] [CrossRef] [PubMed]
  35. Alonso-Mougán, M.; Meijide, F.; Jover, A.; Rodríguez-Núñez, E.; Vázquez-Tato, J. Rheological behaviour of an amide pectin. J. Food Eng. 2002, 55, 123–129. [Google Scholar] [CrossRef]
  36. Balooch, M.R.; Sabahi, H.; Aminian, H.; Hosseini, M. Intercalation technique can turn pomegranate industrial waste into a valuable by-product. LWT 2018, 98, 99–105. [Google Scholar] [CrossRef]
  37. Elshayb, O.M.; Nada, A.M.; Farroh, K.Y.; Al-Huqail, A.A.; Aljabri, M.; Binothman, N.; Seleiman, M.F. Utilizing urea–chitosan nanohybrid for minimizing synthetic urea application and maximizing oryza sativa l. productivity and N uptake. Agriculture 2022, 12, 944. [Google Scholar] [CrossRef]
  38. Wibowo, E.S.; Lubis, M.A.R.; Park, B.-D.; Kim, J.S.; Causin, V. Converting crystalline thermosetting urea–formaldehyde resins to amorphous polymer using modified nanoclay. J. Ind. Eng. Chem. 2020, 87, 78–89. [Google Scholar] [CrossRef]
  39. Wibowo, E.S.; Park, B.-D. Crystalline lamellar structure of thermosetting urea–formaldehyde resins at a low molar ratio. Macromolecules 2021, 54, 2366–2375. [Google Scholar] [CrossRef]
  40. Whittig, L.D.; Allardice, W.R. X-ray diffraction techniques. Methods Soil Anal. Part 1 Phys. Mineral. Methods 1986, 5, 331–362. [Google Scholar]
  41. Stanev, V.; Vesselinov, V.V.; Kusne, A.G.; Antoszewski, G.; Takeuchi, I.; Alexandrov, B.S. Unsupervised phase mapping of x-ray diffraction data by nonnegative matrix factorization integrated with custom clustering. NPJ Comput. Mater. 2018, 4, 43. [Google Scholar] [CrossRef]
  42. He, X.; Liao, Z.; Huang, P.; Duan, J.; Ge, R.; Li, H.; Geng, Z. Characteristics and performance of novel water-absorbent slow release nitrogen fertilizers. Agric. Sci. China 2007, 6, 338–346. [Google Scholar] [CrossRef]
  43. Xie, L.; Liu, M.; Ni, B.; Zhang, X.; Wang, Y. Slow-release nitrogen and boron fertilizer from a functional superabsorbent formulation based on wheat straw and attapulgite. Chem. Eng. J. 2011, 167, 342–348. [Google Scholar] [CrossRef]
  44. Gul, W.; Shah, S.R.A.; Khan, A.; Pruncu, C.I. Characterization of zinc oxide-urea formaldehyde nano resin and its impact on the physical performance of medium-density fiberboard. Polymers 2021, 13, 371. [Google Scholar] [CrossRef] [PubMed]
  45. Jafari, Y.; Sabahi, H.; Rahaie, M. Stability and loading properties of curcumin encapsulated in Chlorella vulgaris. Food Chem. 2016, 211, 700–706. [Google Scholar] [CrossRef] [PubMed]
  46. Basak, S.; Ali, S.W. Leveraging flame retardant efficacy of pomegranate rind extract, a novel biomolecule, on ligno-cellulosic materials. Polym. Degrad. Stab. 2017, 144, 83–92. [Google Scholar] [CrossRef]
  47. Sabzevari, A.G.; Sabahi, H. Montmorillonite an efficient oral nanocarrier for punicalagin-rich pomegranate peel extract: An in vitro study. J. Drug Deliv. Sci. Technol. 2023, 86, 104713. [Google Scholar] [CrossRef]
  48. Bhattacharjee, S.; Elimelech, M. Surface element integration: A novel technique for evaluation of DLVO interaction between a particle and a flat plate. J. Colloid Interface Sci. 1997, 193, 273–285. [Google Scholar] [CrossRef]
  49. Cai, D.; Wu, Z.; Jiang, J.; Ding, K.; Tong, L.; Chu, P.K.; Yu, Z. A unique technology to transform inorganic nanorods into nano-networks. Nanotechnology 2009, 20, 255302. [Google Scholar] [CrossRef]
  50. Chen, L.; Xie, Z.; Zhuang, X.; Chen, X.; Jing, X. Controlled release of urea encapsulated by starch-g-poly (l-lactide). Carbohydr. Polym. 2008, 72, 342–348. [Google Scholar] [CrossRef]
  51. Costa, M.M.E.; Cabral-Albuquerque, E.C.M.; Alves, T.L.M.; Pinto, J.C.; Fialho, R.L. Use of polyhydroxybutyrate and ethyl cellulose for coating of urea granules. J. Agric. Food Chem. 2013, 61, 9984–9991. [Google Scholar] [CrossRef]
  52. Niu, Y.; Li, H. Controlled release of urea encapsulated by starch-g-poly (vinyl acetate). Ind. Eng. Chem. Res. 2012, 51, 12173–12177. [Google Scholar] [CrossRef]
Figure 1. XRD (low-angle) of montmorillonite (Mt) and the five composites (F1–F5). A description of the F1 to F5 composites has been outlined in Table 1.
Agriculture 14 02097 g001
Figure 2. XRD (normal-angle) of the five composites (F1–F5). A description of the F1 to F5 composites is shown in Table 1.
Agriculture 14 02097 g002
Figure 3. FTIR spectra of the five composites (F1–F5). A description of the F1 to F5 composites is shown in Table 1. Most of the peaks that are connected by the vertical dotted lines are less sharp and broader compared to urea in the two composites of F2 and F3, which were more slow-release (Figure 6). This is a sign of stronger interaction between urea, Mt, and PPP in these two treatments.
Agriculture 14 02097 g003
Figure 4. Up-scale of Figure S2 in the weight range of 95% to 100%.
Agriculture 14 02097 g004
Figure 5. SEM images of urea (U), montmorillonite (Mt), and the five composites in the size of 20 µm (F1–F5). A description of the F1 to F5 composites is shown in Table 1.
Agriculture 14 02097 g005
Table 1. The details of the treatments designed for the synthesis of the five composites of urea.
TreatmentsMass Ratio U/Mt (w/w)Mass Ratio U/PPP (w/w)
U--
F1 (U/Mt)4:1-
F2 (U/Mt/PPP)4:14:0.25
F3 (U/Mt/PPP)4:14:0.5
F4 (U/Mt/PPP)4:14:75
F5 (U/PPP)-4:1
Disclaimer/Publisher’s Note: The statements, opinions and data contained in all publications are solely those of the individual author(s) and contributor(s) and not of MDPI and/or the editor(s). MDPI and/or the editor(s) disclaim responsibility for any injury to people or property resulting from any ideas, methods, instructions or products referred to in the content.