Article

Non-Destructive Prediction of Carotenoids, Ascorbic Acid, and Total Phenols Contents in ‘Tommy Atkins’ Mangoes Using Absorption and Scattering Properties Measured by Time-Resolved Reflectance Spectroscopy

1
Consiglio per la Ricerca in Agricoltura e L’analisi Dell’economia Agraria (CREA), Centro di Ricerca Ingegneria e Trasformazioni Agroalimentari (CREA-IT), Via Venezian 26, 20133 Milano, Italy
2
Istituto di Fotonica e Nanotecnologie, Consiglio Nazionale delle Ricerche (IFN-CNR), Piazza L. da Vinci 32, 20133 Milano, Italy
3
Dipartimento di Fisica, Politecnico di Milano, Piazza L. da Vinci 32, 20133 Milano, Italy
*
Author to whom correspondence should be addressed.
Agriculture 2024, 14(11), 1902; https://doi.org/10.3390/agriculture14111902
Submission received: 26 September 2024 / Revised: 22 October 2024 / Accepted: 23 October 2024 / Published: 26 October 2024
(This article belongs to the Section Agricultural Product Quality and Safety)

Abstract

:
Mango fruit is a rich source of bioactive compounds such as carotenoids, phenolics, and ascorbic acid. This research aimed at predicting the content of these bioactive compounds in ‘Tommy Atkins’ mangoes using optical properties, i.e., the absorption coefficients related to chlorophylls (µa630, µa650, µa670, µa690) and carotenoids (µa540), and the scattering parameters (Mie’s A and b), measured during the shelf-life period at 20 °C by time-resolved reflectance spectroscopy. The µa540 and Mie’s b increased during shelf-life, while µa670 and Mie’s A decreased. Ascorbic acid (AA) and the total antioxidant capacity decreased during shelf-life, while the total carotenoids increased, and the total phenols (TPC) did not significantly change. The major constituent of the nonsaponified extracts, (all-E)-β-carotene, increased during the shelf-life period. A similar trend was observed for the total (all-E)-violaxanthin esters, the total (9Z)-violaxanthin esters and the total neoxanthin esters. Carotenoids are responsible for the yellow-orange color of mangoes: (all-E)-β-carotene was mainly related to a* and pulp color while the total (all-E)-violaxanthin esters were mainly linked to b*, C*, and the yellowness index. Using multiple regression analysis, good prediction models were achieved for the total carotenoids (R2adj = 83.1%), the total xanthophylls (R2adj = 78%), (all-E)-β-carotene (R2adj = 77%) and the total (all-E)-violaxanthin esters (R2adj = 74%), while less satisfactory predictions were obtained for AA and TPC.

1. Introduction

Mango (Mangifera indica L.) is one of the most important tropical fruits, and it is mainly cultivated in tropical and subtropical areas and, more recently, also in the Mediterranean region [1].
Mango fruit is a rich source of bioactive compounds such as carotenoids, phenolics, and ascorbic acid [2]. Carotenoids are responsible for the yellow-orange color of the pulp; their content and composition depend on the cultivar, maturity degree, edaphic and climatic factors, postharvest handling, storage conditions, and processing [1,3,4,5,6,7,8,9,10]. Differences in carotenoid composition reported by different authors for different cultivars can also be attributed to the analytical methods employed and to the unstable nature of carotenoids [2]. More than 25 different carotenoids (free form, butyrates, and esterified) have been identified in the pulp of mango fruit, such as cis-lutein, zeinoxanthin, all trans-α-carotene, all-trans-β-cryptoxanthin, 9-cis-β-carotene, cis-zea carotene, 13-cis-β carotene, lutein, βcryptoxanthin, zeaxanthin, lutin, and neoxanthin [2,11,12,13,14,15,16]. However, all-trans-β-carotene and dibutyrates of all-trans-violaxanthin and 9-cis-violaxanthin were the most abundant [2,5,12,15]. Carotenoids and the total carotene begin to be accumulated in the pulp during fruit growth and sharply increase as mangoes ripen, while xanthophylls and lutin show a decreasing trend [5,8,9,11,13,17]. Ascorbic acid and the total phenolic contents also vary according to the cultivar, maturity stage, and cultural practices [2,3,7,18]. The main polyphenols found in mango fruit pulp are as follows: mangiferin, catechins, quercetin, kaempferol, rhamnetin, anthocyanins, gallic and ellagic acids, propyl and methyl gallate, gallotannins, benzoic acid, protocatechuic acid, p-hydroxybenzoic acid, m-coumaric acid, p-coumaric acid, sinapic acid, vanillic acid, syringic acid, chlorogenic acid, and ferulic and caffeic acids [1,2,7,10,19,20]. The phenolic profile changes with the cultivar and with ripening. Gentile et al. [1] observed very limited variations between green mature and mature fruits. However, when mangiferin showed very high content, it was mainly concentrated in mature fruits rather than in green mature ones; on the contrary, benzoic acid content was higher in mature fruits for ‘Tommy Atkins’ and lower in mature fruits for ‘Manzanillo’. Phenolic compounds, such as gallic acid and gallotannins, decrease during storage due to ripening, resulting in a loss of astringency [10]. Hu et al. [19] observed a decline in phenolic acids as mangoes ripened, coinciding with the trend in the total phenolics. Mangiferin, quercetin, and gallotannins dramatically decreased in medium firm mangoes, increased in slightly soft fruit, and decreased at the senescence phase.
Ripening also strongly affects consumer preferences. Overall acceptance increases from the green-ripe to the mature-ripe stage: mangoes with a high firmness were characterized by a green aroma, fibrousness, and a sour taste, while soft mature fruits show a sweet taste, juiciness, and a tropical fruit aroma [3,21]. Therefore, the determination of reliable maturity indices at harvest is very important for the mango fruit industry in order to have fruit with a good content of bioactive compounds coupled with an optimum eating quality when ripe. Commonly, the harvest time is determined either through subjective factors such as fruit shape and appearance, or through destructive methods (pulp color, dry matter, flesh firmness, titratable acidity), which can be applied only to a sample of the fruit batch [22,23,24,25]. Nondestructive techniques can be used to measure a large number of fruits, allowing for a much more representative sample. There is a paucity of papers dealing with the use of nondestructive methods to predict the content of polyphenols, ascorbic acid, the total carotenes, and the individual carotenes. In the literature, there are many papers dealing with the prediction of the total soluble solids, acidity, pH, dry matter, firmness, and color using Vis-NIR spectroscopy, as reported by O’Brien ([26], Table S1). However, Vis-NIR models do not perform well on fruits from different origins and seasons due to the high biological variability and because they predict maturity parameters indirectly. The time domain approach overcomes these drawbacks, as time-resolved reflectance spectroscopy (TRS) allows the direct, nondestructive measure of the quality of attributes in the fruit pulp.
TRS, differently from continuous wave methods, can simultaneously measure the effects of light absorption due to chemical compounds (water, carotenoids, anthocyanins, chlorophylls) and light scattering, mainly due to microscopic changes in the refractive index caused by membranes, organelles, vacuoles, starch granules, and air [27]. In the TRS technique, a short pulse of monochromatic light is injected into the fruit; whenever a photon strikes a scattering center, it changes its trajectory and keeps on propagating in the tissue until it is eventually re-emitted across the boundary or it is captured by an absorbing center. Usually, the laser light is injected into and collected from the fruit by using two optical fibers placed in contact with the surface at a distance of 1–2 cm. The laser light probes a banana-shaped volume of tissue to a depth of 1–2 cm, in contrast to continuous-wave Vis-NIR spectrophotometers, which have a useful penetration depth of a few millimeters, depending on the wavelength [28]. By measuring the photon distribution of time-of-flight, both the absorption (μa) and reduced scattering (μs′) coefficients in the Vis–NIR spectrum region are estimated [29,30]. TRS relies on the ability to measure the optical properties of the fruit mesocarp with no or limited influence from the skin, as the spectra acquired on the whole fruit were very similar to the spectra of the same fruit when peeled [29,30,31]. TRS has been applied in postharvest studies on fruits and vegetables to estimate the internal attributes related to maturity and ripeness, to detect internal defects, and to discriminate between fruits with different quality characteristics [31]. The absorption coefficient measured at harvest at 670 nm (µa670) decreases during fruit ripening and is considered an index of the biological age of the fruit [31]. The µa670 was successfully used to predict the softening rate in nectarines [32] and to sort fruit based on their potential maturity evolution in apples [33]. As for mangoes, Pereira et al. [34] found that µa630, related to chlorophyll-b content, could be used to predict the softening rate of ‘Tommy Atkins’ fruits. Eccher Zerbini et al. [35] showed the possibility of using µa670 and µa540 (linked to carotenoids) combined with scattering to predict the ethylene production rate and softening in ‘Haden’ mangoes, while Vanoli et al. [36] found that changes in µa540 were synchronized with changes in pulp color, highlighting that µa540 was able to assess the biological age of mangoes. Additionally, µa540 allowed researchers to classify the intact fruit of two mango cultivars (‘Haden’ and ‘Palmer’) according to the contents of the total phenolics, the total carotenoids, and of the individual carotenoid compounds and vitamin A values [17]. Similarly, mangoes with high µa630–690 values (low-mature) were firmer and showed a less yellow pulp than fruit with low µa630–690 values, i.e., more mature [31]. As for scattering, µs values strongly depend on the cultivars, showing the highest values in ‘Palmer’ and ‘Tommy Atkins’ fruits and the lowest in ‘Haden’, and the values decreased during fruit softening [31,35]. By using partial least-square regression analysis, better prediction models for firmness and pulp color were obtained in mangoes and in apples when combining absorption and scattering optical properties rather than using scattering or absorption coefficients alone [31].
The present research aimed to nondestructively predict the content of bioactive compounds such as carotenoids, ascorbic acid, and the total phenols in ‘Tommy Atkins’ mangoes using the absorption coefficients related to chlorophylls and carotenoids and the scattering properties measured by TRS during a shelf-life period of 8 days.

2. Materials and Methods

2.1. Fruits

Mango fruits (Mangifera indica L., cv ‘Tommy Atkins’) were harvested in commercial orchards in Pernambuco State (Brazil) at commercial maturity for ship-shipping according to the importer’s protocol and transported by plane to Milan (Italy) immediately after harvest. On arrival at the CREA-IT lab (about 5–7 days from harvest), 90 fruits without defects were selected and measured by TRS at 540 nm on two opposite sides in the fruit’s equatorial region and ranked by decreasing µa540 averaged over the two sides, which is from more (high µa540) to less (low µa540) mature fruit. The ranked fruits were randomized in 3 batches (30 mangoes each), which were analyzed after 1 (d1), 3 (d3), and 8 days (8d) of shelf-life at 20 °C. At each time of shelf-life, fruits were measured by TRS in the 540–880 nm range (at 540, 580, 630, 650, 670, 690, 730, 780, 830, and 880 nm) on two opposite sides of the equatorial region, and the resulting µa were averaged over the two sides. The positions of TRS measurements were marked by removing the skin using a slicer, and, in correspondence to these points, pulp color and flesh firmness were measured. A sub-sample of 10 fruits/times of shelf-life, covering the whole range of µa540, was selected for bioactive compound analyses, taking, for each sub-sample, the fruits in the same position in each batch. Fruit ranked as R1 were the most mature, while fruit ranked as R10 were the least mature. The whole fruits were immediately deep-frozen and kept at −30 °C until the carotenoid, ascorbic acid, and total phenolic extractions were conducted.

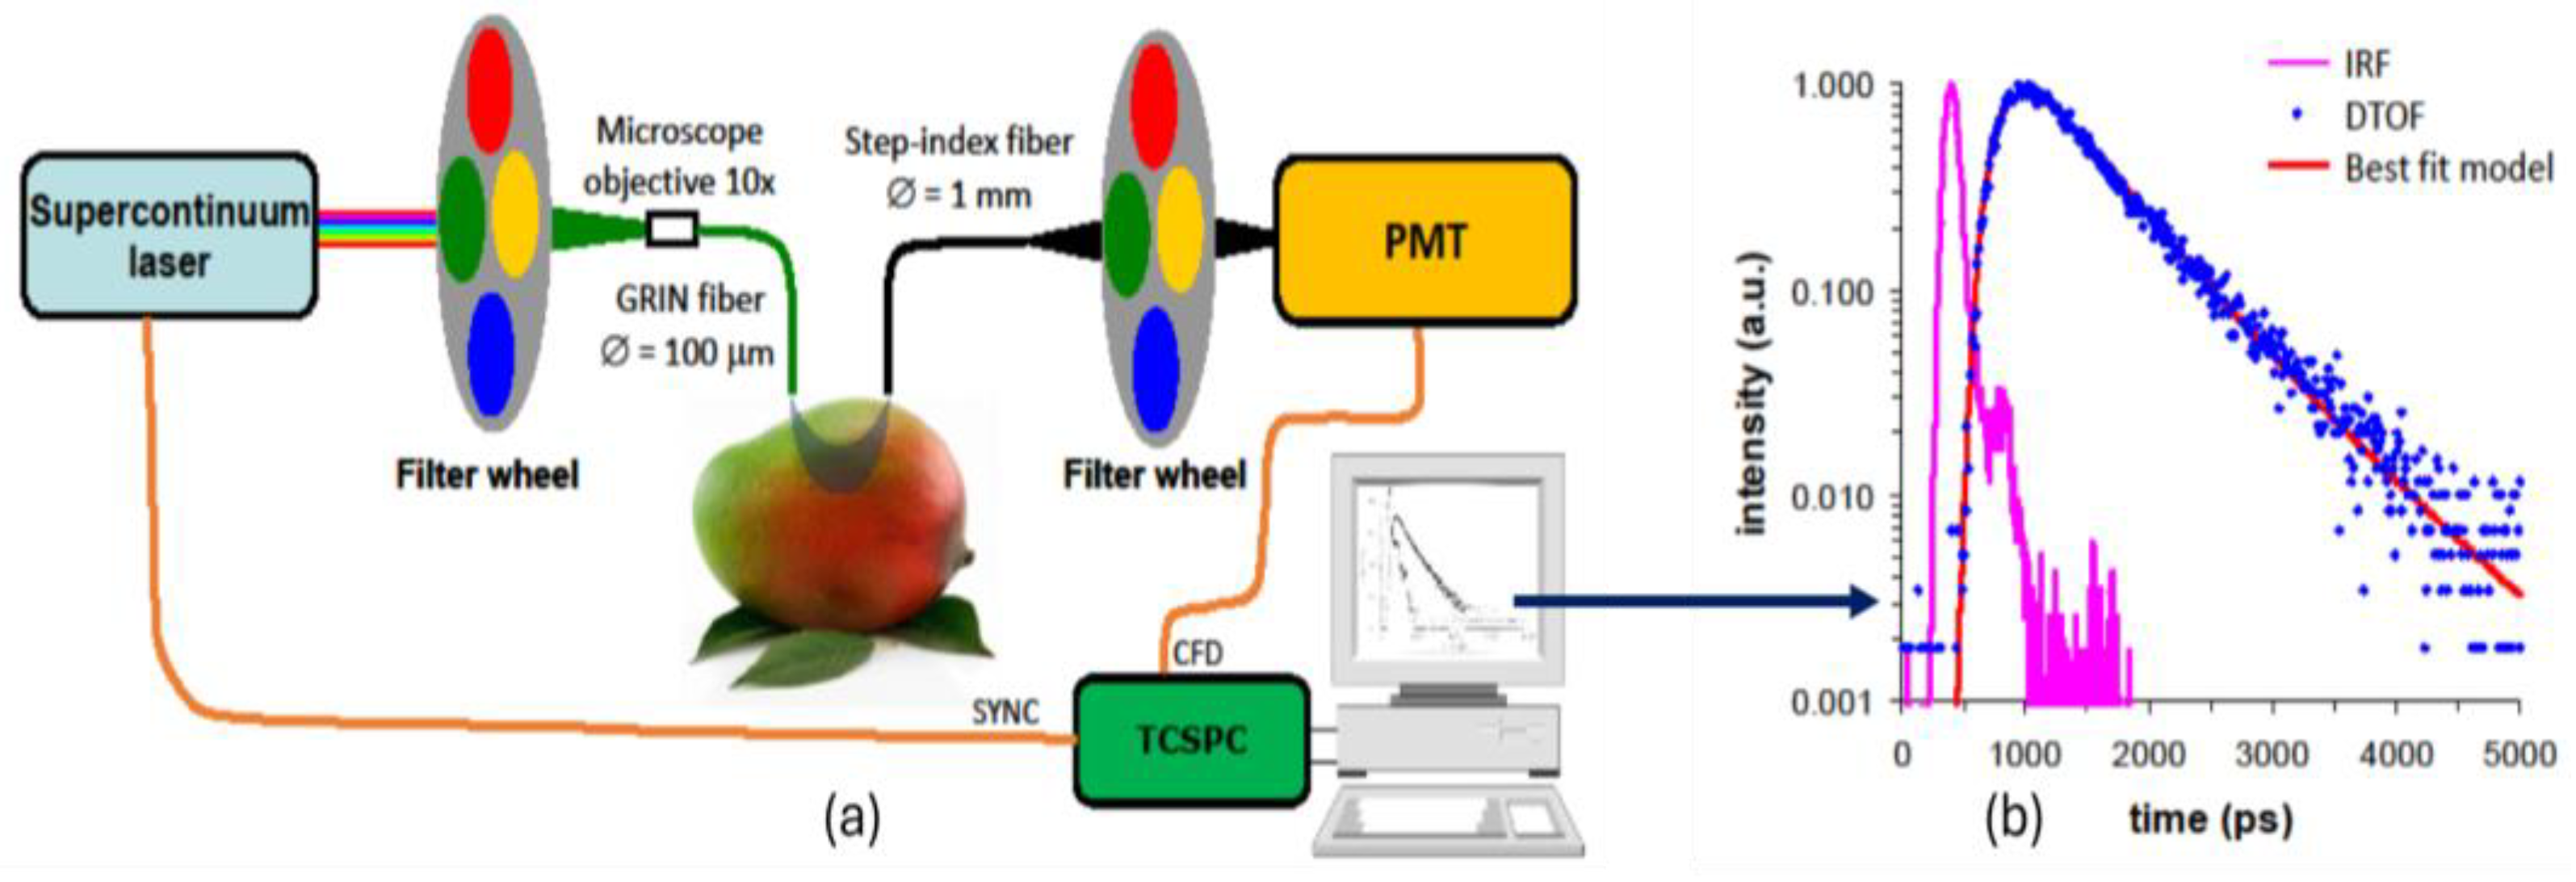
2.2. Time-Resolved Reflectance Spectroscopy

A multi-wavelength portable compact system described in detail by Vanoli et al. [36] was used (Figure 1). The light source is a supercontinuum fiber laser (SC450-6W, Fianium, Ltd, Southampton, UK) providing white light pulses with a duration of a few picoseconds. A set of 14 band-pass interference filters (NT-65 series, Edmund Optics, Inc., Barrington, NJ, USA), loaded on a custom-made wheel, provides spectral selection in the range 540–880 nm. A multimode graded-index fiber delivers light to the sample while a 1 mm core fiber collects light backscattered by the sample. The inter-fiber distance was set to 1.5 cm. A set of interference filters identical to the one in the injection module eliminates any fluorescence signals emitted by the sample. Collected light is detected via a photomultiplier (HPM-100-50, Becker & Hickl, GmbH, Berlin, Germany) and the photon distribution of the time-of-flight is measured by a time-correlated single-photon counting board (SPC-130, Becker & Hickl, GmbH, Berlin, Germany). The instrument response function has a full width at half maximum of about 260 ps. The typical acquisition time was set to 1 s per wavelength.
A model for photon diffusion in turbid media was used to analyze TRS data to assess the bulk optical properties of the samples to obtain the estimates of µa and µs′ at each wavelength [37]. An approximation of the Mie theory was used to relate the reduced scattering coefficient to the structural properties of the diffusive sample, according to Equation (1):
µs = A × (λ/λ0)b
where λ is the wavelength, A is the scattering coefficient at wavelength λ0 = 600 nm, and b is a parameter related to the equivalent size of scatterers.

2.3. Pulp Color and Flesh Firmness

In correspondence to the TRS measurement points, pulp color and flesh firmness were measured after removing a small portion of the peel. Pulp color was measured with a spectrophotometer (CM-2600d, Minolta Co., Osaka, Japan), using the primary illuminant D65 and a 2° observer in the L*, a*, b* color space. From the color coordinates, L*, a*, and b*, hue (), chroma (C*) and yellowness index (IY) were computed according to the following equations:
= arctangent(b*/a*) × 360/(2 × 3.14)
C* = (a*2 + b*2)−2
IY = [81.2746X − 1.0574Z)/Y] × 100
after converting the L*a*b* parameters into the XYZ color space [38].
Color data were averaged per fruit.
Flesh firmness was measured using an Instron Universal Testing Machine Model 4301 (Instron Ltd., High Wycombe, UK) with crosshead speed of 200 mm min−1 and a 8 mm diameter plunger. Data were averaged per fruit.

2.4. Determination of Carotenoids, Ascorbic Acid, Phenolic Compounds, and Total Antioxidant Capacity

For carotenoids, ascorbic acid, and phenolic extractions from each fruit, the pulp samplings for each determination were carried out at the same time on frozen fruit after 30 min thawing at ambient temperature by slicing pulp portions without peel near the positions of the TRS measurements, pooling the slices coming from the two fruit sides, and homogenizing them into a 100 mL beaker put on ice; then, 2 g samples/extraction were weighed into centrifuge tubes and kept on ice until the extractions.

2.4.1. Ascorbic Acid

Ascorbic acid was extracted (two replicates/fruit) using the procedure described by Robles-Sánchez et al. [39] with slight modifications as stated in our previous study [17]. Ascorbic acid was determined according to Rizzolo et al. [40], using a Jasco (Tokyo, Japan) HPLC system consisting of a PU-980 liquid chromatographic pump, a model AS 1055-10 autosampler, and an UV-Vis 15770 detector set at 254 nm. Ascorbic acid was estimated from a standard curve of L-ascorbic acid in 6% meta-phosphoric acid and data-expressed as milligram per kg of FW. All the measurements were evaluated in triplicate.

2.4.2. Total Phenols Content

The total phenols were extracted (two replicates/fruit) according to the method described by Vanoli et al. [17] and quantified using the Folin–Ciocalteau method [41]. The absorbance was measured at 730 nm using an UV-VIS spectrophotometer (UV-UVIDEC 320, Jasco, Japan). The total phenols content (TPC) was estimated from a standard curve of gallic acid, and data were expressed as milligram gallic acid equivalents (GAE) per kg of FW. All the measurements were evaluated in triplicate.

2.4.3. Total Antioxidant Capacity

The total antioxidant capacity (TAC) was measured on acidic ethanolic extracts used for TPC determination following the DPPH assay [42] with some modifications as stated in our previous work [17]. The absorbance was measured at 517 nm with a Jasco 7800 UV/VIS spectrophotometer (Jasco Europe S.r.l., Cremella, LC, Italy). The total antioxidant capacity was computed based on a standard curve of Trolox and results were expressed as µmol Trolox equivalent (TE) per kg FW. All the measurements were evaluated in triplicate.

2.4.4. Carotenoids

The nonsaponified carotenoid extracts (two replicates/fruit) were prepared using the method reported by Vanoli et al. [17]. Then, extracts were stored at −80 °C until the spectrophotometric and high-performance liquid chromatographic (HPLC) analyses. The total carotenoid content (CAR) was determined on extracts measuring absorbance at 450 nm using a spectrophotometer (UV-UVIDEC 320, Jasco, Japan). The hexane:acetone:ethyl acetate solution was used as the blank. The total carotenoid content was estimated from a standard curve of β–carotene and data were expressed as milligram β–carotene equivalent (β–CARE) per kg of FW. Carotenoid composition was determined according to the method described by Azevedo-Meleiro and Rodriguez-Amaya [43], with some modifications as stated in our previous study [17], using a Jasco (Tokyo, Japan) HPLC system consisting of a PU-1580 liquid chromatographic pump coupled with an LG 1580-04 quaternary gradient unit, a model AS 2055-plus autosampler, and an MD 2010-plus multiwavelength detector. Spectra of all peaks were recorded in the 200–600 nm wavelength range, and peak areas were monitored at 450 nm. Carotenoids (Table S1 and Figure S1 in Supplementary Materials) were identified according to the following combined information: elution order on reversed-phase columns (C18 and/or C30); comparison of retention times with standards (all-trans-β-carotene and violaxanthin, obtained by pansy petals) [4,5,16,44,45]; UV-vis spectrum features (λmax); spectral fine structure (%III/II), which is the ratio of the height of the longest-wavelength absorption peak (III), and that of the middle absorption peak (II), taking the minimum between the two peaks as the baseline, multiplied by 100; and relative intensity of the cis-peak (%AB/AII), which is the ratio of the height of the cis-peak (AB) and that of the middle main absorption peak (AII), multiplied by 100 [46,47,48]. Carotenoids were quantified referring to the total carotenoid content estimated spectrophotometrically on the same extract in conjunction with the chromatogram percent composition, and data were expressed as milligram per kg of FW. All the measurements were evaluated in triplicate.

2.5. Statistics

2.5.1. Analysis of Variance

Optical, quality, and bioactive compounds data were submitted to a one-way analysis of variance (ANOVA, Statgraphics version 7, Manugistic Inc., Rockville, MD, USA) considering the day of shelf-life at 20 °C as a factor. Means were compared using a 95 percent Tukey’s test. Correlation analysis among CAR, AA, TPC, and TAC was performed using Pearson’s coefficient (r). Correlation analysis among pulp color and carotenoids compounds was conducted using Spearman’s rank correlation coefficients (rs).

2.5.2. Predictive Models

Predictive models were developed by using the optical properties measured by TRS to determine the total antioxidant capacity, ascorbic acid content, the total phenols content, the total carotenoids, and the individual carotenoids contents. Data were submitted to a multiple linear regression analysis (Statgraphics ver. 5.1 Plus) using as the independent variables μa540 at sorting and the absorption coefficients measured at 540 nm, 630 nm (chlorophyll-b), 650 nm (shoulder of chlorophyll-a peak), 670 nm (maximum of chlorophyll-a peak), 690 nm (tail of chlorophyll-a peak), and Mie’s A and b scattering parameters measured during the shelf-life period. Firstly, using the regression model selection procedure, models have been developed containing all combinations of from 0 to 7 variables, and the models were selected according to the following criteria: higher adjusted R-square, smaller values of the mean square error, values of Mallow’s Cp statistic as close as possible to the number of coefficients in the fitted model, and simplicity. Then, using the multiple regression analysis procedure, the statistical significance of each variable used in the models, the mean absolute error (MAE), and the standard error of the estimate (SEE) were used to evaluate the models selected.

3. Results

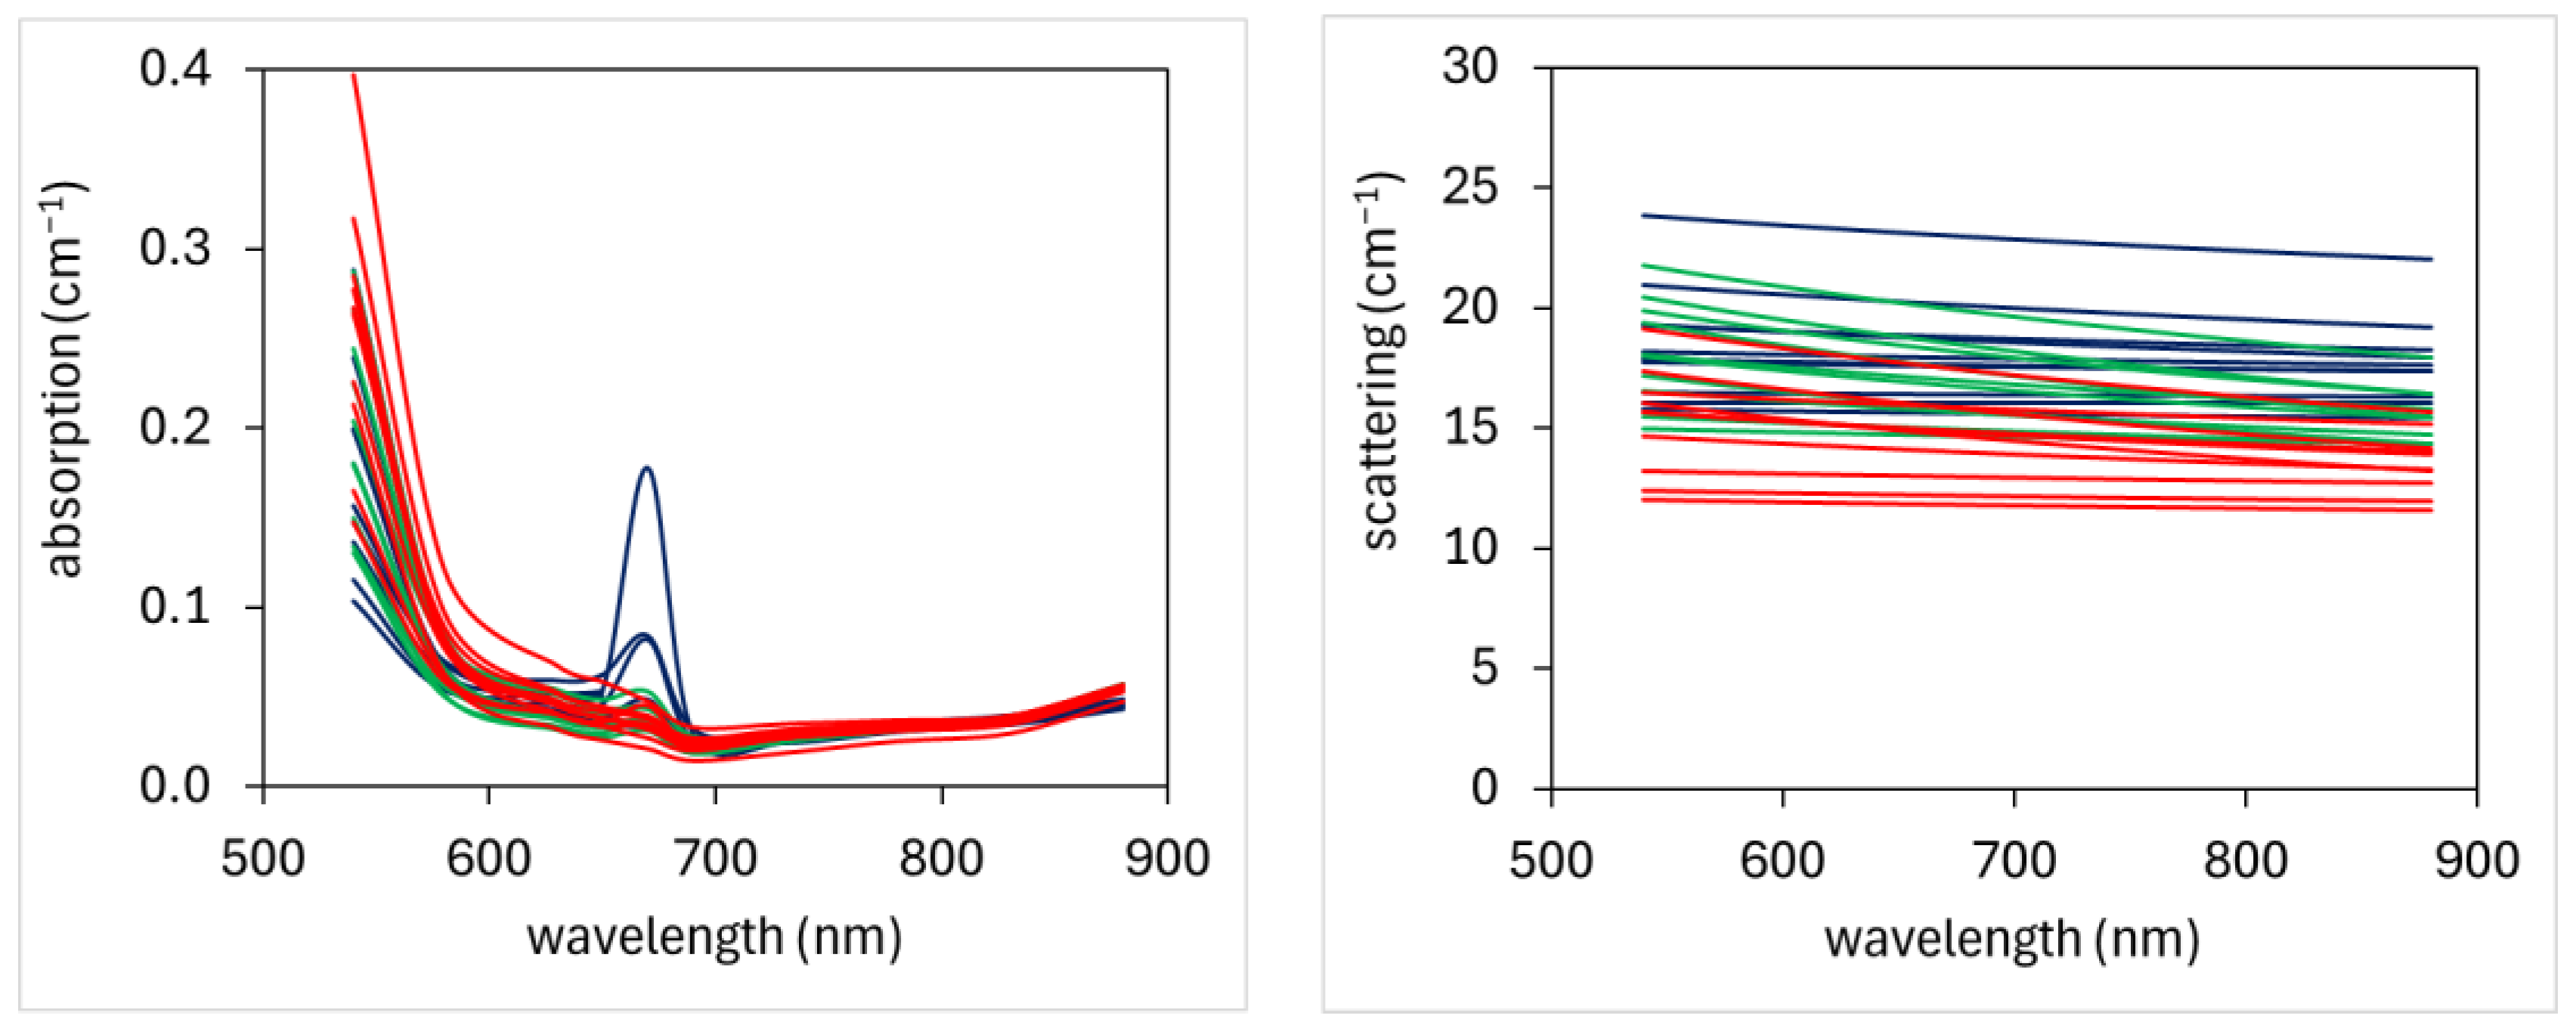
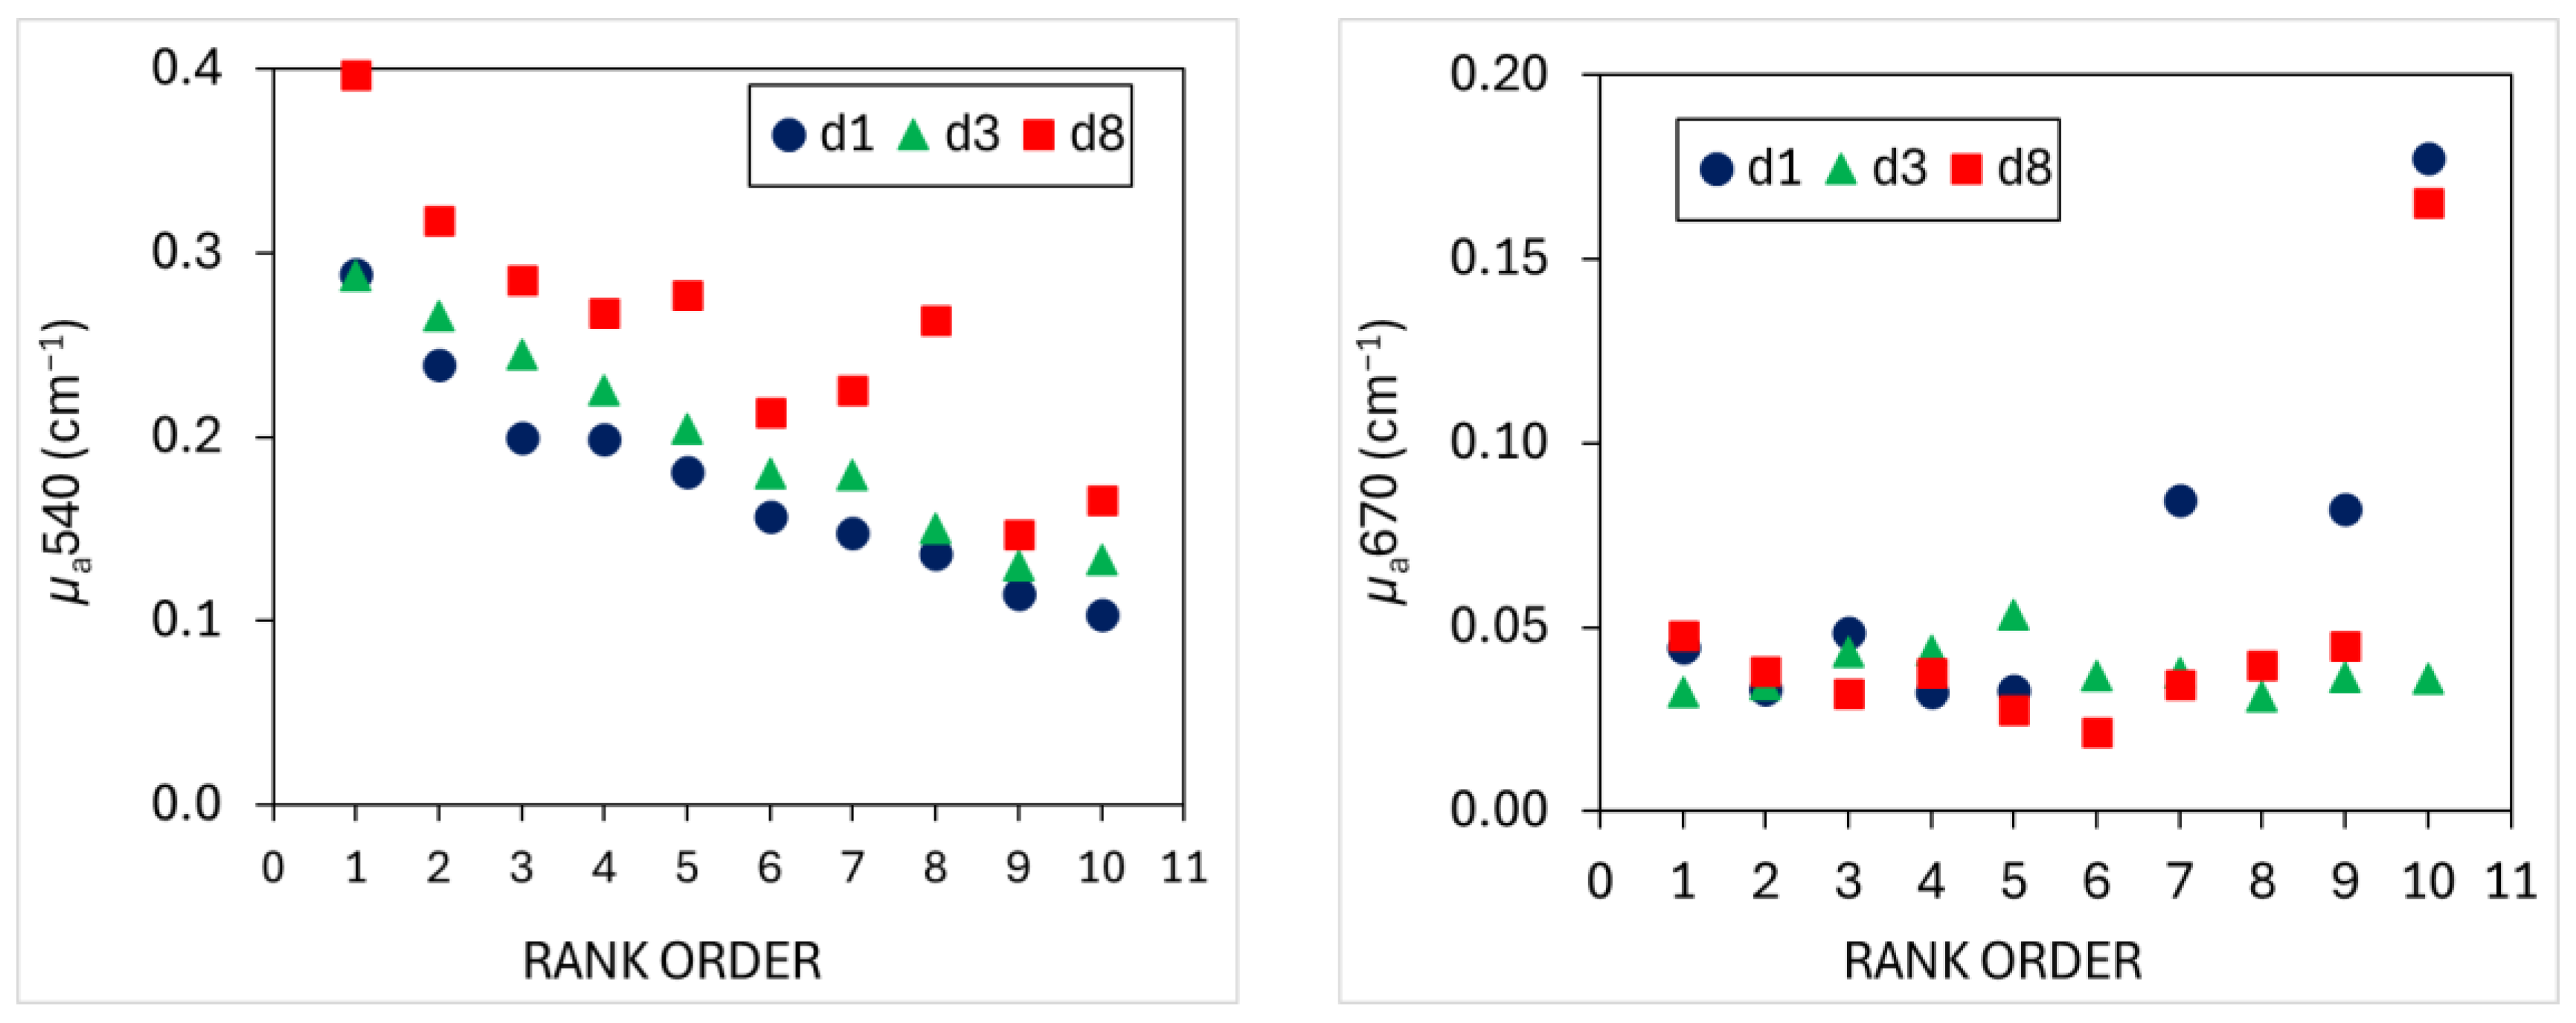
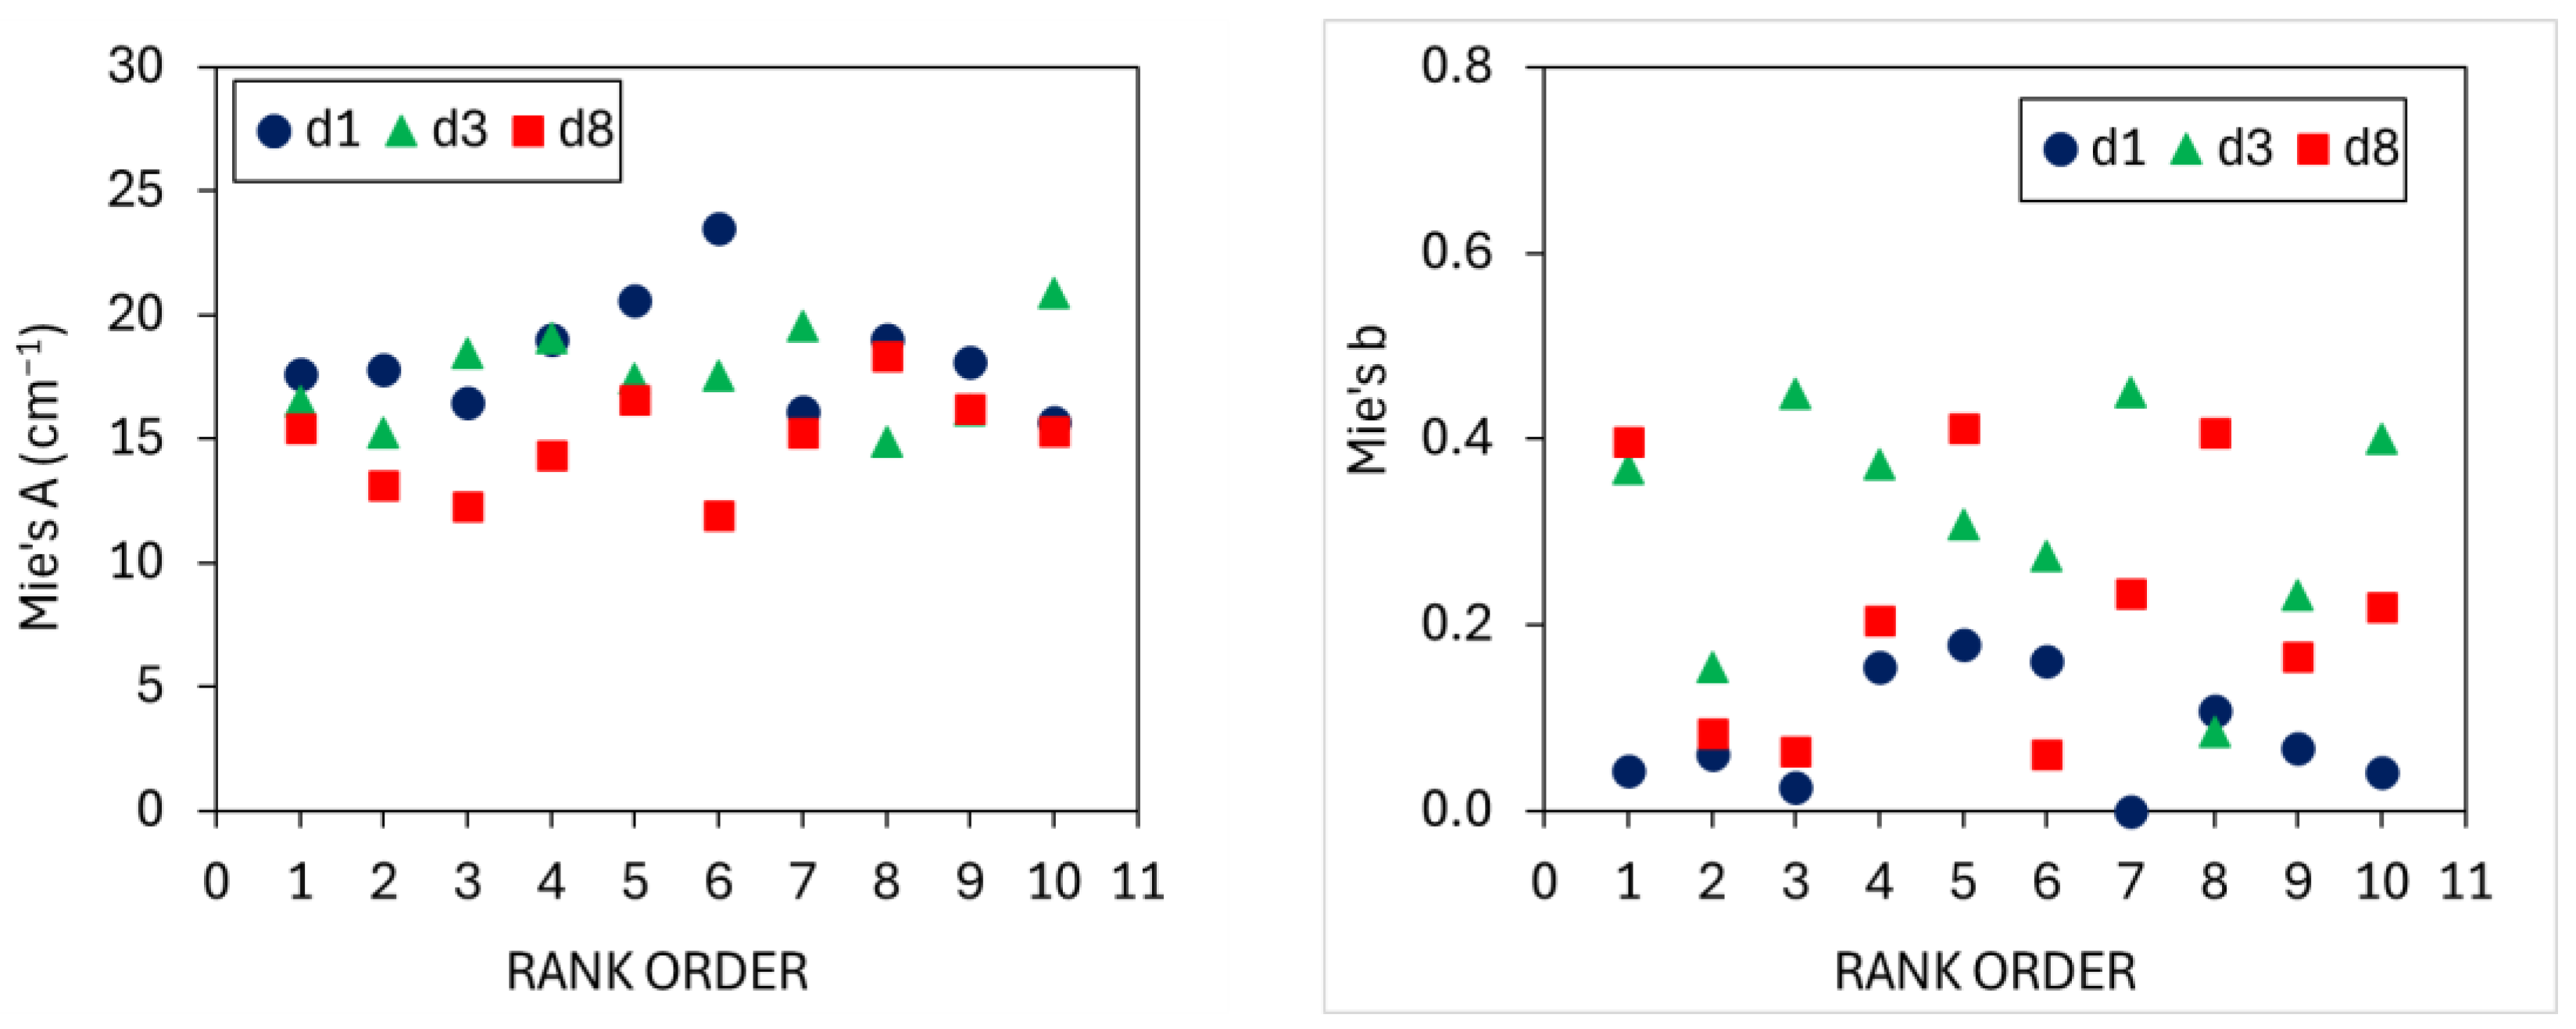
3.1. TRS Optical Properties

The optical properties of fruits analyzed for bioactive compounds composition during the 8 days of shelf-life at 20 °C were reported in Figure 2. Absorption spectra showed two maxima, the first at 540 nm (related to the absorbing bands of carotenoids present at shorter wavelengths) and the second one at 670 nm (related to chlorophyll) (Figure 2, left). The µa540 values ranged from 0.104 to 0.397 cm−1 and µa670 values ranged from 0.021 to 0.178 cm−1. High variability was found from 580 to 650 nm with absorption ranging from 0.026 to 0.122 cm−1; low absorption coupled with low variability was noticed from 730 to 880 nm with values ranging from 0.019 to 0.058 cm−1, indicating a limited absorption by the chemical constituents of mango fruit in this region.
Scattering spectra were flat and slightly decreased with increasing wavelength, as predicted by the Mie theory (Figure 2, right). The range of variation was 12.0–23.9 cm−1 at 540 nm and 11.6–22.06 cm−1 at 880 nm.
Considering the variation of µa540 and µa670 according to the rank order (Figure 3), the least mature fruit, corresponding to R10 mangoes after 1d at 20 °C showed the highest values of µa670 coupled with the lowest values of µa540. The µa670 showed very high values also for the R7 and R9 fruits after 1d of shelf-life, while no reliable measurements at 670 nm were obtained for the R6 and R8 fruits, probably due to the strong absorption of the green layer under the skin typical of immature mangoes, which strongly reduced the number of detected photons at 670 nm [49]. On the contrary, most mature fruits, i.e., R1 mangoes after 8d at 20 °C, showed the highest values of µa540 coupled with low values of µa670.
Mie’s A ranged from 11.9 to 23.5 cm−1 and Mie’s b from 0 to 0.45 (Figure 4). No clear trend could be found for Mie’s A and b according to rank order (Figure 4).
On average, μa540 significantly and gradually increased with the shelf-life, while μa670 showed the highest values at d1, significantly decreased at d3, and maintained these values at d8 (Table 1). The absorption coefficients measured at 630, 650 and 690 nm did not significantly change from d1 to d8 (Table 1). As for scattering, Mie’s A showed the highest values at d1 and d3 and significantly decreased at d8, while Mie’s b had the lowest values at d1, significantly increased at d3, and maintained these values at d8 (Table 1).

3.2. Quality Parameters

Flesh firmness significantly decreased during the shelf-life period (Table 2). Pulp color turned from pale yellow to yellow−orange as a*, b*, C*, and IY significantly increased and h° significantly decreased from d1 to d8 at 20 °C (Table 2).

3.3. Ascorbic Acid, Total Phenolic Content, and Total Antioxidant Capacity

AA and TAC decreased from ≈170 mg kg FW−1 and ≈750 μmol TE kg FW−1 to ≈90 mg kg FW−1 and ≈430 μmol TE kg FW−1 during shelf-life, halving their content from d1 to d8 (Table 3). TPC was on average ≈247 mg GAE kg FW−1 and did not significantly change with ripening (Table 3).
TAC showed a significant positive correlation with AA (r = 0.61, p = 0.0003) while no correlation was found with TPC (r = 0.36, p = 0.067) and CAR (r = −0.33, p = 0.067).

3.4. Carotenoids

The total carotenoids (CAR) were steady up to d3 of shelf-life and increased about threefold from d3 to d8 (Table 3).
The chromatographic carotenoid pattern for ‘Tommy Atkins’ fruit includes 18 main peaks (Figure S1), which were tentatively identified as cis-β-cryptoxanthin (Crypt), (all-E)-β-carotene (b-Car), (9Z)-violaxanthin (9-Viol), (all-E)-violaxanthin (Viol), four (all-E)-violaxanthin esters (butyrate—ViolBut; dibutyrate—ViolDibut; butyrate-caproate—ViolButCap; non defined ester—ViolEster1), three (all-E)-neoxanthin esters (dibutyrate—NeoDibut; butyrate-myristate—NeoBurMyr; non defined ester—NeoEster1), four (9Z)-violaxanthin esters (butyrate—9-ViolBut; dibutyrate—9-ViolDibut; butyrate-laurate—9-ViolButLau; butyrate-palmitate—9-ViolButPalm), (13Z)- or (15Z)-violaxanthin dibutyrate (13-ViolDibut), and (9Z)-neoxanthin dibutyrate (9-NeoDibut) (Table S1).
The major constituent of the nonsaponified extracts from ‘Tommy Atkins’ mangoes was (all-E)-β-carotene; its amount increased with the shelf-life from 1.44 mg CARE kg FW−1 at d1 to 5.8 mg CARE kg FW−1 at d8 (Table 4). The other carotenoids tentatively identified were xanthophylls, mainly in the esterified form with several short-chain acylating fatty acids. The amounts of ViolBut, 9-ViolBut, NeoButMyr, 9-NeoDibut, and 9-ViolDibut did not change with the shelf-life, while the amounts of NeoDibut, ViolDibut, 13-ViolDibut, ViolButCap, 9-ViolDibut, ViolEster1, NeoEster1, and 9-ViolButPalm steeply increased from d3 to d8 (Table 4). As for free xanthophylls, the 9-Viol amount did not change with the shelf-life, Viol increased with the shelf-life, and Crypt peaked at d3 (Table 4). The content of the total xanthophylls at d8 was three-fold higher than that at d1 and d3, mainly due to the marked increase in the total violaxanthin esters, total 9-violaxanthin esters, and total neoxanthin esters from d3 to d8 (Table 4).
Considering the percent composition, at the beginning of the shelf-life the main compounds were ViolBut (21%), b-Car (20%), Crypt (13%), NeoDibut (8%), ViolButCap (6%), and 9-ViolBut (5%), while at the end of the shelf-life the main compounds were b-Car (26%), NeoDibut (15%), ViolDiBut (9%), ViolBut (9%), and ViolButCap (8%).
The proportion of the total violaxanthin esters (28–30%) and the total 9-violaxanthin esters (9–11%) did not vary with the shelf-life, that of the total neoxanthin esters increased from 7–13% to 20% at d8, whereas the total free xanthophylls decreased from 18–25% to 6% at d8. The total xanthophylls decreased from 80% at d1 to 73% at d3 and 8.
Carotenoids are responsible for the yellow−orange color of mango mesocarps. In Table 5, the correlations between carotenoids and pulp color are reported. The total carotenoids (CAR) were positively related to a*, IY, b*, and C* with the rs ranging from 0.77 for b* and C* to 0.85 for a* and negatively related to L* (rs = −0.85) and (rs = −0.84). b-Car was positively related to a* (rs = 0.78) and IY (rs = 0.72) and negatively related to L* (rs = −0.75) and (rs = −0.79). The total violaxanthin esters were positively related to a*, b*, C*, and IY with the rs ranging from 0.79 for a* to 0.83 for IY and negatively related to L* (rs = −0.83) and (rs = −0.77). The total xanthophylls were positively related to a*, b*, C* and IY with the rs ranging from 0.78 for b* and C* to 0.86 for a* and negatively related to L* (rs = −0.87) and (rs = −0.85). No significant correlation was found with the rs ≥ 0.70 for individual carotenoids, except for b-Car which was positively related to a* (rs = 0.78) and IY (rs = 0.72) and negatively related to L* (rs = −0.75) and (rs = −0.79) and for 9-VioDibut which was positively related to a* (rs = 0.73) and negatively to L* (rs = −0.74) and (rs = −0.72).

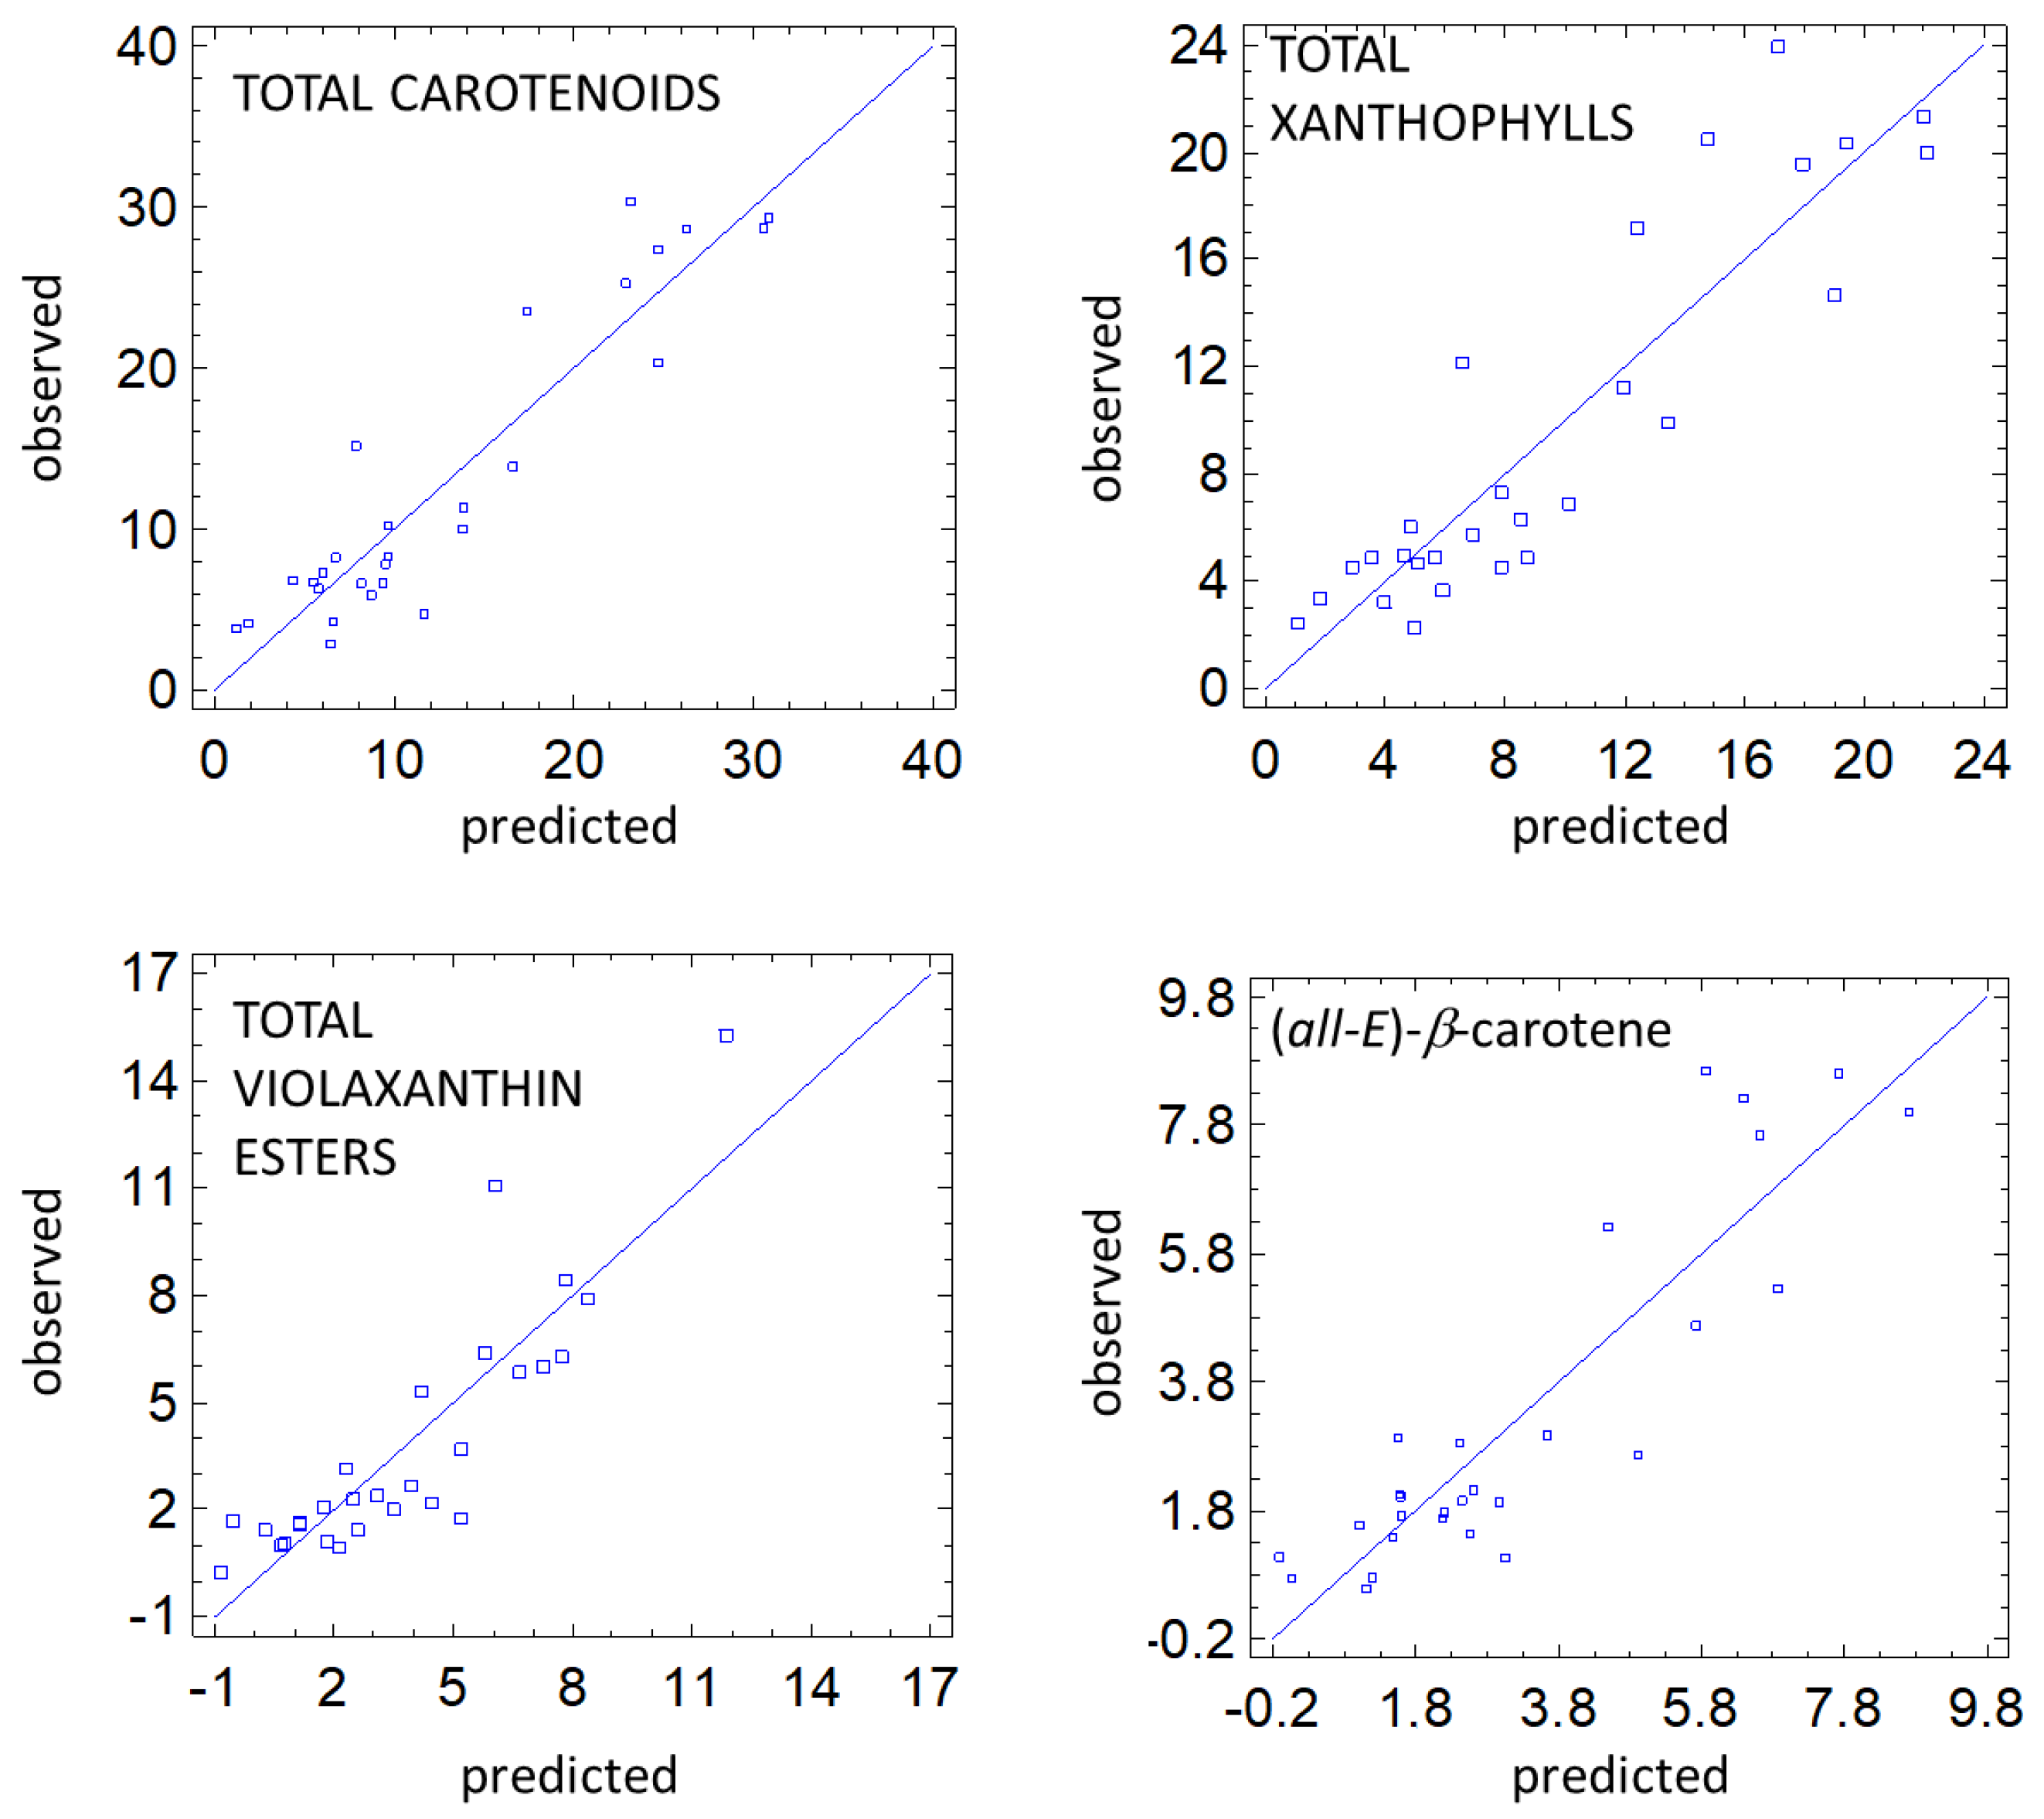
3.5. Predictive Models

Predictive models were developed for the total antioxidant capacity, ascorbic acid content, the total phenols content, and the total carotenoids and individual carotenoids contents using TRS optical properties and multiple regression analysis (details are reported in Section 2.5.2). Only significant models with R-square adjusted (R2adj) ≥ 50 are reported in Table 6.
Poor results were obtained for AA and TPC, with models having R2adj ≤ 50% and no significant model was obtained for TAC.
The prediction model for CAR achieved an R2adj = 83.1%, including as significant variables µa540SORT, µa540, µa630, µa650, and µa690 (Figure 5, Table 6). Good models were also developed for the total violaxanthin esters (R2adj = 74%) and total xanthophylls (R2adj = 79%) contents, including µa540SORT and µa540 as variables and also µa630 and µa650 for the total xanthophylls (Figure 5, Table 6). Considering the individual carotenoids, a good prediction was obtained for (all-E)-β-carotene content (R2adj = 77%) by using as independent variables µa540SORT, µa540, µa650, and µa690 (Figure 5, Table 6). Slightly worse models were achieved for 9-ViolDibut, ViolButCap and NeoEster1 with R2adj = 63.0, 62.2, and 56.5%, respectively. For the 9-ViolDibut and ViolButCap predictions, Mie’s b was also included as a significant variable.

4. Discussion

4.1. Optical Properties

The absorption and scattering properties measured by TRS in ‘Tommy Atkins’ mangoes changed during 8 days of shelf-life at 20 °C, showing an increase for µa540 and Mie’s b and a decrease for µa670 and Mie’s A. In addition, most mature fruit showed the highest values of µa540 and the lowest values of µa670, while the opposite was found for the least mature ones. The µa540 and the absorption coefficients measured in the chlorophyll range (630–690 nm) showed similar values to those previously reported for the same cultivar [34,36] and for other mango cultivars [9,17,45,49]. The decrease in µa670 values (linked to chlorophyll-a) and the increase in µa540 (linked to carotenoids) with the shelf-life are related in the former to the breakdown of chlorophyll [23] and in the latter to the increase in carotenoid pigments following the differentiation of chloroplasts into chromoplasts [8,50]. Eccher Zerbini et al. [35] found that µa540 increased substantially only in fruit where chlorophyll had almost disappeared, i.e., in correspondence to very low µa670 values. Similarly, Kienzle et al. [23,51] observed that, during ripening, carotenoids are accumulated in the mesocarp only when chlorophyll is very low or undetectable. In our work, chlorophyll content was not measured, while the total carotenoids content (CAR) showed a dramatic increase after 8 days at 20 °C.
The changes in the absorption coefficients observed during ripening at 20 °C mirrored the shift of pulp color from yellow-greenish to yellow-orange, as indicated by the increase in a*, b*, and yellowness index (IY) values and the reduction in values [5,8,9,17,36,52]. There is a synchronization between changes of µa540 and changes of a*, b*, C*, and IY in the mesocarp [36] while positive relationships were found between µa630, µa650, and µa690 and [9,31]. The values of the pulp color parameters and their behavior during the shelf-life were like those reported for ‘Tommy Atkins’ mangoes from Brazil in our previous work [36] and in the literature [52,53,54].
As for the scattering, the decrease in density of scatterers (related to parameter A) and the increase in parameter b (bound to the size of scatterers, i.e., greater values indicate a smaller size of scatterers) found in this work confirm the results reported by Rizzolo and Vanoli [31] for ‘Tommy Atkins’ mangoes held for 5 days at 20 °C and by Eccher Zerbini et al. [35] in ‘Haden’, suggesting that fruit with lower scattering had a more advanced cell wall breakdown. In our work, the changes in scattering parameters accompanied the change that occurred in the pulp structure due to softening, as firmness decreased from values characteristic of soft-ripe fruit [55] at the beginning of the shelf-life to values typical of fully ripe fruit [31,49,56]. Cárdenas-Pérez et al. [56] reported that during the ripening of ‘Tommy Atkins’ mangoes there was a degradation of large pectin molecules with a concomitant decrease in the Young’ module of the cell wall material. Similarly, Cantre et al. [57] observed that during the ripening of ‘Carabao’ mangoes, the long and continuous pore structures typical of unripe fruit were disconnected and narrowed due to the loss of cell turgidity. These changes in the microstructure were related to the changes in the scattering parameters as found by Herremans et al. [58] in aerated sugar gels, where an increase in the A value was related to an increase in the number of bubbles in the gel, and the increase in b-value with the average size reduction of the bubbles. The situation in the pulp tissue is much more complex than just described, as the scattering centers of a fruit are not homogeneous spheres. Therefore, Mie’s A and Mie’s b do not actually correspond to the real size or density of the scattering centers in the fruit tissue, rather they are the average equivalent parameters that could be related in some way to the physical properties of a fruit [31].

4.2. Ascorbic Acid, Total Phenolic Content, and Total Antioxidant Capacity

The average AA values found for ‘Tommy Atkins’ fruit with ripening are comparable with the data of other authors for the same cultivar, who reported values ranging from about 75–90 mg/kg at the mature-green maturity stage to about 160 mg/kg for the mature-ripe ripening degree [1,59,60] and values ranging from 150 to 290 mg/kg for fruit coming from different locations (Mexico, Peru, Ecuador, and Brazil) and different harvest times [6], but three to four times lower than the amount of about 645 mg/kg found by Barbosa-Gámez et al. [61] for ‘Tommy Atkins’ mangoes at the consumer maturity degree. These variations in AA content within the same variety may be attributed to several different preharvest and postharvest factors, which all can influence the synthesis. The 48% decrease in AA content in fully ripe fruit at the end of the shelf-life compared with the less ripe mangoes of d1 is consistent with other research on ‘Tommy Atkins’ [61] and other cultivars; Ibarra-Garza et al. [11] found for ‘Keitt’ mangoes a 54% decrease in AA content after 8 days at room temperature, while Hu et al. [19] observed even more important decreases during ripening from the green to ripe stages for ‘Keitt’ (72%), ‘Sensation’ (84%), and ‘Xiangya’ (81%) mango cultivars from China, which, on the other hand, were consistent with the findings of Robles-Sanchez et al. [39]. The decrease in AA levels has been explained based on the coenzyme function for the ACC-oxidase involved in ethylene synthesis, or as a substrate for the oxalate and tartrate biosynthesis [2].
The TPC contents found in this work are either similar to or two times lower than data on the same cultivar found by other authors. Manthey and Perkins-Vaezie [6] reported values in the range of 165–479 mg GAE/kg for fruit coming from four locations and different harvest times; Gentile et al. [1] reported TPC contents of about 218 mg GAE/kg for green-mature fruit and about 355 mg GAE/kg for mature-ripe mangoes; in contrast, Kim et al. [62] found decreasing TPC values from about 400 mg GAE/kg for the mature-green stage to about 180 mg GAE/kg for full-ripe fruit. Our data indicated also that no significant changes in TPC content occurred with the 8 days of shelf-life at 20 °C. This scenario is in contrast to the TPC trends reported by Ibarra-Garza et al. [11] for ‘Keitt’ fruit kept in shelf-life at room temperature for 10 days and Robles-Sánchez et al. [63] for whole and fresh-cut ‘Ataulfo’ mangoes stored at 5 °C for 15 days. On the other hand, Kim et al. [62], after a hot water treatment of ‘Tommy Atkins’ mangoes followed by a 4 day shelf-life at 25 °C reported a slight increasing trend from about 260 mg GAE/kg at d0 to 300 mg GAE/kg at d4. The differences found in the literature’s data on the same cultivar may be ascribed to the fact that the amount of the total phenols can be affected by various factors such as ripeness degree, cultivation techniques, geographic origin, stage of growth at harvesting, and postharvest practices, as well as to not intrinsic factors linked to the time of the year, rainfall, solar radiation (which is known to affect metabolism), and phenol production [59].
The decreasing trend of TAC with the shelf-life found in this work agrees with the findings on ‘Tommy Atkins’ fruit obtained by Kim et al. [62,64] measuring TAC with the ORAC method and on ‘Keitt’ and ‘Xiangya’ mangoes by Hu et al. [20], who reported a 60% decrease in DPPH TAC for very soft fruit compared to firm ones. In our work, this trend most likely is linked to the decrease in AA content; in fact, a significant positive correlation was found between TAC and AA content but not between TAC and TPC, in agreement with Rocha-Ribeiro et al. [18], who reported that DPPH radical scavenging activity is strongly related to AA content but not to phenolics. Likewise, da Silva Sauthier et al. [20] reported no significant correlation between TPC and TAC measured by DPPH but significant correlation between TPC and TAC measured by ATBS. On the other hand, significant correlations between AA and TPC and TAC were found for several fruit species by Silva and Sirasa [65] using the FRAP and DPPH methods, and by Corral-Aguayo et al. [66] using six assays (DPPH, DMPD, FRAP, ORAC, TEAC, and TOSC) for ‘Palmer’ and ‘Haden’ mangoes, and by Vanoli et al. [17] using the DPPH method, while Gentile et al. [1], Liu et al. [7], and Ibarra-Garza et al. [11] found for various mango cultivars high and positive correlation between TPC and TAC measured with other methods (FRAP, ORAC, ABTS) but not between TAC and AA content. The difference in the relationships between antioxidant activity and ascorbic acid and the total phenolic compounds found among different authors was explained by Liu et al. [7] with a masking effect of phenolics when present in far higher concentrations than ascorbic acid. Our results suggest that in this work the antioxidant activity of ‘Tommy Atkins’ fruit with shelf-life at 20 °C can be attributed to ascorbic acid rather than to the total phenolic compounds.

4.3. Carotenoids

The total carotenoids content in ‘Tommy Atkins’ mangoes changed during the shelf-life period, showing mean values comparable to those previously reported for the same and for other mango cultivars [1,12,14,17].
As regards the chromatographic carotenoid pattern of the nonsaponified extract, the tentative identification of peaks was conducted by comparing spectral characteristics (λmax, %III/II and %AB/AII) with those from the literature [16,44,45,48], combined with the elution order on reversed-phase columns [4,5,16]. Among the identified carotenoids, there were (all-E)-β-carotene and free or esterified xanthophylls with several short-chain acylating fatty acids, with butyric acid as the major one. On average, the ‘Tommy Atkins’ carotenoid pattern found in this work agrees with those reported in the literature for mangoes [4,5,12,15,17]. Three carotenoids ((all-E)-β-carotene and (all-E)/(9Z)-violaxanthin as dibutyrates) were predominant in the carotenoid profile of ‘Tommy Atkins’ mangoes, showing values similar to those previously reported by Ornelas-Paz et al. [4], Vasquez-Caicedo et al. [8], and Lenucci et al. [14]. In our work, we found that also the total (all-E)-neoxanthin esters showed a high content, ranging from 0.99 to 4.35 mg kg−1. These compounds were identified but not quantified in ‘Tommy Atkins’ mangoes by Ornelas-Paz et al. [4] and Petri and Mercadante [16] while Mercadante et al. [48] and Ma et al. [13] observed in ‘Keitt’, ‘Tainong1’, and ‘Hongryu’ mangoes the presence of neoxanthin as a minor carotenoid.
The proportion of (all-E)-β-carotene, the total (all-E) violaxanthin esters, and the total-(9Z)-violaxhantyn esters to the total carotenoid content were, at d8 of shelf-life, 26%, 28%, and 11%, respectively. However, also the total (all-E)-neoxhantyn esters were well represented, accounting for 20% of the total carotenoid content. Pott et al., [67], Ornelas-Paz et al. [4] and Petri and Mercadante [16] observed that the major constituent of the nonsaponified extract of ‘Tommy Atkins’ mango was (all-E)-β-carotene (~20.3%), followed by (all-E)-violaxanthin dibutyrate (~13.5%) and (9Z)-violaxanthin dibutyrate (~7.7%). A different scenario is observed if other mango varieties are considered, with one class of compounds prevailing over another depending on the variety [2,4,5,11,17].
Carotenoids content and composition also varied according to ripening degree. In this work CAR content significantly increased during postharvest ripening at 20 °C, as was previously observed for ‘Tommy Atkins’ [1,13] and for other mango cultivars [3,5,11,12]. Among carotenoids, (all-E)-β-carotene significantly increased during ripening, as well as the total (all-E)-violaxanthin esters, the total (9Z)-violaxanthin esters, and the total (all-E)-neoxanthin esters. Similarly, Vasquez-Caceido et al. [8] and Mercadante and Rodriguez-Amaya [68] observed an increase in (all-E)-β-carotene, (all-E)-violaxanthin, and (9Z)-violaxanthin from the mature-green to the ripe stage in ‘Tommy Atkins’ mangoes. An increase in (all-E)-β-carotene accompanied by a significant increase in the total (all-E)-violaxanthin esters and the total (9Z)-violaxanthin esters was observed in other varieties [5,12,17,69]. On the contrary, Ibarra-Garza et al. [11] during the ripening of ‘Keitt’ mangoes observed an increase in (all-E)-β-carotene with a decrease in the total xanthophylls.
During the postharvest ripening of ‘Tommy Atkins’ mangoes, carotenoids accumulation was accompanied by changes in the pulp color from pale yellow to deep yellow-orange, revealed by an increase in the a*, b*, C*, and yellowness index (IY) values and by a decrease in the L* and values. In fact, the total carotenoids content was positively related to a*, IY, b*, and C* and negatively to L* and . Considering the individual carotenoids, similar relationships were found for (all-E)-β-carotene and 9-ViolDibut and for the total violaxanthin and the total xanthophylls. The negative correlation between carotenoids and xanthophylls with L* is due to the fact that the accumulation of carotenoids resulted in a more intense color of the mesocarp, so L* values decreased [5,9,70]. Ornelas-Paz et al. [5] found that the best correlations between the carotenoid content and the pulp color were obtained between (all-E)-β-carotene in the ‘Ataulfo’ mango (where this compound is predominant) and the a* and h° parameters, while in the ‘Manila’ variant (where the tree carotenoids were present in similar concentrations), the best results were associated with the concentrations of (all-E)-violaxanthin and (9Z)-violaxanthin (as dibutyrates). In our work, the best relationships between the total carotenoids, (all-E)-β-carotene, 9-ViolDibut, and the total xanthophylls and pulp color were obtained for the a* and parameters, while the best correlation for the total violaxanthin was achieved with b* or IY, confirming the close relationship between violaxanthin and the intensity of the yellow color, i.e., b* [5]. High correlations between pulp color coordinates and the total carotenoids, (all-E)-β-carotene, (all-E)-violaxanthin, and (9Z)-violaxanthin were also observed by Vazquez-Caceido et al. [71] in nine Thai mango cultivars, Bicanic et al. [70] in 21 mango homogenates, and Vanoli et al. [9,17] in ‘Palmer’ and ‘Haden’ mangoes.

4.4. Predictive Models

The absorption coefficients measured by TRS at 540, 630, 650, and 690 nm together with Mie’s b have been used in a multiple regression analysis to predict the total and individual carotenoids content, achieving good results for the total carotenoids (R2adj = 83.1%), the total xanthophylls (R2ad = 78%), (all-E)-β-carotene (R2ad = 77%) and the total (all-E)-violaxanthin esters (R2ad = 74%). Similarly, Vanoli et al. [9] using TRS absorption spectra in the 540–780 nm range and Kiran et al. [72] acquiring spectral data in the 350–2500 nm by NIR were able to non-destructively predict the total carotenoids content with R2CV ranging from 0.83 to 0.93 for various mango cultivars. TRS measurements in the 540–980 nm range were also able to successfully predict carotenoid content in yellow-fleshed potato genotypes [73]. On the other hand, in ‘Palmer’ and ‘Haden’ mangoes, it was found that μa540 was significantly related to the total carotenoids content (r = 0.78–0.91), (all-E)-β-carotene (r = 0.79–0.82), the total-all-trans violaxanthins (r = 0.58–0.94), and the total (9Z)-violaxanthins (r = 0.81–0.85), highlighting that μa540 was strictly linked to the carotenoids content in the pulp and consequently to pulp color [9,17]. Also, Rungpichayapichet et al. [69] successfully predicted β-carotene content in ‘Nam Dokmai’ mangoes by using hyperspectral imaging in the 450–998 nm range, highlighting that 466, 482, 518, 546, 578, 678, 922, and 954 nm were the most important wavelengths included in the model. It is worth noting that also wavelengths linked to chlorophyll were important for β-carotene prediction, as we found in the present work.
Conversely, poor results were obtained for AA and TPC, with models exhibiting R2adj ≤ 50%, and no significant model was attained for TAC. Similarly, no significant relationships were observed between μa540, AA, TAC, and TPC in other cultivars, probably due to the fact that these compounds are not related to pulp color changes during ripening [17]. On the contrary, Munawar et al. [74], Hayati et al. [75], and Kusumiyati et al. [76] were able to successfully predict vitamin C content (R2cv = 0.74–0.96) in various mango cultivars by using near infrared spectroscopy. Probably, the acquisition of spectral data in the 1000–2500 nm range allowed them to achieve a good prediction of vitamin C content, as the highest absorption bands were found at 2100–2280 nm, which are related to C-H-O structures such as TSS, sugar contents, carbohydrates, fructose, and vitamins A and C.
In previous papers on mangoes, our group used TRS to predict, in a nondestructive way, ethylene production [35], softening [34,35], and pulp color [9,17,36,49], highlighting that TRS allows a complete characterization of the quality of mangoes. In this work, we showed that TRS can also be useful to assess the carotenoids content in mangoes, thus providing consumers with ripe and healthy fruit.

5. Conclusions

The absorption and scattering optical properties measured by TRS at selected wavelengths made it possible to follow fruit ripening in mangoes, as the absorption coefficients reflected the decay in the chlorophyll content and the accumulation of carotenoids, while the scattering coefficients mirrored the changes in pulp structure due to softening. The increases in the total carotenoids, (all-E)-β-carotene, the total (all-E)-violaxanthin esters, the total (9Z)-violaxanthin esters, and the total (all-E)-neoxanthin esters were related to pulp color, which turned from pale yellow to yellow-orange. Ripening in mangoes was also accompanied by a decrease in ascorbic acid content and in antioxidant capacity, while the total phenols content did not significantly change. By using the optical properties measured by TRS in a multiple regression analysis, it is possible to determine the content of the total and individual carotenoids (β-carotene, xanthophylls, and violaxhanthins) with an acceptable accuracy, while the prediction of ascorbic acid and the total phenols content is unsuitable. Despite this, TRS can be considered a useful technique for the quality evaluation of mango fruit, providing consumer fruits with good, healthy characteristics. Moreover, the use of specific wavelengths allows the direct tracking of chlorophylls and carotenoids that are directly involved in fruit ripening and that can be used to model different ripening processes (softening, color, ethylene production). It is also possible to sort fruit on the basis of absorption coefficients linked to chlorophylls or to carotenoids to have fruit that is homogeneous for the ripening degree, promoting better postharvest management and limiting quantitative and qualitative losses in the supply chain. Aiming at improving the applicability of TRS devices to the industry, we are working on the implementation of a non-contact device suitable for sorting lines and of a handheld device for in-field measurements. Such instrumentation would allow fast and nondestructive measurements of fruit quality along the supply chain.

Supplementary Materials

The following supporting information can be downloaded at: https://www.mdpi.com/article/10.3390/agriculture14111902/s1, Figure S1: Chromatographic pattern at 450 nm of nonsaponified extract of ‘Tommy Atkins’ mangoes after 8 days of shelf-life at 20 °C. For peak assignment see Table S1; Table S1: Retention times (Rt, min), spectrum features (λmax, nm) in the mobile phase obtained by DAD, spectral fine structure (%III/II), relative intensity of the cis-peak (%AB/AII), and name abbreviation of tentatively identified compounds.

Author Contributions

Conceptualization, M.V. and A.R.; writing—original draft preparation, M.V. and A.R.; writing—review and editing, M.V., A.R., L.S., A.T. and G.C.; formal analysis, F.L. and P.L.; visualization, M.V. and A.R.; funding acquisition, A.T. All authors have read and agreed to the published version of the manuscript.

Funding

This research was funded by the Lombardia Region (Italy) and Minas Gerais Region (Brazil) (Progetto di Cooperazione scientifica e tecnologica, “Approccio multidisciplinare per l’innovazione della filiera di frutti tropicali—TROPICO” ID 17077, Rif. N.° AGRO-16).

Data Availability Statement

The original contributions presented in the study are included in the article, further inquiries can be directed to the corresponding author.

Acknowledgments

Thanks to Spreafico Francesco & Fratelli S.p.A. (Dolzago, LC, Italy) for selected fruit supply from the commercial orchards in Pernambuco, Brazil.

Conflicts of Interest

The authors declare no conflicts of interest.

References

  1. Gentile, C.; Di Gregorio, E.; Di Stefano, V.; Mannino, G.; Perrone, A.; Avellone, G.; Sortino, G.; Inglese, P.; Farina, V. Food quality and nutraceutical value of nine cultivars of mango (Mangifera indica L.) fruits grown in Mediterranean subtropical environment. Food Chem. 2019, 277, 471–479. [Google Scholar] [CrossRef] [PubMed]
  2. Maldonado-Celis, M.E.; Yahia, E.M.; Bedoya, R.; Landázuri, P.; Loango, N.; Aguillón, J.; Restrepo, B.; Guerrero Ospina, J.C. Chemical composition of mango (Mangifera indica L.) fruit: Nutritional and phytochemical compounds. Front. Plant Sci. 2019, 10, 1073. [Google Scholar] [CrossRef]
  3. Liguori, G.; Gentile, C.; Sortino, G.; Inglese, P.; Farina, V. Food quality, sensory attributes and nutraceutical value of fresh “Osteen” mango fruit grown under mediterranean subtropical climate compared to imported fruit. Agriculture 2020, 10, 103. [Google Scholar] [CrossRef]
  4. Ornelas-Paz, J.J.; Yahia, E.M.; Gardea, A.A. Identification and quantification of xanthophyll esters, carotenes, and tocopherols in the fruit of seven Mexican mango cultivars by liquid chromatography-atmospheric pressure chemical ionization-time-of-flight mass spectrometry [LC-(Apcl+)-MS]. J. Agric. Food Chem. 2007, 55, 6628–6635. [Google Scholar] [CrossRef]
  5. Ornelas-Paz, J.J.; Yahia, E.M.; Gardea, A.A. Changes in external and internal color during postharvest ripening of ‘Manila’ and ‘Ataulfo’ mango fruit and relationship with carotenoid content determined by liquid chromatography-Apcl+-time-of-flight mass spectrometry. Postharvest Biol. Technol. 2008, 50, 145–152. [Google Scholar] [CrossRef]
  6. Manthey, J.A.; Perkins-Veazie, P. Influences of harvest date and location on the levels of β-carotene, ascorbic acid, total phenols, the in vitro antioxidant capacity, and phenolic profiles of five commercial varieties of mango (Mangifera indica L.). J. Agric. Food Chem. 2009, 57, 10825–10830. [Google Scholar] [CrossRef]
  7. Liu, F.X.; Fu, S.F.; Bi, X.F.; Chen, F.; Liao, X.J.; Hu, X.S.; Wu, J.H. Physico-chemical and antioxidant properties of four mango (Mangifera indica L.) cultivars in China. Food Chem. 2013, 138, 396–405. [Google Scholar] [CrossRef]
  8. Vásquez-Caicedo, A.L.; Heller, A.; Neidhart, S.; Carle, R. Chromoplast morphology and β-carotene accumulation during postharvest ripening of Mango cv. ‘Tommy Atkins’. J. Agric. Food Chem. 2006, 54, 5769–5776. [Google Scholar] [CrossRef]
  9. Vanoli, M.; Rizzolo, A.; Spinelli, L.; Azzollini, S.; Torricelli, A. Carotenoid content and pulp colour non-destructively measured by time-resolved reflectance spectroscopy in different cultivars of Brazilian mangoes. Acta Hortic. 2016, 1119, 305–312. [Google Scholar] [CrossRef]
  10. Ntsoane, M.L.; Zude-Sasse, M.; Mahajan, P.; Sivakumar, D. Quality assessment and postharvest technology of mango: A review of its current status and future perspectives. Sci. Hortic. 2019, 249, 77–85. [Google Scholar] [CrossRef]
  11. Ibarra-Garza, I.P.; Ramos-Parra, P.A.; Hernández-Brenes, C.; Jacobo-Velázquez, D.A. Effect of postharvest ripening on the nutraceutical and physico-chemical properties of mango (Mangifera indica L. cv. Keitt). Postharvest Biol. Technol. 2015, 103, 45–54. [Google Scholar] [CrossRef]
  12. Hu, K.; Peng, D.; Wang, L.; Liu, H.; Xie, B.; Sun, Z. Effect of mild high hydrostatic pressure treatments on physiological and physicochemical characteristics and carotenoid biosynthesis in postharvest mango. Postharvest Biol. Technol. 2021, 172, 111381. [Google Scholar] [CrossRef]
  13. Ma, X.; Zheng, B.; Ma, Y.; Xu, W.; Wu, H.; Wang, S. Carotenoid accumulation and expression of carotenoid biosynthesis genes in mango flesh during fruit development and ripening. Sci. Hortic. 2018, 237, 201–206. [Google Scholar] [CrossRef]
  14. Lenucci, M.S.; Tornese, R.; Mita, G.; Durante, M. Bioactive Compounds and Antioxidant Activities in Different Fractions of Mango Fruits (Mangifera indica L., Cultivar Tommy Atkins and Keitt). Antioxidants 2022, 11, 484. [Google Scholar] [CrossRef]
  15. Mercadante, A.Z.; Rodriguez-Amaya, D.B.; Petry, F.C.; Mariutti, L.R.B. Carotenoid esters in foods—A review and practical directions on analysis and occurrence. Food Res. Int. 2017, 99, 830–850. [Google Scholar] [CrossRef]
  16. Petry, F.C.; Mercadante, A.Z. Composition by LC-MS/MS of new carotenoid esters in mango and citrus. J. Agric. Food Chem. 2016, 64, 8207–8224. [Google Scholar] [CrossRef]
  17. Vanoli, M.; Grassi, M.; Spinelli, L.; Torricelli, A.; Rizzolo, A. Quality and nutraceutical properties of mango fruit: Influence of cultivar and biological age assessed by Time-resolved Reflectance Spectroscopy. Adv. Hortic. Sci. 2018, 32, 407–420. [Google Scholar] [CrossRef]
  18. Rocha Ribeiro, S.M.; Queiroz, J.H.; Lopes Ribeiro de Queiroz, M.E.; Campos, F.M.; Pinheiro Sant’Ana, H.M. Antioxidant in mango (Mangifera indica L.) pulp. Plant Foods Hum. Nutr. 2007, 62, 13–17. [Google Scholar] [CrossRef]
  19. Hu, K.; Ghani Dars, A.; Liu, Q.; Xie, B.; Sun, Z. Phytochemical profiling of the ripening of Chinese mango (Mangifera indica L.) cultivars by real-time monitoring using UPLC-ESI-QTOF-MS and its potential benefits as prebiotic ingredients. Food Chem. 2018, 256, 171–180. [Google Scholar] [CrossRef]
  20. da Silva Sauthier, M.C.; da Silva, E.G.P.; da Silva Santos, B.R.; Requião Silva, E.F.; da Cruz Caldas, J.; Minho, L.A.C.; dos Santos, A.M.P.; dos Santos, W.N.L. Screening of Mangifera indica L. functional content using PCA and neural networks (ANN). Food Chem. 2019, 273, 115–123. [Google Scholar] [CrossRef]
  21. Nassur, R.C.M.R.; Gonzales-Moscoso, S.; Crisosto, G.M.; Lima, L.C.O.; Vilas Boas, E.V.B.; Crisosto, C.H. Describing quality and sensory attributes of 3 mango (Mangifera indica L.) cultivars at 3 ripeness stages based on firmness. J. Food Sci. 2015, 80, S2055–S2063. [Google Scholar] [CrossRef] [PubMed]
  22. Sivakumar, D.; Jiang, Y.; Yahia, E.M. Maintaining mango (Mangifera indica L.) fruit quality during the export chain. Food Res. Internat. 2011, 44, 1254–1263. [Google Scholar] [CrossRef]
  23. Kienzle, S.; Sruamsiri, P.; Carle, R.; Sirisakulwat, S.; Spreer, W.; Neidhart, S. Harvest maturity specification for mango fruit (Mangifera indica L. ‘Chok Anan’) in regard to long supply chains. Postharvest Biol. Technol. 2011, 61, 41–55. [Google Scholar] [CrossRef]
  24. Padda, M.S.; do Amarante, C.V.T.; Garcia, R.M.; Slaughter, D.C.; Mitcham, E.J. Methods to analyze physico-chemical changes during mango ripening: A multivariate approach. Postharvest Biol. Technol. 2011, 62, 267–274. [Google Scholar] [CrossRef]
  25. Subedi, P.P.; Walsh, K.B.; Owens, G. Prediction of mango eating quality at harvest using short-wave near infrared spectrometry. Postharvest Biol. Technol. 2007, 43, 326–334. [Google Scholar] [CrossRef]
  26. O’Brien, C.; Falagan, N.; Kourmpetli, S.; Landahl, S.; Terry, L.A.; Alamar, M.C. Non-destructive methods for mango ripening prediction: Visible and near-infrared spectroscopy (visNIRS) and laser Doppler vibrometry (LDV). Postharvest Biol. Technol. 2024, 212, 112878. [Google Scholar] [CrossRef]
  27. Lu, R.; Van Beers, R.; Saeys, W.; Li, C.; Cen, H. Measurement of optical properties of fruits and vegetables: A review. Postharvest Biol. Technol. 2020, 159, 111003. [Google Scholar] [CrossRef]
  28. Lammertyn, J.; Peirs, A.; De Baerdemaeker, J.; Nicolaï, B.M. Light penetration properties of NIR radiation in fruit with respect to non-destructive quality assessment. Postharvest Biol. Technol. 2000, 18, 121–132. [Google Scholar] [CrossRef]
  29. Cubeddu, R.; D’Andrea, C.; Pifferi, A.; Taroni, P.; Torricelli, A.; Valentini, G.; Dover, C.; Johnson, D.; Ruiz-Altisent, M.; Valero, C. Nondestructive quantification of chemical and physical properties of fruits by time-resolved reflectance spectroscopy in the wavelength range 650–1000 nm. Appl. Opt. 2001, 40, 538–543. [Google Scholar] [CrossRef]
  30. Torricelli, A.; Spinelli, L.; Contini, D.; Vanoli, M.; Rizzolo, A.; Eccher Zerbini, P. Time-resolved reflectance spectroscopy for nondestructive assessment of food quality. Sens. Instrumen. Food Qual. 2008, 2, 82–89. [Google Scholar] [CrossRef]
  31. Rizzolo, A.; Vanoli, M. Time-resolved technique for measuring optical properties and quality of food. In Light Scattering Technology for Food Property, Quality and Safety Assessment; Lu, R., Ed.; CRC Press, Taylor & Francis Group: Boca Raton, FL, USA, 2016; pp. 187–224. [Google Scholar]
  32. Eccher Zerbini, P.; Vanoli, M.; Rizzolo, A.; Jacob, S.; Torricelli, A.; Spinelli, L.; Schouten, R.E. Time-resolved Reflectance Spectroscopy as a management tool in the fruit supply chain: An export trial with nectarines. Biosyst. Eng. 2009, 102, 360–363. [Google Scholar] [CrossRef]
  33. Rizzolo, A.; Vanoli, M.; Torricelli, A.; Spinelli, L.; Sadar, N.; Zanella, A. Modeling optical properties of Braeburn apples during fruit maturation on the tree. Acta Hortic. 2021, 1311, 113–121. [Google Scholar] [CrossRef]
  34. Pereira, T.; Tijskens, L.M.M.; Vanoli, M.; Rizzolo, A.; Eccher Zerbini, P.; Torricelli, A.; Spinelli, L.; Filgueiras, H. Assessing the harvest maturity of Brazilian mangoes. Acta Hortic. 2010, 880, 269–276. [Google Scholar] [CrossRef]
  35. Eccher Zerbini, P.; Vanoli, M.; Rizzolo, A.; Grassi, M.; Pimentel, R.M.A.; Spinelli, L.; Torricelli, A. Optical properties, ethylene production and softening in mango fruit. Postharvest Biol. Technol. 2015, 101, 58–65. [Google Scholar] [CrossRef]
  36. Vanoli, M.; Rizzolo, A.; Grassi, M.; Spinelli, L.; Torricelli, A. Modeling mango ripening during shelf life based on pulp color nondestructively measured by time-resolved reflectance spectroscopy. Sci. Hortic. 2023, 310, 111714. [Google Scholar] [CrossRef]
  37. Martelli, F.; Del Bianco, S.; Ismaelli, A.; Zaccanti, G. Light Propagation Through Biological Tissue and Other Diffusive Media: Theory, Solution, and Software; SPIE Press: Washington, DC, USA, 2009. [Google Scholar]
  38. Jha, S.N.; Kingsly, A.R.P.; Chopra, S. Non-destructive determination of firmness and yellowness of mango during growth and storage using visual spectroscopy. Biosyst. Eng. 2006, 94, 397–402. [Google Scholar] [CrossRef]
  39. Robles-Sánchez, R.M.; Rojas-Graü, M.A.; Odriozola-Serrano, I.; González-Aguilar, G.A.; Martin-Belloso, O. Effect of minimal processing on bioactive compounds and antioxidant activity of fresh-cut ‘Kent’ mango (Mangifera indica L.). Postharvest Biol. Technol. 2009, 51, 384–390. [Google Scholar] [CrossRef]
  40. Rizzolo, A.; Brambilla, A.; Valsecchi, S.; Eccher Zerbini, P. Evaluation of sampling and extraction procedures for the analysis of ascorbic acid from pear fruit tissue. Food Chem. 2002, 77, 257–262. [Google Scholar] [CrossRef]
  41. Singleton, V.L.; Orthofer, R.; Lamuela-Raventos, R.M. Analysis of total phenols and other oxidation substrates and antioxidants by means of Folin–Ciocalteu reagent. Methodol. Enzymol. 1999, 299, 152–178. [Google Scholar]
  42. Brand-Williams, W.; Cuvelier, M.E.; Berset, C. Use of free radical method to evaluate antioxidant activity. Lebensm. Wiss. Technol. 1995, 28, 25–30. [Google Scholar] [CrossRef]
  43. Azevedo-Meleiro, C.H.; Rodriguez-Amaya, D.B. Confirmation of the identity of the carotenoids of tropical fruits by HPLC-DAD and HPLC-MS. J. Food Compos. Anal. 2004, 17, 385–396. [Google Scholar] [CrossRef]
  44. Azevedo-Meleiro, C.H.; Rodriguez-Amaya, D.B. Qualitative and quantitative differences in the carotenoid composition of yellow and red peppers determined by HPLC-DAD-MS. J. Sep. Sci. 2009, 32, 3652–3658. [Google Scholar] [CrossRef] [PubMed]
  45. Wan, H.; Yu, C.; Han, Y.; Guo, X.; Ahmad, S.; Tang, A.; Wang, J.; Cheng, T.; Pan, H.; Zhan, O. Flavonols and carotenoids in yellow petals of rose cultivar (Rosa ‘Sun City’): A possible rich source of bioactive compounds. J. Agric. Food Chem. 2018, 66, 4171–4181. [Google Scholar] [CrossRef]
  46. Sajilata, M.G.; Singhal, R.S.; Kamat, M.Y. The carotenoid pigment Zaexanthin—A Review. Compr. Rev. Food Sci. Food Saf. 2008, 7, 29–49. [Google Scholar] [CrossRef]
  47. Rodriguez-Amaya, D.B.; Kimura, M. HarvestPlus Handbook for Carotenoid Analysis; HarvestPlus Technical Monograph 2, HarvestPlus, c/o; International Food Policy Research Institute (IFPRI): Washington, DC, USA, 2004. [Google Scholar]
  48. Mercadante, A.Z.; Rodriguez-Amaya, D.B.; George Britton, G. HPLC and Mass Spectrometric Analysis of Carotenoids from Mango. J. Agric. Food Chem. 1997, 45, 120–123. [Google Scholar] [CrossRef]
  49. Rizzolo, A.; Vanoli, M.; Spinelli, L.; Torricelli, A. Non-destructive assessment of pulp colour in mangoes by time-resolved reflectance spectroscopy: Problems and solutions. Acta Hortic. 2016, 1119, 147–154. [Google Scholar] [CrossRef]
  50. Schweiggert, R.M.; Mezger, D.; Schimpf, F.; Steingass, C.B.; Carle, R. Influence of chromoplast morphology on carotenoid bioaccessibility of carrot, mango, papaya, and tomato. Food Chem. 2012, 135, 2736–2742. [Google Scholar] [CrossRef]
  51. Kienzle, S.; Sruamsiri, P.; Carle, R.; Sirisakulwat, S.; Spreer, W.; Neidhart, S. Harvest maturity detection for ‘Nam Dokmai #4’ mango fruit (Mangifera indica L.) in consideration of long supply chains. Postharvest Biol. Technol. 2012, 72, 64–75. [Google Scholar] [CrossRef]
  52. De Morais, P.L.D.; Filgueiras, H.A.C.; De Pinho, J.L.N.; Alves, R.E. Ponto de colheita ideal de mangas ‘Tommy Atkins’ destinadas ao mercado europeu. Rev. Bras. Frutic. 2002, 24, 671–675. [Google Scholar] [CrossRef]
  53. Sabato, S.F.; da Silva, J.M.; da Cruz, J.N.; Salmieri, S.; Rela, P.R.; Lacroix, M. Study of physical–chemical and sensorial properties of irradiated Tommy Atkins mangoes (Mangifera indica L.) in an international consignment. Food Control 2009, 20, 284–288. [Google Scholar] [CrossRef]
  54. de Mello Vasconcelos, O.C.; Duarte, D.; de Castro Silva, J.; Oliveros Mesa, N.F.; Teruel Mederos, B.J.; de Freitas, T.S. Modeling ‘Tommy Atkins’ mango cooling time based on fruit physicochemical quality. Sci. Hortic. 2019, 244, 413–420. [Google Scholar] [CrossRef]
  55. Beaulieu, J.C.; Lea, J.M. Volatile and quality changes in fresh-cut mangos prepared from firm-ripe and soft-ripe fruit, stored in clamshell containers and passive MAP. Postharvest Biol. Technol. 2003, 30, 15–28. [Google Scholar] [CrossRef]
  56. Cárdenas-Pérez, S.; Chanona-Pérez, J.J.; Güemes-Vera, N.; Cybulska, J.; Szymanska-Chargot, M.; Chylinska, M.; Kozioł, A.; Gawkowska, D.; Pieczywek, P.M.; Zdunek, A. Structural, mechanical and enzymatic study of pectin and cellulose during mango ripening. Carbohydr. Polym. 2018, 196, 313–321. [Google Scholar] [CrossRef]
  57. Cantre, D.; Herremans, E.; Verboven, P.; Ampofo-Asiama, J.; Nicolaï, B. Characterization of the 3-D microstructure of mango (Mangifera indica L. cv. Carabao) during ripening using X-ray computed microtomography. IFSET 2014, 24, 28–39. [Google Scholar] [CrossRef]
  58. Herremans, E.; Bongaers, E.; Estrade, P.; Gondek, E.; Hertog, M.; Jakubczyk, E.; Do Trong, N.N.; Rizzolo, A.; Saeys, W.; Spinelli, L.; et al. Microstructure–texture relationships of aerated sugar gels: Novel measurement techniques for analysis and control. IFSET 2013, 18, 202–211. [Google Scholar] [CrossRef]
  59. Modesto, J.H.; Leonel, S.; Segantini, D.M.; Azèvedo Souza, J.M.; Ferraz, R.A. Qualitative attributes of some mango cultivars fruits. Aust. J. Crop Sci. 2016, 10, 565–570. [Google Scholar] [CrossRef]
  60. da Silva Oliveira, D.; Lobato, A.L.; Machado Rocha Ribeiro, S.; Campos Santana, Â.M.; Paes Chaves, J.B.; Pinheiro-Sant’Ana, H.M. Carotenoids and vitamin C during handling and distribution of guava (Psidium guajava L.), mango (Mangifera indica L.), and papaya (Carica papaya L.) at commercial restaurants. J. Agric. Food Chem. 2010, 58, 6166–6172. [Google Scholar] [CrossRef]
  61. Barbosa Gámez, I.; Caballero Montoya, K.P.; Ledesma, N.; Sáyago Ayerdi, S.G.; García Magaña, M.d.L.; Bishop von Wettberg, E.J.; Montalvo-González, E. Changes in the nutritional quality of five Mangifera species harvested at two maturity stages. J. Sci. Food Agric. 2017, 97, 4987–4994. [Google Scholar] [CrossRef]
  62. Kim, Y.; Brecht, J.K.; Talcott, S.T. Antioxidant phytochemical and fruit quality changes in mango (Mangifera indica L.) following hot water immersion and controlled atmosphere storage. Food Chem. 2007, 105, 1327–1334. [Google Scholar] [CrossRef]
  63. Robles-Sánchez, R.M.; Islas-Osuna, M.A.; Astiazarán-García, H.; Vázquez-Ortiz, F.A.; Martín-Belloso, O.; Gorinstein, S.; González-Aguilar, G.A. Quality index, consumer acceptability, bioactive compounds, and antioxidant activity of fresh-cut “Ataulfo” mangoes (Mangifera indica L.) as affected by low-temperature storage. J. Food Sci. 2009, 74, S126–S134. [Google Scholar] [CrossRef]
  64. Kim, Y.; Lounds-Singleton, A.J.; Talcott, S.T. Antioxidant phytochemical and quality changes associated with hot water immersion treatment of mango (Mangifera indica L.). Food Chem. 2009, 115, 989–993. [Google Scholar] [CrossRef]
  65. Silva, K.D.R.R.; Sirasa, M.S.F. Antioxidant properties of selected fruit cultivars grown in Sri Lanka. Food Chem. 2018, 238, 203–208. [Google Scholar] [CrossRef] [PubMed]
  66. Corral-Aguayo, R.D.; Yahia, E.M.; Carrillo-Lopez, A.; González- Aguilar, G. Correlation between some nutritional components and the total antioxidant capacity measured with six different assays in eight horticultural crops. J. Agric. Food Chem. 2008, 56, 10498–10504. [Google Scholar] [CrossRef]
  67. Pott, I.; Breithaupt, D.E.; Carle, R. Detection of unusual carotenoid esters in fresh mango (Mangifera indica L. cv. ‘Kent’). Phytochemistry 2003, 64, 825–829. [Google Scholar] [CrossRef]
  68. Mercadante, A.Z.; Rodriguez-Amaya, D.B. Effects of Ripening, Cultivar Differences, and Processing on the Carotenoid Composition of Mango. J. Agric. Food Chem. 1998, 46, 128–130. [Google Scholar] [CrossRef]
  69. Rungpichayapichet, P.; Chaiyarattanachote, N.; Khuwijitjaru, P.; Nakagawa, K.; Nagle, M.; Müller, J.; Mahayothee, B. Comparison of near-infrared spectroscopy and hyperspectral imaging for internal quality determination of ‘Nam Dok Mai’ mango during ripening. J. Food Meas. Charact. 2023, 17, 1501–1514. [Google Scholar] [CrossRef]
  70. Bicanic, D.; Dimitrovski, D.; Luterotti, S.; Twisk, C.; Buijnsters, J.G.; Dóka, O. Estimating rapidly and precisely the concentration of beta carotene in mango homogenates by measuring the amplitude of optothermal signals, chromaticity indices and the intensities of Raman peaks. Food Chem. 2010, 121, 832–838. [Google Scholar] [CrossRef]
  71. Vásquez-Caicedo, A.L.; Sruamsiri, P.; Heller, A.; Carle, R.; Neidhart, S. Accumulation of All-trans-β-carotene and Its 9-cis and 13-cis Stereoisomers during Postharvest Ripening of Nine Thai Mango Cultivars. J. Agric. Food Chem. 2005, 53, 4827–4835. [Google Scholar] [CrossRef]
  72. Kiran, P.R.; Parray, R.A. Non-destructive Prediction of Quality Parameters in Alphonso Mangoes Using Near-infrared Spectroscopy: A Comprehensive Study on Physicochemical Characteristics and Ripening Dynamics. J. Sci. Res. Rep. 2024, 30, 82–90. [Google Scholar] [CrossRef]
  73. Vanoli, M.; Spinelli, L.; Torricelli, A.; Ibrahim, A.; Parisi, B.; Lo Scalzo, R.; Rizzolo, A. Anthocyanin and carotenoid contents assessed by time-resolved reflectance spectroscopy in potato tubers (Solanum tuberosum L.) with different flesh colors. Adv. Hortic. Sci. 2020, 34, 71–80. [Google Scholar] [CrossRef]
  74. Munawar, A.A.; Kusumiyati; Wahyuni, D. Near infrared spectroscopic data for rapid and simultaneous prediction of quality attributes in intact mango fruits. Data Brief 2019, 27, 104789. [Google Scholar] [CrossRef] [PubMed]
  75. Hayati, R.; Munawar, A.A.; Fachruddin, F. Enhanced near infrared spectral data to improve prediction accuracy in determining quality parameters of intact mango. Data Brief 2020, 30, 105571. [Google Scholar] [CrossRef] [PubMed]
  76. Kusumiyati; Munawar, A.A.; Suhandy, D. Fast, simultaneous and contactless assessment of intact mango fruit by means of near infrared spectroscopy. AIMS Agric. Food 2021, 6, 172–184. [Google Scholar] [CrossRef]
Figure 1. (a) Scheme of the system used for TRS measurements on mango fruit (GRIN: graded-index; PMT: photomultiplier tube; SYNC: synchronization signal; CFD: constant fraction discriminator signal; TCSPC: time-correlated single-photon counting board). (b) Exemplum of the best fit of the model (red line), describing photon diffusion in a turbid medium on the measured DTOF (distribution of photon time-of-flight, blue dots) and after convolution with the IRF (instrument response function, pink line).
Agriculture 14 01902 g001
Figure 2. Absorption (left) and scattering (right) spectra measured on ‘Tommy Atkins’ mango fruits after 1 (blu lines), 3 (green lines), and 8 (red lines) days of shelf-life at 20 °C.
Agriculture 14 01902 g002
Figure 3. Absorption coefficients measured at 540 nm (left) and at 670 nm (right) on ‘Tommy Atkins’ mango fruits according to rank order and the day of shelf-life.
Agriculture 14 01902 g003
Figure 4. Mie’s A (right) and Mie’s b (left) on ‘Tommy Atkins’ mango fruits according to rank order and the day of shelf-life.
Agriculture 14 01902 g004
Figure 5. Measured and predicted total carotenoids, total xanthophylls, total violaxanthin esters, and (all-E)-β-carotene using multi regression analysis. The models’ details are reported in Table 6.
Agriculture 14 01902 g005
Table 1. Absorption coefficients in the carotenoids and chlorophyll bands and Mie’s A and b scattering parameters of ‘Tommy Atkins’ mangoes after 1, 3, and 8 days of shelf-life at 20 °C and results of the ANOVA (F-ratio and p-value).
TRS Optical PropertiesDay 1Day 3Day 8ANOVA
μa540 (cm−1)0.177 ± 0.018 b0.200 ± 0.017 ab0.256 ± 0.017 a4.27 *
μa630 (cm−1)0.048 ± 0.002 a0.043 ± 0.002 a0.047 ± 0.007 a1.11 ns
μa650 (cm−1)0.046 ± 0.003 a0.037 ± 0.002 a0.040 ± 0.003 a2.83 ns
μa670 (cm−1)0.067 ± 0.017 a0.038 ± 0.002 b0.036 ± 0.002 b3.56 *
μa690 (cm−1)0.026 ± 0.001 a0.023 ± 0.001 a0.024 ± 0.002 a1.16 ns
Mie’s A (cm−1)18.39 ± 0.74 a17.57 ± 0.61 a14.88 ± 0.63 b7.67 **
Mie’s b (−)0.084 ± 0.020 b0.309 ± 0.039 a0.225 ± 0.044 a10.09 ***
Mean ± SE; means followed by different letters are statistically different (Tukey’s test, * p < 0.05; ** p < 0.01; *** p < 0.001; ns = not significantly different).
Table 2. Firmness and pulp color of ‘Tommy Atkins’ mangoes after 1, 3, and 8 days of shelf-life at 20 °C and results of the ANOVA (F-ratio and p-value).
ParameterDay 1Day 3Day 88ANOVA
Firmness (N)39.4 ± 11.9 a1 5.0 ± 2.8 ab7.3 ± 0.9 b5.58 **
L*82.2 ± 0.9 a80.3 ± 0.7 a76.9 ± 0.9 b10.20 ***
a*0.4 ± 1.2 b3.5 ± 0.9 ab6.2 ± 0.9 a8.20 **
b*53.6 ± 2.2 b56.6 ± 1.8 ab60.9 ± 1.6 a3.77 *
C*53.7 ± 2.2 b56.8 ± 1.8 ab61.2 ± 1.7 a3.89 *
90.0 ± 1.2 a86.7 ± 2.7 ab84.4 ± 0.8 b8.60 ***
IY117.4 ± 7.2 b129.3 ± 5.8 ab147.6 ± 5.9 a 5.82 **
Mean ± SE; means followed by different letters are statistically different (Tukey’s test, * p < 0.05; ** p < 0.01; *** p < 0.001).
Table 3. Ascorbic acid (AA), total phenols content (TPC), total antioxidant capacity (TAC) and total carotenoids (CAR) of ‘Tommy Atkins’ mangoes after 1, 3, and 8 days of shelf-life at 20 °C and results of the ANOVA (F-ratio and p-value).
ParameterDay 1Day 3Day 8ANOVA
AA (mg kg FW−1)170.4 ± 11.3 a129.2 ± 11.7 ab90.2 ± 8.4 b10.11 ***
TPC (mg GAE kg FW−1)244.8 ± 21.7 a253.8 ± 26.2 a242.8 ± 24.4 a0.06 ns
TAC (μmol TE kg FW−1)748.6 ± 72.2 a641.9 ± 105.9 ab427.7 ± 76.3 b3.60 *
CAR (mg β-CARE kg FW−1)7.41 ± 1.32 b9.24 ± 1.65 b22.21 ± 2.94 a14.65 ***
Mean ± SE; means followed by different letters are statistically different (Tukey’s test, * p < 0.05; *** p < 0.001; ns = not significantly different).
Table 4. Carotenoids (mg β-CARE kg FW−1) composition of ‘Tommy Atkins’ mangoes after 1, 3, and 8 days of shelf-life at 20 °C and results of the ANOVA (F-ratio and p-value).
CompoundDay 1Day 3Day 8ANOVA
9-Viol0.34 ± 0.06 a0.42 ± 0.04 a0.43 ± 0.04 a0.96 ns
UNK0.06 ± 0.02 a0.07 ± 0.02 a0.14 ± 0.04 a2.53 ns
Viol0.04 ± 0.04 b0.23 ± 0.13 b0.63 ± 0.07 a10.52 ***
Crypt0.93 ± 0.15 b1.62 ± 0.24 a0.33 ± 0.11 b13.04 ***
ViolBut1.56 ± 0.39 a2.06 ± 0.66 a2.00 ± 0.31 a0.33 ns
NeoDibut0.59 ± 0.25 b0.32 ± 0.15 b3.23 ± 0.83 a10.00 ***
ViolDibut0.19 ± 0.09 ab0.06 ± 0.04 b2.02 ± 0.93 a4.11 *
13-ViolDibut0.32 ± 0.17 b0.21 ± 0.11 b1.09 ± 0.29 a5.48 **
9-ViolBut0.39 ± 0.12 a0.38 ± 0.09 a1.09 ± 036 a3.15 ns
9-NeoDibut0.18 ± 0.07 a0.08 ± 0.04 a0.64 ± 0.27 a3.32 *
ViolButCap0.44 ± 0.07 b0.48 ± 0.06 b1.66 ± 0.22 a24.66 ***
9-ViolDibut0.16 ± 0.02 b0.26 ± 0.04 b0.73 ± 0.10 a20.32 ***
NeoButMyr0.31 ± 0.10 a0.22 ± 0.06 a0.57 ± 0.15 a2.69 ns
9-ViolButLau0.16 ± 0.05 a0.10 ± 0.03 a0.23 ± 0.05 a2.12 ns
b-car1.44 ± 0.17 b2.45 ± 0.32 b5.77 ± 0.61 a30.49 ***
ViolEster10.08 ± 0.02 b0.05 ± 0.02 b0.57 ± 0.12 a15.55 ***
NeoEster10.09 ± 0.03 b0.09 ± 0.03 b0.54 ± 0.08 a22.71 ***
9-ViolButPalm0.11 ± 0.03 b0.12 ± 0.04 b0.42 ± 0.10 a7.20 **
ΣViol2.28 ± 0.38 b2.66 ± 0.67 b6.26 ± 0.85 a11.00 ***
Σ9-Viol0.82 ± 0.19 b0.85 ± 0.15 b2.47 ± 0.87 a7.75 ***
ΣNeo0.99 ± 0.33 b0.64 ± 0.16 b4.35 ± 0.87 a14.12 ***
ΣFree1.31 ± 0.18 b2.28 ± 0.23 a1.39 ± 0.11 b8.48 ***
TotalXant5.91 ± 0.80 b6.72 ± 0.84 b16.21 ± 1.49 a27.06 ***
Mean ± SE; means followed by different letters are statistically different (Tukey’s test, * p < 0.05; ** p < 0.01; *** p < 0.001; ns = not significantly different). ΣViol, total (all-E)-violaxanthin esters; Σ9-Viol, total 9-Z-violaxanthin esters; ΣNeo, total (all-E)-neoxanthin esters; ΣFree, total free xanthophylls; TotalXant, total xanthophylls.
Table 5. Spearman correlation matrix between pulp color parameters and carotenoid compounds. Significant correlations with r ≥ 0.7, p-value ≤ 0.0001 are in bold.
CompoundL*a*b*C*IY
9-Viol−0.6370.6200.5770.577−0.5820.612
UNK−0.0480.040−0.066−0.066−0.039−0.013
Viol −0.4790.4520.3920.392−0.4740.435
Crypt0.180−0.110−0.173−0.1730.114−0.164
ViolBut−0.6910.6530.6700.670−0.6520.679
NeoDibut−0.5870.6040.5030.503−0.6020.571
ViolDibut−0.0680.0810.1200.120−0.0530.120
13-ViolDibut−0.6370.6320.5860.586−0.6260.627
9-ViolBut−0.2100.1920.2200.220−0.190 0.215
9-NeoDibut0.276−0.301−0.385−0.3850.289−0.354
ViolButCap−0.5780.5290.4840.484−0.5320.532
9-ViolDibut−0.7440.7340.6250.625−0.7200.676
NeoButMyr−0.3160.2830.2000.200−0.3130.275
9-ViolButLau−0.1130.0800.0310.031−0.0970.074
b-Car−0.7450.7770.6630.663−0.7910.723
ViolEster1−0.1870.1690.1260.126−0.1610.160
NeoEster1−0.5590.5460.4600.460−0.5380.533
9-ViolButPalm−0.3360.3170.2050.205−0.341 0.280
ΣViol −0.8270.7920.8180.818−0.7660.825
Σ9-Viol −0.5550.5590.4640.464−0.5620.532
ΣNeo −0.5050.4860.4300.430−0.4930.471
ΣFree−0.3160.3700.2860.286−0.3750.313
TotalXant−0.8660.8570.7800.780−0.8500.837
CAR−0.8510.8450.7660.766−0.8380.821
ΣViol, total (all-E)-violaxanthin esters; Σ9-Viol, total 9-Z-violaxanthin esters; ΣNeo, total (all-E)-neoxanthin esters; ΣFree, total free xanthophylls; TotalXant, total xanthophylls; CAR, total carotenoids content.
Table 6. Multiple regression analysis: estimate and significance of T-statistic of parameters included in the selected model, result of the ANOVA of the model, R-square (R2), R-square adjusted for d.f. (R2adj), standard error of the estimate (SEE) and mean absolute error (MAE) for total carotenoids (CAR), total xanthophylls (TotalXant), total (all-E)-violaxanthin esters (ΣViol), (all-E)-β-carotene, (9Z)-violaxanthin dibutyrate (9-ViolDibut), (all-E)-violaxanthin butyrate-caproate (ViolButCap), and (all-E)-neoxanthin ester (NeoEster1) in the function of absorption coefficient at 540 nm at sorting (μa540SORT), absorption coefficients in the 540–690 nm range during shelf-life, and Mie’s A and b scattering parameters.
Dependent
Variables
Coefficients of Independent VariablesConstantANOVA
Model
R2 (%)R2adj
(%)
SEE
μa540SORTμa540μa650μa630μa670μa690Mie’s AMie’s b
CAR−165.15
p > 0.001
258.87 p < 0.001−1445.18 p = 0.0301713.93 p = 0.003−1425.21 p = 0.05616.01
p = 0.006
<0.00186.383.13.845
TotalXant−124.28
p > 0.001
200.12 p < 0.001−1493.34 p = 0.0061122.76 p = 0.01210.18
p = 0.025
<0.00181.778.53.224
ΣViol−30.49
p = 0.033
59.86 p < 0.001−0.392 p = 0.006<0.00176.374.41.780
b-Car−44.36
p < 0.001
57.61 p < 0.001217.55
p = 0.051
−528.59 p = 0.0252.33
p = 0.165
<0.00180.376.91.286
9-ViolDibut−4.72
p = 0.013
5.57 p < 0.001−23.20 p = 0.043−0.06
p = 0.014
1.46
p = 0.003
<0.00168.563.00.22
ViolButCap134.53 p = 0.002−285.93 p < 0.001−0.20
p < 0.001
4.98
p < 0.001
<0.00166.462.20.50
NeoEster1−7.60
p < 0.001
6.15 p < 0.001−10.96 p = 0.0460.70
p = 0.004
<0.00161.356.50.19
Disclaimer/Publisher’s Note: The statements, opinions and data contained in all publications are solely those of the individual author(s) and contributor(s) and not of MDPI and/or the editor(s). MDPI and/or the editor(s) disclaim responsibility for any injury to people or property resulting from any ideas, methods, instructions or products referred to in the content.

